Abstract
In the mammalian auditory system, the medial nucleus of the trapezoid body and the lateral superior olive (MNTB-LSO system) contribute to binaural intensity processing and lateralization. Localization precision varies with the sound frequencies. As recency of common ancestry with human beings increases, primates have improved low-frequency sensitivity and reduced sensitivity to higher frequencies. The medial part of the MNTB is devoted to higher frequency processing. Thus, its high-frequency-dependent function is nearly lost in humans and its role in binaural processing as part of the contralateral pathway to the LSO remains questionable. Here, Nissl-stained sections of the superior olivary complex of man (Homo sapiens), bonobo (Pan paniscus), chimpanzee (Pan troglodytes), gorilla (Gorilla gorilla), orangutan (Pongo pygmaeus), gibbon (Hylobates lar), and macaque (Macaca fascicularis) were compared to reveal differences and coincidences. From chimpanzees to humans, the size of the LSO decreased, and the MNTB as a compact nucleus nearly disappears. From chimpanzees to humans, the LSO/MNTB ratio increases dramatically too, whereas the LSO/MSO ratio remains 1.1; a finding that probably corresponds to the phylogenetic proximity between the species.
Keywords: Primates, Monkeys, Superior olivary complex, Hearing frequencies
Introduction
In mammals the superior olivary complex (SOC) is composed of several brainstem nuclei, which are involved in the localization of a sound source (Heffner and Masterton 1990; Spangler et al. 1985; Thompson and Schofield 2000). The SOC is able to extract binaural time information from complex signals in the high-frequency as well as low-frequency range (Heffner 2004). The principle subdivisions of the SOC which are devoted to higher-frequency hearing are the LSO/MNTB (Caspary and Finlayson 1991; Cant and Hyson 1992; Glendenning and Masterton 1998) and those devoted to lower frequencies are represented by the MSO (Goldberg and Brown 1968; Warr 1982; Yin and Chan 1990; Smith et al. 1993; Spitzer and Semple 1995). The medial part of the MNTB, which can be selectively visualized by calcium-binding proteins and the lectin Wisteria floribunda (rat, Härtig et al. 2001 ; rhesus, Hilbig et al. 2007), represents its high frequency domain (cat, Caspary and Finlayson 1991; gerbil, Cant and Hyson 1992). Beil (2000) used the same markers and in addition synaptophysin, NOS, SMI 32, soluble guanylyl cyclase, PSD 95 and neurofilament 1 for his examinations at the auditory brainstem of humans and with all of these markers revealed some dispersed rudiments of the MNTB only. Since the lateral part of the MNTB does not contain or binds calbindin (ref. Härtig et al. 2001), we assume that the rudiments can be assigned to the low-frequent part.
Our intention is to confirm Beil’s results (Beil 2000) by examining the size of the MNTB during primate evolution. Tissues of higher primates which had been prepared under standardized conditions are not available due to ethical reasons. Thus, we decided to work with the material present in the Stephan collection which contains Nissl and Nissl-silver stained paraffin embedded sections of a wide range of species.
Methodically, work with material from a collection, which had to be prepared differently in regard to post-mortem delay, fixation and staining, is always afflicted with a greater standard deviation than a method that is planned and arranged under identical conditions. Therefore, the present work tries to describe a phylogenetic trend resulting in the nearly complete loss of a human MNTB.
The interpretation of changes within the central auditory systems are currently explained on a solely functional basis by Glendenning and Masterton (1998) who provided in their “Comparative Morphometry of mammalian central auditory systems” a most comprehensive overview including 53 species. The results in general revealed a more than 139-fold difference among the studied species with bats, kangaroo rats, marmosa opossums and Norway rats having the largest auditory systems relative to their brain size, whereas humans posses the smallest. Most other primate species which had been included exhibited also auditory system/brain size ratios below the sample average. Therefore, it has been suggested that the conditions observed in humans are the result of an expansion of the non-auditory parts of the brain rather than a reduction of the auditory system during evolution, because the overall subcortical central auditory system seemed to be highly conserved among mammals (Glendenning and Masterton 1998). However, one of the most interesting aspects of this comparison is that when focussing to certain subdivisions within the subcortical auditory system, each of the subdivisions seems to be changed independently among species which strongly suggests that these changes are related to species-specific functional adaptations to certain ecological requirements. Focussing towards the MNTB, the kangaroo rat possesses the largest in relation to the total size of its central subcortical auditory system (4.73%) followed by the little brown bat (3.76%), and the lowest was found in little rock wallaby (0.698%), while the brown lemur (2.31%) possesses a higher value than the guinea pig (1.44%) and human (0.807%).
Moore and Moore (1971) stated that the correlation of frequency range with the morphological size of the LSO and the MNTB suggests that the hypertrophy of these nuclei represents a specialisation in high-frequency reception. This led to the hypothesis that a reduced MNTB should coincide with a reduction of the LSO. In order to provide evidence for a phylogenetic trend within the arrangement of the SOC in primates, we tried to prove that hypothesis by comparing the SOC components of non-human primates as an extension of our previous studies, which had confirmed a well developed MNTB in macaques and the nearly complete loss of the MNTB in humans (Bazwinsky et al. 2003, 2005; Hilbig et al. 2007).
Here, Nissl-stained sections of the SOC of man, bonobo, chimpanzee, gorilla, orangutan, gibbon and macaque were compared to reveal differences and coincidences.
Materials and methods
Specimens and tissue preparation
Nissl stained sections of the SOC of bonobo, chimpanzee, gorilla, orangutan and gibbon from the Stephan’s and Zilles collection were used. Both the Stephan’s and the Zilles collection are based at the C. and O. Vogt Institute of Brain Research, Düsseldorf, Germany (Zilles and Rehkämper 1988; Stephan et al. 1988). Additionally, ten brainstems of adult female Macaca fascicularis (3 years old) were obtained from Covance, Münster, Germany, after euthanasia. Twelve human brainstems were obtained from non-neuropathological specimens (both sexes, 54–76 years old) from donors enlisted in the C. and O. Vogt Institutes body-donor program. All procedures were approved by the Ethical Committee of the Heinrich-Heine-University of Duesseldorf according to the Declaration of Helsinki.
The brainstems were fixed in a mixture of 4% paraformaldehyde and 15% saturated picric acid in sodium phosphate buffer, pH 7.4 (modified Zamboni‘s fixative) at 4°C under constant stirring for at least 1 week prior to further processing. The specimens were dissected and sectioned after removing the arachnoid and blood vessels from the surface. Each specimen was cut into blocks of 1 cm thickness in the frontal plane and stained according to Nissl. To compare the SOC organization of higher primates, especially in regard to the MNTB, further, available Nissl or Silver-Nissl impregnated sections of primate brains from the Stephan and Zilles collection were microscopically examined and photographed, including three brainstems of white-handed gibbon (Hylobates lar, three brainstems of orangutan (Pongo pygmaeus), one brainstem of gorilla (Gorilla gorilla), three brainstems of chimpanzee (Pan troglodytes) and two brainstems of bonobo (Pan paniscus).
Image acquisition and reconstruction of nuclei
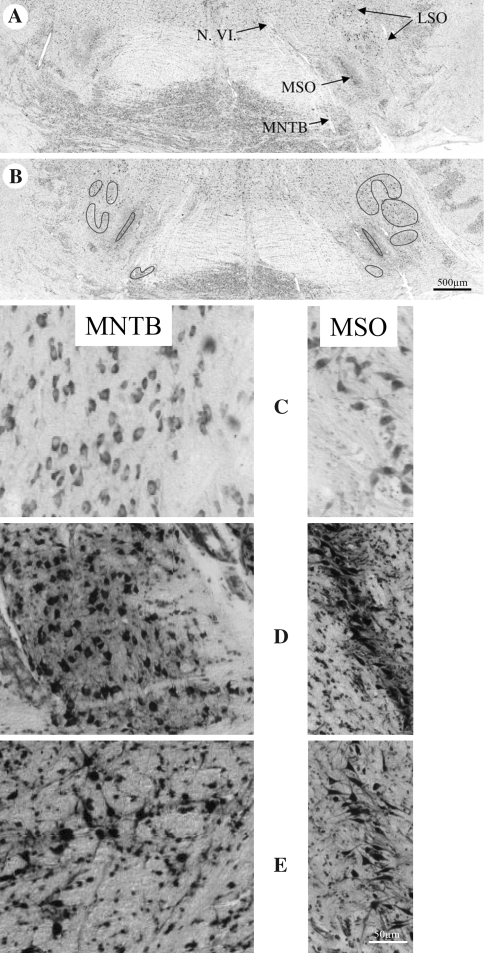
All of the investigated sections were 20-μm thick. The distance between the sections was 200 μm, except for the gorilla, for which they were 400 μm apart. The sections of the brainstems were mostly the same as investigated by Sherwood et al. (2005). The image acquisition was performed with the same equipment. In short, digital micrographs were obtained using an Olympus BH-2 microscope and a Nicon CoolPix 995 digital camera. All of the micrographs taken were changed from tif into jpg format to be compatible to the Archicad system for the interactive 3-D reconstruction. All histologically labeled structures required for reconstruction were vectorized and reconstructed in a virtual room, which was interactively visualized. 2-D reconstructions of the auditory brainstem nuclei were positioned in regard to the median fissure of the brainstem for the possibility to look at the structures from various points of view. The main orientation in the investigated brainstems was given by the roots of the facial nerve (N.VII) lateral of the nuclei of the SOC and the root of the abducent nerve (N.VI) which divided the MNTB. For example, Fig. 1 displays those landmarks in the orangutan brainstem. The dark lines in Fig. 1b represent the overlays.
Fig. 1.
Auditory brainstem sections of the orangutan. a Nuclei of the superior olivary complex (SOC). Lateral (LSO) and medial superior olive (MSO), medial nucleus of the trapezoid body (MNTB). Root of the abducent nerve (N.VI). b The dark lines give the positions of the overlays. Higher magnifications of the MNTB and the MSO in the gorilla (c), the orangutan (d) and the bonobo (e)
Measurement of nuclear volumes
The overlays interactively produced by the Archicad system (for example see Fig. 1b) were scanned to the videoplan system (Kontron, Munich, Germany) for the estimation of the nuclear volumes. A total of 268 sections were used for reconstruction and volumetry.
The dendritic trees of the neurons in the MSO, as revealed in Silver-Nissl impregnated sections, were additionally labeled by fine dotted lines (and by open circles in Fig. 2) for the vectorization.
Fig. 2.
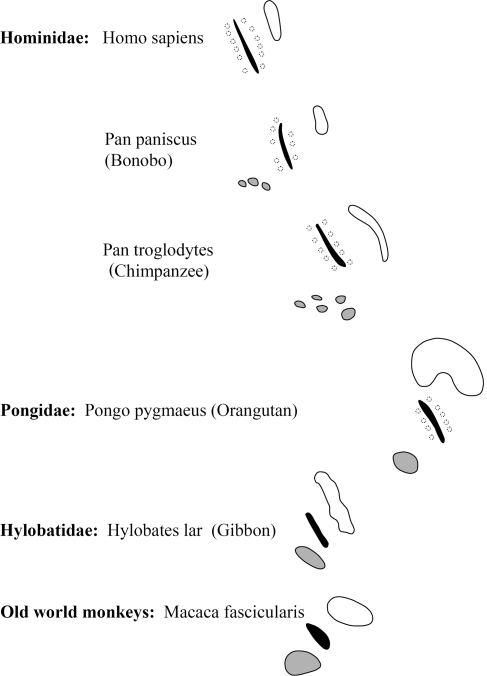
Examples of single section overlays for 3-D reconstruction. Grey MNTB, black MSO (somata), dotted line total MSO, white LSO
The total volume of a nucleus was obtained by multiplying the sum of each surface area by section thickness and the intervals between the sections.
Cell counts
The number of cells of the SOC nuclei including MNTB was determined in one series of sections for each species. All measurements were carried out interactively with the aid of Kontron Image Analysis (Zeiss, Germany) as described by Hilbig et al. (2001). Regarding the varying size and structure of the nuclei we counted, the neurons in each section and area which was available and surrounded areas for the 3D-reconstruction. From these data the approximate total number of cells was calculated for the whole volume. To calculate the individual error of the investigator using the interactive system, we measured one section 10 times. The individual standard deviation was <5.9%. The internal statistics programm of the Image Analysis provided the data for the minimum, the maximum and the average measurements, the standard deviation, the variation and the sum of all data within the file.
Results
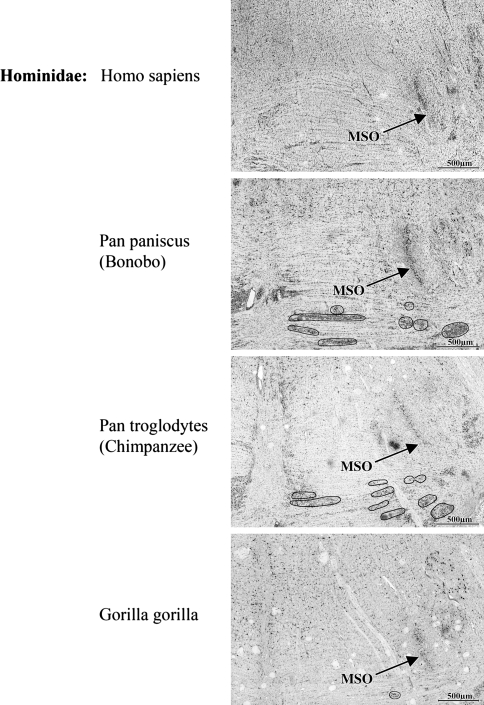
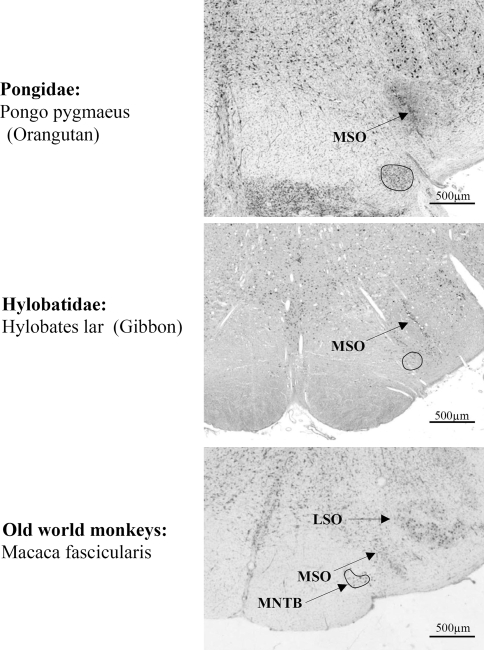
Within the Hominidae (i.e. the African apes: gorillas, chimpanzees, and bonobos; and humans), there is a successive loss of the MNTB from gorilla to man in correlation with decreasing extensions of the LSO. The LSO decreased more slowly than the MNTB, which was almost lost (Figs. 2, 3, 4, 5, 6, 7; Table 1), since only very few widely dispersed neurons were detectable.
Fig. 3.
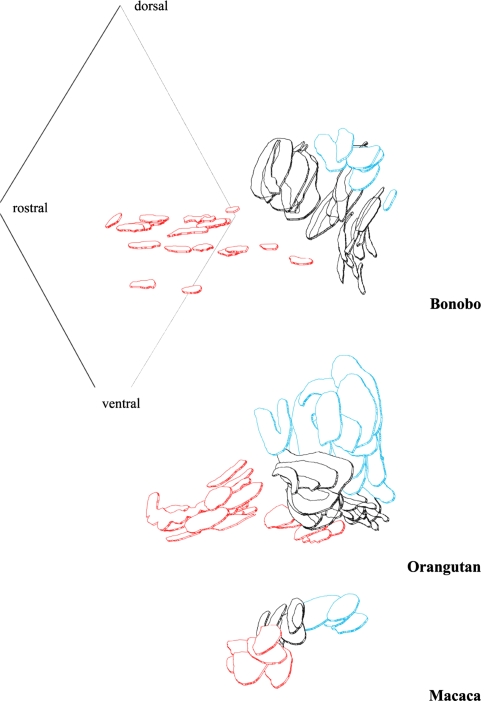
Frontal aspect of 3-D reconstructions with the MNTB marked in red, the MSO in black, and the LSO in blue. The rostro-caudal-dorso-ventral plane labels the idealized median line of the auditory brainstem. Examples were given for three species. Both the MNTB and, to a smaller extent, the LSO decreased from macaque to bonobo despite the increasing brain sizes. The MNTB separated from the MSO and the former compact MNTB decayed during phylogeny. The orangutan is the link between the condensed SOC of the macaca and the split one of the bonobo. The pearl-like pattern of bonobo MNTB pointed to that development. MNTB, medial nucleus of the trapezoid body; MSO/LSO, medial/lateral superior olive; SOC, superior olivary complex
Fig. 4.
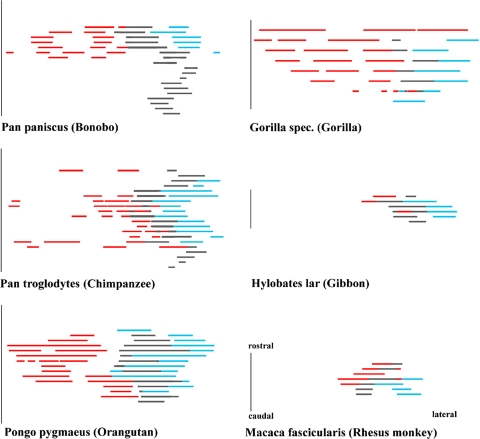
Dorsal aspects of 3-D reconstructions of the SOC (MNTB red, MSO black, LSO blue) revealing the lateral distance of the MNTB from the median line of the auditory brainstem (line at left) and the rostro-caudal extension of the SOC
Fig. 5.
Comparison of the superior olivary complex of primates, Nissl and Silver-Nissl stainings for the bonobo and overlays for the MNTB
Fig. 6.
Comparison of the superior olivary complex continuing Fig. 5
Fig. 7.
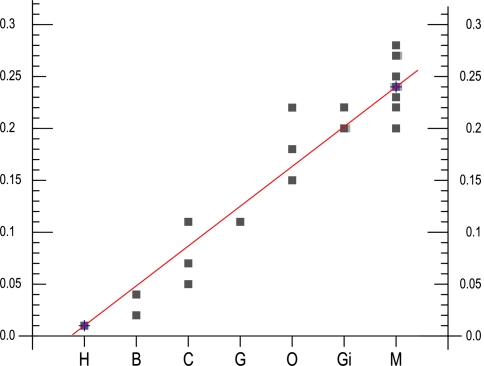
Free-hand regression line (Holman 1969) revealing the changing volume of the MNTB of men (H), bonobo (B), chimpanzee (C), gorilla (G), orangutan (O), gibbon (Gi) and macaque (M)
Table 1.
Sizes of the nuclei of the SOC (mm3) and the LSO/MNTB and LSO/MSO ratios
| MNTB | LSO | MSO | LSO/MNTB | LSO/MSO | |
|---|---|---|---|---|---|
| Human | 0.01 | 3.01 | 2.75 | 301 | 1.1 |
| Bonobo | 0.03 | 2.99 | 2.51 | 100 | 1.1 |
| Chimpanzee | 0.08 | 3.28 | 2.97 | 41 | 1.1 |
| Gorilla | 0.11 | 4.86 | 2.93 | 44 | 1.7 |
| Orangutan | 0.18 | 4.98 | 3.22 | 28 | 1.6 |
| Gibbon | 0.21 | 0.49 | 0.33 | 2.3 | 1.5 |
| Macaca | 0.24 | 0.55 | 0.29 | 2.3 | 1.9 |
Of all the nuclei comprising the SOC, the MSO was the most clearly delineated one. The structure of the MSO seemed to be stable not only between the hominids, but also in all of the investigated non-human primates (Figs. 2, 3, 4, 5, 6). From macaque to man, the arrangement of the cell somata in the MSO tended from a three dimensional organized structure to a more and more stalked or sheeted structure resulting in a line-shaped MSO with laterally elongated dendrites (Fig. 1d–e).
With exception of man, bonobo and chimpanzee, all species showed a well developed MNTB-LSO system. The SOC of the gibbon consisted of a smaller MNTB and the LSO was already slightly reduced when compared to the macaque. These reductions of MNTB and LSO went hand in hand with an elongation of the MSO in dorsal direction. These changes progressively continued in apes and as a result of that trend the MNTB was almost totally lost in man, though a small LSO remained. The regression line showing the decrease for the MNTB volume in all investigated species is presented in Fig. 7.
These results were supported also by the number of neurons calculated for the SOC components (Table 2). The ratio LSO/MNTB, reflecting the correlation of the size of those nuclei, increased dramatically, reaching its highest value in the brain of man. The largest numerical increase for the ratio of LSO to MNTB was revealed between bonobo and man (Table 1). Chimpanzee, gorilla and orangutan showed a comparable LSO/MNTB ratio among each other, which was approximately 20-fold higher than that found for gibbon and macaque (Table 1). Compared to the LSO/MNTB ratio a much more clear cut difference was revealed for the ratio of LSO to MSO for chimpanzee, bonobo and man (1.1) compared to gorilla, orangutan, gibbon and macaque (≥1.5; Table 1). It means that the LSO/MSO ratio decreased during the primate phylogeny from about 2 to about 1 depicting a relative increase of the MSO. This increase is in part due to the rostro-caudal extensions of the MSO (Fig. 4).
Table 2.
Numbers of neurons in the nuclei of the superior olivary complex
| MNTB | LSO | MSO | LSO/MNTB | LSO/MSO | |
|---|---|---|---|---|---|
| Human | – | 1,980 | 3,891 | 0.51 | |
| Bonobo | 976 | 3,054 | 4,006 | 3.1 | 0.76 |
| Chimpanzee | 1,180 | 3,116 | 4,489 | 2.6 | 0.69 |
| Gorilla | 1,800 | 5,080 | 4,614 | 2.8 | 1.10 |
| Orangutan | 3,104 | 7,113 | 5,231 | 2.3 | 1.36 |
| Gibbon | 2,211 | 2,049 | 3,346 | 0.9 | 0.61 |
| Macaca | 2,543 | 2,630 | 2,899 | 1.0 | 0.90 |
It is however noteworthy to mention that among the great apes, both the gorilla and the orangutan showed a SOC containing a comparatively large MNTB, a further elongated MSO and a larger LSO, generally speaking much more similar in shape to that of the rat (Paxinos et al. 1999). In addition, the MNTB of the orangutan consisted of a compact part and a part formed by more dispersed clusters of cells (Figs. 3, 4). In the dorsal view (Fig. 4), the largest extension of the SOC in medio-lateral direction was found for the gorilla, which may be correlated to the size of its head. The extension of the SOC in its rostral-caudal aspects could only be roughly estimated for the gorilla due to the wider distance between the available sections as outlined above. On average the rostro-caudal extensions for the SOC’s of hominids were comparatively similar from about 3,400 until about 3,800 μm as revealed in Fig. 4.
However, the size as well as the position of its subdivisions changed dramatically. With the progressive reduction of the MNTB it became much closer positioned to the median fissure. Comparing the macaque and the bonobo, in the macaque the LSO is positioned much more caudally in relation to the MNTB, whereas in bonobo LSO and the remnants of the MNTB are placed at the same level along the rostro-caudal axis. The MSO remained more or less unchanged and shows the whole extension of the SOC along the rostro-caudal axis. Within the SOC, and in comparison to the rostro-caudal dimension of the MSO and MNTB, the LSO of hominids had been shifted to a more rostral position because in hominids the MSO extends these subdivisions in caudal direction. This shift of the MNTB and LSO along the rostro-caudal axis becomes especially obvious by comparing the chimpanzee and bonobo brains (Fig. 4).
In addition, the nuclei of the SOC become more separated from each other in hominids (Figs. 3, 4, 5, 6). As shown in the dorsal view of the reconstructed SOC of the macaque MNTB and MSO as well as MSO and LSO lie closely together but a separation between MSO and LSO is visible in the rostral aspects of the auditory brainstem in orangutan, whereas a more complete and wider separation of MNTB and MSO as well as LSO and MSO becomes evident for the bonobo.
In summary, a progressive reduction of the MNTB and LSO as well as a wider separation of the subdivisions of the SOC was observed during phylogeny among the studied primate species. In addition, LSO and MNTB in hominids became positioned much more adjacent to the rostro-medial portion of the MSO in hominids.
Discussion
Our results showed in comparison to macaque, a clear reduction of the MNTB-LSO system and a dramatic reduction of the structure of the MNTB as a compact nucleus in man within the auditory brainstem. Moore and Moore stated for the MNTB neurons that “the number of cells present, if any, is too small to allow reliable identification of counts, and no ratio could be calculated.” (Moore and Moore 1971, footnote of Table 1), and this was largely confirmed by Richter et al. (1983). Koutcherov et al. (2004) described a small nucleus of the trapezoid body which contains only a few neurons without referring to a medial nucleus; they also proposed human homologs for the dorsal periolivary, medioventral periolivary and lateroventral periolivary nuclei of the rat and in addition designated a medial periolivary nucleus. Recently, Kulesza (2008) investigated the human periolivary nuclei and delineated a well established human MNTB in Nissl-stained sections which contains a surprisingly high number of cells. However, Kulesza (2008) located this cell group at a position which could be attributed to the medial periolivary nucleus or medioventral periolivary nucleus, a position in which cells have been also noted by Bazwinsky et al. (2003) by the use of immunohistochemistry. However, the clear designation of these neuronal cells as MNTB is a matter of discussion and would not be supported by the current literature (for a summary see Webster and Garey 1990; Moore and Linthicum 2004). Especially Moore and Linthicum (2004) point to the dramatic reduction of this nucleus in man and they refer to a small trapezoid nucleus but no longer to an MNTB.
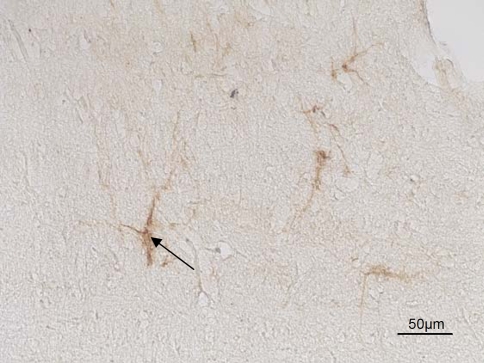
By the use of W. floribunda agglutinin binding to perineuronal nets, Beil (2000) found only very few neurons in the position of the human MNTB (Fig. 8), while calcium binding proteins revealed even lower numbers. Especially the wider distances (filled by white matter) between the few remaining neurons may be indicative for an increase in afferent input to these few neurons which would be in agreement with a strongly reduced nucleus containing a few dispersed large neurons (Koutcherov et al. 2004; Moore and Linthicum 2004). It should be emphasized that these authors refer to a nucleus of the trapezoid body without referring to a distinguishable medial nucleus as known from lower primates in which it is confined to high frequency processing. In our opinion, it remains questionable whether this issue could be settled without further clarification by conducting tracing studies as also suggested by Kulesza (2008). Implying the functional consequences for the understanding of auditory information processing in man, we would rather take a more conservative approach and follow the anatomical and functional description and discussion provided by Moore and Linthicum (2004).
Fig. 8.
Neurons of the human MNTB revealed by Wisteria floribunda agglutinin binding sites (Beil 2000)
Our observation of such a dramatic reduction of MNTB neurons is also supported by our cell counts (Table 2). There are also differences between the numbers of neurons calculated in our study in comparison to other studies for the MSO (Moore and Moore 1971; Harrison and Irving 1966). The later may be in part due to the fact that we applied very conservative criteria when counting neurons in order to avoid inclusion of glial cells. But we would like to stress the fact, that Moore and Moore (1971) described a complete loss of the MNTB in the same study.
Referring to the size ranking for the volumes of SOC nuclei by Glendenning and Masterton (1998), the size of the human MNTB and that of the LSO got lower ranking numbers than those for the monkey, whereas the size of the MSO of human and monkey were at neighbouring ranking places. The high-frequency limit of the macaque is 42 kHz, with best frequency at 1 kHz and that of humans is 17.6 kHz, with best frequency at 4 kHz (Heffner 2004). Thus, here is an explanation for the different sizes of the SOC nuclei in macaque and man. Lacking the ability to hear higher frequencies, there is no need to analyse such high frequency components. Moore (2000) provided as a possible explanation that “it could be that the entire human LSO is homologous to the low-frequency end of the cat LSO, a subdivision of the nucleus that receives only sparse input from the MNTB”. That opinion was supported by our findings of decreasing sizes of the LSO. Kulesza (2007) described for both the human MSO and LSO a geometric arrangement that is suggestive of isofrequency laminae. Moore (1987b) pointed to another explanation. The LSO is extremely large in bats which have an extended range of high-frequency hearing, but is small in mammals with limited hearing at both, low and high, frequencies. Thus, the size of the LSO correlates with the range of usable auditory frequencies (Glendenning et al. 1985; Moore and Moore 1971; Moore 1987a, b). It is possible that in primates, and especially in humans, the role of the SOC in sound localization decreases compared to the increasing role of the inferior colliculus (McAlpine and Grothe 2003) and the superior colliculus in spatial orientation (Hilbig et al. 1999). In the successive relays of the auditory pathway, the response characteristics of the neurons are more and more specialized to one frequency or to one type of complex sound, to one interaural intensity or time difference. That specialisation requires a restriction in the frequency spectrum. Besides these functional auditory adaptations, which seem to have an important influence on the shape, size and connections within the auditory system of higher vertebrates, our morphological data clearly coincide and support the position of the studied primates within the phylogenetic tree since chimpanzee, bonobo and man, which possess similar LSO/MSO ratios of 1.1 emerged together from one common ancestor (Bailey et al. 1992; Byrne 1995), whereas all other taxa branched off much earlier (Goldman et al. 1987). And those taxa such as gibbon and macaque which possessed the lowest values for their LSO/MNTB ratios belong to even older branches.
Grothe (2000) and Neuweiler (Grothe and Neuweiler 2000) studied the function of the MSO in small mammals in order to reveal the discrepancies discussed above. According to their data at that level, the MSO provides the basic auditory functions, which remain conserved during phylogeny “the binaural cooperation causing facilitation due to binaural excitation. Only later in evolution, with the advent of larger mammals, did interaural distances, and hence interaural time differences, became large enough to be used as cues for sound localization of low-frequency stimuli” (Grothe and Neuweiler 2000). “From this point of view, the apparent contradictions concerning the MSO in small mammals disappear” (Grothe 2000). All these results support our hypothesis that a function-related phylogenetic trend had occurred in primates which resulted in the decrease of a compact nucleus and the dispersion of the MNTB of bonobos and humans. Therefore, the nuclei of the SOC may be one example of mosaic evolution (Simpson 1959; Mayr 1963) in mammals which occurs under various evolutionary pressures for the brain in other species as well (Barton and Harvey 2000; Clark et al. 2001).
Especially these wider distances (filled by white matter) between the few remaining neurons indicates an increase in afferent input and connectivity.
Acknowledgments
The authors thank A. Rast and C. Opfermann-Rüngeler for excellent technical assistance and artwork and Drs. K. Zilles; H. D. Frahm and A. Schleicher for their support as well as A. De Sousa and N. Palomero-Gallagher, Research Center, Jülich, for corrections and helpful comments.
Open Access This article is distributed under the terms of the Creative Commons Attribution Noncommercial License which permits any noncommercial use, distribution, and reproduction in any medium, provided the original author(s) and source are credited.
References
- Bailey WJ, Hayasaka K, Skinner CG (1992) Re-examination of the African hominoid trichotomy with additional sequences from the primate ß-globin gene cluster. Mol Phylogenet Evol 1:97–135. doi:10.1016/1055-7903(92)90024-B [DOI] [PubMed]
- Barton G, Harvey P (2000) Mosaic evolution of brain structure in mammals. Nature 405:1055–1058. doi:10.1038/35016580 [DOI] [PubMed]
- Bazwinsky I, Hilbig H, Bidmon HJ, Rübsamen R (2003) Characterization of the human superior olivary complex by calcium binding proteins and neurofilament H (SMI-32). J Comp Neurol 456:292–303. doi:10.1002/cne.10526 [DOI] [PubMed]
- Bazwinsky I, Bidmon HJ, Zilles K, Hilbig H (2005) Characterization of the rhesus monkey superior olivary complex by calcium binding proteins and synaptophysin. J Anat 207:745–761. doi:10.1111/j.1469-7580.2005.00491.x [DOI] [PMC free article] [PubMed]
- Beil B (2000) Charakterisierung des humanen oberen Olivenkomplexes mittels verschiedener immunhistochemischer Marker. Doctoral thesis, University Leipzig
- Byrne RW (1995) The thinking ape. University Press, Oxford
- Cant NB, Hyson RL (1992) Projections from the lateral nucleus of the trapezoid body to the medial superior olivary nucleus in the gerbil. Hear Res 58:26–34. doi:10.1016/0378-5955(92)90005-8 [DOI] [PubMed]
- Caspary DM, Finlayson PG (1991) Superior olivary complex: functional neuropharmacology of the principal cell types. In: Altschuler RA, Bobbin RP, Clopton BM, Hoffmann DW (eds) Neurobiology of hearing: the central auditory system. Raven Press, New York, pp 141–161
- Clark DA, Mitra PP, Wang SS-H (2001) Scalable architecture in mammalian brains. Nature 411:189–193. doi:10.1038/35075564 [DOI] [PubMed]
- Glendenning KK, Masterton RB (1998) Comparative morphometry of mammalian central auditory systems: variation in nuclei and form of the ascending system. Brain Res Evol 51:59–89. doi:10.1159/000006530 [DOI] [PubMed]
- Glendenning KK, Hutson KA, Nudo RJ, Masterton RB (1985) Acoustic chiasm II: anatomical basis of binaurality in lateral superior olive of cat. J Comp Neurol 232:261–285. doi:10.1002/cne.902320210 [DOI] [PubMed]
- Goldberg JM, Brown PB (1968) Functional organization of the dog superior olivary complex: an anatomical and electrophysiological study. J Neurophysiol 31:639–656 [DOI] [PubMed]
- Goldman D, Giri PR, O’Brien SJ (1987) A molecular phylogeny of the hominoid primates as indicated by two-dimensional protein electrophoresis. Proc Natl Acad Sci USA 84:3307–3311. doi:10.1073/pnas.84.10.3307 [DOI] [PMC free article] [PubMed]
- Grothe B (2000) The evolution of temporal processing in the medial superior olive, an auditory brainstem structure. Prog Neurobiol 61:581–610. doi:10.1016/S0301-0082(99)00068-4 [DOI] [PubMed]
- Grothe B, Neuweiler G (2000) The function of the medial superior olive in small mammals: temporal receptive fields in auditory analysis. J Comp Physiol 186:413–423. doi:10.1007/s003590050441 [DOI] [PubMed]
- Harrison JM, Irving R (1966) Visual and nonvisual auditory systems in mammals. Anatomical evidence indicates two kinds of auditory pathways and suggests two kinds of hearing in mammals. Science 154:738–743. doi:10.1126/science.154.3750.738 [DOI] [PubMed]
- Härtig W, Singer A, Grosche J, Brauer K, Ottersen OP, Brückner G (2001) Perineuronal nets in the rat medial nucleus of the trapezoid body surround neurons immunoreactive for various amino acids, calcium-binding proteins and the potassium channel subunit Kv3.1b. Brain Res 899:123–133. doi:10.1016/S0006-8993(01)02211-9 [DOI] [PubMed]
- Heffner RS (2004) Primate hearing from a mammalian perspective. Anat Rec 281A:1111–1122. doi:10.1002/ar.a.20117 [DOI] [PubMed]
- Heffner RS, Masterton RB (1990) Sound localization in mammals: brain-stem mechanisms. In: Berkley MA, Stebbins WC (eds) Comparative perception, vol I. Wiley, New York, pp 285–314
- Hilbig H, Bidmon HJ, Zilles K, Busecke K (1999) Neuronal and glial structures of the superficial layers of the human superior colliculus. Anat Embryol (Berl) 200:103–115. doi:10.1007/s004290050264 [DOI] [PubMed]
- Hilbig H, Bidmon HJ, Blohm U, Zilles K (2001) Wisteria floribunda agglutinin labeling patterns in the human cortex: a tool for revealing areal borders and subdivisions in parallel with immunocytochemistry. Anat Embryol (Berl) 203:45–52. doi:10.1007/s004290000135 [DOI] [PubMed]
- Hilbig H, Nowack S, Boeckler K, Bidmon HJ, Zilles K (2007) Characterization of neuronal subsets surrounded by perineuronal nets in the rhesus auditory brainstem. J Anat 210:507–517. doi:10.1111/j.1469-7580.2007.00713.x [DOI] [PMC free article] [PubMed]
- Holman HH (1969) Biological research methods. Oliver and Boyd, Edinburgh
- Koutcherov Y, Huang X-F, Halliday G, Paxinos G (2004) Organization of human brain stem nuclei. In: Paxinos G, Mai JK (eds) The human nervous system. Elsevier Academic Press, San Diego, pp 267–320
- Kulesza RJ Jr (2007) Cytoarchitecture of the human superior olivary complex: medial and lateral superior olive. Hear Res 225:80–90. doi:10.1016/j.heares.2006.12.006 [DOI] [PubMed]
- Kulesza RJ Jr (2008) Cytoarchitecture of the human superior olivary complex: nuclei of the trapezoid body and tier. Hear Res 241:52–63. doi:10.1016/j.heares.2008.04.010 [DOI] [PubMed]
- Mayr E (1963) Animal species and evolution. Belknap Press, Harvard University Press, Cambridge
- McAlpine D, Grothe B (2003) Sound localization and delay lines—do mammals fit the model? Trends Neurosci 26:347–350. doi:10.1016/S0166-2236(03)00140-1 [DOI] [PubMed]
- Moore JK (1987a) The human auditory brain stem: a comparative view. Hear Res 29:1–32. doi:10.1016/0378-5955(87)90202-4 [DOI] [PubMed]
- Moore JK (1987b) The human auditory brain stem as a generator of auditory evoked potentials. Hear Res 29:33–43. doi:10.1016/0378-5955(87)90203-6 [DOI] [PubMed]
- Moore JK (2000) Organization of the human superior olivary complex. Microsc Res Tech 51:403–412. doi:10.1002/1097-0029(20001115)51:4%3c403::AID-JEMT8%3e3.0.CO;2-Q [DOI] [PubMed]
- Moore JK, Linthicum FH (2004) Auditory system. In: Paxinos G, Mai JK (eds) The human nervous system. Elsevier Academic Press, San Diego, pp 1242–1279
- Moore JK, Moore RY (1971) A comparative study of the superior olivary complex in the primate brain. Folia Primatol 16:35–51. doi:10.1159/000155390 [DOI] [PubMed]
- Paxinos G, Carrive P, Wang H, Wang PY (1999) Chemoarchitectonic atlas of the rat brainstem. Academic Press, San Diego
- Richter EA, Norris EB, Fullerton BC, Levine RA, Kiang NYS (1983) Is there a medial nucleus of the trapezoid body in humans. Am J Anat 68:157–166. doi:10.1002/aja.1001680205 [DOI] [PubMed]
- Sherwood CC, Hof PR, Holloway RL, Semendeferi K, Gannon PJ, Frahm HD, Zilles K (2005) Evolution of the brainstem orofacial motor system in primates: a comparative study of trigeminal, facial, and hypoglossal nuclei. J Hum Evol 48:45–84. doi:10.1016/j.jhevol.2004.10.003 [DOI] [PubMed]
- Simpson GG (1959) Mesozoic mammals and the polyphyletic origin of mammals. Evol Int J Org Evol 13:405–414. doi:10.2307/2406116
- Smith PH, Joris RX, Banks MI, Yin CT (1993) Responses of cochlear nucleus cells and projections of their axons. In: Merchan MA, Juiz JM, Godfrey DA, Mugnaini E (eds) The mammalian cochlear nuclei, organization and function. Plenum Press, New York, pp 349–360
- Spangler KM, Warr WB, Henkel CK (1985) The projections of principal cells of the medial nucleus of the trapezoid body in the cat. J Comp Neurol 238:249–262. doi:10.1002/cne.902380302 [DOI] [PubMed]
- Spitzer MW, Semple MN (1995) Neurons sensitive to interaural phase disparity in gerbil superior olive: diverse monaural and temporal response properties. J Neurophysiol 73:1668–1690 [DOI] [PubMed]
- Stephan H, Baron G, Frahm HD (1988) Comparative size of brains and brain components. In: Steklis HD, Erwin J (eds) Comparative primate biology, vol 4, neurosciences. Alan R Liss, New York, pp 1–38
- Thompson AM, Schofield BR (2000) Afferent projections of the superior olivary complex. Microsc Res Tech 51:330–354. doi:10.1002/1097-0029(20001115)51:4%3c330::AID-JEMT4%3e3.0.CO;2-X [DOI] [PubMed]
- Warr WB (1982) The organization of olivocochlear efferent systems. In: Webster DB, Popper AN, Fay RR (eds) The mammalian auditory pathway: neuroanatomy. Springer, New York, pp 410–448
- Webster WR, Garey LJ (1990) Auditory system. In: Paxinos G (ed) The human nervous system. Academic Press, San Diego, pp 889–944
- Yin TC, Chan JC (1990) Interaural time sensitivity in medial superior olive of cat. J Neurophysiol 64:465–488 [DOI] [PubMed]
- Zilles K, Rehkämper G (1988) The brain, with special reference to the telencephalon. In: Schwartz J (ed) Biology of the orang-utan. Oxford University Press, New York, pp 157–176


