Abstract
Point mutations in pore-lining S6 segments of CaV1.2 shift the voltage dependence of activation into the hyperpolarizing direction and significantly decelerate current activation and deactivation. Here, we analyze theses changes in channel gating in terms of a circular four-state model accounting for an activation R–A–O and a deactivation O–D–R pathway. Transitions between resting-closed (R) and activated-closed (A) states (rate constants x(V) and y(V)) and open (O) and deactivated-open (D) states (u(V) and w(V)) describe voltage-dependent sensor movements. Voltage-independent pore openings and closures during activation (A–O) and deactivation (D–R) are described by rate constants α and β, and γ and δ, respectively. Rate constants were determined for 16-channel constructs assuming that pore mutations in IIS6 do not affect the activating transition of the voltage-sensing machinery (x(V) and y(V)). Estimated model parameters of 15 CaV1.2 constructs well describe the activation and deactivation processes. Voltage dependence of the “pore-releasing” sensor movement ((x(V)) was much weaker than the voltage dependence of “pore-locking” sensor movement (y(V)). Our data suggest that changes in membrane voltage are more efficient in closing than in opening CaV1.2. The model failed to reproduce current kinetics of mutation A780P that was, however, accurately fitted with individually adjusted x(V) and y(V). We speculate that structural changes induced by a proline substitution in this position may disturb the voltage-sensing domain.
INTRODUCTION
The pore-forming α1 subunits of Ca channels (CaV) are composed of four homologous domains (I–IV) formed by six transmembrane segments (S1–S6) that are linked together on a single polypeptide (Catterall, 2000). In analogy to potassium channels (Doyle et al., 1998; Zhou et al., 2001; Jiang et al., 2002; Long et al., 2005; Swartz, 2005; Tombola et al., 2006), it is assumed that S6 segments line the channel pore, with an S6 bundle-crossing region in the lower third forming the channel gate. Unlike potassium channels, which are composed of four identical units, CaV are asymmetric. None of the four S6 segments carries a PXP motif like Shaker, and a conserved G89 in MthK (Jiang et al., 2003) is present only in segments IS6 and IIS6.
We have recently identified a motif of hydrophobic residues in the lower third of segment IIS6 that is conserved in high voltage–activated CaV1.2 and plays an important role in activation gating (779–782: LAIA; see Hemara-Wahanui et al., 2005; Hohaus et al., 2005). Replacement of these IIS6 residues by amino acids of different hydrophobicity, size, and polarity induced pronounced changes in channel gating, such as shifts in the voltage dependence of activation, slow activation kinetics near the footstep of the activation curve, slow deactivation at all potentials, and decreased inactivation (for review see Hering et al., 2008 and Stary et al., 2008). In continuation of these studies, we substituted residues in the lower third of segment IIS6 by flexible glycines. In line with our previous data, these mutations induced remarkable shifts of the activation curve to hyperpolarized voltages and characteristic slowing of the activation and deactivation kinetics. Shifts of the activation curve can be interpreted as destabilization of the closed state and/or as stabilization of the open-channel conformation (Yifrach and MacKinnon, 2002; Zhao et al., 2004).
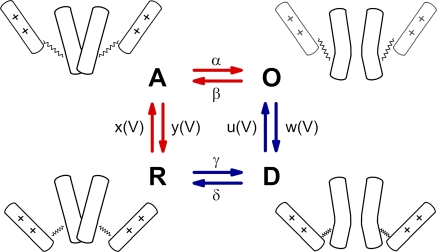
To distinguish between these possibilities, we analyzed changes in steady-state activation and current kinetics in terms of a four-state model where activation and deactivation may occur predominantly via different pathways (see Fig. 1). Under the assumption that pore mutations in IIS6 do not affect the activating transition of the voltage-sensing machinery (x(V), y(V)) (Yifrach and MacKinnon, 2002), rate constants for 16 CaV1.2 constructs were estimated by means of an inverse problem approach (see Engl et al., 1996). Satisfactory fits for 15 out of 16 channel constructs were achieved assuming a single pair of x(V) and y(V). These results suggest that most of the analyzed structural changes in IIS6 do not significantly affect the voltage-sensing domain. Fitting the kinetics of mutant A780P required individual adjustment of x(V) and y(V), suggesting that stiff helix kinking in this position may affect voltage sensor movements.
Figure 1.
Schematic representation of CaV1.2 state transitions during activation. Activation gating assumed to be determined by two functionally separate processes: a voltage-sensing mechanism (++) and the conducting pore. Each functional unit can dwell in two states: the voltage sensor in the resting (down) and activated (up) states, and the pore in the open or closed states. The entire molecule therefore dwells in 2 × 2 = 4 states: R, pore is closed and voltage-sensing mechanism locks the pore; A, voltage-sensing mechanism is activated and releases the pore, which, however, remains closed; O, the pore is open; D, the deactivated voltage-sensing mechanism is in the down position while the pore is still open. The activation pathway is marked by red and the deactivation pathway by blue arrows. Rate constants of the pore opening and closure (α, β, γ, and δ) are assumed to be independent of the voltage. Rate constants of voltage-sensing mechanism (x, y, u, and w) are voltage dependent.
MATERIALS AND METHODS
Experimental procedures
Mutagenesis.
The CaV1.2 α1 subunit coding sequence (GenBank accession no. X15539) in-frame 3′ to the coding region of a modified green fluorescent protein was provided by M. Grabner (Innsbruck Medical University, Innsbruck, Austria) (Grabner et al., 1998). For electrophysiological studies, we used the plasmid lacking the green fluorescent protein tag. Glycine mutations (A780G, I781G, A782G, V783G, and D784G) in segment IIS6 of the CaV1.2 α1 subunit were introduced by the “gene SOEing” technique (Horton et al., 1989). The mutated fragments were cloned into a BamHI-AflII cassette (nt 1,265 and 2,689; numbering according to the CaV1.2 α1 subunit coding sequence). All constructs were checked by restriction site mapping and sequencing.
Cell culture and transient transfection.
Human embryonic kidney tsA-201 cells were grown at 5% CO2 and 37°C to 80% confluence in Dulbecco’s modified Eagle’s/F-12 medium supplemented with 10% (vol/vol) fetal calf serum and 100 U/ml penicillin/streptomycin. Cells were split using trypsin/EDTA and plated on 35-mm Petri dishes (Falcon) at 30–50% confluence ∼16 h before transfection. Subsequently, tsA-201 cells were cotransfected with cDNAs encoding wild-type or mutant CaV1.2 α1 subunits with auxiliary β1a as well as α2-δ1 subunits. Transfection of tsA-201 cells was done using the FUGENE6 Transfection Reagent (Roche) according to standard protocols.
Ionic current recordings and data acquisition.
Barium currents (IBa) through voltage-gated Ca2+ channels were recorded at 22–25°C using the patch clamp technique (Hamill et al., 1981) with an Axopatch 200A patch clamp amplifier (MDS Analytical Technologies) 36–48 h after transfection. The extracellular bath solution contained 5 mM BaCl2, 1 mM MgCl2, 10 mM HEPES, and 140 mM choline-Cl, titrated to pH 7.4 with methanesulfonic acid. Patch pipettes with resistances of 1 to 4 MΩ were made from borosilicate glass (Clark Electromedical Instruments) and filled with pipette solution containing 145 mM CsCl, 3 mM MgCl2, 10 mM HEPES, and 10 mM EGTA, titrated to pH 7.25 with CsOH. All data were digitized using a DIGIDATA 1200 interface (MDS Analytical Technologies), smoothed by means of a four-pole Bessel filter and stored on computer hard disk. 100-ms current traces were sampled at 10 kHz and filtered at 5 kHz. For the steady-state inactivation protocol, currents were sampled at 1 kHz and filtered at 0.5 kHz, and tail currents were sampled at 50 kHz and filtered at 10 kHz. Leak currents were subtracted digitally using average values of scaled leakage currents elicited by a 10-mV hyperpolarizing pulse or electronically by means of an Axopatch 200 amplifier (MDS Analytical Technologies). Capacity currents were not subtracted. When the pipettes were filled with pipette solution, their input resistance ranged between 1 and 4 MΩ. The mean cell capacity was 31 ± 4 pF (n = 15). The mean series resistance was 4.9 ± 2.1 MΩ. It was compensated (60–85% compensation) by the following procedure: the depth of the positive feedback was gradually increased until oscillations (small overcompensation) appear. Even in large cells, the time constant of the capacity current (τcapacity) did not exceed ≈0.25 ms (4 MΩ * 60 pF = 240 µs). The early current phase was excluded from data processing (at least 3 * τcapacity ≈ 0.75 ms), and hyperpolarizing voltages <−100 mV were not applied.
Data processing
The pClamp software package (version 7.0; MDS Analytical Technologies) was used for data acquisition and preliminary analysis. Microcal Origin 5.0 was used for fitting the steady-state activation (m∞) curves and time constants of current activation and deactivation. The voltage dependence of activation was determined from I-V curves that were fitted according to the following modified Boltzmann distribution:
where V is membrane potential, I is peak current, Gmax is maximum membrane conductance, Vrev is extrapolated reversal potential, Vm is voltage for half-maximal activation, and ks is slope factor. The time course of current activation was fitted to a monoexponential function:
where I(t) is current at time t, ao is the amplitude coefficient, τ is time constant, and C is a constant. Data are given as mean ± standard error, from witch the time constant τ was determined. These voltage dependencies of the steady-state activation and time constants of activation and deactivation were then used as data for the identification of the parameters of a four-state model (see Fig. 1).
Inverse problem approach for the identification of model parameters
Given a guess for the model parameters α, β (describing the pore opening and closure during activation), γ, and δ (describing the pore opening and closure during deactivation), and x0, y0, kx, and ks (describing the voltage-sensing machinery), the above mentioned experimental data, i.e., steady-state activation and time constants, can be numerically simulated by means of the formulae (Eqs. 4.2 and 4.5) of the Results section. This task would be referred to as the direct problem. For solving the corresponding inverse problem of identifying the model parameters
from the experimental data, we followed a regularization approach (Engl et al., 1996). Instead of purely minimizing the mismatch between data and simulation over a set of admissible parameters, we considered the minimization of a Tikhonov-type objective functional consisting of a mismatch and a penalty term, i.e.,
| (1.1) |
Parameter identification is inherently ill-conditioned in the sense that minimizers of the pure mismatch term (i.e., η = 0) do not depend on the data in a stable manner, such that even small measurement errors (inevitable in practice) may lead to severe errors in the computed parameters. The purpose of the penalty term η ||q-q0||2 with η > 0 (where q0 denotes an available a priori guess and || || denotes the Euclidean norm) is to counteract the ill-conditioning of the problem, such that strong data error amplifications are avoided. Hence, the regularization parameter η acts as a balance between accuracy and stability; theoretical guidelines for its choice in dependency on the data noise level are given in Engl et al. (1996).
For describing the mismatch, we used a standard weighted least-squares formulation, i.e.,
| (1.2) |
with weights
where the summation indices i and k reflect the fact that the data were collected at various voltage values Vtau,j and V∞,k.
In case of simultaneous considerations of datasets, for several mutants the mismatch term simply is changed to
with datal and parameters ql corresponding to the mutant labeled by index l; similarly, the penalty term of the Tikhonov functional is adapted.
The set of admissible parameters within a solution is sought for is defined via the restriction
| (1.3) |
which reflects the finding that the slope (see Eq. 4.4 for the relation between ky and kx,ks) of the activation curve ranged between 5.7 and 9.8 mV (see Table I). In addition, the constraint
| (1.4) |
is derived from the observation that the activation curve was never shifted beyond −10 mV.
TABLE I.
Midpoints and slope factors of the activation curves of CaV1.2 IIS6 mutants
| Mutant | Half-activation | Slope |
| mV | mV | |
| Wild-typea | −9.9 ± 1.1 | 6.3 ± 0.7 |
| A780Pa | −37.1 ± 0.7 | 5.7 ± 0.8 |
| A780G | −19.3 ± 0.8 | 6.3 ± 0.6 |
| I781Pa | −47.2 ± 1.1 | 6.3 ± 0.6 |
| I781G | −40.2 ± 0.8 | 7.5 ± 0.7 |
| I781Ta | −37.7 ± 1.2 | 7.2 ± 1.0 |
| A782Pa | −35.7 ± 1.4 | 9.8 ± 0.3 |
| A782G | −22.2 ± 0.4 | 7.8 ± 0.4 |
| V783G | No current | No current |
| D784G | −15.6 ± 1.1 | 6.3 ± 0.6 |
Data from Hohaus et al. (2005).
We also constrained the ratio between the fractions of activated open channels Fopen,max and spontaneously open channels at rest Fopen,min:
| (1.5) |
Finally, we also considered the box constraints
which were determined by preliminary simulations of current kinetics and steady-state activation curves. For solving the resulting constrained optimization problems, we used the MATLAB (The MathWorks) SQP-type routine fmincon. In a preliminary step, initial guesses were produced by the use of the genetic algorithm type routine ga. Derivatives of the Tikhonov functional, needed for providing gradient information, were calculated based on eigenvalue sensitivities to avoid error-prone finite differences (see supplemental text). The optimization problems were independently solved several times to avoid the return of only local minimizers.
For the components qj of the identified parameter vector, a 0.95 marginal confidence interval was calculated according to
| (1.6) |
where X is simulation, (q) denotes the Jacobian matrix of the (nonlinear) simulation mapping, N denotes the total number of data points, and t(N-8,0.05/2) is the upper 0.005/2 quantile for Student’s t distribution with N-8 degrees of freedom (Bates and Watts, 1988). Again, straightforward adaptations apply to the case of datasets corresponding to multiple mutations.
Simulation of current traces
Currents were simulated by solving the ordinary differential equation (ODE) system (Eq. 4.5) describing the four-state model (see also Supplemental Material, Part 3) making use of the estimated rate constants. Initial conditions: (1) for activation traces: steady-state distribution of channels between states at holding potential; and (2) for deactivation traces: calculated fractions at the end of 20-ms conditioning pulse (0 mV for wild-type, −30 mV for I781G, and −40 mV for I781P). Currents were simulated using a reversal potential of 48 mV assuming a linear I-V relationship.
Online supplemental material
The time constant of current activation (Eq. 2.2) in terms of a serial three-state model (Scheme 1), a link between the steady-state activation curve (m∞) and the fraction of open channels, the ODEs describing the four-state model, and the calculation of eigenvalue sensitivities are given in the Supplemental material, Parts 1–4, respectively. It is available at http://www.jgp.org/cgi/content/full/jgp.200910272/DC1.
RESULTS
Glycine mutations in the lower third of IIS6
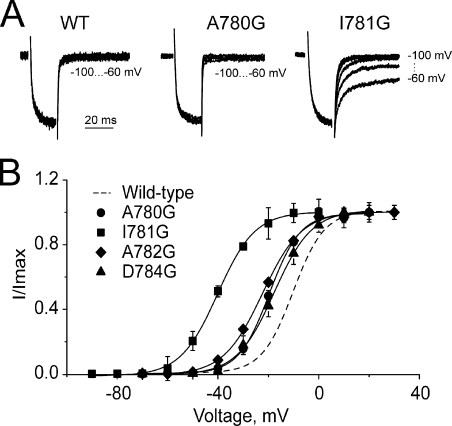
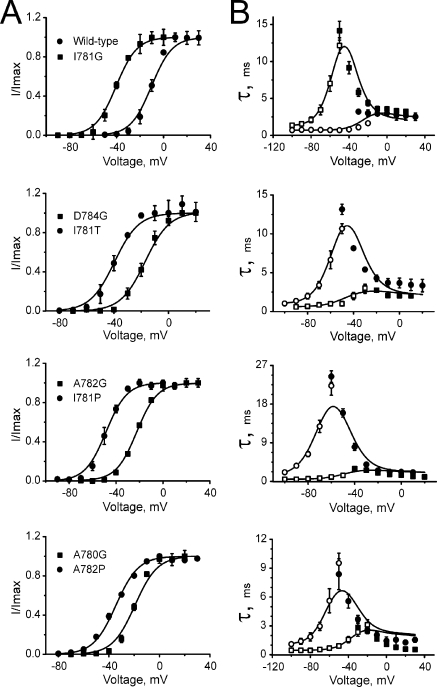
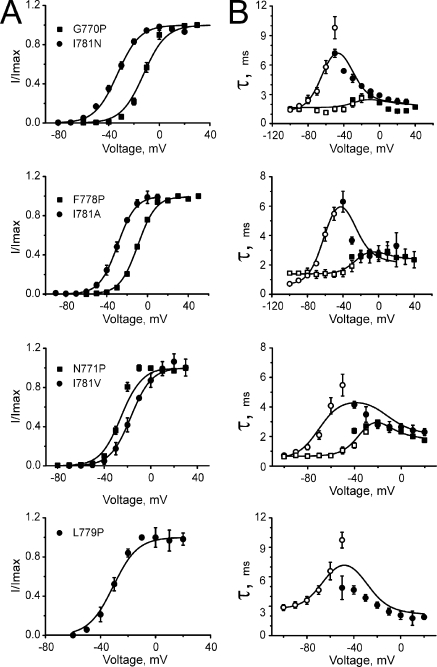
Our previous studies provided evidence that the conserved LAIA motif in segment IIS6 of CaV1.2 is highly sensitive to proline substitutions. A proline in an α helix causes a kink of ∼26° (Barlow and Thornton, 1988; Cordes et al., 2002), comparable to the 30° bend of the “glycine hinge” in the crystal structure of MthK (Jiang et al., 2002). We have, therefore, hypothesized that in CaV1.2, helix bending at these positions may play a role in activation gating (Hohaus et al., 2005). To gain further insights into the role of helix flexibility in channel gating, we substituted the LAIA motif and neighboring positions by flexible glycines. I781G induced significant changes in channel activation (Table I; compare with Hohaus et al., 2005). Fig. 2 illustrates the deactivation kinetics of wild type, A780G, and I781G at different voltages. The time constants of activation and deactivation and steady-state activation curves of wild-type, the glycine mutants (Table I), and previously described IIS6 mutants (see Hohaus et al., 2005) are shown in Figs. 3 and 8. Comparing the gating changes induced by glycine mutations with previous data of Hohaus et al. (2005) revealed no peculiarities; larger shifts of the activation curves were accompanied by slower current kinetics (see Fig. 6 C).
Figure 2.
Glycine mutations in IIS6 differentially modulate CaV1.2 gating. (A) Representative tail currents of wild-type, A780G, and I781G channels. Currents were activated during a 20-ms conditioning depolarization to 0 mV for wild-type, −10 mV for A780P, and −30 mV for I781G. Deactivation was recorded during subsequent repolarizations (10-mV increments) starting from −100 mV. (B) Voltage dependences of steady-state activation of the indicated glycine mutants.
Figure 3.
Effects of pore mutations on steady-state activation and current kinetics. Voltage dependences of steady-state activation (A), time constants of activation (B; filled symbols), and deactivation (B; open symbols) of the indicated channel construct. Solid lines represent model simulations based on the identified model parameters given in Tables II and III.
Figure 8.
Steady-state and kinetic characteristics of previously described mutants (Hohaus et al., 2005). Voltage dependencies of steady-state activation (A), time constants of activation (B; filled symbols), and deactivation (B; open symbols) of the indicated constructs. Solid lines represent the simulations based on the model parameters identified (see Tables II and III).
Figure 6.
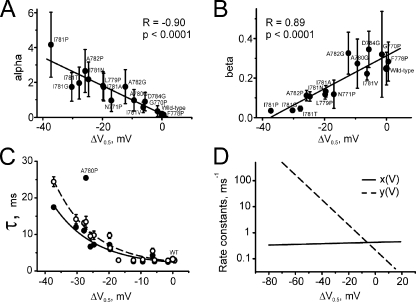
Rate constants of channel opening and closure. (A and B) Correlations between estimated rate constants of opening (A) and closure (B) and shifts of the activation curves (ΔV = V1/2,MUT − V1/2,WT) for IIS6 mutations. (C) Maximal time constants experimentally measured (open circles) and calculated (filled circles; see bell-shaped curves in Figs. 3 and 8) versus corresponding shifts of the activation curves. Lines represent fits by monoexponential functions (A0 + A1 * exp(−ΔV/k)), with A0 = 1.57 ± 1.10, A1 = 1.09 ± 0.52, and k =12.2 ± 1.9 for experimental data, and A0 = 1.53 ± 0.95, A1 = 0.88 ± 0.49, and k = 12.7 ± 2.3 for calculated data. (D) Voltage dependence of x(V) and y(V) plotted in semilogarithmic scale. x(V) represents the voltage dependence of the forward rate and y(V) the backward movement of the voltage-sensing machinery (see Fig. 1). A steeper voltage dependence of y(V) is evident.
Three-state model failed to describe both activation and deactivation
To obtain insights into mutation-specific gating modifications, we quantified current kinetics and steady-state activation curves. In a first attempt, we described CaV1.2 activation by:
 |
(SCHEME 1) |
This three-state model is a simplification of more complex state diagrams (see Marks and Jones, 1992; Zagotta et al., 1994a,b). Multiple voltage sensor transitions occurring before channel opening cannot be resolved from predominantly monoexponential CaV activation. We have, therefore, lumped together these transitions. In the resulting Scheme 1, a membrane depolarization initiates voltage sensor movement (transition R↔A with voltage-dependent rate constants x(V) and y(V)), which subsequently initiates a voltage-independent pore opening (transition A↔O with rate constants α and β; see also Marks and Jones, 1992; Zagotta et al., 1994a,b; Yifrach and MacKinnon, 2002). Thus, mechanistically the model assumes two functionally distinct channel parts: a voltage-sensing unit and a pore that opens and closes with voltage-independent rates. The rate constants of the voltage-sensing machinery are described by simple exponential functions (Eyring expressions):
| (2.1) |
This yields the voltage dependence of time constant (see supplemental text, Part 1):
| (2.2) |
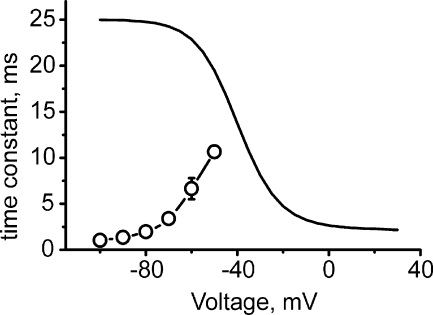
The backward pathway of Scheme 1 failed, however, to describe the acceleration of deactivation at more negative voltages. In such a scenario, the channel would have to close by transition O→A before returning to the resting state (A→R). If strong hyperpolarization accelerates the downward movement of voltage sensor (y(V)→∞), then voltage-independent pore closure serves as the rate-limiting stage preventing acceleration of deactivation. At negative potentials (V < −80 mV) this predicts a time constant (deduced from Eq. 2.2) that does not reproduce our experimental findings (see Fig. 7).
Figure 7.
Voltage dependence of deactivation time constants predicted by fitting the data for mutant I781T to the backward activation pathway: Deactivation time constant (solid line) was calculated by Eq. 2.2 (rate constants are indicated in Tables II and III). The model predicts an increase of the deactivation time constants, whereas the experimentally measured time constants decreased with increasing hyperpolarization (open circles connected by broken line).
Four state model for Cav1.2 activation and deactivation
We propose, therefore, a scenario for channel deactivation where channel closure is initiated by return of the voltage sensor to its resting position during hyperpolarization via a deactivated open state D:
 |
(SCHEME 2) |
with corresponding Eyring expressions:
| (3.1) |
Identical steepness factors (kx and ky) were assumed for rate constants describing the upward (x(V) and u(V)) and downward (y(V) and w(V)) movements of the voltage sensor. The resulting circular four-state model with separate activation (predominantly via state A) and deactivation (predominantly via state D) pathways is shown in Fig. 1. The destination point of the activation process (state O) is the departure point for deactivation and vice versa. All rate constants are linked by the thermodynamic reversibility condition at all voltages:
| (3.2) |
Taking into account Eqs. 2.1 and 3.2, the thermodynamic reversibility condition can be reduced to:
Finally, we assumed a link between the voltage-sensing machinery and pore stability. w0 is linked to the stability of the open state O, and u0 is linked to the stability of open state D:
The voltage dependence of steady-state activation
Hodgkin and Huxley (1952) introduced the term activation (m) varying from 0 to 1 to characterize the voltage dependence of normalized peak sodium conductance. In frame of the four-state model shown in Fig. 1, the fraction of open channels varies from Fopen,min at hyperpolarizing voltages to Fopen,max at depolarizing voltages. The standard activation curve is thus defined by:
| (4.1) |
yielding (see supplemental text, Part 2) the Boltzmann distribution:
| (4.2) |
with midpoint
| (4.3) |
and a slope factor
| (4.4) |
This expression illustrates that the slope of the activation curves does not depend on pore stability (α, β, γ, and δ).
The voltage dependence of the time constant τ
The linear ODE describing the circular four-state model of Fig. 1
| (4.5) |
can in vectorial notation be compactly written as
with state vector S = (R,A,O), the vector b = (δ,0,u(V)), and the matrix M as given in (Eq. S10).
The time constants τ recorded at various voltage values can be described by
| (4.6) |
where λmin denotes the smallest eigenvalue of the matrix M.
The eigenvalues of this matrix are real, negative, and distinct (for physically meaningful parameters), such that λmin is well defined (see Hearon, 1953). Two other (larger) eigenvalues correspond to early current activation phases that were not resolved in our experiments (see Materials and methods). The simulation of the time constant data requires the computational determination of λmin, based on the eigenvalue equation
| (4.7) |
for which numerical routines are available in MATLAB or related software packages.
Determination of model parameters for individual mutants
First, we applied the inverse problem approach to estimate the rate constants of CaV1.2 activation and deactivation for individual IIS6 mutants. Corresponding parameters for channel construct I781T are exemplified in Table IV. The large confidence intervals of the estimated rate constants illustrate that traditional measures of calcium current kinetics and steady state do not provide sufficient information for parameter identification in frame of the gating model illustrated in Fig. 1.
TABLE IV.
Individually fitted model parameters for I781T and A780P
| Rate constants | I781T | A780P |
| x0 (ms−1) | 0.279 ± 0.026 | 0.116 ± 0.035 |
| kx (mV) | 214.0 ± 330.5 | 62.2 ± 36.1 |
| y0 (ms−1) | 0.056 ± 2.607 | 0.023 ± 15.695 |
| ky (mV) | 6.65 ± 0.05 | 7.15 ± 0.08 |
| α (ms−1) | 6.8 ± 315.0 | 4.3 ± 2962.6 |
| β (ms−1) | 0.072 ± 0.015 | 0.063 ± 0.021 |
| γ (ms−1) | 0.0027 ± 0.0020 | 0.0021 ± 0.0203 |
| δ (ms−1) | 0.858 ± 0.107 | 0.153 ± 0.028 |
Estimation of rate constants for a large set of CaV1.2 mutants
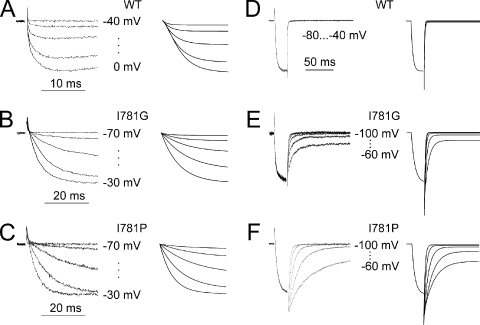
Next, we reduced the dimension of the parameter search space by assuming that pore mutations are unlikely to significantly affect the voltage-sensing machinery (see also Yifrach and MacKinnon, 2002). Rate constants α, β, γ, and δ for wild-type and all IIS6 mutants were thus estimated with identical x(V) and y(V). As evident from Figs. 3 and 8 and Tables II and III, the steady-state activation curves and current kinetics of 15 constructs were fitted by the model with narrower confidence intervals. Fig. 4 displays simulated current kinetics for wild-type CaV1.2 and mutants I781G and I781P, making use of the estimated rate constants that are given in Tables II and III.
TABLE II.
Rate constants of A↔O and R↔D transitions (in ms−1)
| Construct | α | β | γ | δ |
| Wild-typea | 0.15 ± 0.11 | 0.24 ± 0.08 | 0.021 ± 0.021 | 1.39 ± 0.17 |
| G770P | 0.33 ± 0.31 | 0.31 ± 0.21 | 0.030 ± 0.073 | 0.56 ± 0.11 |
| N771Pa | 0.95 ± 0.63 | 0.11 ± 0.07 | 0.111 ± 0.057 | 1.41 ± 0.23 |
| F778Pa | 0.13 ± 0.12 | 0.28 ± 0.09 | 0.016 ± 0.026 | 0.70 ± 0.09 |
| L779Pa | 1.79 ± 0.81 | 0.11 ± 0.02 | 0.002 ± 0.002 | 0.36 ± 0.09 |
| A780Pa | 0.19 ± 0.03 | 0.0064 ± 0.0022 | 0.015 ± 0.005 | 0.14 ± 0.02 |
| A780G | 0.96 ± 0.62 | 0.27 ± 0.12 | 0.037 ± 0.022 | 2.10 ± 0.33 |
| I781Ta | 1.95 ± 0.91 | 0.045 ± 0.012 | 0.009 ± 0.003 | 1.02 ± 0.26 |
| I781Pa | 4.16 ± 1.86 | 0.034 ± 0.007 | 0.003 ± 0.001 | 0.74 ± 0.43 |
| I781G | 1.73 ± 0.81 | 0.036 ± 0.010 | 0.011 ± 0.003 | 0.78 ± 0.18 |
| I781Aa | 1.72 ± 0.79 | 0.132 ± 0.028 | 0.003 ± 0.001 | 1.55 ± 0.44 |
| I781Va | 0.55 ± 0.30 | 0.22 ± 0.03 | 0.0003 ± 0.0002 | 2.01 ± 0.77 |
| I781Na | 2.17 ± 0.99 | 0.10 ± 0.02 | 0.003 ± 0.002 | 0.74 ± 0.20 |
| A782Pa | 2.65 ± 1.23 | 0.111 ± 0.026 | 0.004 ± 0.002 | 0.94 ± 0.27 |
| A782G | 1.74 ± 0.97 | 0.32 ± 0.10 | 0.013 ± 0.009 | 1.96 ± 0.37 |
| D784G | 0.88 ± 0.53 | 0.34 ± 0.09 | 0.008 ± 0.006 | 1.62 ± 0.35 |
Rate constants estimated using data from Hohaus et al. (2005).
TABLE III.
Model parameters describing the R↔A transition
| Rate constant | Estimated value |
| x0 (ms−1) | 0.427 ± 0.029 |
| kx (mV) | 328.8 ± 447.4 |
| y0 (ms−1) | 0.216 ± 0.084 |
| ky (mV) | 9.04 ± 0.52 |
Figure 4.
Recorded and simulated currents. (A–C) IBa through wild-type (A), I781G (B), and I781P (C) channels (left column) during depolarization from −80 mV to the indicated voltages and corresponding current simulations (right column). (D–F) Representative tail currents of wild-type (D), I781G (E), and I781P (F) channels (left column) and corresponding simulations (right column). The fast phase of the tail current (D–F) containing fast (not resolved) components of current deactivation is truncated. The simulated currents were calculated from the full four-state model by solving the ODE system (Eq. 4.5) making use of the estimated rate constants (Tables II and III) and a reversal potential of 48 mV (see also Materials and methods).
Specific gating behavior of mutant A780P
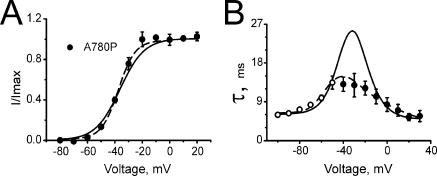
Fitting A780P with x(V) and y(V), common for all mutants, failed to reproduce simultaneously steady-state activation and time constants of activation and deactivation. This is evident from Fig. 5 B, where the predicted activation time constant in the voltage range between −40 and −20 mV was approximately two times larger than the experimental values. Furthermore, fitting constraint (Eq. 1.5; see Materials and methods) was active, indicating that the model paradigms conflict with the gating characteristics of A780P.
Figure 5.
Steady-state activation and current kinetics of A780P. Voltage dependence of steady-state activation (A) and time constants of activation and deactivation (B) of mutant A780P. Solid lines show simulations based on the rate constants x(V) and y(V) of Table III. Voltage dependence of the activation time constants (B) was not reproduced under the assumption of x(V) and y(V) being identical for all mutants. Dotted lines show improved simulations for A780P obtained by individual fits of x(V) and y(V) (see Table IV).
Changes in x(V) and y(V) significantly improved the quality of the fit. The dashed line in Fig. 5 B represents a simulation for A780P kinetics with x(V) and y(V) that was obtained from an individual fit (Table III). These data suggest that the hypothesis that pore mutations do not significantly affect the voltage sensing machinery is not fulfilled for all mutations.
Inverse relation between channel opening and closure rates
Fig. 6 (A and B) displays the relation between the estimated rate constants of opening and closure (α and β) and the corresponding shifts of the activation curves. Larger shifts in steady-state activation are accompanied by an increase in α (reflecting a destabilization of the closed pore) and a decrease in β (reflecting a stabilization of the open-channel conformation). Both trends were statistically significant (Fig. 6, A and B). The rates of voltage-independent (spontaneous) channel openings (γ) from the resting state R are given in Table II together with the rates of channel closure δ. No correlations with shifts were found either for γ or for δ (not depicted).
Relation between current deceleration and shift of the activation curve
The shifts of the steady-state activation curves versus the estimated maximal time constants (peaks of the bell-shaped dependencies in Figs. 3 and 8) are plotted in Fig. 6 C. Larger shifts of the activation curve were typically associated with a gradual deceleration of current kinetics. The data of A780P did not fit this relationship, highlighting peculiarities in the gating of this mutant. Fig. 6 D shows the voltage-dependent rate constants x(V) and y(V) in semilogarithmic scale (see also Table III).
DISCUSSION
We have previously shown that amino acid substitutions in the lower third of segment IIS6 of CaV1.2, and in particular the substitution of I781 by residues of different hydrophobicity, size, and polarity, shift the voltage dependence of activation toward more negative potentials (Hohaus et al., 2005; Raybaud et al., 2006; Hering et al., 2008).
Here, we extended this analysis by introducing glycine mutations to evaluate the role of helix flexibility. Substitution of I781 by glycine induced slow activation and deactivation kinetics and a substantial shift of the activation curve (ΔVact = −30 mV). Other glycin mutations affected kinetics to different extents and induced, compared with the strong gating perturbations induced by I781P/T, less pronounced shifts of the activation curves (I781P > I781G > I781T > A782G > A780G > D784G; Table I and Figs. 2 and 3; compare with Fig. 8). Mutation I781G thus confirmed the previously established particular gating-sensitive position I781 (Hohaus et al., 2005; see also Kudrnac et al., 2009). In general, glycine substitutions and other IIS6 mutations in CaV1.2 induced either negligible changes (e.g., G770P; Hohaus et al., 2005) or substantial shifts in channel gating accompanied by a deceleration of activation kinetics. Collectively, these and previous data revealed a link between deceleration of current kinetics and the gradual leftward shift of the activation curve (Fig. 6 C). Double mutants in neighboring amino acids in IS6 and IIS6 confirmed this trend (Kudrnac et al., 2009).
In potassium channels (Yifrach and MacKinnon, 2002) and NaChBac (Zhao et al., 2004), similar shifts of the activation curves were explained by a destabilization of the closed and/or a stabilization of the open-channel conformation without a perturbation of the voltage-sensing machinery. In the present study, we evaluated this paradigm for CaV1.2.
A minimal model for CaV1.2 activation and deactivation
To quantify the underlying gating perturbations, we first exploited a serial three-state model (Scheme 1) with voltage-independent rate constants of pore opening and closure (α and β). This gating scheme predicts increasing deactivation time constants with hyperpolarization, which is in contradiction to our experimental findings (Fig. 7). Therefore, to fit our data we designed a more complex, circular four-state model (Fig. 1), where CaV1.2 channels can activate and deactivate via different pathways. Both processes are initiated by voltage sensor movements. During activation the voltage sensor moves in response to a depolarization from a “gate-locking position” R to A (where the channel is still closed) with voltage-dependent rate constants x(V) and y(V). The unlocked channel opens with a rate constant α and closes with a rate constant β (Fig. 1). During deactivation the voltage sensor moves toward the “gate-locking position.” If channels sojourned in state A (activated/closed), they return to the resting state R. If channels were open, they enter the state D and subsequently close by returning to R.
Inverse problem approach for parameter identification
After an inverse problems approach, we determined: (1) the rate constants (x(V) and y(V)) of the transitions of the voltage-sensing machinery from the resting to the activated state, and (2) the rate constants of pore opening and closure (α, β, γ, and δ). However, the application of this approach to individual channel mutants provided satisfactory fits with large confidence intervals (Table IV). Assuming that the rate constants x(V) and y(V) are identical for all mutants allowed the identification of all rate constants with narrower confidence intervals (Figs. 3 and 8, and Tables I and II). This approach enabled us to fit the kinetics of 15 out of 16 channel constructs (Figs. 3 and 8). Simulations of current kinetics with estimated rate constants exemplified for wild type, I781G, and I781P (Fig. 4) illustrate the quality of the fit.
Particular effect of mutation A780P
Clear discrepancies between predicted and experimental data for mutant A780P are illustrated in Fig. 5. Between −40 and −20 mV, the predicted time constants of channel activation of mutant A780P were approximately two times larger than the experimentally determined values (Fig. 5 B, solid line). Fitting the steady-state and current kinetics of A780P by the model individually led to a substantial improvement (Fig. 5, dashed lines). A trend toward stronger voltage dependence of x(V) was observed (compare kx in Table IV with kx of all other mutants given in Table III). We speculate that substitution of A780P in segment IIS6 of CaV1.2 significantly affects the interaction between the voltage-sensing machinery and the channel pore. Rigid helix bending in position A780 might be directed toward the voltage-sensing structures, leading to restricted mobility of the voltage-sensing domain (“sensor clip”). Hence, the introduction of a flexible glycine into this position induced only an ∼10-mV shift of the activation curve without significantly changing current activation and deactivation kinetics (A780G; Figs. 2 and 3).
Weak voltage dependence of pore-releasing sensor transition
The voltage dependences of x(V) and of y(V) obtained for the other 15 constructs are shown in Fig. 6 C. Steeper dependence of y(V) on voltage (with ky = 9.04 ± 0.52 mV) compared with the “gate-releasing” movement (with a kx = 328 ± 447 mV) indicates that changes in membrane voltage are more efficient in closing than in opening the channel. The weak voltage dependence of x(V) prevented a precise estimation of its steepness factor kx (wide confidence interval). Indeed, if current activation is determined largely by y(V), changes in x(V) have a minor (and hardly detectable) influence. Weak voltage dependence of the forward rate constant of the voltage-sensing unit (x(V)) versus the strong voltage dependence of the backward transition (y(V)) suggests that the membrane voltage is more efficient in forcing the CaV1.2 into a closed state than “pulling” the gate open (Fig. 6 D), which is in line with previous observations on voltage-gated potassium channels (for review see Fedida and Hesketh, 2001).
Stabilization of the open- or destabilization of the closed-channel pore?
The majority of IIS6 mutations analyzed in this and a previous paper (Hohaus et al., 2005) shift the activation curve to more hyperpolarized voltages. These changes in steady-state activation reflect either a destabilization of the closed state and/or a stabilization of the open-channel conformation (Yifrach and MacKinnon, 2002; Zhao et al., 2004). Compared with previous studies, our analysis accounted for steady-state and kinetic data simultaneously. A trend that mutations in the lower part of IIS6 destabilizing the closed state stabilize the open state is evident (Fig. 6, A and B). This observation is an interesting finding per se and suggests a structural link between both conformations of CaV1.2 that has yet to be identified.
Acknowledgments
This study was supported by a grant from The Austrian Science Fund (FWF; Project P19614-B11).
Angus C. Nairn served as editor.
Footnotes
Abbreviation used in this paper:
- ODE
- ordinary differential equation
References
- Barlow D.J., Thornton J.M. 1988. Helix geometry in proteins.J. Mol. Biol. 201:601–619 [DOI] [PubMed] [Google Scholar]
- Bates D.M., Watts D.G. 1988. Nonlinear Regression Analysis and Its Application. Wiley Series in Probability and Mathematical Statistics, Inc. John Wiley and Sons, New York: 384 pp [Google Scholar]
- Catterall W.A. 2000. Structure and regulation of voltage-gated Ca2+ channels.Annu. Rev. Cell Dev. Biol. 16:521–555 [DOI] [PubMed] [Google Scholar]
- Cordes F.S., Bright J.N., Sansom M.S. 2002. Proline-induced distortions of transmembrane helices.J. Mol. Biol. 323:951–960 [DOI] [PubMed] [Google Scholar]
- Doyle D.A., Morais Cabral J., Pfuetzner R.A., Kuo A., Gulbis J.M., Cohen S.L., Chait B.T., MacKinnon R. 1998. The structure of the potassium channel: molecular basis of K+ conduction and selectivity.Science. 280:69–77 [DOI] [PubMed] [Google Scholar]
- Engl H.W., Hanke M., Neubauer A. 1996. Regularization of Inverse Problems. Kluwer Academic Publishers, Dordrecht, Netherlands: 332 pp [Google Scholar]
- Fedida D., Hesketh J.C. 2001. Gating of voltage-dependent potassium channels.Prog. Biophys. Mol. Biol. 75:165–199 [DOI] [PubMed] [Google Scholar]
- Grabner M., Dirksen R.T., Beam K.G. 1998. Tagging with green fluorescent protein reveals a distinct subcellular distribution of L-type and non-L-type Ca2+ channels expressed in dysgenic myotubes.Proc. Natl. Acad. Sci. USA. 95:1903–1908 [DOI] [PMC free article] [PubMed] [Google Scholar]
- Hamill O.P., Marty A., Neher E., Sakmann B., Sigworth F.J. 1981. Improved patch-clamp techniques for high-resolution current recording from cells and cell-free membrane patches.Pflugers Arch. 391:85–100 [DOI] [PubMed] [Google Scholar]
- Hearon J.H. 1953. The kinetics of linear systems with special reference to periodic reactions.Bull. Math. Biophys. 15:121–141 [Google Scholar]
- Hemara-Wahanui A., Berjukow S., Hope C.I., Dearden P.K., Wu S.B., Wilson-Wheeler J., Sharp D.M., Lundon-Treweek P., Clover G.M., Hoda J.C., et al. 2005. A CACNA1F mutation identified in an X-linked retinal disorder shifts the voltage dependence of Cav1.4 channel activation.Proc. Natl. Acad. Sci. USA. 102:7553–7558 [DOI] [PMC free article] [PubMed] [Google Scholar]
- Hering S., Beyl S., Stary A., Kudrnac M., Hohaus A., Guy R.H., Timin E. 2008. Pore stability and gating in voltage-activated calcium channels.Channels (Austin). 2:61–69 [DOI] [PMC free article] [PubMed] [Google Scholar]
- Hodgkin A.L., Huxley A.F. 1952. A quantitative description of membrane current and its application to conduction and excitation in nerve.J. Physiol. 117:500–544 [DOI] [PMC free article] [PubMed] [Google Scholar]
- Hohaus A., Beyl S., Kudrnac M., Berjukow S., Timin E.N., Marksteiner R., Maw M.A., Hering S. 2005. Structural determinants of L-type channel activation in segment IIS6 revealed by a retinal disorder.J. Biol. Chem. 280:38471–38477 [DOI] [PMC free article] [PubMed] [Google Scholar]
- Horton R.M., Hunt H.D., Ho S.N., Pullen J.K., Pease L.R. 1989. Engineering hybrid genes without the use of restriction enzymes: gene splicing by overlap extension.Gene. 77:61–68 [DOI] [PubMed] [Google Scholar]
- Jiang Y., Lee A., Chen J., Cadene M., Chait B.T., MacKinnon R. 2002. Crystal structure and mechanism of a calcium-gated potassium channel.Nature. 417:515–522 [DOI] [PubMed] [Google Scholar]
- Jiang Y., Lee A., Chen J., Ruta V., Cadene M., Chait B.T., MacKinnon R. 2003. X-ray structure of a voltage-dependent K+ channel.Nature. 423:33–41 [DOI] [PubMed] [Google Scholar]
- Kudrnac M., Beyl S., Hohaus A., Stary A., Peterbauer T., Timin E., Hering S. 2009. Coupled and independent contributions of residues in IS6 and IIS6 to activation gating of CaV1.2.J. Biol. Chem. 284:12276–12284 [DOI] [PMC free article] [PubMed] [Google Scholar]
- Long S.B., Campbell E.B., Mackinnon R. 2005. Crystal structure of a mammalian voltage-dependent Shaker family K+ channel.Science. 309:897–903 [DOI] [PubMed] [Google Scholar]
- Marks T.N., Jones S.W. 1992. Calcium currents in the A7r5 smooth muscle-derived cell line. An allosteric model for calcium channel activation and dihydropyridine agonist action.J. Gen. Physiol. 99:367–390 [DOI] [PMC free article] [PubMed] [Google Scholar]
- Raybaud A., Dodier Y., Bissonnette P., Simoes M., Bichet D.G., Sauvé R., Parent L. 2006. The role of the GX9GX3G motif in the gating of high voltage-activated Ca2+ channels.J. Biol. Chem. 281:39424–39436 [DOI] [PubMed] [Google Scholar]
- Stary A., Kudrnac M., Beyl S., Hohaus A., Timin E., Wolschann P., Guy H.R., Hering S. 2008. Molecular dynamics and mutational analysis of a channelopathy mutation in the IIS6 helix of CaV1.2.Channels (Austin). 2:216–223 [DOI] [PMC free article] [PubMed] [Google Scholar]
- Swartz K.J. 2005. Structure and anticipatory movements of the S6 gate in Kv channels.J. Gen. Physiol. 126:413–417 [DOI] [PMC free article] [PubMed] [Google Scholar]
- Tombola F., Pathak M.M., Isacoff E.Y. 2006. How does voltage open an ion channel? Annu. Rev. Cell Dev. Biol. 22:23–52 [DOI] [PubMed] [Google Scholar]
- Yifrach O., MacKinnon R. 2002. Energetics of pore opening in a voltage-gated K(+) channel.Cell. 111:231–239 [DOI] [PubMed] [Google Scholar]
- Zagotta W.N., Hoshi T., Dittman J., Aldrich R.W. 1994a. Shaker potassium channel gating. II: transitions in the activation pathway.J. Gen. Physiol. 103:279–319 [DOI] [PMC free article] [PubMed] [Google Scholar]
- Zagotta W.N., Hoshi T., Aldrich R.W. 1994b. Shaker potassium channel gating. III: evaluation of kinetic models for activation.J. Gen. Physiol. 103:321–362 [DOI] [PMC free article] [PubMed] [Google Scholar]
- Zhao Y., Yarov-Yarovoy V., Scheuer T., Catterall W.A. 2004. A gating hinge in Na+ channels; a molecular switch for electrical signaling.Neuron. 41:859–865 [DOI] [PubMed] [Google Scholar]
- Zhou Y., Morais-Cabral J.H., Kaufman A., MacKinnon R. 2001. Chemistry of ion coordination and hydration revealed by a K+ channel-Fab complex at 2.0 A resolution.Nature. 414:43–48 [DOI] [PubMed] [Google Scholar]


