Abstract
For intensity modulated radiation treatment (IMRT) dose reconstruction, multileaf collimator (MLC) log files have been shown applicable for deriving delivered fluence maps. However, MLC log files are dependent on the accuracy of leaf calibration and only available from one linear accelerator manufacturer. This paper presents a proof of feasibility and principles in (1) using an amorphous silicon electronic portal imaging device (aSi-EPID) to capture the MLC segments during an IMRT delivery and (2) reconstituting a leaf sequence (LS) file based on the leaf end positions calculated from the MLC segments and their associated fractional monitor units. These EPID-measured LS files are then used to derive delivered fluence maps for dose reconstruction. The developed approach was tested on a pelvic phantom treated with a typical prostate IMRT plan. The delivered fluence maps, which were derived from the EPID-measured LS files, showed slight differences in the intensity levels compared with the corresponding planned ones. The dose distribution calculated with the delivered fluence maps showed a discernible difference in the high dose region when compared to that calculated with the planned fluence maps. The maximum dose in the former distribution was also 2.5% less than that in the latter one. The EPID-measured LS file can serve the same purpose as a MLC log files does for the derivation of the delivered fluence map and yet is independent of the leaf calibration. The approach also allows users who do not have access to MLC log files to probe the actual IMRT delivery and translate the information gained for dose reconstruction in adaptive radiation therapy.
Keywords: EPID, leaf sequence file, IMRT, dose reconstruction
INTRODUCTION
An advantage of the fractionation scheme in radiation treatment is that it offers room for adaptive radiation therapy (ART). ART is a radiation treatment strategy of which the subsequent fractional delivery can be adaptively modified based on a closed-loop control framework using systematic feedback of geometric and dosimetric information.1, 2, 3 The ultimate goal of ART is to maintain adequate target coverage with a desired dose and ensure doses received by normal tissue are within tolerance at the conclusion of treatment. The adaptive strategy comes into play at different levels of complexity depending on the techniques and resources available. It ranges from the most accessible form of adapting treatment margins based on daily portal images4 to the most sophisticated one of reoptimization or replanning of treatment plans.1, 2 Common to all these strategies is the execution of dose reconstruction at some stage during the ART process. Through this, the dose deposited to a patient in a particular fraction can be correlated or mapped to a reference set of computed tomography, ideally by deformable registration, contributing to an accumulated dose delivered so far, which is a key parameter for the feedback mechanism in the ART framework.
However, in most intensity modulated radiation treatments (IMRTs) employing ART strategies, the dose reconstruction is tacitly based on an assumption that the delivery of fluence maps is as planned.5, 6, 7 This assumption might not be necessarily valid. For instance, in IMRT using step-and-shoot mode, the expected delivery of fluence maps might not be realized due to intrinsic errors associated with the multileaf collimator (MLC) kinematics and beam control communication resulting in overshoot, undershoot segmental monitor units, dropped segments, and beam delivery during leaf motion.8, 9, 10 In order to incorporate these errors in the dose reconstruction, Lee et al.11 and Litzenberg et al.10 have demonstrated a pragmatic approach of using MLC log files to reconstruct the IMRT dose actually delivered. This is based on the fact that the MLC log files have been validated to faithfully reflect the actual delivery process of MLC-based IMRT.12, 13 Because the MLC log file is only available from one commercial linear accelerator (linac) manufacturer (Varian Medical Systems, Palo Alto, CA), users with linacs from other manufacturers are deprived of this straightforward approach to reconstruct the delivered IMRT dose. Furthermore, the leaf position data recorded in a MLC log file is taken from the same encoders used to position the leaves, making the reported position dependent on the leaf position calibration and by no means an absolute measure of the leaf position. Any systematic error introduced in the MLC calibration might lead to actual leaf positions different from the expected ones, resulting in dose errors.14
In order to circumvent this dependence and provide a universal approach of probing the actual delivery of a fluence map, we propose using an amorphous silicon electronic portal imaging device (aSi-EPID) to capture every segment of the fluence map during the treatment. For each captured segment, the leaf positions for each pair of leaves are found by an edge detection algorithm; the fractional monitor unit (fMU) associated with this particular segment is also sampled. After all the segments have been analyzed, a leaf sequence (LS) file is reconstituted using the segmental leaf positions and their associated fMU based on the sequence the segments are delivered. The EPID-measured LS files can then be loaded to the treatment planning system (TPS) to derive the delivered fluence maps and reconstruct the delivered IMRT dose. aSi-EPIDs are geometrically and functionally stable, giving undistorted images of high resolution and contrast.15, 16 The proposed approach is based on the fact that the use of the aSi-EPID in measuring leaf end positions to a high degree of accuracy has been proven, leading to its widespread applications in MLC quality assurance,17, 18 leaf calibrations,19, 20 and leaf motion tracking.14, 21
The objective of this work is twofold: (1) To present a proof of feasibility and principles in reconstituting an EPID-measured LS file which serves the same purpose for deriving the delivered fluence map as a MLC log file does and (2) to demonstrate the dose reconstruction essential for adaptive radiation therapy using the delivered fluence maps literally calculated from the MLC segments captured by an EPID during an IMRT delivery.
METHODS AND MATERIALS
Description of the MLC and EPID
All experiments were done on a Trilogy linac (Varian Medical Systems, Palo Alto, CA) equipped with a Millennium 120-leaf MLC and kilovoltage∕megavoltage EPIDs. The Millennium 120-leaf MLC consists of two banks of 60 leaves. The leaf widths for the central 40 leaf pairs and the outer 10 leaf pairs are 0.5 and 1.0 cm, respectively. The leaves can travel a maximum of 16.5 cm across the beam central axis, and the maximum leaf span between the two leaves on the same carriage is 14.5 cm. All measurements are referred to the isocentric plane. The leaf calibration procedure recommended by Graves et al.22 was performed to ensure that the MLC indicated field edge positions agreed with the radiation field edges to within 0.3 mm before the experiments.23
The megavoltage (MV) EPID (Varian aS1000 flat panel detector) was used to acquire images for the experiments. The EPID is mounted on retractable arms attached to the gantry. It has a detector area of 40×30 cm2 with a matrix of 1024 by 768 pixels, resulting in a physical pixel size of 0.392 mm. The EPID consists of: (1) A 1.0-mm-thick copper plate for build-up, (2) a phosphor screen of gadolinium oxysulphide doped with terbium (Kodak Lanex Fast Screen) to convert incident radiation to visible photons, (3) a pixel array implanted on an amorphous silicon substratum where each pixel is made up of a photodiode and thin film transistor to convert the light photons to electric charges, and (4) electronics for readout. The electrical signals are digitized by a 14 bit analog-to-digital converter and processed into image data.
Geometric status of the EPID
Baker et al.19 and Parent et al.14 reported that a systematic tilt of the EPIDs was observed in their studies and indicated that it was likely to occur for all different EPIDs; Clarke and Budgell20 have also demonstrated the effect of the gantry angle on the EPID sag. Therefore, it is expected that the imaging geometry for the EPID at different gantry angles might deviate from an ideal configuration that we use as the basis for the measurement of the leaf end position. We need to establish the geometric status of the EPID before we can accurately measure the leaf end position from an EPID image. Recently, our group has developed a geometric quality assurance phantom and an automated analysis program (gQA tool) to study the geometric integrity of the on-board imager.24 This gQA tool was used in this work to study the changes in the overall imaging geometry of the EPID, including the source-to-imager distance (SID), the EPID center, and the tilt of the EPID for every 10° of a full rotation of the gantry. Based on the geometric information provided by the gQA tool, the maximum discrepancies for the SID, EPID center offset in either direction, and tilt were found to be 2.7 mm, 2.2 mm, and 1.4°, respectively. Positional corrections were incorporated into the measurement of the leaf end position.
Measurement of the leaf end position
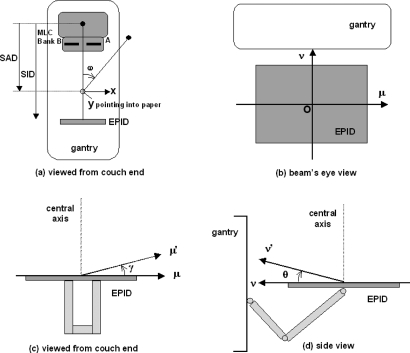
The coordinate systems used to describe the imaging geometry of the EPID are shown in Fig. 1. The (x,y) plane denotes the isocentric plane with the origin at the isocenter [Fig. 1a]. The (μ,ν) plane pertains to the EPID with the origin O at the center of the EPID [Fig. 1b]. Both the (x,y) and (μ,ν) planes rotate with the gantry angle ω. The μ′ and ν′ axes are defined for a tilted EPID; the angles γ and θ represent the tilt of the μ′ and ν′ axes, respectively [Figs. 1c, 1d].
Figure 1.
Coordinate systems describing the imaging geometry of the EPID. (a) Isocentric plane (x,y) and gantry angle ω as viewed from the couch end. (b) EPID (μ,ν) plane as viewed in the beam’s eye view. (c) EPID’s μ-axis tilt γ as viewed from the couch end. (d) EPID’s ν-axis tilt θ as viewed from the side. SAD: Source-to-axis distance; SID: Source-to-imager distance.
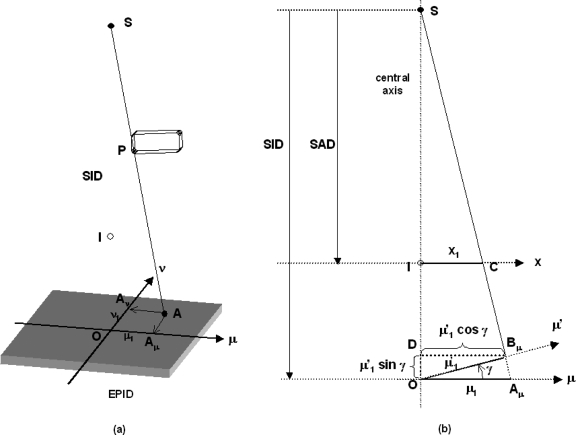
Suppose a leaf and P (assumed to be a point) is projected to A on the EPID plane (μ,ν) [Fig. 2a]. The projection of A on the μ and ν axes are Aμ and Aν, respectively. The distances of Aμ and Aν are at μ1 and ν1 from O, respectively. Now consider a vertical plane passing through the x-ray source (S), isocenter (I), and the point Aμ [Fig. 2b], and if we assume the imager is in perfect horizontal alignment; the position of the leaf end on the x axis of the isocentric plane can be calculated.
Figure 2.
Schematic diagrams showing the projection of a leaf end P on the EPID (μ,ν) plane (a) and the geometrical relationship of various parameters in the calculation of the leaf end position on the isocentric plane (b). SAD: Source-to-axis distance; SID: Source-to-imager distance.
From similar triangles SIC and SOAμ,
| (1) |
Similarly,
| (2) |
Now assume the imager is tilted to an angle γ, the leaf end is projected to a point B on the tilted EPID instead of A on the horizontal EPID. The projection of B on the μ axis is Bμ, which is at a distance of from O.
From similar triangles SDBμ and SOAμ, the position of the leaf end (μ1) on the μ axis can be found by
| (3) |
Using Eq. 1, the corresponding leaf end position on the x axis (x1) of the isocentric plane is
| (4) |
And if we further incorporate the EPID offset distance (dμ′) along the μ′ axis into Eq. 4, we have
| (5) |
Without loss of generality, the corresponding leaf end position on the y axis (y1) of the isocentric plane is
| (6) |
In a perfect imaging geometry where the tilts γ and θ equal to zero (μ′=μ; ν′=ν), and there are no offsets of the EPID center; Eqs. 5, 6 reduce to Eqs. 1, 2, respectively.
Experimental design and software development
A step-and-shoot IMRT field is made up of a number of segments; each segment is specified by prescribed leaf positions and a fraction of the total monitor units to be delivered for this segment. For the experiments, a step-and-shoot IMRT field with an open segment 10 cm long by 1 cm wide (“open gap” field) was designed to step through a distance of 10 cm from −5 to 5 cm on the x axis of the isocentric plane. Five MUs were assigned to each segment. The leaf motion was parallel to the μ axis of the imager. This IMRT field was delivered to a pelvic phantom (with a bony pelvis embedded) with its center aligned to the isocenter at a gantry angle of 0° (IEC scale). The 6 MV beam was used at a dose rate of 300 MU∕min. The EPID was positioned at a SID of 150 cm to ensure enough clearance for all gantry angles. During the IMRT delivery, EPID images were acquired in a cine mode at a frame rate of 6.7 frames per second (fps) and the acquisition was synchronized with the beam. Each captured frame was saved as a separate image. There was no user intervention during the whole acquisition process. In fact, for some segments with small MUs, only two images were captured. Since the acquisition was synchronized with the beam delivery, it was impossible to capture the end of one segment with the start of the next segment. However, due to the ghosting of the EPID, we did see occasionally some overlap of a segment with a very faint residual image from the previous segment, but this did not pose a problem because our software could easily distinguish the two by referring only the maximum gradients encountered. All EPID images were processed with the dark-field and flood-field corrections. The delivery was repeated three times at this angle and also at other orthogonal angles of 90°, 180°, and 270° in order to study the effect of gravity on the measurement of the leaf position from the EPID images.
A further experiment (“open air gap” experiment) was performed in exactly the same settings without the pelvic phantom in the beam in order to see whether the presence of a phantom in the open gap experiment would compromise the detection of the leaf end position due to the extra scatter or bony interface within the captured image.
An in-house program written in MatLab code (MathWorks, Inc., Natick, MA) was developed to reconstitute the EPID-measured LS file. The program first identifies different segments from a series of EPID images captured from the IMRT field by performing morphologic comparison. The same images of a segment are grouped together; the first and last images are taken as the starting and ending shapes for that particular segment. For each segment image, the positions of the leaf ends are searched near the penumbral regions by a maximum gradient edge detection algorithm in a scanline fashion for the pixel rows. The maximum gradient in intensity in the penumbral region of a portal image has been confirmed to correspond to the 50% intensity level25, 26 that depicts the dosimetric leaf edge.27 The pixel location (column number, row number) of the leaf end found is spatially converted and projected back to the isocentric plane with the positional corrections using Eqs. 5, 6. Only the pixel rows that correspond to the central one-third of the leaf are calculated to avoid the influence of the interleaf transmission;28 the final leaf end position is defined as an average of the positions of the leaf ends found from the set of pixel rows that belong to the same leaf.19, 28, 29 The leaf positions of each pair of MLC leaves for each segment image are then coupled with the fMU associated with that particular segment by referring to the synchronized beam on signal and cumulative MU sampled from the beam control circuitry and MLC workstation, respectively.25, 30 After all the segments in one delivered field have been analyzed, an EPID-measured LS file is reconstituted in a format readable by the TPS using the segmental leaf positions and fMU values. The EPID-measured LS file, which reflects the actual delivery, is then used to derive the delivered fluence map for dose reconstruction.
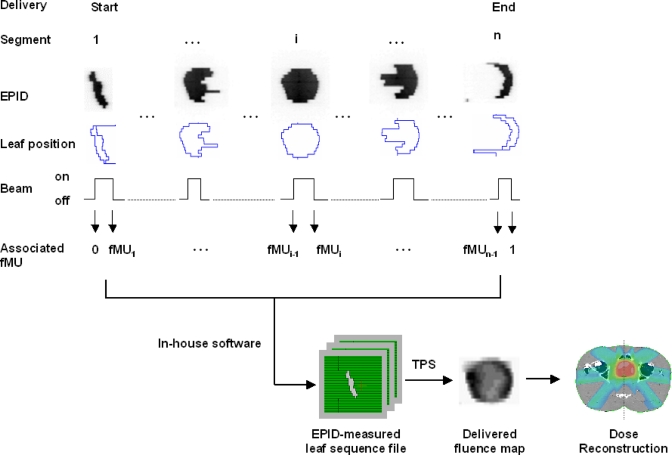
The measurement of fMU is independent of the frame rate used. The measurement is from the MLC control workstation and console electronics cabinet, whereas the frame rate is an acquisition parameter used in the portal vision. The EPID is only used to capture the leaf position in a segment; the corresponding fMU associated with a particular segment is supplied by the MLC workstation through the coupling of the beam holdoff signal. Since the IMRT delivery is in the step-and-shoot mode and the image acquisition is synchronized with the beam pulses, by referring to the beam holdoff (beam on and off interval), we can associate the cumulative MU sampled from the console electronics cabinet with a particular segment (Fig. 3). In the cine mode, the portal imager actually “waits” for the “beam on” signal to start acquiring the images at 6.7 fps; once the beam is held off during the movement of the leaves from one segment to another, the portal imager will stop acquiring. When the leaves reach their intended positions (within the tolerance) in the next segment, the beam will be activated again and so be the portal imager. This is exactly what we rely on to couple the fMU with a particular segment. All the required data are readily available if one has access to the appropriate ports of the MLC workstation and console electronics cabinet with the help of engineering personnel.
Figure 3.
Schematic diagram showing the workflow from the acquisition of the MLC segments to the dose reconstruction in the prostate IMRT delivery.
The efficacy of the developed software in measuring the leaf end position was assessed by comparing the measured and expected leaf end positions from the open gap field experiments. The differences in the leaf end positions calculated from the open gap and open air gap experiments were also studied.
Dose reconstruction
A typical prostate step-and-shoot IMRT plan with seven coplanar fields was copied from a patient case and applied to a pelvic phantom. The treatment was delivered to the pelvic phantom as in a real treatment on a Trilogy linac using the 6 MV photon beam at a dose rate of 300 MU∕min. EPID images were acquired during the entire delivery as described previously. For each delivered field, there were about 9–13 segments depending on the modulation of the fluence map, and there were about 4–6 EPID images captured for each individual segment, making a total of about 40–80 EPID images for each delivered field. A typical prostate IMRT would result in about 450 EPID images. These images were discarded once the analysis was done to save computer space. The EPID images were analyzed by the developed software, and the reconstituted LS files were loaded back to the ECLIPSE TPS (Varian Medical Systems, Palo Alto, CA) to derive the delivered fluence maps. The delivered and planned fluence maps were compared. Dose reconstruction was then performed on the pelvic phantom using the delivered fluence maps. The workflow is shown schematically in Fig. 3. Dose reconstruction was also performed using the planned fluence maps. The dose distributions from the two dose reconstructions on the three orthogonal planes through the isocenter and the corresponding dose volume histograms (DVHs) were compared. Note that the plan was not optimized for the pelvic phantom, it is merely used to show the difference in dose reconstruction from using the delivered against planned fluence maps.
RESULTS
Open gap and open air gap field experiments
For each MLC segment in the open gap field, the mean deviation (σ) of the leaves (leaf m to leaf n) forming the gap on each bank from their expected positions is defined as
| (7) |
where xi and xi,expected are the measured and expected leaf end positions of the ith leaf, respectively.
The mean deviations of the leaves for the ten segments (Banks B and A) delivered at the gantry angle 0° were about 0.6–1.0 mm and were reproducible for the three repeated measurements (Table 1). The mean deviations of the leaves for the ten segments (Banks B and A) delivered at the four principal orthogonal gantry angles were of the same order of magnitude (Table 2). However, we noticed that while the mean deviations for the gantry angle 270° were similar to that at the gantry angle 0°, the mean deviations for the gantry angles of 90° and 180° were found to be smaller (∼0.3–0.7 mm). Similar results were found for the open air gap experiment; data were not shown to avoid redundancy. Concerning these results, we did not find any discernible difference in the leaf end positions whether the phantom was present or not.
Table 1.
The mean deviations of the leaves (Banks B and A) for the ten segments of the open gap field delivered at the gantry angle 0° in three repeated deliveries.
| Delivery | Mean deviation of leaves (mm) from expected positions Segment | ||||||||||
|---|---|---|---|---|---|---|---|---|---|---|---|
| 1 | 2 | 3 | 4 | 5 | 6 | 7 | 8 | 9 | 10 | ||
| Bank B | 1 | 0.8 | 0.7 | 0.7 | 0.8 | 0.9 | 0.7 | 0.8 | 0.8 | 0.9 | 0.8 |
| 2 | 0.8 | 0.7 | 0.7 | 0.8 | 0.9 | 0.8 | 0.7 | 0.8 | 0.9 | 0.8 | |
| 3 | 0.8 | 0.6 | 0.7 | 0.8 | 0.9 | 0.7 | 0.8 | 0.8 | 0.9 | 0.8 | |
| Bank A | 1 | 0.8 | 0.8 | 0.8 | 0.8 | 1.0 | 0.8 | 0.8 | 0.9 | 0.9 | 1.0 |
| 1 | 0.8 | 0.7 | 0.8 | 0.8 | 1.0 | 0.9 | 0.8 | 1.0 | 1.0 | 1.0 | |
| 3 | 0.8 | 0.7 | 0.8 | 0.8 | 1.0 | 0.9 | 0.9 | 1.0 | 0.9 | 0.9 | |
Table 2.
The mean deviations of the leaves (Banks B and A) for the ten segments of the open gap field delivered at the four principal orthogonal gantry angles.
| Gantry (deg) | Mean deviation of leaves (mm) from expected positions Segment | ||||||||||
|---|---|---|---|---|---|---|---|---|---|---|---|
| 1 | 2 | 3 | 4 | 5 | 6 | 7 | 8 | 9 | 10 | ||
| Bank B | 0 | 0.8 | 0.7 | 0.7 | 0.8 | 0.9 | 0.7 | 0.8 | 0.8 | 0.9 | 0.8 |
| 90 | 0.4 | 0.4 | 0.5 | 0.5 | 0.7 | 0.5 | 0.5 | 0.6 | 0.5 | 0.6 | |
| 180 | 0.3 | 0.5 | 0.5 | 0.7 | 0.6 | 0.6 | 0.6 | 0.7 | 0.7 | 0.6 | |
| 270 | 0.8 | 0.7 | 0.7 | 1.0 | 0.9 | 0.7 | 0.8 | 0.8 | 0.8 | 0.8 | |
| Bank A | 0 | 0.8 | 0.8 | 0.8 | 0.8 | 1.0 | 0.8 | 0.8 | 0.9 | 0.9 | 1.0 |
| 90 | 0.4 | 0.4 | 0.5 | 0.5 | 0.7 | 0.5 | 0.5 | 0.5 | 0.6 | 0.4 | |
| 180 | 0.4 | 0.5 | 0.6 | 0.7 | 0.6 | 0.6 | 0.7 | 0.6 | 0.7 | 0.7 | |
| 270 | 0.8 | 0.7 | 0.8 | 0.8 | 0.8 | 0.7 | 0.8 | 0.7 | 0.8 | 0.8 | |
Prostate IMRT delivery: MLC segments captured by EPID
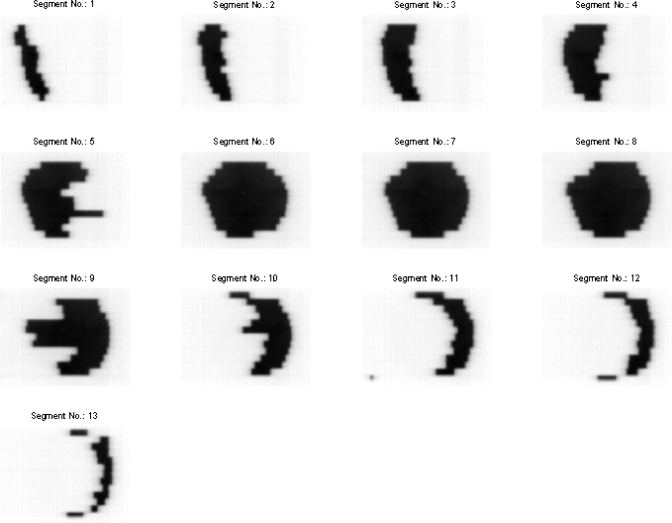
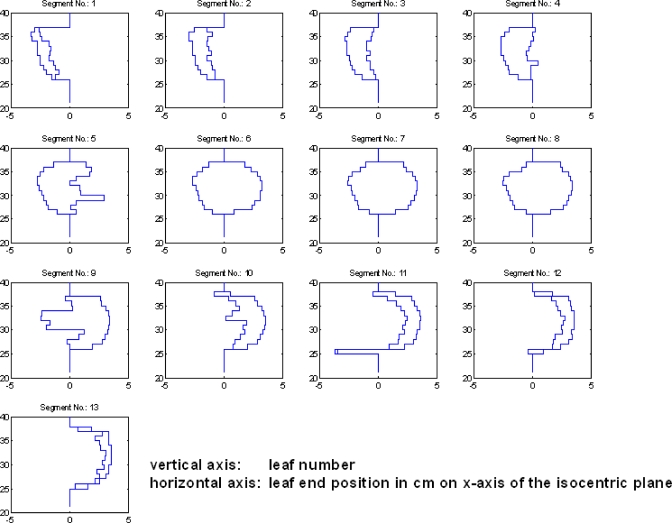
Figure 4 shows a series of 13 segments (only the first image of each segment is shown) captured by the EPID for the delivered field at the gantry angle 0° in the prostate IMRT delivery. The corresponding leaf end positions calculated by the developed software for each individual segment are shown in Fig. 5. The calculated leaf end positions were well within 1.0 mm of their expected positions.
Figure 4.
A series of 13 MLC segments captured by the EPID for the delivered field at the gantry angle 0° for the prostate IMRT delivery.
Figure 5.
A series of leaf end positions for each individual MLC segment from Fig. 4.
Derivation of fluence maps and dose reconstruction
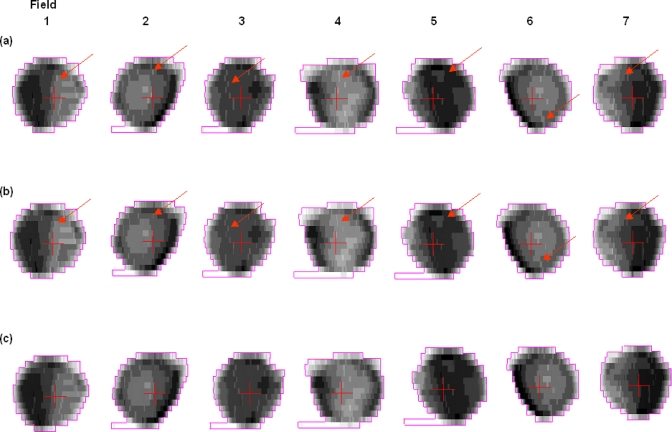
The delivered fluence maps derived from the EPID-measured LS files for the seven IMRT fields are shown in Fig. 6b; there were slight differences (arrows) in the intensity levels when compared to the corresponding planned fluence maps from the original plan [Fig. 6a]. Fluence maps directly reconstructed from the MLC log files are also displayed in Fig. 6c for comparison. It was found that the fluence maps derived from the EPID-measured LS files could faithfully depict those reconstructed from the MLC log files.
Figure 6.
(a) Planned fluence maps. (b) Delivered fluence maps from EPID-measured leaf sequence files. The differences in the intensity levels between the planned and delivered fluence maps are highlighted by the arrows. No discernible difference is seen between the delivered fluence maps and those directly reconstructed from the MLC log files (c).
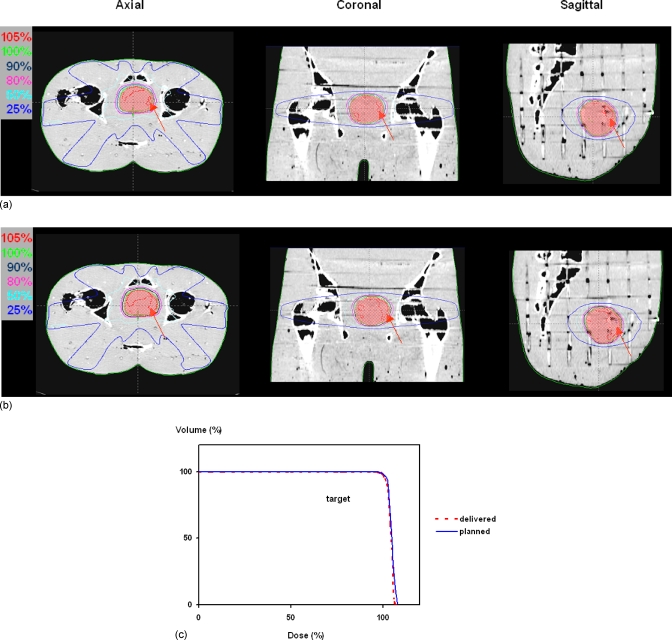
The dose reconstruction using the delivered fluence maps showed no discernible difference for all the isodose lines except the one for the 105% when compared to the expected dose distribution (Fig. 7). The volumes pertaining to a dose level of 105% or above were 12 and 27 cm3 for the delivered and expected dose distributions, respectively. The maximum dose in the delivered dose distribution was 2.5% lower than that in the expected dose distribution. The DVHs of the targets from the two dose reconstructions essentially overlapped with each other except at the high dose regions, which are consistent with the difference seen in the dose distributions.
Figure 7.
(a) Delivered dose distribution calculated with fluence maps derived from EPID-measured leaf sequence files. (b) Expected dose distribution calculated with planned fluence maps. The differences in the dose distribution (105% level) between the delivered and expected dose distributions for the three orthogonal planes are highlighted by the arrows. (c) The DVHs of the targets from the two dose reconstructions essentially overlapped each other except at the dose level beyond 105%.
DISCUSSION
We have shown the feasibility in reconstituting an EPID-measured LS file and using it to derive the delivered fluence map for dose reconstruction. The approach is equivalent to using the MLC log files for dose reconstruction11, 13 and yet avoids the dependency of the recorded leaf positions on the leaf calibration. The algorithm of detecting the leaf end position is, in principle, independent of the EPID used. The principle of obtaining the dose information can easily be adopted for linacs of other vendors provided that the console electronics cabinet has an interface to assess the beam holdoff signal and cumulative MU.
At the outset, our main concern was the influence of EPID sag and tilt at different gantry angles on the measurement of the leaf end position. Clark and Budgell20 and Woo et al.30 have solved this problem by calibration techniques. Using the developed gQA tool, we were able to quantify the EPID sag and tilt and incorporate this information in the calculation of the leaf end positions.24 The use of the present approach is limited by the projected field size on the EPID, which is 20×26 cm2 at the isocentric plane.
From the results of the open gap field experiments, we found that the mean deviation of the leaves was about 0.6–1.0 mm, which was expected of a MLC-based IMRT delivery28, 31 taking into account that (1) a tolerance of 1.5 mm in the leaf position was allowed during the actual delivery, (2) the associated image noise somewhat compromised the accurate measurement of the leaf end at the penumbral region, and (3) the slight effect of leaf sagging at various gantry angles.20 The projected pixel size at the isocentric plane is 0.26 mm, which means that the mean deviation was about 4 pixels. We found that the mean deviations of the leaves at gantry angles of 90° and 180° (∼0.6 mm) were in general smaller than that at the gantry angles 0° and 270°, and there was no discernible difference in the mean deviations for the two different banks when the gantry was horizontally placed (gantry angles of 90° and 270°). Under the present experimental setup, the data we acquired were insufficient to explain this phenomenon; one possible explanation could be that the routine leaf calibration is done at the gantry angle 0° and it might deviate from the ideal scenario at other gantry angles. Moreover, a smaller mean deviation does not necessarily mean it is more accurate in the leaf position at these gantry angles; it simply means the condition of the leaf positioning was different from that at gantry angles of 0° and 180°.
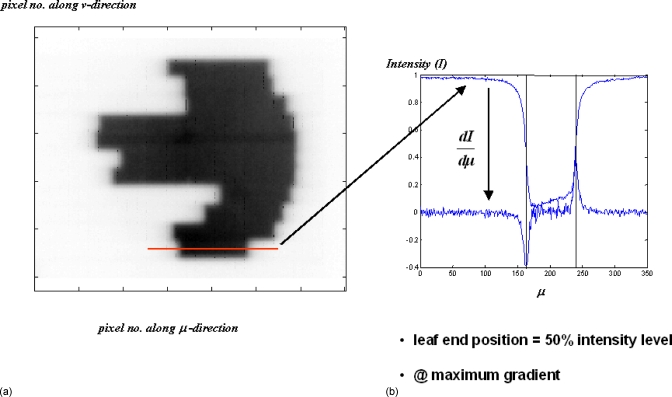
This work is designed to capture the segments in real time with a patient in the beam during the actual delivery. The predeposited condition is that a patient is always present; in fact, the presence of the patient (or the phantom) does not compromise the detection of the leaf ends in our algorithm using the maximum gradient search. The edge detection algorithm is applicable in open fields or fields with patient anatomy. The main reason being the poor image contrast in the MV energy range; even at the bone–soft tissue interface, the gradient is much smaller than at the penumbral region where there is a maximum transition from a region of background noise to an irradiated region. The poor contrast also explains why the bony details are not seen in the EPID images. An EPID image is shown in Fig. 8 to demonstrate the poor contrast and the magnitude of the order of the gradient encountered at the field edge and within the field where there was actually some bony anatomy.
Figure 8.
(a) Due to the poor image contrast in MV energy range, the bony structures (present in the pelvic phantom) are hardly seen in the image. (b) The gradients encountered at the leaf ends overwhelm all other gradients that would otherwise be present due to any bony interfaces.
In the comparison of the delivered fluence maps with the planned ones, the differences in the intensity levels seen were attributable to the combined effect of leaf deviations in each of the contributing segments and the inherent fMU redistribution;8, 13 the dosimetric impact of these differences was reflected in the dose reconstruction using the delivered fluence maps. The differences in the 105% isodose level and the maximum dose between the delivered and expected dose distributions indicate that a need for employing the delivered rather than planned fluence maps for dose reconstruction in ART is warranted.
Unfortunately, the present technique does not work for dynamic delivery (sliding window). Since we rely on the beam holdoff signal while the leaves are stepping across to determine the fMU association with each segment, we have not yet figured out how we can associate a fMU with an ever-changing segment in the sliding window delivery.
One might argue that dose reconstruction should be accomplished by in vivo exit portal dosimetry,32, 33 but the technique is still in its development and impeded by some confounding issues such as dosimetric nonlinearities of the aSi-EPID17, 34 that require tedious calibration and correction35 and the correction of scatter from the patient.32 Our approach is developed along the line of using MLC log files for dose reconstruction and based on a well-proven superiority of aSi-EPID in spatial determination of the leaf end position;14, 19, 20, 21 it is straightforward and easy to implement at a clinic. In addition, the proposed approach is equally well suited for IMRT dose verification and quality assurance purposes.
CONCLUSIONS
This paper presented a proof of the feasibility and principles in reconstituting a leaf sequence file that reflects the actual delivery of an IMRT based on the MLC segments captured by an EPID. This EPID-measured LS file can serve the same purpose as a MLC log file does for the derivation of the delivered fluence map and is independent of the leaf calibration. The approach also allows users who do not have access to MLC log files to probe the actual IMRT delivery and translate the information gained for dose reconstruction in ART.
ACKNOWLEDGMENTS
Support from the Sir Robert Black Postdoctoral Fellowship and the Hong Kong Hospital Authority Overseas Training Allowance for the first author are gratefully acknowledged. This work is also supported in part by grants from the Varian Medical Systems, Department of Defense (No. W81XWH-05-1-0041) and National Cancer Institute (No. 5R01 CA98523). The authors would also like to thank Mark Wanlass and Bill Cheng, our linac engineers, for offering technical support and advice on the control of the linac and MLC.
References
- Webb S., “Adapting IMRT delivery fraction-by-fraction to cater for variable intrafraction motion,” Phys. Med. Biol. 10.1088/0031-9155/53/1/001 53, 1–21 (2008). [DOI] [PubMed] [Google Scholar]
- de la Zerda A., Armbruster B., and Xing L., “Formulating adaptive radiation therapy (ART) treatment planning into a closed-loop control framework,” Phys. Med. Biol. 10.1088/0031-9155/52/14/008 52, 4137–4153 (2007). [DOI] [PubMed] [Google Scholar]
- Yan D., Vicini F., Wong J., and Martinez A., “Adaptive radiation therapy,” Phys. Med. Biol. 10.1088/0031-9155/42/1/008 42, 123–132 (1997). [DOI] [PubMed] [Google Scholar]
- Yan D., Wong J., Vicini F., Michalski J., Pan C., Frazier A., Horwitz E., and Martinez A., “Adaptive modification of treatment planning to minimize the deleterious effects of treatment setup errors,” Int. J. Radiat. Oncol., Biol., Phys. 10.1016/S0360-3016(97)00229-0 38, 197–206 (1997). [DOI] [PubMed] [Google Scholar]
- Yoo S. and Yin F. F., “Dosimetric feasibility of cone-beam CT-based treatment planning compared to CT-based treatment planning,” Int. J. Radiat. Oncol., Biol., Phys. 10.1016/j.ijrobp.2006.08.031 66, 1553–1561 (2006). [DOI] [PubMed] [Google Scholar]
- Yang Y., Schreibmann E., Li T., Wang C., and Xing L., “Evaluation of on-board kV cone beam CT (CBCT)-based dose calculation,” Phys. Med. Biol. 10.1088/0031-9155/52/3/011 52, 685–705 (2007). [DOI] [PubMed] [Google Scholar]
- Langen K. M., Meeks S. L., Poole D. O., Wagner T. H., Willoughby T. R., Kupelian P. A., Ruchala K. J., Haimerl J., and Olivera G. H., “The use of megavoltage CT (MVCT) images for dose recomputations,” Phys. Med. Biol. 10.1088/0031-9155/50/18/002 50, 4259–4276 (2005). [DOI] [PubMed] [Google Scholar]
- Xia P., Chuang C. F., and Verhey L. J., “Communication and sampling rate limitations in IMRT delivery with a dynamic multileaf collimator system,” Med. Phys. 10.1118/1.1449496 29, 412–423 (2002). [DOI] [PubMed] [Google Scholar]
- Wiersma R. D. and Xing L., “Examination of geometric and dosimetric accuracies of gated step-and-shoot intensity modulated radiation therapy,” Med. Phys. 10.1118/1.2776671 34, 3962–3970 (2007). [DOI] [PubMed] [Google Scholar]
- Litzenberg D. W., Hadley S. W., Tyagi N., Balter J. M., Ten Haken R. K., and Chetty I. J., “Synchronized dynamic dose reconstruction,” Med. Phys. 10.1118/1.2388157 34, 91–102 (2007). [DOI] [PubMed] [Google Scholar]
- Lee L., Le Q. T., and Xing L., “Retrospective IMRT dose reconstruction based on cone-beam CT and MLC log-file,” Int. J. Radiat. Oncol., Biol., Phys. 70, 634–644 (2008). [DOI] [PubMed] [Google Scholar]
- Li J. G., Dempsey J. F., Ding L., Liu C., and Palta J. R., “Validation of dynamic MLC-controller log files using a two-dimensional diode array,” Med. Phys. 10.1118/1.1567951 30, 799–805 (2003). [DOI] [PubMed] [Google Scholar]
- Stell A. M., Li J. G., Zeidan O. A., and Dempsey J. F., “An extensive log-file analysis of step-and-shoot intensity modulated radiation therapy segment delivery errors,” Med. Phys. 10.1118/1.1751011 31, 1593–1602 (2004). [DOI] [PubMed] [Google Scholar]
- Parent L., Seco J., Evans P. M., Dance D. R., and Fielding A., “Evaluation of two methods of predicting MLC leaf positions using EPID measurements,” Med. Phys. 10.1118/1.2335490 33, 3174–3182 (2006). [DOI] [PubMed] [Google Scholar]
- Menon G. V. and Sloboda R. S., “Quality assurance measurements of a-Si EPID performance,” Med. Dosim. 29, 11–17 (2004). [DOI] [PubMed] [Google Scholar]
- McCurdy B. M., Luchka K., and Pistorius S., “Dosimetric investigation and portal dose image prediction using an amorphous silicon electronic portal imaging device,” Med. Phys. 10.1118/1.1374244 28, 911–924 (2001). [DOI] [PubMed] [Google Scholar]
- Budgell G. J., Zhang Q., Trouncer R. J., and Mackay R. I., “Improving IMRT quality control efficiency using an amorphous silicon electronic portal imager,” Med. Phys. 10.1118/1.2074227 32, 3267–3278 (2005). [DOI] [PubMed] [Google Scholar]
- Chang J., Obcemea C. H., Sillanpaa J., Mechalakos J., and Burman C., “Use of EPID for leaf position accuracy QA of dynamic multi-leaf collimator (DMLC) treatment,” Med. Phys. 10.1118/1.1760187 31, 2091–2096 (2004). [DOI] [PubMed] [Google Scholar]
- Baker S. J., Budgell G. J., and MacKay R. I., “Use of an amorphous silicon electronic portal imaging device for multileaf collimator quality control and calibration,” Phys. Med. Biol. 10.1088/0031-9155/50/7/003 50, 1377–1392 (2005). [DOI] [PubMed] [Google Scholar]
- Clarke M. F. and Budgell G. J., “Use of an amorphous silicon EPID for measuring MLC calibration at varying gantry angle,” Phys. Med. Biol. 10.1088/0031-9155/53/2/013 53, 473–485 (2008). [DOI] [PubMed] [Google Scholar]
- Sonke J. J., Ploeger L. S., Brand B., Smitsmans M. H., and van Herk M., “Leaf trajectory verification during dynamic intensity modulated radiotherapy using an amorphous silicon flat panel imager,” Med. Phys. 10.1118/1.1639125 31, 389–395 (2004). [DOI] [PubMed] [Google Scholar]
- Graves M. N., Thompson A. V., Martel M. K., McShan D. L., and Fraass B. A., “Calibration and quality assurance for rounded leaf-end MLC systems,” Med. Phys. 10.1118/1.1413517 28, 2227–2233 (2001). [DOI] [PubMed] [Google Scholar]
- Yang Y. and Xing L., “Quantitative measurement of MLC leaf displacements using an electronic portal image device,” Phys. Med. Biol. 10.1088/0031-9155/49/8/010 49, 1521–1533 (2004). [DOI] [PubMed] [Google Scholar]
- Mao W., Lee L., and Xing L., “Development of a QA phantom and automated analysis tool for geometric quality assurance of on-board MV and kV x-ray imaging systems,” Med. Phys. 10.1118/1.2885719 35(4), 1497–1506 (2008). [DOI] [PMC free article] [PubMed] [Google Scholar]
- Partridge M., Evans P. M., Mosleh-Shirazi A., and Convery D., “Independent verification using portal imaging of intensity-modulated beam delivery by the dynamic MLC technique,” Med. Phys. 10.1118/1.598376 25, 1872–1879 (1998). [DOI] [PubMed] [Google Scholar]
- Bijhold J., Gilhuijs K. G., van Herk M., and Meertens H., “Radiation field edge detection in portal images,” Phys. Med. Biol. 10.1088/0031-9155/36/12/015 36, 1705–1710 (1991). [DOI] [PubMed] [Google Scholar]
- ICRU, Report No. 24, 1976. (unpublished).
- Vieira S. C., Dirkx M. L., Pasma K. L., and Heijmen B. J., “Fast and accurate leaf verification for dynamic multileaf collimation using an electronic portal imaging device,” Med. Phys. 10.1118/1.1501141 29, 2034–2040 (2002). [DOI] [PubMed] [Google Scholar]
- James H. V., Atherton S., Budgell G. J., Kirby M. C., and Williams P. C., “Verification of dynamic multileaf collimation using an electronic portal imaging device,” Phys. Med. Biol. 10.1088/0031-9155/45/2/316 45, 495–509 (2000). [DOI] [PubMed] [Google Scholar]
- Woo M. K., Lightstone A. W., Shan G., Kumaraswamy L., and Li Y., “Automatic verification of step-and-shoot IMRT field segments using portal imaging,” Med. Phys. 10.1118/1.1544680 30, 348–351 (2003). [DOI] [PubMed] [Google Scholar]
- Eilertsen K., “Automatic detection of single MLC leaf positions with corrections for penumbral effects and portal imager dose rate characteristics,” Phys. Med. Biol. 10.1088/0031-9155/42/2/005 42, 313–334 (1997). [DOI] [PubMed] [Google Scholar]
- McDermott L. N., Wendling M., Nijkamp J., Mans A., Sonke J. J., Mijnheer B. J., and van Herk M., “3D in vivo dose verification of entire hypo-fractionated IMRT treatments using an EPID and cone-beam CT,” Radiother. Oncol. 10.1016/j.radonc.2007.11.010 86, 35–42 (2008). [DOI] [PubMed] [Google Scholar]
- van Elmpt W. J., Nijsten S. M., Dekker A. L., Mijnheer B. J., and Lambin P., “Treatment verification in the presence of inhomogeneities using EPID-based three-dimensional dose reconstruction,” Med. Phys. 10.1118/1.2742778 34, 2816–2826 (2007). [DOI] [PubMed] [Google Scholar]
- McDermott L. N., Nijsten S. M., Sonke J. J., Partridge M., van Herk M., and Mijnheer B. J., “Comparison of ghosting effects for three commercial a-Si EPIDs,” Med. Phys. 10.1118/1.2207318 33, 2448–2451 (2006). [DOI] [PubMed] [Google Scholar]
- Nijsten S. M., van Elmpt W. J., Jacobs M., Mijnheer B. J., Dekker A. L., Lambin P., and Minken A. W., “A global calibration model for a-Si EPIDs used for transit dosimetry,” Med. Phys. 10.1118/1.2776244 34, 3872–3884 (2007). [DOI] [PubMed] [Google Scholar]


