Abstract
A system with potential for middle-ear screening and diagnostic testing was developed for the measurement of wideband energy absorbance (EA) in the ear canal as a function of air pressure, and tested on adults with normal hearing. Using a click stimulus, the EA was measured at 60 frequencies between 0.226 and 8 kHz. Ambient-pressure results were similar to past studies. To perform tympanometry, air pressure in the ear canal was controlled automatically to sweep between −300 and 200 daPa (ascending∕descending directions) using sweep speeds of approximately 75, 100, 200, and 400 daPa∕s. Thus, the measurement time for wideband tympanometry ranged from 1.5 to 7 s and was suitable for clinical applications. A bandpass tympanogram, calculated for each ear by frequency averaging EA from 0.38 to 2 kHz, had a single-peak shape; however, its tympanometric peak pressure (TPP) shifted as a function of sweep speed and direction. EA estimated at the TPP was similar across different sweep speeds, but was higher below 2 kHz than EA measured at ambient pressure. Future studies of EA on normal ears of a different age group or on impaired ears may be compared with the adult normal baseline obtained in this study.
INTRODUCTION
Tympanometry refers to the measurement of an acoustic transfer function in the ear canal in response to a sound stimulus while air pressure is varied in the ear canal. Most commonly, the stimuli used in tympanometry are pure tones and the transfer function is the admittance. A tympanogram is often displayed as a plot of admittance magnitude as a function of air pressure. Alternatively, the real part (i.e., conductance) and the imaginary part (i.e., susceptance) of acoustic admittance are displayed. Tympanometric measurement of acoustic admittance, using a 226-Hz stimulus, is a standard procedure in audiology to assess middle-ear functioning (e.g., Margolis and Hunter, 2000). While differing in their degree of diagnostic relevance, commonly evaluated tympanometric measures include tympanometric peak pressure (TPP), peak-compensated static acoustic admittance, acoustic equivalent volume, and tympanometric width (ASHA, 1997; Nozza et al., 1994; Shanks et al., 1988). Patterns in conductance and susceptance tympanograms obtained at 678 Hz and 1 kHz can also be used to identify various middle-ear pathologies (Vanhuyse, 1975; Margolis and Hunter, 2000). At frequencies higher than 2 kHz, however, admittance tympanometry becomes sensitive to probe insertion depth due to the presence of standing waves in the ear canal (Margolis et al., 1999).
The goal of the present study was to develop a clinically useful system for the measurement of wideband (0.226–8 kHz) aural acoustic transfer functions under both ambient-pressure and tympanometric conditions, and to assess its performance in normal-hearing adult ears.1 A transfer function of particular interest is energy reflectance (ER), defined as the ratio of the reflected to the incident energy. Because ER is nearly independent of probe-insertion depth (Stinson et al., 1982; Voss et al., 2008)—except for effects due to spatial variation in the cross-sectional area of the ear canal—it is interpretable in a wider frequency range than is acoustic admittance obtained using standard procedures.
A system for wideband reflectance measurements, which did not require changes in ear-canal pressure, was developed for use in clinical studies (Keefe et al., 1992). At ambient pressure, ER and other acoustic transfer functions have been measured at the probe tip in normal-hearing adults (Keefe et al., 1993; Voss and Allen, 1994; Feeney and Sanford, 2004; Shahnaz and Bork, 2006), children and infants (Keefe et al., 1993; Vander Werff et al., 2007), and newborns (Keefe et al., 2000). At ambient pressure, ER also demonstrated systematic shifts in the presence of middle-ear disorders including otitis media with effusion (Piskorski et al., 1998; Feeney et al., 2003), as well as otosclerosis, ossicular discontinuity, and perforation of the tympanic membrane (Feeney et al., 2003). The sensitivity of ear-canal impedance to a perforation of the tympanic membrane has also been described (Voss et al., 2001).
It has been demonstrated that wideband ER tympanometry, which measures ER as a joint function of frequency and air pressure (Keefe and Levi, 1996), reveals more information than does an ER test at ambient pressure (Margolis et al., 1999, Sanford and Feeney, 2008). In this paper, results of ambient and tympanometric measurements are mainly presented in terms of energy absorbance (EA). EA is the ratio of acoustic energy that is absorbed by the middle ear and ear canal2 to the acoustic energy of an incident sound presented in the ear canal and directed towards the tympanic membrane. In the limit that the walls or other structures of the ear canal absorb no sound energy, the EA is the fraction of incident energy absorbed by the middle ear. Given its definition as a ratio, EA is dimensionless and varies between 0 and 1. Through conservation of energy, EA and ER are related by EA=1−ER. Such a simple change in variable is worthwhile because an EA tympanogram in a healthy adult middle ear, like a 226-Hz admittance-magnitude tympanogram, has a single peak in its response across air pressure. This makes EA clinically familiar and may contribute to ease of interpretation.
Wideband EA tympanograms have been used to predict the presence of a conductive hearing loss (Keefe and Simmons, 2003), but the measurement system was unable to track the accuracy of the air-pressure steps. In that and other past studies, wideband tympanometry has been conducted at fixed static-pressure steps; the pressure was controlled either manually (Margolis et al., 1999) or via signals delivered by a computer to an external pressure pump. Data-acquisition time was typically 40 s for 15 steps between 300 and −300 daPa (Keefe and Simmons, 2003). This long measurement time was inconvenient for clinical usage, and the sparse sampling of static pressure limited the accuracy of wideband tympanograms.
The present study aimed to: (1) shorten the data-acquisition time for wideband tympanometry by sweeping the air pressure; (2) include automatic feedback control of air pressure in the ear canal; (3) examine the effect of pressure sweeps that might affect the interpretation of results in relation to middle-ear mechanics (Decraemer et al., 1984; Gaihede et al., 2000; Therkildsen et al., 2005; Dirckx et al., 2006); and (4) maintain adequate resolution in both frequency and ear-canal pressure. New measurement procedures were developed, including new signal-processing and artifact-rejection methods. Ambient and tympanometric measurements were conducted on 92 adult ears with normal hearing to provide a set of baseline responses to which subsequent measurements in impaired middle ears can be compared. The effects of pressure-sweep speed and direction on the measurements were analyzed. The remainder of this paper is organized as follows: System development, data analyses, and subject inclusion criteria are described in Sec. 2. Results of ambient and tympanometric measurements are reported in Sec. 3. Effects of pressure sweeps are discussed in Sec. 4. Conclusions are given in Sec. 5.
METHODS
Configuration of the instrument
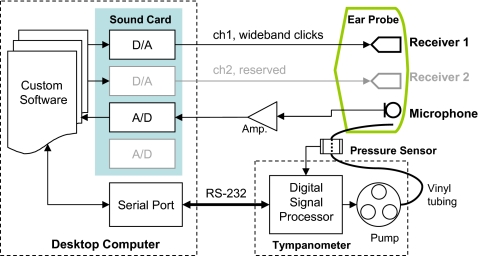
A schematic diagram of the instrument is shown in Fig. 1. The sound card (CardDeluxe, Digital Audio Labs) supported two digital-to-analog (D∕A) and two analog-to-digital (A∕D) channels. The D∕A and A∕D converters both had 24 bits of resolution. The sampling rate was 22.05 kHz, sufficient to permit spectral measurements up to 8 kHz. The custom ear probe (Interacoustics) had two receiver ports and one microphone port. Only one receiver was used in the present study for delivering the click stimuli. Acoustic responses were recorded by the probe microphone, amplified, and digitized by the A∕D converter. Between 0.226 and 8 kHz, the sensitivity of the probe microphone was within ±10 dB relative to the sensitivity at 1 kHz, according to the manufacturer calibration. This calibration was applied to calculations of sound-pressure level (SPL).
Figure 1.
Schematic diagram of instrumentation.
Air pressure was coupled from the pump residing in the tympanometer (an AT235, Interacoustics, with modified firmware by the manufacturer to permit computer control of pressure sweeps) to the ear probe through approximately 2 m of vinyl tubing (Fig. 1). A pressure sensor was located about halfway between the pressure pump and the ear probe. The vinyl tubing had an internal diameter of approximately 1.5 mm. Precision of air-pressure measurement was 1 daPa, and the air pressure was measured with respect to atmospheric pressure. Rubber tips of different sizes, ranging from 6 to 18 mm diameter, could be selected to mount on the ear probe, so as to fit within the ear canal and achieve a pressure seal. When recording acoustic responses, air pressure values were read from the sensor every 25 ms by the digital signal processor (DSP) and delivered to the computer via an RS-232 serial port connection. The computer determined the desired pressure-sweep speed based on the measured air pressures, and sent commands to the DSP via the serial port to adjust the pressure pump. The entire pressure-control system, when terminated with a syringe of approximately 2 cm3 and pumped to 300 daPa initially, maintained more than 90% of the air pressure (i.e., >270 daPa) for approximately 70 s without the need to repressurize.
Energy absorbance measurements at ambient pressure
Wideband clicks were delivered to the receiver (ch1 in Fig. 1) repeatedly, responses were recorded, artifacts were rejected, and sound-pressure reflectance and EA were calculated. The click rate was one click per 1024 samples, or approximately every 46 ms. The total number of clicks was 16 for each trial. The pressure-control system was not used for ambient measurements.
Stimulus design and responses in calibration tubes
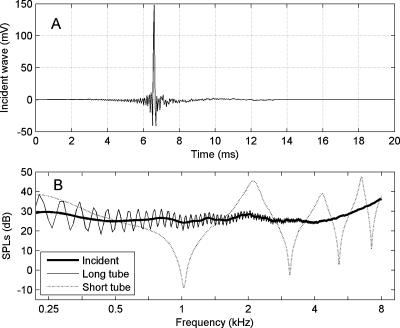
The click stimulus was designed using a technique adapted from Agulló et al. (1995) so that the magnitude spectrum of the incident sound in the ear canal was approximately flat from 0.226 to 8 kHz and the effective waveform duration was as short as possible. The incident waveform was measured by recording its response in a long tube (diameter 0.794 cm, length 292 cm), and then truncating the response in the time domain prior to the onset of the first reflection from the opposite closed end of the tube. This incident voltage waveform recorded by the A∕D converter is plotted in Fig. 2a. After calculating its discrete Fourier transform (DFT) and applying the microphone sensitivity calibration, the SPL of responses measured in the long tube and in a short calibration tube (diameter 0.794 cm, length 8.2 cm) closed at its opposite end are shown in Fig. 2b. The incident click SPL was within 6 dB of 30 dB SPL from 0.226 to 8 kHz. The SPL spectrum in each tube had notches close to frequencies at which the tube length was equal to an odd multiple of a quarter wavelength. The measurements in the calibration tubes along with a model of viscothermal wall loss in each tube were used to calibrate the system for aural acoustic transfer function measurements; in particular, the incident pressure spectrum Q(f) and the source reflectance R0(f) of the probe were calculated according to procedures described by Keefe and Simmons (2003). Calibrations were performed daily during data collection.
Figure 2.
A typical result of probe calibration. (A) The incident sound recorded by A∕D. (B) SPL spectra of the incident wave and the frequency responses in the two calibration tubes.
Estimation of energy absorbance from sound-pressure responses
After the probe was inserted, the click stimulus was repetitively output into the ear canal by a probe receiver. Acoustic responses were synchronously recorded by the probe microphone. Responses were averaged after excluding the responses contaminated by artifact (as described below). The pressure reflectance R(f) at frequency f in the ear canal is calculated using the following equation (Keefe and Simmons, 2003),
| (1) |
where P(f) denotes the mean of the sound-pressure spectrum. In this paper, results of experiments will be reported and analyzed in terms of EA, defined as
| (2) |
Accuracy of the measurement of EA depended on the signal-to-noise ratio (SNR), which could be improved by averaging the responses to clicks. However, during the measurement, transient noise produced by the subject or other sources was also recorded by the probe microphone. Sources of intermittent noise included, but were not limited to, breathing, swallowing, and body contact with the vinyl tube. The SNR was improved by identifying and rejecting such artifacts before calculating the mean response.
Artifact rejection based on median-absolute-deviation tests
To identify responses that contained artifacts, the following auxiliary variables were calculated for each response:
-
(a)
Peak-to-peak amplitude, defined as , where y(k)[n] (n=1,…,1024) denotes the recorded pressure response to the kth click at sample n. This peak-to-peak amplitude was sensitive to large-amplitude intermittent noise spikes that might occur anywhere in the response buffer.
-
(b)
Crest value, defined as . Calculation of the maximum value and the root-mean-squared (rms) value for the kth response was based on all samples except for 200 samples (9 ms approximately) surrounding the main response. This crest value was sensitive to intermittent noise transients at times for which the click response was expected to be essentially absent.
-
(c)Noise energy. After recording 16 responses, the noise energy E in each response was calculated as the sum of square errors,
(3) where denotes the mean response across 16 clicks. This noise energy was sensitive to a noise source that was approximately stationary over the entire response buffer.
The median of was calculated across all buffers (k=1,…,16), and the medians of C(k) and of E(k) were calculated in a similar manner. For each response, absolute deviations from the median were defined as , , and . Then, medians of the absolute deviations (MAD), denoted as , , and , were calculated across 16 responses. Finally, an individual response was rejected due to artifacts if any of its auxiliary variables was more than 5.92 times MAD away from the median; in other words, if
| (4) |
The specific choice of criteria in Eq. 4 is such that, were the data to be normally distributed, the probability that an absolute deviation exceeds 5.92 times MAD would be equal to the probability that a far outlier occurs according to the definition of Tukey (1977). Thus, this choice of MAD outlier criterion behaves similarly to the far-outlier test criterion in exploratory statistical analyses using the boxplot whenever data are normally distributed. The MAD test has desirable properties for artifact rejection for measurements that are not normally distributed; such distributions often occur in aural acoustic responses in human subjects.
Wideband absorbance tympanometry
Pressure-sweep settings and data-acquisition protocols
The desired tympanometric pressure range was −300 to 200 daPa in this study. The enclosed volume in the ear canal was initially pressurized to 220 daPa (for a descending sweep) or −315 daPa (for an ascending sweep) relative to the ambient pressure, before the pressure sweep started. The initial pressure was chosen to be outside the desired range so as to ensure coverage of the whole range during the pressure sweep. The pressure pump could be set to produce sweep speeds of approximately 400, 200, 100, or 75 daPa∕s. Thus, the change in air pressure during each 46-ms interval of a click-response buffer was approximately 18, 9.2, 4.6, and 3.5 daPa, respectively. As is evident in Fig. 2a, most energy of the response to the incident click was localized in time to within a duration of 1 ms. At the default sweep speed of 75 daPa∕s, the air pressure varied by 3.2 daPa within the duration of a single click buffer. This was sufficiently small to characterize the air pressure as quasi-stationary over the interclick interval. Data were acquired at higher sweep speeds to evaluate whether the quasi-stationary assumption was still warranted.
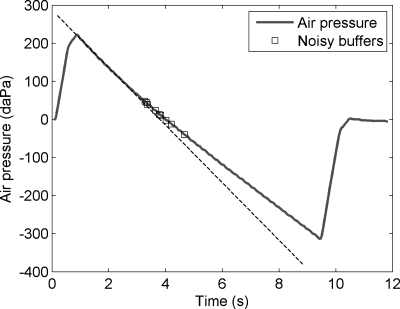
During the sweep, air pressure and click responses were recorded simultaneously until the pressure reached the end target of the ascending or descending sweep, 200 or −300 daPa, respectively. Then, the ear-canal pressure was reset to 0 daPa. The actual pressure-sweep speed could deviate from the nominal speed, depending upon the goodness of pressure seal in the ear canal and the characteristics of individual ears. An instance of the descending sweep intended at the speed of 75 daPa∕s is shown in Fig. 3. The dashed reference line was added manually to match the initial slope of the pressure sweep from about 1.0 to 3.0 s. The reference line helps illustrate that the instantaneous rate of pressure change became slower toward the end of the sweep. This indicates that the pressure seal in the ear canal was not perfect.
Figure 3.
Pressure sweep and automatic control. The thick line shows air pressure at the time each click occurred. The dashed line was manually added as a reference. The squares showed where click responses were rejected due to acoustical artifacts.
A click spectrum was calculated using a 1024-sample DFT for each click waveform. Sound-pressure reflectance R(f) and EA were calculated for each response using Eq. 1 and Eq. 2, respectively. Pressure readings were monitored by an operator during data acquisition. If the sweep failed to complete the desired pressure range, the operator was notified by a displayed message, the data were abandoned, the probe insertion was adjusted, and the measurement was repeated.
Data processing
The acquired data were processed in the following manner to calculate the wideband tympanograms. First, noisy responses were identified based on calculation of a samplewise sum of sound pressure square; for each click-response buffer, the sum of square Σ(y[n])2 was calculated outside of a 9-ms period surrounding the main response. Upon the completion of a sweep, the interquartile range (IQR) of Σ(y[n])2 was calculated based on all the click-response buffers within the sweep range. Those buffers with Σ(y[n])2 higher than the 75th percentile+3 times IQR were considered noisy and excluded from further analyses. Figure 3 also shows an example of this artifact rejection; during a sweep that lasted for the duration of 186 clicks, nine responses were rejected.
Note that the criterion for artifact rejection was different from those for ambient-pressure measurements, in part because varying the air pressure changed the middle-ear characteristics and made it inappropriate to calculate an average response across clicks. The operator was notified during data acquisition if more than 10% of the buffers were rejected. If so, the operator had the opportunity to adjust the probe, check the subject status, and acquire data again, if desired, or continue to process the existing data.
Air pressure was sampled every 25 ms but a click stimulus was delivered every 46 ms. The pressure at the time of the onset of each click buffer was estimated by linear interpolation. The spectrum of EA between 0.226 and 8 kHz was partitioned into 62 bands of 1∕12 octave each. Two bands at low frequencies were discarded because they contained no DFT components, so that the fractional-octave spectrum consisted of 60 bands. The EA was averaged within each band for each response.
For each test and every frequency, EA was smoothed along the pressure axis by a three-point median filter, and then resampled at every 5 daPa between −300 and 200 daPa using linear interpolation. The same 5-daPa grid was used for all sweep speeds, which constituted in some cases an oversampling of the variation of EA with air pressure.
This procedure established a grid across frequency and air pressure that was the same for each ear tested, independent of the details of the pressure-sweep response that varied across subjects.
Bandpass energy absorbance and tympanometric peak pressure
A bandpass EA tympanogram averaged over a frequency range from 0.38 to 2 kHz was used to define a bandpass TPP. This TPP was then used to define a peak EA, which is the EA spectrum measured from 0.226 to 8 kHz at the TPP. The bandpass EA tympanogram was defined to provide an analogy to a single-frequency tympanogram, and the peak EA was defined to provide a generalization of the EA measured at ambient pressure.
The bandpass energy absorbance ⟨EA(p)⟩ at air pressure p was calculated as
| (5) |
where ∣R(fi,p)∣2 denotes ER after the data processing described previously, the summation index i runs over all frequency bands centered at fi within the selected pass band (0.38–2 kHz), and Nf denotes the number of such bands.
Then, the bandpass TPP, denoted as , was estimated by quadratic interpolation at the top three points of ⟨EA(p)⟩,
| (6) |
where pk denotes the pressure bin with the maximum ⟨EA(p)⟩, Δp=5 daPa was the size of pressure sampling, and ak−1, ak, and ak+1 denote ⟨EA(p)⟩ evaluated at pk−Δp, pk, and pk+Δp, respectively. Then, an EA measured at the TPP, denoted as pEA, is defined by the EA tympanogram sampled at pk,
| (7) |
The present passband for adult tympanometry was selected to be 0.38–2 kHz. The upper limit was chosen based on the fact that the single-peaked structure of the EA tympanogram remained present at least up to 2 kHz. The lower limit might have been chosen as small as 0.226 kHz, which was the lowest analysis frequency of the overall acoustic transfer function measurement. A slightly higher frequency of 0.38 kHz was chosen as the lower limit for two reasons. First, physiological noise is higher at low frequencies, and this increased noise at lower frequencies was a potential concern because the SNR for a click response at a single frequency is less than if a single-frequency stimulus were used. The second reason is that the tympanometric change in EA with air pressure was larger at and above 0.38 kHz than below. This choice of tympanometry bandwidth in adult ears is preliminary, and may be further adjusted as more becomes known about wideband tympanometry in ears with middle-ear pathology or conductive hearing loss.
Estimating the TPP is important because some ears, for example, may have a negative TPP in the absence of middle-ear pathology. Under those conditions, the energy absorption properties of the middle ear might better be assessed at the TPP than at ambient pressure (Margolis et al., 1999). This is because the TPP estimates the static pressure within the middle-ear cavities. The peak energy absorbance pEA would assess middle-ear function in a condition in which pressure difference across the tympanic membrane is minimized. In the case of an ear with middle-ear pathology, the pEA may provide additional information across frequency that is not present in the EA at ambient pressure.
Calculation of other tympanometric variables
Other acoustic transfer functions may be calculated from R(f) and the characteristic impedance Zc of the ear. For example, the acoustic admittance Y(f) in an adult ear may be calculated as
| (8) |
in which Zc may be calculated in the frequency range of interest as the ratio of the product of air density and phase velocity to the cross-sectional area of the calibration tube. This area is approximately equal to the cross-section area of the ear canal in an average adult ear.
Applied to data in a wideband tympanogram, the use of Eq. 8 provides a wideband admittance tympanogram defined over the grid of air pressure and frequency. Results can be extracted at a single frequency to calculate a single-frequency admittance tympanogram. The details of this calculation are as follows. First, for each response that was recorded at air pressure pj, a wideband acoustic admittance Yj(fk) was calculated at 1024 discrete frequencies fk using Eqs. 1, 8. Then, the admittance magnitude at 226 Hz, denoted as ψ226, was estimated by linearly interpolating ∣Yj(fk)∣ in the frequency domain. After computing ψ226 for all responses, it was resampled every 5 daPa using linear interpolation. Finally, the result was smoothed by a denoising technique3 based on median filtering and moving-window averaging. The 1-kHz tympanogram was calculated similarly. Tympanograms using the complex components of acoustic admittance or of any other acoustic transfer function can be calculated using the same signal processing techniques, too.
Subjects
Adult subjects participated in this study (N=48 subjects, both ears tested) with a mean age±1 standard deviation (SD) of 33.8±10 years. The following inclusion criteria for each ear were adopted:
-
(a)
Air conduction thresholds ⩽15 dB HL at each octave frequency between 0.25 and 8 kHz.
-
(b)
Air∕bone gaps of ⩽10 dB at each octave frequency between 0.25 and 4 kHz.
-
(c)
Negative history of otologic surgery, excluding surgery for placement of pressure equalization tubes.
-
(d)
TPP between −83 and +50 daPa, based on the use of a 226-Hz probe tone.
-
(e)
Equivalent ear-canal volume between 0.6 and 2.5 cm3.
-
(f)
Peak-compensated static acoustic admittance at the positive tail between 0.3 and 1.4 mmho.
The rationale for using inclusion criteria listed in items d, e, and f for 226-Hz tympanometry data has been previously described (Ellison and Keefe, 2005).
Four out of 96 ears did not satisfy the above criteria. Measurements were performed in the remaining 92 ears, including EA at ambient pressure and wideband tympanometry at a default sweep speed of −75 daPa∕s, in which the “−” sign denotes a descending sweep. To evaluate the effects of pressure-sweep speeds and directions on measured tympanograms, the last 29 of 92 ears were also tested at seven other sweep speeds and directions, ±400, ±200, ±100, and +75 daPa∕s.
RESULTS
Energy absorbance measured at ambient pressure
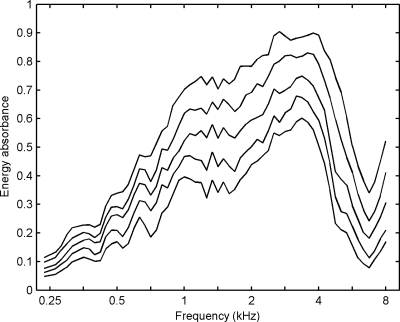
Figure 4 shows group results of EA measured at ambient pressure as a function of frequency. The five lines, ordered from bottom to top, show the 10th, 25th, 50th, 75th, and 90th percentiles, respectively. As frequency increased, the EA reached its maximum between 2 and 4 kHz, where the 10th to 90th percentile ranged from 0.50 to 0.90. The EA decreased as a function of frequency above 4 kHz until reaching a minimum near 6.7 kHz. The EA increased again as frequency approached 8 kHz. Similar trends in energy reflectance have been observed in previous studies (Stinson, 1990; Keefe et al., 1993; Voss and Allen, 1994; Feeney and Sanford, 2004; Shahnaz and Bork, 2006).
Figure 4.
EA measured at ambient pressure, plotted at 60 frequencies spaced 1∕12 octave apart. Solid lines show 10th, 25th, 50th, 75th, and 90th percentiles, respectively, of the normal hearing subjects (N=92 ears).
Wideband energy absorbance tympanograms
Normal percentiles
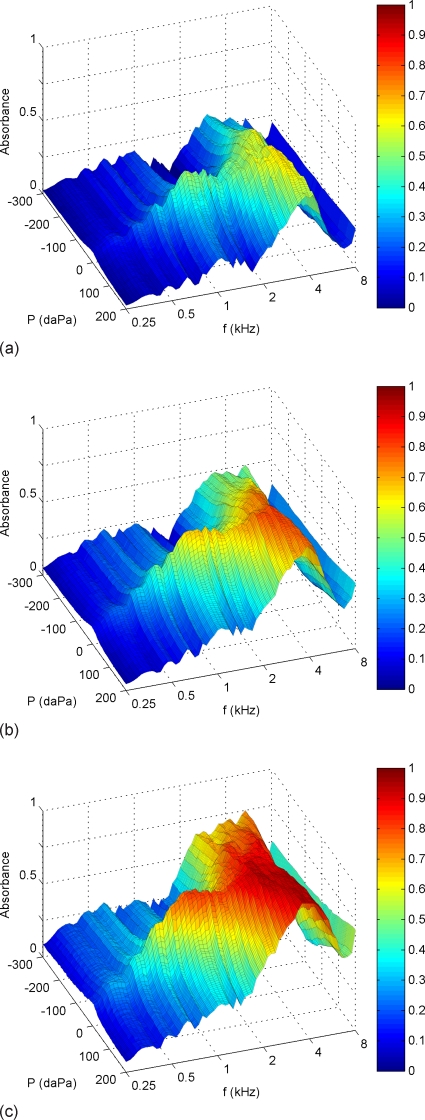
Percentiles of EA are plotted in Fig. 5 as two-dimensional functions of frequency and air pressure. Note that below 2 kHz, EA had a single peak near 0 daPa, but at higher frequencies, EA was more complex as a function of pressure. At every pressure, EA reached its maximum near 4 kHz, where the 10th to the 90th percentiles ranged from approximately 0.6 to 0.9. The peak location on the frequency-pressure plane and the peak absorbance values were similar to previously reported results on normal-hearing subjects [e.g., Fig. 8(b) in Margolis et al., 1999; Fig. 9 in Keefe and Simmons, 2003].
Figure 5.
EA as a function of frequency and air pressure. Sweep speed: −75 daPa∕s. (a), (b), and (c): 10th, 50th, and 90th percentiles, respectively, of adult normative data (N=92 ears).
Occurrence of negative energy absorbance in some ears
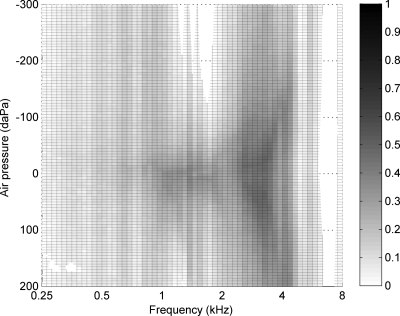
The minimum value of EA across all ears was calculated at each frequency and pressure to provide a 0th percentile of EA. The 0th-percentile EA was negative in 7.2% of all the points on the frequency-pressure plane (Fig. 6, empty regions). Also, negative EA was measured in 23 of 92 ears for at least one frequency-pressure point. EA of more negative than −0.02 occurred in 18 ears, with the most negative EA=−0.076.
Figure 6.
Minimum EA across subjects (N=92 ears). Empty regions indicate where the minimum EA was found negative.
The largest region where negative EA occurred was near 7 kHz across all pressures. However, only three ears were found to have negative EA there, with a minimum EA of −0.064. The only place where 10th-percentile EA was negative was at 1.59 kHz between −260 and −300 daPa—this region is somewhat obscured in Fig. 5, but the tendency for low EA can be observed. The pattern of negative EA near 1.59 kHz was asymmetric with respect to air pressure; it never occurred at any positive pressure. Possible causes of negative EA are discussed in Sec. 4.
Bandpass TPP and peak pressure determined by 226-Hz tympanometry
In the present study, the bandpass TPP had a mean±1 SD of 2.8±16 daPa. Except for one ear with a TPP of −93 daPa, the bandpass TPP ranged between −83 and +50 daPa. This range is similar to the range of TPP reported in studies using 226-Hz tympanograms (Ellison and Keefe, 2005). This similarity is not an independent result, inasmuch as this TPP range for 226-Hz tympanograms was part of the subject inclusion criteria. The 226-Hz TPP obtained during the initial screening of these ears had a mean±1 SD of 13.6±18 daPa. The correlation coefficient was 0.76 across all ears between the bandpass TPP and the 226-Hz TPP.
Single-frequency admittance magnitude tympanograms
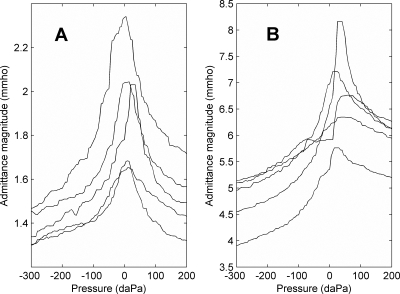
Five randomly selected examples of admittance magnitude tympanograms at 226 Hz and 1 kHz measured in normal adult ears are shown in Fig. 7. Although these data were extracted from wideband tympanometry, each tympanogram has a shape typical of those that are clinically measured at the nominal test frequency. The 1-kHz tympanogram is not commonly measured in adult ears, but has been of recent interest in measurements in children younger than 3 months (Margolis et al., 2003; Kei et al., 2003; Baldwin, 2006).
Figure 7.
Examples of single-frequency admittance magnitude tympanograms extracted from wideband tympanometry. Results from randomly selected ears. (A) 226 Hz. (B) 1 kHz.
DISCUSSION
General comments on single-frequency and wideband tympanograms
Wideband absorbance tympanograms measured using a swept-pressure paradigm (Fig. 5) were similar to those measured using a sequence of fixed static pressures, as previously reported (Margolis et al., 1999; Keefe and Simmons, 2003; Sanford and Feeney, 2008). The Margolis et al. (1999) measurements relied on a manual setting of air pressure, which resulted in long measurement duration with known air pressure at each setting. The Keefe and Simmons, and Sanford and Feeney, measurements had no explicit measurement of the air pressure in the ear canal during an automated recording sequence in which the desired air pressure was varied in discrete steps. The present measurement, using a swept-pressure technique with feedback control, allowed a shorter measurement duration, which is an advantage for clinical applications.
Despite the overall agreement between these various measurements of EA tympanograms in adult ears, there has been scant attention to inaccuracies that could be observed in bounded regions of the frequency-pressure plane. In this study, the negative EA that sometimes occurred was evidence of a contamination due to some source of error. EA should be non-negative in the absence of sound sources within the cochlea, except for the possible small influence of otoacoustic emissions, which are an unlikely source given the predominant source region near 7 kHz.
In the present study, negative nominal values of EA near 7 kHz might be attributed to insufficient accuracy in calibration. Equation 1 shows that, if the source impedance R0 obtained during calibration deviates from the true source impedance in a way such that the magnitude of R0P+Q is underestimated, the magnitude of R will be overestimated. Thus, when the true value of ∣R∣2 is close to 1, it is possible that a calibration error could cause it to be measured larger than 1, resulting in negative EA according to Eq. 2. Two of the three ears that measured negative EA near 7 kHz were the two ears of the same subject measured on the same day. This indicates that the negative value might indeed be a result of a temporary condition in the probe at the time calibration was performed.
Negative EA near 1.59 kHz might have been due to the transducers’ sensitivity to air-pressure change, so that both R0(f) and Q(f) deviated from their calibrated values that were determined at ambient pressure. Otherwise, the source of this error is unknown.
Admittance tympanograms in normal adult ears have a single-peaked structure at 226 Hz, but a more complex structure of maxima and minima occurs at 678 Hz and higher frequencies. Techniques to classify such multifrequency admittance tympanometric patterns have been used to analyze responses up to approximately 2 kHz (Colletti, 1977; Margolis and Hunter, 2000; Vanhuyse, 1975). Nevertheless, use of multifrequency tympanometry is not widely accepted in clinical settings, largely due to the complexity of the responses (Fowler and Shanks, 2002). In contrast, the wideband EA tympanogram has a single pressure peak in normal-hearing adults at least up to approximately 2 kHz (Fig. 5). The multiple maxima and minima structure that occur in admittance tympanograms below 1 kHz in healthy adult ears do not appear in EA tympanograms.
Although wideband tympanometry provides more information than either traditional tympanometry or ambient-pressure reflectance measurement, it would be important for a clinical device to provide a summary on the status of the test ear. Keefe and Simmons (2003) reduced the two-dimensional EA tympanogram into a set of one-dimensional functions: pressure moments as a function of frequency, and frequency moments as a function of pressure. There may be a practical advantage in terms of simplicity in reducing the two-dimensional EA tympanogram to a small number of one-dimensional functions, but it is unknown whether significant diagnostic information is thereby lost.
The more narrowly focused goals of the present study were to (1) demonstrate the feasibility of a wideband system intended for middle-ear screening and diagnosis that includes swept-pressure tympanometry, and (2) report baseline results from a normal adult population. Feasibility was established inasmuch as interpretable wideband acoustic transfer functions were measured on every subject tested, and the results (in Figs. 457) were similar to those in previous wideband and single-frequency studies.
Effects of pressure sweep on estimation of TPP
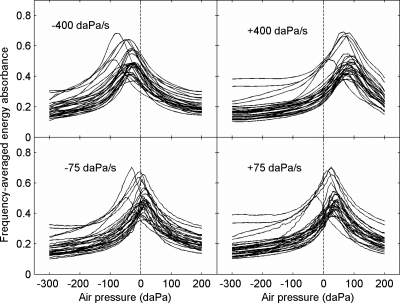
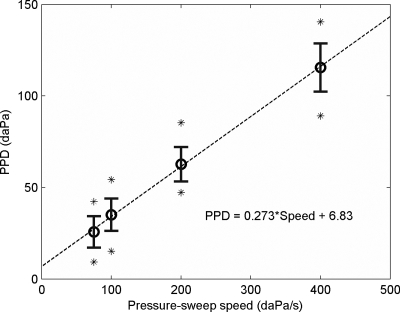
Figure 8 shows ⟨EA(p)⟩ over the passband (0.38–2 kHz) that was measured with the slowest and the fastest sweeps (N=29 ears). Different traces show results from individual ears. Note that ⟨EA(p)⟩ always had a single peak, but the overall pattern shifted positively with ascending sweeps and negatively with descending sweeps. Also, the shift was larger with the fastest sweep than with the slowest sweep. The amount of shift was quantified in terms of a peak-pressure difference (PPD) for each ear at each pressure-sweep speed v (Therkildsen and Gaihede, 2005),
| (9) |
where denotes TPP obtained with ascending (+) and descending (−) sweeps, respectively. Figure 9 shows that PPD increased as a function of v and was always positive. Linear regression of PPD(v) yielded a slope of 0.27 s and an offset of 6.8 daPa. Because PPD accounted for the difference between ascending and descending sweeps at the same speed, the slope of the regression line times 0.5 suggested a constant delay of 0.14 s.
Figure 8.
Frequency-averaged (0.38–2 kHz) EA as a function of air pressure. Each panel shows results at a different sweep speed and direction, and traces show responses from individual ears (N=29 ears).
Figure 9.
Peak-pressure difference (PPD) vs pressure-sweep speed. Circles and bars show means and SDs (N=29 ears). Asterisks show minimum and maximum PPD at each speed.
The PPD at 75 daPa∕s was lower than reported in Shanks and Wilson (1986) and Kobayashi et al. (1987), in both of which PPD also increased as a function of the pressure-sweep speed. However, Therkildsen and Gaihede (2005) argued that any positive dependence of PPD upon sweep speed must be due to instrumental delay, and it was shown that, by minimizing such delay, PPD could be reduced to 12±10 daPa at a pressure-sweep speed of 400 daPa∕s.
The cause of large PPD at higher speeds in the present study is not clear. Possible mechanisms include air pressure difference between the ear canal and the pressure sensor during the sweep, signal processing delay in pressure sensing circuitry, and any unknown software delay due to communication between the DSP and the desktop computer.
Nevertheless, the offset of the regression line at 6.8 daPa provides evidence of middle-ear hysteresis that might not be eliminated by further reducing the sweep speed. This pressure offset is of the same order of magnitude as the mean PPD=12 daPa at 50 daPa∕s, found by Therkildsen and Gaihede (2005), and the mean PPD=9 daPa at 8 daPa∕s by Kobayashi et al. (1987).
These results suggest that an absorbance-based measurement of TPP is influenced by variations in sweep speed, but the magnitude of these effects is similar to measurements of TPP using 226-Hz admittance tympanometry.
Effects of pressure sweep on peak EA
A related question arises of the extent to which pEA is influenced by variations in pressure-sweep speed and direction. Figure 10 shows pEA measured with pressure sweeps at all four speeds. By inspection, the 10th to 90th-percentile range with −75, −100, and −200 daPa∕s appeared similar at all frequencies; the differences in pEA between ascending and descending sweeps appeared greater.
Figure 10.
Wideband EA estimated at TPP (pEA). Pressure-sweep speeds are listed in each panel. Solid lines indicate the 10th, 50th, and 90th percentiles, respectively (N=29 ears). For comparison, the shaded area shows the 10th to 90th percentile range that was measured with the sweep speed of −75 daPa∕s.
To quantify this observation, the difference D(v1;v2) in pEA measured with sweep speed v1 and v2 was calculated for each ear at every frequency. The rms values of D(v;−75) and D(v;+75) averaged across 29 ears and all frequencies are shown in Table 1. The difference in pEA caused by a change in sweep direction was larger than that caused by increasing the sweep speed. This provides additional evidence that middle-ear hysteresis did not vanish at the slowest sweep speed in the present study, and is consistent with tympanometric findings in rabbits, for which middle-ear hysteresis effects were important at low sweep speeds (Dirckx et al., 2006).
Table 1.
Effects of different pressure-sweep speeds and directions on pEA.
| Sweep speed v (daPa∕s) | rms of D(v;−75) | rms of D(v;+75) |
|---|---|---|
| −75 | ⋯ | 0.050 |
| −100 | 0.015 | 0.051 |
| −200 | 0.021 | 0.054 |
| −400 | 0.031 | 0.061 |
| +75 | 0.050 | ⋯ |
| +100 | 0.051 | 0.016 |
| +200 | 0.053 | 0.027 |
| +400 | 0.052 | 0.044 |
The rms value of D(−75;−400) was 0.031, so the peak EA changed on the order of ±0.031 when the speed of descending pressure sweeps increased from 75 to 400 daPa. Figure 10 shows that, at every frequency, the 10th to 90th-percentile range of pEA(f) was at least 0.079 with the default sweep speed of −75 daPa∕s; the minimum occurred at the lowest frequency. Further analyses showed that the IQR (i.e., 25th to 75th-percentile range) was at least 0.042 with the same sweep speed. The IQR was greater than the rms value of D(−75;−400), and particularly so above 0.5 kHz.
Thus, the rms analyses indicate that, even though the TPP needed to extract pEA from the EA tympanogram varied with sweep speed (see Fig. 8), the resulting variations in pEA were less than the variability across normal-hearing subjects.
Energy absorbance: TPP vs. ambient
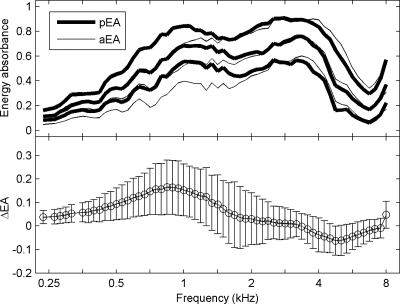
Given that the mean (2.8 daPa) of the bandpass TPP in this group of normal-hearing ears was within 1 SD (16 daPa) of ambient pressure, it was expected that pEA would be similar to EA measured at ambient pressure (aEA) in these ears. However, as shown in Fig. 11 (top panel), the 10th, 50th, and 90th percentiles of pEA were higher than aEA at low frequencies and slightly lower at high frequencies. The difference ΔEA=pEA−aEA, calculated for each ear individually, was most positive at 0.84 kHz, reaching 0.16±0.11, and most negative at 4.76 kHz, −0.06±0.06 (Fig. 11, bottom panel).
Figure 11.
Comparison of pEA and aEA across frequencies. Sweep speed: −75 daPa∕s. Top: Thick lines show 10th, 50th, and 90th percentiles of pEA, and thin lines show the same percentiles of aEA (N=92 ears). Bottom: Mean and SD of ΔEA.
The difference was probably due to a positive residual pressure during probe insertion right before the ambient-pressure measurement. When the probe was pushed into the ear canal, the enclosed volume decreased, and the air pressure might have increased consequently. If the pressure seal was good, the pressure could remain in the ear canal throughout the measurement, which lasted for about 1 s (46 ms×16 clicks). The 50th percentile of the wideband tympanogram in Fig. 5b suggests that, as the ear-canal pressure varied from 0 daPa to a positive pressure, EA would decrease at frequencies below 2 kHz but increase slightly around 4 kHz. This agrees with the pattern of ΔEA shown in Fig. 11.
The residual pressure could have been avoided by providing ventilation in the probe. Alternatively, the discrepancy between pEA and aEA might be eliminated by setting the pressure back to zero using the pressure pump before ambient-pressure measurements. The presence of any such discrepancy in EA would not interfere with its clinical use, because its effects would be shared by measurements in ears with either normal or impaired middle-ear function.
CONCLUSIONS
Procedures were developed to perform wideband acoustic transfer function measurements under both ambient and tympanometric conditions. Wideband responses were acquired in a normal-hearing adult population. The feasibility was established in adult ears for the measurement of ambient-pressure responses and for tympanograms using a wideband stimulus and swept air pressure. The overall measurement durations of ambient and tympanometric responses were within the range of durations of other types of clinical systems that are used to assess middle-ear function. The inclusion of artifact rejection allowed the detection and exclusion of noisy buffers from subsequent analysis. Wideband results were summarized in terms of EA, which is large at frequencies at which the middle ear is efficient at collecting sound energy, and which, in the form of an EA tympanogram, has a central peak similar to that of standard low-frequency tympanometry. The effects of variations in sweep speed and direction on adult EA tympanograms were assessed. The EA tympanogram was simplified into a pair of responses: a bandpass tympanogram characterizing variations with air pressure, and a peak EA characterizing variations with frequency. The EA measurements in normal adult ears provide a baseline with which to compare measurements in adult ears with middle-ear pathology and in ears of newborns and older children.
ACKNOWLEDGMENTS
This project was supported by NIH grants DC006607, DC004662, and DC000013. The authors would like to thank two anonymous reviewers for their critiques.
NOMENCLATURE
- D(v1;v2)
Difference in pEA measured with sweep speed v1 and v2
- EA(f,p)
Two-dimensional energy absorbance tympanogram
- ⟨EA(p)⟩
Bandpass energy absorbance as a function of air pressure
- aEA(f)
Energy absorbance measured at ambient pressure
- pEA(f)
Energy absorbance tympanogram sampled at peak pressure
- ΔEA
pEA subtracted by aEA
- f
Frequency (Hz)
- i,j,k
Integer-valued dummy indexes; meanings depend on context
- n
Discrete-time index
- p
Air pressure in the ear canal (daPa)
Bandpass tympanometric peak pressure (daPa)
- Δp
Resolution of air-pressure grid, 5 daPa
- P(f)
Recorded sound-pressure spectrum
- PPD(v)
Peak pressure difference between and
- Q(f)
Incident pressure spectrum
- R(f)
Sound-pressure reflectance as a function of f
- R0(f)
Source reflectance as a function of f
- v
Speed of air-pressure sweep (daPa∕s)
- Y(f)
Acoustic admittance as a function of frequency (cm5 dyn−1 s−1)
- y(k)[n]
Sound-pressure response to the kth click sampled at time n
Footnotes
Although beyond the scope of the present study in terms of human-subject testing, the design of the system is intended to be suitable for measurements in newborns and older children as well as in adults, and in ears with middle-ear pathology.
Energy absorbance previously was termed energy transmittance by Keefe and Simmons (2003). The term energy absorbance is preferred and used in this report. In a one-dimensional transmission-line description of the ear-canal acoustics, the middle ear acts as a terminating impedance of the transmission line, and the process of sound absorption is represented by including a resistive component to this impedance. The term transmission is often used in transmission-line theory for the case that two transmission lines with different properties are joined at a particular location. A signal in the first line that is incident to this junction is partially reflected and partially transmitted into the second line. One-dimensional models of middle-ear transmission represent the middle ear as joined to an ear-canal transmission line and a cochlear transmission line, the latter representing the cochlear traveling wave. Irrespective of how the internal function of the middle ear is modeled, a middle-ear scattering matrix quantifies relationships between signals traveling through the middle ear to and from the ear-canal transmission line, and to and from the cochlear transmission line. This scattering matrix includes both forward and reverse middle-ear reflectances and transmittances (Shera and Zweig, 1992; Keefe and Abdala, 2007), in which the forward direction is from the ear canal into the middle ear, and from the middle ear into the cochlea. The ER as used here is identical (in the absence of ear-canal losses) to the squared magnitude of this forward reflectance. However, EA is not identical to the squared magnitude of the forward transmittance, and has no simple relationship to the forward or reverse transmittance. To prevent any confusion between EA and these transmittances, the term energy absorbance is used herein to represent the fraction of incident energy in the ear canal that is not reflected at the tympanic membrane.
The denoising technique consisted of the following steps. First, three-point median filtering was applied to the input ψ226(pi), where the air pressures pi are equally spaced at every 5 daPa. Denote the result of median filtering as , and the difference as . Then, another round of three-point median smoothing was applied to , and the result was convolved with the normalized Hamming window (Harris, 1978) of three points on each side, which corresponds to a half-width of 15 daPa in this context. The denoised output was the sum of and the output of the Hamming filter.
References
- Agulló, J., Cardona, S., and Keefe, D. H. (1995). “Time-domain deconvolution to measure reflection functions from discontinuities in waveguides,” J. Acoust. Soc. Am. 10.1121/1.412068 97, 1950–1957. [DOI] [Google Scholar]
- ASHA (1997). Guidelines for Audiologic Screening (American Speech-Language-Hearing Association, Rockville, MD: ). [Google Scholar]
- Baldwin, M. (2006). “Choice of probe tone and classification of trace patterns in tympanometry undertaken in early infancy,” Int. J. Audiol. 45, 417–427. [DOI] [PubMed] [Google Scholar]
- Colletti, V. (1977). “Multifrequency tympanometry,” Audiology 16, 278–287. [DOI] [PubMed] [Google Scholar]
- Decraemer, W. F., Creten, W. L., and van Camp, K. J. (1984). “Tympanometric middle-ear pressure determination with two-component admittance meters,” Scand. Audiol. 13, 165–172. [DOI] [PubMed] [Google Scholar]
- Dirckx, J. J. J., Buytaert, J. A. N., and Decraemer, W. F. (2006). “Quasi-static transfer function of the rabbit middle ear, measured with a heterodyne interferometer with high-resolution position decoder,” J. Assoc. Res. Otolaryngol. 7, 339–351. [DOI] [PMC free article] [PubMed] [Google Scholar]
- Ellison, J. C., and Keefe, D. H. (2005). “Audiometric predictions using SFOAE and middle-ear measurements,” Ear Hear. 10.1097/01.aud.0000179692.81851.3b 26, 487–503. [DOI] [PMC free article] [PubMed] [Google Scholar]
- Feeney, M. P., and Sanford, C. A. (2004). “Age effects in the human middle ear: Wideband acoustical measures,” J. Acoust. Soc. Am. 10.1121/1.1808221 116, 3546–3558. [DOI] [PubMed] [Google Scholar]
- Feeney, M. P., Grant, I. L., and Marryott, L. P. (2003). “Wideband energy reflectance measurements in adults with middle-ear disorders,” J. Speech Lang. Hear. Res. 10.1044/1092-4388(2003/070) 46, 901–911. [DOI] [PubMed] [Google Scholar]
- Fowler, C. G., and Shanks, J. E. (2002). “Tympanometry,” in Handbook of Clinical Audiology, edited by Katz J. (Lippincott, Williams & Wilkins, New York: ). [Google Scholar]
- Gaihede, M., Lambertsen, K., Bramstoft, M., Kamarauskas, A., and Fogh, A. (2000). “Tympanometric hysteresis effect and errors in middle ear pressure determination—A preliminary study in children with secretory otitis media,” Acta Oto-Laryngol., Suppl. 543, 58–60. [PubMed] [Google Scholar]
- Harris, F. J. (1978). “On the use of windows for harmonic analysis with the discrete Fourier transform,” Proc. IEEE 10.1109/PROC.1978.10837 66(1), 51–83. [DOI] [Google Scholar]
- Keefe, D. H., and Abdala, C. (2007). “Theory of forward and reverse middle-ear transmission applied to otoacoustic emissions in infant and adult ears,” J. Acoust. Soc. Am. 10.1121/1.2427128 121, 978–993. [DOI] [PMC free article] [PubMed] [Google Scholar]
- Keefe, D. H., and Levi, E. (1996). “Maturation of the middle and external ears: Acoustic power-based responses and reflectance tympanometry,” Ear Hear. 10.1097/00003446-199610000-00002 17, 361–373. [DOI] [PubMed] [Google Scholar]
- Keefe, D. H., and Simmons, J. L. (2003). “Energy transmittance predicts conductive hearing loss in older children and adults,” J. Acoust. Soc. Am. 10.1121/1.1625931 114, 3217–3238. [DOI] [PubMed] [Google Scholar]
- Keefe, D. H., Ling, R., and Bulen, J. C. (1992). “Method to measure acoustic impedance and reflection coefficient,” J. Acoust. Soc. Am. 10.1121/1.402733 91, 470–485. [DOI] [PubMed] [Google Scholar]
- Keefe, D. H., Bulen, J. D., Arehart, K., and Burns, E. M. (1993). “Ear-canal impedance and reflection coefficient in human infants and adults,” J. Acoust. Soc. Am. 10.1121/1.407347 94, 2617–2638. [DOI] [PubMed] [Google Scholar]
- Keefe, D. H., Folsom, R. C., Gorga, M. P., Vohr, B. R., Bulen, J. C., and Norton, S. J. (2000). “Identification of neonatal hearing impairment: Ear-canal measurements of acoustic admittance and reflectance in neonates,” Ear Hear. 10.1097/00003446-200010000-00009 21, 443–461. [DOI] [PubMed] [Google Scholar]
- Kei, J., Allison-Levick, J., Dockray, J., Harrys, R., Kirkegard, C., Wong, J., Maurer, M., Hegarty, J., Young, J., and Tudehope, D. (2003). “High-frequency (1000 Hz) tympanometry in normal neonates,” J. Am. Acad. Audiol 14, 20–28. [DOI] [PubMed] [Google Scholar]
- Kobayashi, T., Okitsu, T., and Takasaka, T. (1987). “Forward-backward tracing tympanometry,” Acta Oto-Laryngol., Suppl. 435, 100–106. [PubMed] [Google Scholar]
- Margolis, R. H., and Hunter, L. L. (2000). “Acoustic immittance measurement,” in Audiology: Diagnosis, edited by Roeser R. J., Valente M., and Hosford-Dunn H. (Thieme Medical, New York: ). [Google Scholar]
- Margolis, R. H., Saly, G. L., and Keefe, D. H. (1999). “Wideband reflectance tympanometry in normal adults,” J. Acoust. Soc. Am. 10.1121/1.427055 106, 265–280. [DOI] [PubMed] [Google Scholar]
- Margolis, R. H., Bass-Ringdahl, S., Hanks, W. D., Holte, L., and Zapala, D. A. (2003). “Tympanometry in newborn infants—1 kHz norms,” J. Am. Acad. Audiol 14, 383–392. [PubMed] [Google Scholar]
- Nozza, R. J., Bluestone, C. D., Kardatzke, D., and Bachman, R. (1994). “Identification of middle ear effusion by aural acoustic admittance and otoscopy,” Ear Hear. 15, 310–323. [DOI] [PubMed] [Google Scholar]
- Piskorski, P., Keefe, D. H., Simmons, J. L., and Gorga, M. P. (1998). “Prediction of conductive hearing loss based on acoustic ear-canal response using a multivariate clinical decision theory,” J. Acoust. Soc. Am. 105, 1749-1764. [DOI] [PubMed] [Google Scholar]
- Sanford, C. A., and Feeney, M. P. (2008). “Effects of maturation on tympanometric wideband acoustic transfer functions in human infants,” J. Acoust. Soc. Am. 104, 2106–2122. [DOI] [PMC free article] [PubMed] [Google Scholar]
- Shahnaz, N., and Bork, K. (2006). “Wideband reflectance norms for Caucasian and Chinese young adults,” Ear Hear. 27, 774–788. [DOI] [PubMed] [Google Scholar]
- Shanks, J. E., and Wilson, R. H. (1986). “Effects of direction and rate of ear canal pressure changes on tympanometric measures,” J. Speech Hear. Res. 29, 11–19. [DOI] [PubMed] [Google Scholar]
- Shanks, J. E., Lilly, D. J., Margolis, R. H., Wiley, T. L., and Wilson, R. H. (1988). “Tympanometry,” J. Speech Hear Disord. 53, 354–377.3054320 [Google Scholar]
- Shera, C. A., and Zweig, G. (1992). “Analyzing reverse middle-ear transmission: Noninvasive Gedankenexperiments,” J. Acoust. Soc. Am. 10.1121/1.403930 92, 1371–1381. [DOI] [PubMed] [Google Scholar]
- Stinson, M. R. (1990). “Revision of estimates of acoustic energy reflectance at the human eardrum,” J. Acoust. Soc. Am. 10.1121/1.400198 88, 1773–1778. [DOI] [PubMed] [Google Scholar]
- Stinson, M. R., Shaw, E. A., and Lawton, B. W. (1982). “Estimation of acoustical energy reflectance at the eardrum from measurements of pressure distribution in the human ear canal,” J. Acoust. Soc. Am. 10.1121/1.388257 72, 766–773. [DOI] [PubMed] [Google Scholar]
- Therkildsen, A. G., and Gaihede, M. (2005). “Accuracy of tympanometric middle ear pressure determination: The role of direction and rate of pressure change with a fast, modern tympanometer,” Otol. Neurotol. 26(2), 252–256. [DOI] [PubMed] [Google Scholar]
- Tukey, J. W. (1977). Exploratory Data Analysis (Addison-Wesley, Reading, MA: ). [Google Scholar]
- Vander Werff, K. R., Prieve, B. A., and Georgantas, L. M. (2007). “Test-retest reliability of wideband reflectance measures in infants under screening and diagnostic test conditions,” Ear Hear. 10.1097/AUD.0b013e31812f71b1 28, 669–681. [DOI] [PubMed] [Google Scholar]
- Vanhuyse, V. J., Creten, W. L., and van Camp, K. J. (1975). “On the W-notching of tympanograms,” Scand. Audiol. 4, 45–50. [Google Scholar]
- Voss, S. E., and Allen, J. B. (1994). “Measurement of acoustic impedance and reflectance in the human ear canal,” J. Acoust. Soc. Am. 10.1121/1.408329 95, 372–384. [DOI] [PubMed] [Google Scholar]
- Voss, S. E., Horton, N. J., Woodbury, R. R., and Sheffield, K. N. (2008). “Sources of variability in reflectance measurements on normal cadaver ears,” Ear Hear. 10.1097/AUD.0b013e318174f07c 29, 651–665. [DOI] [PubMed] [Google Scholar]
- Voss, S. E., Rosowski, J. J., Merchant, S. N., and Peake, W. T. (2001). “Middle-ear function with tympanic-membrane perforations. I. Measurements and mechanisms,” J. Acoust. Soc. Am. 10.1121/1.1394195 110, 1432–1444. [DOI] [PubMed] [Google Scholar]


