Abstract
Impact sounds were synthesized according to standard textbook equations given for the motion of simply supported, metal plates. In a two-interval, forced-choice procedure, highly practiced listeners identified from these sounds a predefined class of target plates based on their particular material and geometric properties. The effects of two factors on identification were examined: the relative level of partials comprising the sounds and the relative amount of information (given as the difference in d′) each partial provided for identification. In different conditions one factor was fixed while the other either increased or decreased with frequency. The effect on listener identification in each case was determined from a logistic discriminant analysis of trial-by-trial responses, yielding a vector of listener decision weights on the frequency and decay of individual partials. The weights increased proportionally with relative level, but were largely uninfluenced by relative information content—a result exactly opposite to that expected from a maximum-likelihood observer. The dominant effect of relative level was replicated for other sound sources (clamped bars and stretched membranes) and was not diminished by randomizing the relative level of partials across trials. The results are taken to underscore the importance of relative level in the identification of rudimentary sound sources.
INTRODUCTION
This study reports a new finding pertaining to the auditory identification of rudimentary sound sources. The results show that the partials governing listener judgments from trial to trial are not those conveying the most information regarding the source, as one might expect, but simply those having the highest relative level in the complex. Similar effects of level have been reported in past studies involving masking (Neff and Jesteadt, 1996) and judgments of pitch (Moore et al., 1985). What makes the present results different, however, is that the highest level components continue to dominate the listener’s judgments even when the listener has a compelling reason and presumed ability to ignore them. We use the term level dominance in this paper to describe this effect and to distinguish it from the other more general effects of relative level, alluded to above, which may or may not be related to the present results.
Level dominance effects of the type described here have not been widely reported in the literature. Berg (1990) may have provided the earliest account. Listeners in his study heard a sequence of seven 50-ms tones alternating in level between 30 and 85 dB SPL. The frequencies of the tones were sampled at random on each trial from one of two normal distributions differing in mean. The listener’s task was to specify on each trial which of the two distributions the sequence was drawn from. Decision weights, indicating the reliance placed on the individual tones, were computed from response correlations with the trial-by-trial perturbations in frequency. In one condition the perturbation was made greater for the higher-level tones so that the higher-level tones conveyed less reliable information regarding the difference to be discriminated. Only two listeners participated in this condition, but the decision weights of both listeners indicated greater weight on the higher-level tones conveying the less reliable information. Berg found the results to be the same when the tones were separated by silent intervals of 50 and 200 ms. Later, Turner and Berg (2007) replicated these results with tones separated by as much as 500-ms silent intervals and differing in level by only 20 dB. This effectively ruled out the possibility that the effect was due to masking of the lower-level tones by the higher-level tones (cf. Jesteadt et al., 1982; Massaro, 1975).
Lutfi and Jesteadt (2006) conducted an extensive follow-up to Berg’s study. Decision weights were computed for sequences of tones alternating in level between 40 and 80 dB SPL with a level perturbation of 3 dB. The task was to detect an increment in level applied to all tones in the sequence, rather than a change in frequency as in the Berg study. The decision weights of four highly practiced listeners indicated near-exclusive reliance on the higher-level tones in the sequence, even when the higher-level tones contained a smaller increment in level (3 vs 6 dB). The same outcome was obtained when the tones were replaced by bursts of broadband Gaussian noise, effectively ruling out explanations based on spread of excitation at high levels. Reversing the order in which high and low level tones occurred in the sequence had no effect, and the level dominance only began to diminish when the tones differed in level by less than 10 dB. The only manipulation, in fact, to have a significant influence on the level-dominance effect was to alternate the low-level tones with louder bursts of Gaussian noise; in this case the effect was entirely reversed. Lutfi and Jesteadt suggest from their results that level dominance may reflect a tendency for attention to be directed to the higher-salience elements of a stimulus perceived as a single auditory object. The interpretation, in fact, is consistent with the predictions of current phenomenological and computational models for the discrimination of unfamiliar multitone patterns (cf. Kidd and Watson, 1992; Lutfi, 1993; Oh and Lutfi, 1998).
Given the seemingly robust nature of the level-dominance effect, we considered whether the effect would also impact on the identification of rudimentary sound sources (struck bars, plates, and membranes). The prediction is that it would if the only requirement is that the partials be perceived as forming a single auditory object. Although one can often “hear out” individual partials of sounds emitted by a rudimentary source, the partials are generally perceived as belonging to a single auditory object by virtue of the fact that they are emitted from a single source. The partials have simultaneous onsets, they decay together systematically, and they are related to one another by frequency ratios likely to be familiar to the listener—all factors that would be expected to promote the perception of a single auditory object (Bregman, 1990), and thus a level-dominance effect. Other considerations, however, lead to a different expected outcome. In particular, the random tone sequences used in the past studies lack the familiarity and lawful structure of naturally occurring sounds. Familiarity and structure are factors known to have a significant impact on a listener’s ability to discriminate random tone patterns (Watson and Kelly, 1981). They are believed to aid the listener by allowing the listener to “focus in” on differences that are relevant to the discrimination. If the interpretation is correct, then the expectation is that level dominance will be reduced or absent for sounds produced by naturally occurring, familiar sound sources.
In light of these considerations, the present study was undertaken to address the following questions: (1) Is the level-dominance effect peculiar to the discrimination of arbitrary tone patterns, or is it also obtained in a source identification task wherein the elements of the stimulus are similarly perceived as belonging to a single auditory object? (2) Assuming the latter outcome, is it possible to rule out trivial explanations in terms of mutual masking among stimulus elements or to listener inexperience with the task? and (3) If such alternative explanations can be ruled out, what impact might the level-dominance effect be expected have on sound source identification performance?
GENERAL METHODS
Stimuli
The stimuli were approximations to the airborne sounds resulting from the impact of a hard mallet on a circular bar, rigidly clamped at one end, a simply supported circular plate, or a stretched circular membrane (respectively, a “tuning-fork,” “gong,” or “tympani drumhead”). They were synthesized according to theoretical equations of motion from standard acoustics texts (Fletcher and Rossing, 1991; Morse and Ingard, 1968). The use of synthetic sounds was dictated by the need to introduce perturbations in stimuli that would allow listener decision weights to be estimated and compared to those of a maximum-likelihood detector, as will be described shortly. Specific details of the synthesis are provided by Lutfi and Oh (1997) and a psychophysical evaluation is provided by Lutfi et al. (2005) and McAdams et al. (2004). The resulting sounds were a sum of exponentially decaying sinusoids whose individual frequencies, ν, amplitudes, A, and decay moduli, τ, were determined by the specific material and geometric properties of the source, and the manner in which the source was suspended and struck. For the bar the ratios of modal frequencies k=νn∕ν1 were 1.00, 6.26, 17.54; for the plate they were 1.00, 2.80, 5.15, 5.98, 9.75, 14.09, and for the membrane they were 1.00, 1.594, 2.136, 2.296, 2.653, 2.918. In different conditions, the amplitudes and the decay moduli of modes were equated across frequency, varied in direct or inverse proportion to modal frequency or varied pseudorandomly. The different cases are described as they are considered in Sec. 3. Note that such variation in the amplitude and decay would be associated with differences in the way the source is struck or the way that it is damped by the manner in which it is held (cf. Morse and Ingard, 1968; Hall, 1991; Lutfi, 2008). For example, a bar rigidly clamped at one end (tuning fork) will produce a sound having a high-pass characteristic if struck near the clamped end, and a low-pass characteristic if struck near the free end; a plate struck squarely in the center will tend predominantly to excite modes 1, 4, and 9. Generally speaking, each natural mode of vibration will be excited (or damped) to the degree that the region of contact participates in that mode of vibration.
For each presentation of a sound a random perturbation was also imposed on the frequency and decay of each partial. The perturbations were imposed independently for frequency and decay, and independently for each partial. Again, such perturbations would be expected to occur naturally since real bars, plates, and membrane tend to have small geometric and material imperfections that would result in such perturbations. To roughly equate their perceptual salience, the perturbations were normally distributed in log ν and log τ units with standard deviation in every case equal to 5 just-noticeable differences (jnd’s); one jnd corresponding to a value of log(1.002) for frequency and log(1.1) for decay (cf. Wier et al., 1977; Schlauch et al., 2001).
Sounds were played at a 44 100-Hz sampling rate with 16-bit resolution and were terminated after 1 s by a 5-ms cosine-squared offset ramp. They were delivered to the right ear over headphones (Beyerdynamic DT 990) to listeners seated individually in a double-walled, IAC sound-attenuating chamber. The levels of partials were computed numerically before analog conversion. The transfer function of the Beyerdynamic headphone was estimated using a binaural loudness balancing procedure. For octave frequencies from 250–8000 Hz listeners adjusted the level of pure tone delivered to the headphone so that it would produce a centered intracranial image when the same tone was played over a TDH-50 earphone with a known transfer function (previously measured through a 6-cc coupler). Using this procedure the average total sound power at the eardrum was estimated to be 65 dB SPL.
Procedure
For each sound source (bar, plate, and membrane) a target and nontarget was identified, the target being nominally smaller than the nontarget and made of a more dense material (cf. Morse and Ingard, 1968, pp. 175–191). Note that these are nominal differences, as other combinations of physical parameters could have been chosen to produce the same acoustic differences between target and nontarget. For the bar the partials of the target were 5 jnd’s higher in frequency and 5 jnd’s longer in decay; for the plate and membrane the differences were 4 jnd’s in each case. The magnitude of the differences was selected to achieve performance levels in the range of 70–90% correct and the direction of the differences was chosen to reflect the geometric and material differences between target and nontarget plates. For the nontarget the frequency of the first partial was ν1=250, 250, and 500 Hz, respectively, for the bar, plate, and membrane. The decay modulus for the first partial was, respectively, τ1=2.0, 0.4, and 0.2 s. On each trial the listener heard an exemplar of the target and nontarget separated by 400 ms. The listener was instructed to select the sound corresponding to the target, which was the first or second sound with equal probability. Listeners were instructed beforehand as to the acoustic differences between target and nontarget and were given correct feedback after each trial. The data were collected in 1-h sessions, including breaks, conducted on different days. A total of at least 400 experimental trials was run for each listener for each condition.
Decision weights for individual listeners were computed as a vector of regression weights, b, using the generalized linear model,
| (1) |
where logit[P(R=2)] is the log-likelihood of a second interval response, i1 and i2 index the parameters of the ith partial in the first and second interval, and e is a residual term (cf. Berg, 1990; Anderson, 1971). The data were analyzed separately for the target in the first and second interval so as to obtain two independent estimates of b for each listener. The estimates and their associated error were computed using the GLMFIT routine of the software application MATLAB v.6.5 using a logit link function. They were then compared to those of a theoretical decision maker that maximizes the likelihood of a correct response on each trial. The performance of the maximum-likelihood (ML) decision maker was analyzed from the equations of motion, taking into consideration the actual perturbations in acoustic parameters that occurred from trial to trial.
Subjects
Nine normal-hearing female adults (ANSI, 1989), ages 21–30 years, were paid at an hourly rate for their participation. Not all listeners participated in all experiments. The listeners were students in the Department of Communicative Disorders at the University of Wisconsin-Madison. All had extensive previous experience with the two-interval, forced-choice task and all received at least 400 trials of practice prior to data collection for each condition in which they participated.
RESULTS
Experiment 1: Effect of relative level vs relative information content
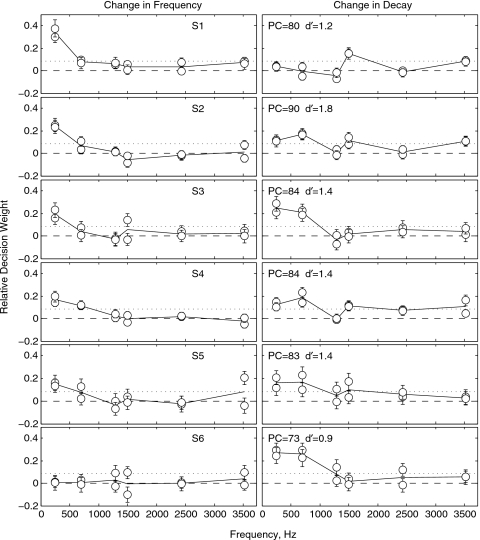
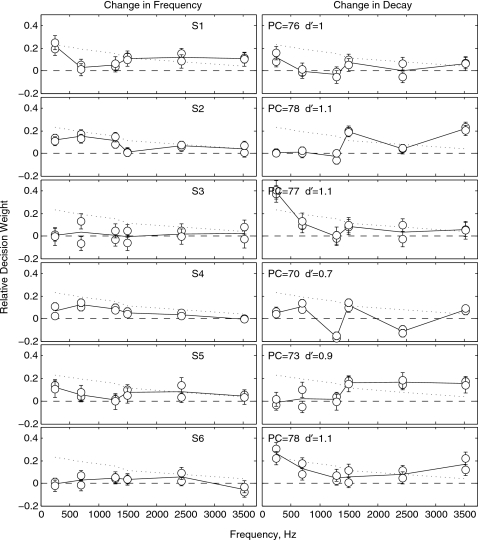
Figure 1 gives as open symbols the obtained estimates of bνi and bτi (panel columns) for each of six listeners (panel rows) for the condition in which the resonant source is the plate, and in which the amplitude and decay moduli of the partials decrease proportionally with frequency (low-pass condition).1 The two estimates shown in each case were computed separately from trials in which the target occurred in the first and second intervals of the forced-choice trial. As is common practice, the values have been normalized so that their unsigned magnitudes sum to unity (cf. Berg, 1990). This is done to allow comparisons of the pattern of weights across listeners free from differences in the effect of overall performance on the raw regression weights. Error bars on estimates have been scaled accordingly to permit identification of those values significantly greater than zero. Overall percent correct identification performance and corresponding d′ for each listener are also given. The differences in performance across listeners are small.
Figure 1.
Obtained decision weights for two-interval, forced-choice identification of target plates are given for each listener (panel rows) for the low-pass condition of experiment 1. Error bars give the standard error of estimate in each case. Dotted lines give the ML weights. The two panel columns give the decision weights separately for the change in frequency and change in decay of each partial. Performance levels (PC and d′) are also indicated for each listener.
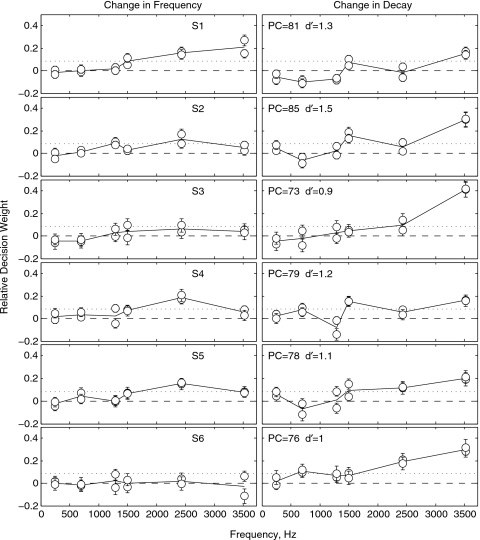
In many cases the listener decision weights deviate significantly from the ML weights, given by the dotted lines. Consider that there are 12 independent sources of information that can potentially inform decisions in this task, the values of two acoustic parameters for each of six partials. The short-dashed line shows ML decisions to be influenced equally by each source, whereas the estimates of listener weights show listener decisions to be dominated by only 2–3 sources. Note, here we define a dominant weight to be a mean value of at least two standard errors above the ML weight. There are clear differences among listeners regarding which of the 2–3 sources dominates judgments (compare for example listeners S1 and S6); these differences have been considered at length in a separate publication and have little bearing on the present analysis (see Lutfi and Liu, 2007). For present purposes, it is only important to note that, with only one exception, the 2–3 sources given dominant weight are those associated with the two highest-level partials in the complex, partials one and two. The exception is for S1, where there is a dominant weight on the decay of the fourth partial, which has an intermediate level. Figure 2 shows the listener decision weights for the high-pass condition (amplitude and decay modulus increasing proportionally with frequency). Here again we see a tendency, with few exceptions, for the judgments to be dominated by the two highest-level partials, which are now partials five and six. This shows that the relative level of partials, not their frequency, is the factor dictating which partials receive the greatest decision weight.
Figure 2.
Same as Fig. 1, except that the data are for the high-pass condition of experiment 1.
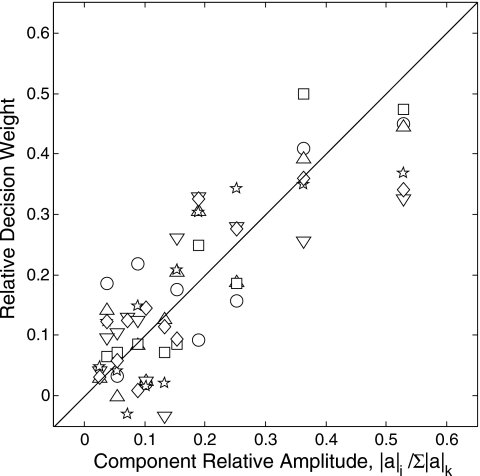
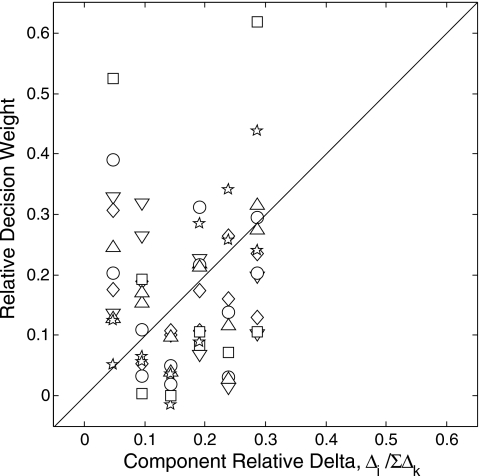
A better sense of the relation between the relative level of partials and the listeners’ decision weights is obtained from Fig. 3. The figure is a scatterplot of one variable against the other, where the separate decision weights on frequency and decay have been averaged and rescaled to obtain a single overall weight for each partial. Also, to permit direct comparisons between the two variables, the relative amplitudes, like the decision weights, have been scaled to sum to unity.2 The data plotted in this way roughly fall along the diagonal, though the strength of the relation is stronger for some listeners than others (symbol type). Across all listeners the Pearson product-moment correlation is r=0.81; hence, 66% of the variance in the listeners’ decision weights is accounted for by their linear relation to the relative amplitude of the partials. In comparison, no correlation with amplitude is expected for the decision weights of the ML observer, which in this plot would fall on a horizontal line.
Figure 3.
Scatterplot of the relation between the relative weights of listeners and the relative amplitude of partials for two-interval, forced-choice identification of target plates. Weights on the change in frequency and decay have been averaged for each listener to obtain a single weight for each partial (see the text for details). Symbols denote data from different listeners (S1=circle, S2=upright triangle, S3=square, S4=inverted triangle, S5=star, S6=diamond).
The data in Figs. 123 clearly show a strong relation between the relative level of partials and the listeners’ decision weights. We would like, however, a means to evaluate the relative importance of this effect. We achieved this in a follow-up experiment by comparing it to a factor that, for the maximum-likelihood observer, would be expected to have an even stronger influence on the decision weights, namely the relative amount of information for identification provided by the different partials. The listeners’ goal, as instructed, was to maximize the number of correct identifications. If listeners are only capable of giving a significant nonzero weight to 1–3 information-bearing partials at any one time, then we should expect these 1–3 partials to be those conveying the most diagnostic information regarding the source (i.e., having the highest d′). We repeated the experimental task with the same listeners, this time equating the relative amplitude and decay of partials (τ=0.2 s) and increasing or decreasing with partial number, i, the number of jnd’s distinguishing target and nontarget. When increasing with partial number, the number of jnd’s for both frequency and decay equaled i; when decreasing, the number of jnd’s equaled 6∕i.
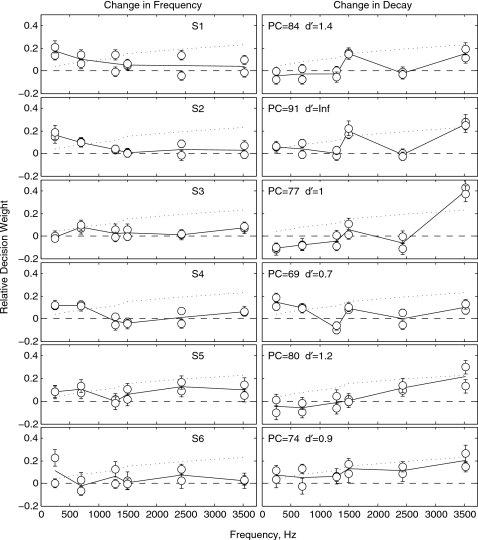
Figures 45 show, respectively, the estimates of decision weights obtained for jnd’s increasing and decreasing with partial number. The data are plotted as in Figs. 12 with the short-dashed line in each case giving the decision weights of the maximum-likelihood observer. We see in Fig. 4, for all six listeners, a dominant weight on the decay of the sixth partial which, consistent with expectations, is the highest information-bearing partial in the complex. Complicating the picture, however, is the fact that a dominant weight continues to be obtained for at least three of the listeners (S1, S2, and S4) on the frequency of the first partial, which is the lowest information-bearing partial. Moreover, in Fig. 5 we see for three listeners (S2, S5, and S6) the same dominant weight on the decay of the sixth partial, when this partial is the lowest information-bearing partial. A likely explanation of these results is that they reflect to some extent the difference in the relative level of partials across the two experiments. Note that, even though the levels of partials were equated in the present experiment, the sixth partial had a higher relative level than for the low-pass condition of Fig. 1, where it was the lowest level partial. The sixth partial in the present experiment may have thus received greater weight than in the previous low-pass condition for this reason.
Figure 4.
Same as Fig. 1, except that the data are for the variable jnd condition of experiment 1, jnd increasing with partial number.
Figure 5.
Same as Fig. 1, except that the data are for the variable jnd condition of experiment 1, jnd decreasing with partial number.
The data of Figs. 45 indicate a much weaker relation of listener decision weights to the relative information content of partials than to relative level. This is confirmed in Fig. 6, where the decision weights have been averaged as in Fig. 3 and plotted against relative information scaled to sum to unity. Across all listeners the Pearson product-moment correlation between the two variables is r=0.12 Relative information thus accounts for only 1% of the variance in the listeners’ decision weights, compared to 66% of the variance accounted for by relative level for the same highly practiced listeners. This result reinforces the importance of the level-dominance effect. It shows that a variable clearly relevant to identification actually has less influence on listener decision weights than one, which provides absolutely no information for identification.
Figure 6.
Scatterplot of the relation between the relative weights of listeners and the relative information content of partials (relative delta). Weights on the change in frequency and decay have been averaged for each listener to obtain a single weight for each partial (see the text for details). Symbols denote data from different listeners as in Fig. 3.
Experiment 2: Effect of partial number and resonant source
The foregoing results, while intriguing, do potentially admit to certain trivial interpretations given the manner in which they were obtained. One possibility is that the results simply reflect mutual masking among partials. That is, greater weight would be expected on higher-level partials if, by virtue of their higher level, these partials to some degree mask or make inaudible lower-level partials in the complex. Masking, in fact, provides a simple account of why partials one and six, the least information-bearing partials in Figs. 45, should receive a dominant weight for some listeners. Being on the spectral edges of the complex, these partials are expected to be subject to less masking and so more easily “heard out” (cf. Moore and Ohgushi, 1993).
We evaluated the effect of masking by using two additional sound sources, one for which masking should be much less of a factor than for the plate, and one for which it should be much more of a factor. The two sources were the struck bar and membrane described in Sec. I A. There should be no masking of consequence among partials of the bar, as there are only three partials extending over a frequency range of 250–4385 Hz. There should be much more masking for the membrane than the plate since the six partials of the membrane extend over a much smaller frequency range, 500–1459 Hz for the membrane, 250–3523 Hz for the plate. If mutual masking among partials was responsible for the level-dominance effect obtained earlier, then we should expect the effect to be absent in the case of the bar and even more pronounced in the case of the membrane.
Another factor that might have contributed to the level-dominance effect was the practice of providing information for identification in the differences in decay. Decay is a parameter that determines the relative energy of partials. Thus, it is possible that, by making decay relevant to the task, we may have inadvertently caused the relative level of partials to have a more significant effect on listener decision weights than they otherwise would have had if decay was irrelevant for identification.3 To test this possibility, we changed the task so that the only information for identification was the difference in the frequencies of partials (5 jnd’s in frequency for each partial for the bar, 4 jnd’s for the membrane and plate). This, parenthetically, provides a more sensitive measure of level dominance by eliminating the need to average weights, as in Figs. 36.
Finally, we incorporated a change to address a peculiar feature of the previous experimental design. In the previous experiments, partials 1 and 6 had special status in determining level dominance in that one or the other was always the highest-level partial in the complex. We wished to determine whether level dominance would be of the same magnitude when each partial was equally likely to be the highest-level partial in the complex. This was done by using the same levels as in the previous experiments, but shuffling the levels of partials (and corresponding decay) at random from trial to trial. For example, previously for the bar the levels of partials 1–3 were, respectively, 65, 49, and 41 dB SPL. In the present experiment they could be, respectively, 49, 65, 41 dB SPL, 41, 49, 65 dB SPL, or any other combination of these levels. Each listener received at least 400 trials of practice in the task before data collection. Average performance levels across listeners and conditions ranged from 68–73% correct (compared to the near-perfect performance of the ML observer).
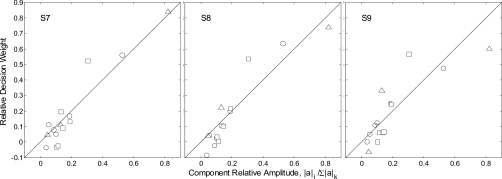
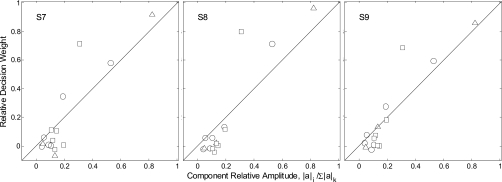
Figure 7 shows the relation between the obtained decision weights and the relative level of partials for three new listeners (panels). Data for the different sound sources are indicated by different symbol types (bar=triangles, membrane=squares, plate=circles). We conclude that masking is not a significant factor in these experiments as there are not the predicted differences in the relation between the decision weights and relative level across the different sound sources. The weights for the membrane do appear to increase at a slightly more rapid rate with relative level, as predicted by masking, but the effect, if real, is very small. Moreover, the weights for the bar, where no masking is expected, show the same strong relation to relative level as the weights for the plate. We also conclude that having information in decay did not previously bias the results as there is no significant reduction in the strength of the relation between the decision weights and relative level from experiment 1. Across all listeners the Pearson product-moment correlation is r=0.90, compared to 0.81 overall for the data in Fig. 3. The weaker correlation for the data of Fig. 3 likely reflects the effect of averaging over the weights for the change in decay and frequency for each partial, where in many cases only one of these weights was dominant. Finally, the fact that the strength of the relation is greater in this condition indicates that level dominance is not peculiar to partials one and six, but occurs for all partials in the complex.
Figure 7.
Scatterplot of the relation between the relative weights of listeners and the relative amplitude of partials for two-interval, forced-choice identification of target plates (circles), membranes (squares), and bars (triangles) for the random-level condition of experiment 2.
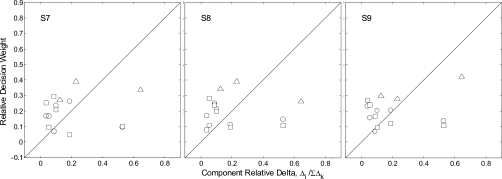
Figure 8 shows, for comparison to Fig. 7, the effect of the relative information content of partials. In this condition, the relative levels of partials were fixed (−6 dB∕oct) as in the low-pass condition of experiment 1; however, the difference in frequency for each partial varied at random from trial to trial (random-delta condition). Overall performance of the ML observer was equated to that of the random-level condition of Fig. 7 by selecting the component d′s so that the square-root of the sum of their squares equaled that of the earlier condition. Comparison of the data across these two conditions shows as before a much weaker relation of listener decision weights to the information content of partials than to the relative level of partials. This result is further confirmed by Fig. 9. This figure shows the relation of listener decision weights to the relative level of partials within the random-delta condition. There is somewhat more scatter in these data, as to be expected given the variation in delta; however, the data still show a stronger relation to relative level than to delta. Thus, even when the listener is given the option within a condition to base judgments on higher information-bearing partials they tend instead to base judgments on the higher-level partials.
Figure 8.
Scatterplot of the relation between the relative weights of listeners and the relative information content (delta) of partials for two-interval, forced-choice identification of target plates (circles), membranes (squares), and bars (triangles) for the random-delta condition of experiment 2.
Figure 9.
Scatterplot of the relation between the relative weights of listeners and the relative level of partials for two-interval, forced-choice identification of target plates (circles), membranes (squares), and bars (triangles) for the random-delta condition of experiment 2.
DISCUSSION
In answer to the three questions posed in the Introduction, we can now say with reasonable confidence that: (1) the level-dominance effect is not a phenomenon peculiar to the discrimination of arbitrary tone patterns, but is also obtained in a rudimentary sound source identification task; (2) the effect is not due to mutual masking among partials or to listener inexperience with the task; and (3) the relative level of partials has a stronger influence on listeners’ decision weights than does the relative information content of partials. Level dominance can thus be expected to have a detrimental impact on source identification performance when the highest-level partials in the sound are not the most informative regarding the source.
Given the last outcome, it seems difficult to justify from an ecological perspective why the auditory system would manifest a level-dominance effect. In everyday listening, the information in the highest-amplitude spectral components is not always the most diagnostic regarding the source, yet level dominance would suggest that this is the information which has the greatest influence on our perception. So, what possible advantage could level dominance have in everyday listening?
One can speculate by noting certain parallels to a better-known phenomenon in hearing; the precedence effect. The precedence effect refers to the observation that the perceived location of a sound source in a reverberant environment is dominated by the wavefront arriving first at the listener’s ears (Wallach et al., 1949; Blauert, 1971; Litovsky et al., 1999). This makes sense from an ecological standpoint since the first-arriving wavefront provides the most veridical information about the location of the sound source. Studies have shown, however, that the precedence effect depends not only on the first-arriving wavefront being first, but also on its level relative to later arriving wavefronts. Yost (2007), for example, reports that the lagging click in a click pair will begin to be heard as having its own localized image as its level is made more nearly equal to that of the leading click in the pair (a type of level-dominance effect). Similar results have been reported by Hafter et al. (2000) using more naturalistic piano tones as stimuli. These results also make sense from an ecological perspective, as in the real world the first-arriving wavefront is nearly always the most intense; rare exceptions occur when an obstacle blocks the direct path of the sound. Still another way level dominance might serve to benefit the listener is as an alerting mechanism. The fire alarm is made loud so that it will be heard, but also to attract our attention. Also, the most intense sound in our environment is typically emitted from the closest source, which is the source most likely to require our immediate attention and action. Could level dominance have evolved to alert us to imminent sources? While it seems interesting to speculate, this idea is likely impossible to test.
Notwithstanding our failure to offer a simple explanation of the effect, level dominance does appear real. Recent studies reporting the effect for the discrimination of multitone sequences have, as in the present study, ruled out trivial explanations in terms of mutual masking among stimulus components or listener inexperience with the task (Berg, 1990; Turner and Berg, 2007; Lutfi and Jesteadt, 2006). Lutfi and Jesteadt, moreover, have ruled out an explanation in terms of greater sensitivity to changes in the frequency or level of tones resulting from spread of excitation at high levels (cf. Jesteadt et al., 1977; Viemeister, 1972). They showed the level-dominance effect to be undiminished when the tones in the sequence are replaced by bursts of broadband Gaussian noise. Kidd and Watson (1992) also have reported what appears to be a related effect in which the detectability of a change in a single tone in a sequence is seen to improve as the tone occupies a greater proportion of the total duration of the sequence. The CoRE model, which has been successful in accounting for many results from multitone pattern discrimination studies, attributes both proportional-duration and level-dominance effects to a common mechanism involving the pooling of variance in patterns across frequency and time, with individual components contributing in proportion to their power (Lutfi, 1993; Oh and Lutfi, 1998). The pooling of variance is assumed to occur under conditions of high stimulus uncertainty in which the tone patterns vary widely from trial to trial with few statistical constraints. In a typical study, for example, the tone frequencies may vary at random over a range of 300–3000 Hz (Watson and Kelly, 1981; Neff and Dethlefs, 1995). The results of the present study suggest that this assumption might be relaxed somewhat. The equations of motion largely constrain the set of possible stimuli so the degree of variation is considerably less; by comparison to the above, just a few jnd’s in frequency.
To date, research on the perception of sound sources has been largely driven by prominent theories regarding how we perceive and act in the real world (cf. Bregman, 1990; Gibson, 1966; Helmholtz, 1877). The present study is an exception in that it was inspired by what seemed a provocative result in the literature on the discrimination of arbitrary multitone patterns. This too was the motivation of a study of sound source identification by Lutfi and Liu (2007). These authors found that listeners differ greatly in the reliance they place on different acoustic features when performing basic sound source identification tasks. Individual differences have not been widely reported in the literature on sound source identification, largely because of the practice of averaging over listener data. They have, however, been well documented in research on the discrimination of multitone patterns (Neff and Dethlefs, 1995; Lutfi, 1990; Lutfi et al., 2003; Watson and Kelly, 1981). In the multitone pattern studies the individual differences have been widely attributed to the unfamiliar and arbitrary nature of the stimuli used (Watson and Kelly, 1981; Lutfi, 1993). The results of Lutfi and Liu using naturalistic stimuli have since cast doubt on this idea. There currently exists a rich and growing literature on the discrimination of multitone patterns and, though the stimuli used in these studies are a far cry from real-world sounds, it would seem unwise to assume that the results have no bearing on the perception of real-world sounds. Future studies of sound source identification may indeed find this literature to be a useful resource.
ACKNOWLEDGMENT
This research was supported by a NIDCD grant R01 DC006875-03. The authors would like to thank Dr. Ervin Hafter, Dr. Brian Moore, and two anonymous reviewers for helpful comments on an earlier version of this manuscript.
Footnotes
These data were previously published as a subset of the data from another study by the present authors, having to do with individual differences in sound source identification (Lutfi and Lu, 2007). See Fig. 3 of that paper. They provided, in part, the impetus for the present study.
Note that the multiplicative scaling of these variables does not affect the strength of their linear relation.
Note that the conditions of this study are not adequate to distinguish the effects of energy, level, and decay. We use the term level dominance in the generic sense that it has been used in past studies.
References
- Anderson, T. W. (1971). An Introduction to Multivariate Statistical Analysis (John Wiley and Sons, New York: ), pp. 205–217. [Google Scholar]
- ANSI (1996) S3.6-1996. “American National Standards, Specification for Audiometers” (American National Standards Institute, New York).
- Berg, B. G. (1990). “Observer efficiency and weights in a multiple observation task,” J. Acoust. Soc. Am. 10.1121/1.399962 88, 149–158. [DOI] [PubMed] [Google Scholar]
- Blauert, J. (1971). “Localization and the law of the first wavefront in the median plane,” J. Acoust. Soc. Am. 10.1121/1.1912663 50, 466–470. [DOI] [PubMed] [Google Scholar]
- Bregman, A. S. (1990). Auditory Scene Analysis (M.I.T. Press, Cambridge, MA: ). [Google Scholar]
- Fletcher, N. H., and Rossing, T. D. (1991). The Physics of Musical Instruments (Springer, New York: ). [Google Scholar]
- Gibson, J. J. (1966). The Senses Considered as Perceptual Systems (Houghton-Mifflin, Boston: ). [Google Scholar]
- Hafter, E. R., Valenzuela, M. N., Stecker, G. C., and Crum, P. A. C. (2000). “Informational dominance in the auditory scene,” in Physiological and Psychophysical Bases of Auditory Function: Proceedings of the 12th International Symposium on Hearing, edited by Houtsma A. J. M., Kohlrausch A., Prijs V. F., and Schoonhoven R. (Shaker, Maastricht, The Netherlands: ).
- Hall, D. E. (1991). Musical Acoustics (Cole, Pacific Grove, CA: ), pp. 168–173. [Google Scholar]
- Helmholtz, H. (1877). On the Sensations of Tone as a Physiological Basis for the Theory of Music, 4th ed., translated by A. J. Ellis (Dover, New York, 1954). [Google Scholar]
- Jesteadt, W., Bacon, S. P., and Lehman, J. R. (1982). “Forward masking as a function of frequency, masker level, and signal delay,” J. Acoust. Soc. Am. 10.1121/1.387576 71, 950–962. [DOI] [PubMed] [Google Scholar]
- Jesteadt, W., Wier, C. C., and Green, D. M. (1977). “Intensity discrimination as a function of frequency and sensation level,” J. Acoust. Soc. Am. 10.1121/1.381278 61, 169–177. [DOI] [PubMed] [Google Scholar]
- Kidd, G. R., and Watson, C. S. (1992). “The proportion-of-total-duration rule for the discrimination of auditory patterns,” J. Acoust. Soc. Am. 10.1121/1.404207 92, 3109–3118. [DOI] [PubMed] [Google Scholar]
- Litovsky, R. Y., Colburn, H. S., Yost, W. A., and Guzman, S. J. (1999). “The precedence effect,” J. Acoust. Soc. Am. 10.1121/1.427914 106, 1633–1654. [DOI] [PubMed] [Google Scholar]
- Lutfi, R. A. (1990). “Informational processing of complex sound. II. Cross-dimensional analysis,” J. Acoust. Soc. Am. 10.1121/1.399182 87, 2141–2148. [DOI] [PubMed] [Google Scholar]
- Lutfi, R. A. (1993). “A model of auditory pattern analysis based on component-relative-entropy,” J. Acoust. Soc. Am. 10.1121/1.408204 94, 748–758. [DOI] [PubMed] [Google Scholar]
- Lutfi, R. A. (2008). “Sound Source Identification,” in Springer Handbook of Auditory Research: Auditory Perception of Sound Sources, edited by Yost W. A. and Popper A. N. (Springer, New York: ), pp. 19–28. [Google Scholar]
- Lutfi, R. A., and Jesteadt, W. (2006). “Molecular analysis of the effect of relative tone level on multitone pattern discrimination,” J. Acoust. Soc. Am. 10.1121/1.2361184 120, 3853–3860. [DOI] [PubMed] [Google Scholar]
- Lutfi, R. A., and Liu, C.-J. (2007). “Individual differences in source identification from synthesized impact sounds,” J. Acoust. Soc. Am. 10.1121/1.2751269 122, 1017–1028. [DOI] [PubMed] [Google Scholar]
- Lutfi, R. A., and Oh, E. (1997). “Auditory discrimination of material changes in a struck-clamped bar,” J. Acoust. Soc. Am. 10.1121/1.420151 102, 3647–3656. [DOI] [PubMed] [Google Scholar]
- Lutfi, R. A., Oh, E., Storm, E., and Alexander, J. M. (2005). “Classification and identification of recorded and synthesized impact sounds by practiced listeners, musicians and nonmusicians,” J. Acoust. Soc. Am. 10.1121/1.1931867 118, 393–404. [DOI] [PubMed] [Google Scholar]
- Lutfi, R. A., Kistler, D. J., Oh, E. L., Wightman, F. L., and Callahan, M. R. (2003). “One factor underlies individual differences in auditory informational masking within and across age groups,” Percept. Psychophys. 65(3), 396–406. [DOI] [PMC free article] [PubMed] [Google Scholar]
- Massaro, D. M. (1975). “Backward recognition masking,” J. Acoust. Soc. Am. 10.1121/1.380765 58, 1059–1065. [DOI] [PubMed] [Google Scholar]
- McAdams, S., Chaigne, A., and Roussarie, V. (2004). “The psychomechanics of simulated sound sources: Material properties of impacted bars,” J. Acoust. Soc. Am. 10.1121/1.1645855 115, 1306–1320. [DOI] [PubMed] [Google Scholar]
- Moore, B. C. J., and Ohgushi, K. (1993). “Audibility of partials in inharmonic complex tones,” J. Acoust. Soc. Am. 10.1121/1.405625 93, 452–461. [DOI] [PubMed] [Google Scholar]
- Moore, B. C. J., Glasberg, B. R., and Peters, R. W. (1985). “Relative dominance of individual partials in determining the pitch of complex tones,” J. Acoust. Soc. Am. 10.1121/1.391936 77, 1853–1860. [DOI] [Google Scholar]
- Morse, P. M., and Ingard, K. U. (1968) Theoretical Acoustics (Princeton University Press, Princeton, NJ: ), pp. 175–191. [Google Scholar]
- Neff, D. L, and Dethlefs, T. M. (1995). “Individual differences in simultaneous masking with random-frequency, multicomponent maskers,” J. Acoust. Soc. Am. 10.1121/1.413748 98, 125–134. [DOI] [PubMed] [Google Scholar]
- Neff, D. L., and Jesteadt, W. (1996). “Intensity discrimination in the presence of random-frequency, multicomponent maskers and broadband noise,” J. Acoust. Soc. Am. 10.1121/1.417938 100, 2289–2298. [DOI] [PubMed] [Google Scholar]
- Oh, E., and Lutfi, R. A. (1998). “Nonmonotonicity of informational masking,” J. Acoust. Soc. Am. 10.1121/1.423932 104, 3489–3499. [DOI] [PubMed] [Google Scholar]
- Schlauch, R. S., Ries, D. T., and DiGiovanni, J. J. (2001). “Duration discrimination and subjective duration for ramped and damped sounds,” J. Acoust. Soc. Am. 10.1121/1.1372913 109, 2880–2887. [DOI] [PubMed] [Google Scholar]
- Turner, M. D., and Berg, B. G. (2007). “Temporal limits of level dominance in a sample-discrimination task,” J. Acoust. Soc. Am. 10.1121/1.2710345 121, 1848–1851. [DOI] [PubMed] [Google Scholar]
- Viemeister, N. (1972). “Intensity discrimination of pulsed sinusoids: The effects of filtered noise,” J. Acoust. Soc. Am. 10.1121/1.1912970 51, 1265–1269. [DOI] [PubMed] [Google Scholar]
- Wallach, H., Newman, E. B., and Rosenzweig, M. R. (1949). “The precedence effect in sound localization,” Am. J. Psychol. 10.2307/1418275 62, 315–336. [DOI] [PubMed] [Google Scholar]
- Watson, C. S., and Kelly, W. J. (1981). “The role of stimulus uncertainty in the discrimination of auditory patterns,” in Auditory and Visual Pattern Recognition, edited by Getty D. J. and J. H.Howard, Jr. (Lawrence Erlbaum Associates, Hillsdate, NJ: ), pp. 37–59. [Google Scholar]
- Wier, C. C., Jesteadt, W., and Green, D. M. (1977). “Frequency discrimination as a function of frequency and sensation level,” J. Acoust. Soc. Am. 10.1121/1.381251 61, 178–184. [DOI] [PubMed] [Google Scholar]
- Yost, W. A. (2007). “Lead-lag precedence paradigm as a function of relative level and number of lag stimuli,” in 19th International Congress on Acoustics, Madrid.


