Abstract
The healing process in guinea pig skin following surgical incisions was evaluated at the molecular level, in vivo, by the use of Raman spectroscopy. After the incisions were closed either by suturing or by laser tissue welding (LTW), differences in the respective Raman spectra were identified. The study determined that the ratio of the Raman peaks of the amide III (1247 cm−1) band to a peak at 1326 cm−1 (the superposition of elastin and keratin bands) can be used to evaluate the progression of wound healing. Conformational changes in the amide I band (1633 cm−1 to 1682 cm−1) and spectrum changes in the range of 1450 cm−1 to 1520 cm−1 were observed in LTW and sutured skin. The stages of the healing process of the guinea pig skin following LTW and suturing were evaluated by Raman spectroscopy, using histopathology as the gold standard. LTW skin demonstrated better healing than sutured skin, exhibiting minimal hyperkeratosis, minimal collagen deposition, near-normal surface contour, and minimal loss of dermal appendages. A wavelet decomposition-reconstruction baseline correction algorithm was employed to remove the fluorescence wing from the Raman spectra.
Keywords: Laser tissue welding, Raman spectroscopy, skin wound healing, collagen deposition, wavelet, vibrational modes
1. Introduction
The healing process in skin following surgical incision includes a series of overlapping stages [1]. Immediately after incision, platelet aggregation and blood coagulation form the dense cross-linked network (provisional matrix) which prevents blood loss. The matrix is deposited at the wound site and provides the main structural support. The main components of the provisional matrix are fibrin and fibronectin proteins. At 24 hours after an injury, the polymorphonuclear neutrophils (PMNs) arrive, becoming the predominant type of cell at the wound area [1]. PMNs are crucial in developing an inflammatory response [2]. The PMNs fight bacteria and release the proteases, which break down damaged tissues [3-5]. Approximately 48 hours after the injury, fibroblasts begin to enter the wound site, replacing the provisional matrix with granulation tissue composed of fibronectin and collagen. The number of fibroblasts reaches a maximum in the first or second week post-wound. Fibronectin-rich granulation tissue provides a vascularized network for the deposition of collagen. Scar tissue is created from the bundled and cross-linked collagen fibrils. The most rapid changes in the extent of collagen deposition and tensile strength in the wounded skin occur at six or seven weeks post-injury, after which the rate of change flattens [6]. Ideally, healed skin tissue should exhibit minimal scar formation.
Near-infrared (NIR) laser tissue welding (LTW) is a promising alternative to conventional wound-closing techniques, such as sutures, staples, or clips [7]. In NIR LTW experiments, an NIR laser is tuned to an overtone of water vibrational band at 1455 nm. Absorption of laser light results in local, controlled heating of water molecules in tissue. Water in tissue exists in both free and bound states. Bound water stabilizes the collagen matrix by mediating bonding between fibers of the triple helix [8]. The absorbed energy is transferred from the water to the collagen matrix.
The rate of energy inputted, and therefore the temperature, can be precisely controlled by varying laser power, spot size, and exposure time. Careful control of the laser energy input can result in partial denaturation of the collagen helix, followed by renaturation. This results in the rapid formation of a watertight seal at the welded site. Recently, several extensive studies of ex vivo LTW of skin, aorta, and ocular tissue were performed [9-13].
This study monitored the healing dynamics of incisions closed by sutures and LTW, using Raman spectroscopy in vivo. The ratio of the intensity of the amide III band (1247 cm−1), which are mostly from the collagen, to the intensity of the 1326 cm−1 band provides information about collagen deposition and, hence, the status of wound healing. The 1326 cm−1 band is a superposition of Raman signals from elastin [14, 15] and keratins [16, 17]. The measurements were performed at 48 hours, 7 days, 20 days, and 40 days after the operation, times corresponding to the major phases in the skin repair process.
Skin is a complex organ comprising several layers, each with a different molecular composition. The epidermis, or external layer of the skin, is composed mostly of keratins in the α-helical state. The guinea pig epidermis consists of two to three layers of keratinocytes with a thickness of 20 to 40 μm , which compares to a thickness of 75 to 150 μm for the human epidermis [16, 19-21]. Raman bands at 1340 cm−1 and 1320 cm−1are predominantly from the epidermal keratins [16]. The guinea pig dermis is 1 to 2 mm thick [17]. The major component of the dermis's extracellular matrix is collagen, which accounts for approximately 80 percent of its dry weight [18]. Elastin, the core constituent of the elastic fibers of connective tissue, accounts for only 2 to 4 percent of the dermis's dry weight. Elastin contains desmosine and isodesmosine. Desmosine analysis is used to determine the amount of elastin fibers in tissue. Desmosine concentrations, and hence elastin content, in guinea pig skin is approximately 350 pmol, half the levels found in human skin [19].
Raman spectroscopy provides direct information regarding the secondary structure of proteins. A number of studies discuss the influences of conformation changes in proteins — especially the transformation of α-helixes and of β-sheets to random states and the different percentages of α-helixes and β-sheets in protein structure on Raman shift of the amide I band [20-24]. The amide I vibrational mode consists of carbonyl C=O stretching with a small contribution from C-N stretching and H-N bending [24]. The profile of the amide I band is sensitive to protein conformational changes [25]. The 1661 cm−1 amide I peak arises from helix-related hydrogen-bonded carbonyls [21, 26], while the lower energy amide I peak at 1633 cm−1 arises from disordered carbonyls. Tarnowski et al. [20] found that the conversion of reducible cross-links to nonreducible cross-links in collagen resulted in a increase in the Raman spectrum intensity at 1660 cm−1 relative to 1630 cm−1. Tsunoda et al. [21] investigated the role of water in laser ablation of corneal collagen tissue and compared the amide I band for collagen fibers and gelatin (denatured collagen). They found that the amide I peak at 1661 cm−1 is higher in intensity than the 1633 cm−1 peak in collagen fiber, but in gelatin, the 1633 cm−1 peak is more intense. Goheen et al. [23] employed Raman spectroscopy to investigate changes in corneal collagen due to aging and heat denaturation and observed that heat-denatured collagen experienced broadening of the amide I and III bands. Lin et al. [27] studied the thermally induced conformational changes of α-helixes to β-sheets in human fibrinogen proteins. The increase of the β-sheet (1670 cm−1) component compared to the α-helix component (1654 cm−1) caused by thermal denaturation was observed in the Raman spectrum of the fibrillogen. Gnanakaran et al. [28] investigated the behavior of the amide I band as peptides changed from completely helical to random coils. They employed replica-exchange molecular dynamics (REMD) simulations to determine shifts in the Raman spectrum. Broadening of the Raman line was observed, with increasing structural inhomogeneity of the proteins [22, 24].
The CH2-CH3 bending protein band (1451 cm−1) is insensitive to protein secondary structure and depends only on the concentrations of CH2 and CH3 groups [29, 30]. The spectral changes in the region of 1440 cm−1 to 1520 cm−1 are caused, not by the changing of protein structure, but by the formation of new components in the biological system. The protein bands overlaps with the phospholipids band (1440 cm−1) [29]. The peak near 1520 cm−1 is related to carotene content and has been observed in the Raman spectrum from blood serum [31].
Raman spectroscopy can serve as a tool to investigate the molecular changes which occur as a result of LTW and can provide a method to evaluate the healing of incisions. The major drawback to Raman measurements in tissues is the presence of a strong fluorescence wing [32], which can obscure the relatively weaker Raman signals. Several baseline correction methods exist that take advantage of the narrowness of Raman bands compared to the background signals to remove unwanted background [33, 34]. Two methods frequently used in biological specimens to subtract the fluorescence wing from Raman spectra are polynomial subtraction [35] and wavelet transforms [36, 37].
In the work presented here, we demonstrated that in situ Raman spectroscopy can be used to evaluate weld quality and the status of wound healing. The ratio of intensity of the amide III band to the 1326 cm−1 band can indicate the status of the tissue repair process.
2. Materials and methods
All animal studies were approved by the Institutional Animal Care and Use Committee (IACUC) of The City College of New York. This study used a total of eight adult female albino guinea pigs (Cavia porcellus) between the ages of seven and eight weeks and weighing approximately 500 g. The animals were weighed and anesthetized appropriately with isoflurane (2-chloro-2-difluoromethoxy-1,1,1-trifluoro-ethane; Errane Baxter Health Care Corporation, IL) via an anesthesia vaporizer (V-1 Table Top Anesthesia Machine; Vetiquip, Pleasanton, CA). All animals were given buprenorphine (pain medication) after surgery to alleviate their musculoskeletal pain. The surgery was performed on a customized operation table equipped with a mechanical clamping system, consisting of two grips made of a mesh of pins. The clamping system was used to appose the tissue during LTW. A total of four incisions were made with a No. 3 scalpel on the back of each guinea pig. Each incisions was 1 cm long and 2 mm deep (skin deep). The four incisions were parallel to the guinea pig's spine at 2 cm intervals. One of the incisions was closed with evenly spaced 5-0 nylon sutures. The sutured incision served as a control. The remaining three incisions were laser welded, with either a 1455 nm continuous wave (CW) fiber laser (model BWF2, B&W Tek, Inc., Newark, DE) or a 1560 nm femtosecond (fs) pulsed fiber laser (IMRA America, Ann Arbor, MI). The CW laser emission (1455 nm) is at the maximum of the overtone absorption band, and its penetration depth (90 percent absorption) into tissue is approximately 1 mm [38, 39]. The fs laser, at 1560 nm, is at the long wavelength edge of the overtone band; thus, the absorption is weaker. At 1560 nm, the penetration depth into tissue is about 3.3 mm.
Tissues were welded using a preset eight-line pattern to reduce thermal damage. Laser light was delivered to the animals via an optical fiber and focused with a microscope objective to a nominal spot size of 80 μm. However, light scattering in the tissue broadened the spot size to approximately 0.5 mm. The focusing objective was mounted on a three-axis motorized translation stage controlled by a computer. This setup allowed the laser to follow the incision line during welding. The laser fluence was in the range of 6100 to 6500 J/cm2.
Animals were sacrificed 2, 7, 20, and 40 days after the LTW for histological analysis, two animals for each time period. The time frame for wound evaluation and animal sacrifice corresponds to physiological and biochemical responses that occur in the animals.
The Raman spectra were collected with a Raman spectrometer (Model R2000, Ocean Optics, Dunedin, FL) connected to a personnel computer. The R2000 uses a 300 mW NIR laser diode emitting at 785 nm for excitation. Excitation and light collection were at normal incidence through a bifurcated optical fiber. The collection arm of the fiber contained a notch filter to block scattered excitation light. Penetration depth at 785 nm is approximately 2 mm in skin [40]. Raman spectra were acquired from each of the four incisions on live animals while under anesthesia. A total of four animals were studied, four incisions on each animal. For two animals, the Raman spectra were acquired throughout the healing process (spectra were acquired immediately post-operation [PO], as well as at days 2, 7, 20, and 40 PO; for one animal, the Raman spectra were measured immediately PO and on day 2 PO; for the other animal, the Raman spectra were measured on day 40 PO). The Raman spectra were measured at three different locations directly on the weld or sutured lines. Raman spectra were also acquired at a distance of 2 to 3 cm away from the incision for each animal. These spectra served as control measurements. The control spectra were collected each time that Raman spectra were acquired at the incision site. The integration time varied from 15 to 30 seconds. Three spectra were collected at each location and averaged to reduce the noise level.
Baseline correction
A hybrid baseline correction algorithm, as described in Hu et al [37], was applied to remove the fluorescence wing from the spectra. Calculations were performed on a PC using MathLab (The Mathworks, Natick, MA). The software algorithm requires that the number of data points be a power of 2. Although the R2000 spectrometer uses a 2048 pixel array, the lower-order pixels overlap the excitation laser wavelength, and higher-order pixels cover wavelengths near the limits of detector sensitivity. Therefore, the spectra were reduced to 1024 points, spanning the range from 930 to 2370 cm−1.
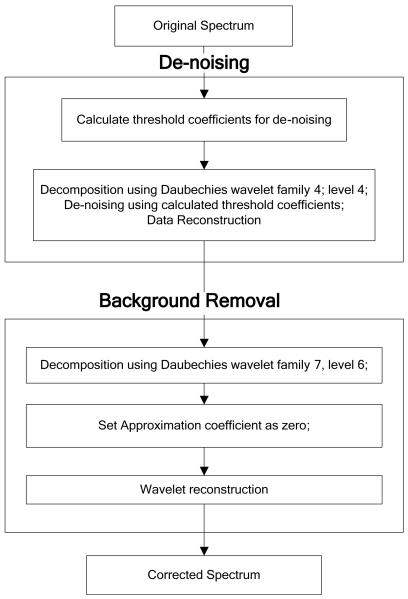
The wavelet-based baseline correction is a three-step process. First the signal is denoised, followed by low-frequency baseline removal and, lastly, reconstruction of the Raman spectrum. Denoising was performed using the Daubechies family of wavelets with order 4 and level 4. The default denoising threshold matrix was calculated, and a hard threshold was applied to detail coefficients for levels 1 to 4. The smoothed spectrum was then reconstructed.
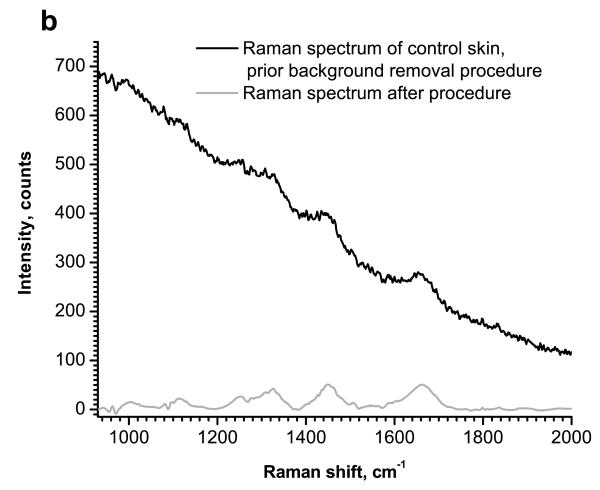
Baseline removal uses a multilevel decomposition. The optimal order and level for a Daubechies wavelet family is determined experimentally. For the data set analyzed in this work, it was found to be db7 with level 7. The third step is signal reconstruction. Approximation coefficients contain low-frequency information and should be zeroed. Detail coefficients for levels 1 to 7 were not changed. The wavelet reconstruction function was applied using modified coefficients, and the reconstructed signal was retrieved. The baseline removal and denoising processes are shown schematically in Fig. 1a. Fig. 1b shows the Raman spectrum before the baseline removal and denoising processes and after removal was performed.
Figure 1.
Schematic diagram of the wavelet-based denoising and baseline correction procedures (a) and Raman spectra of control (normal) skin before and after the background removal procedure (b).
At each time point, the ratio of the intensity at 1247 cm−1 (amide III) to the intensity at 1326 cm−1 (elastin and keratins) (ratio 1247 cm−1/1326 cm−1) was calculated.
3. Results and discussion
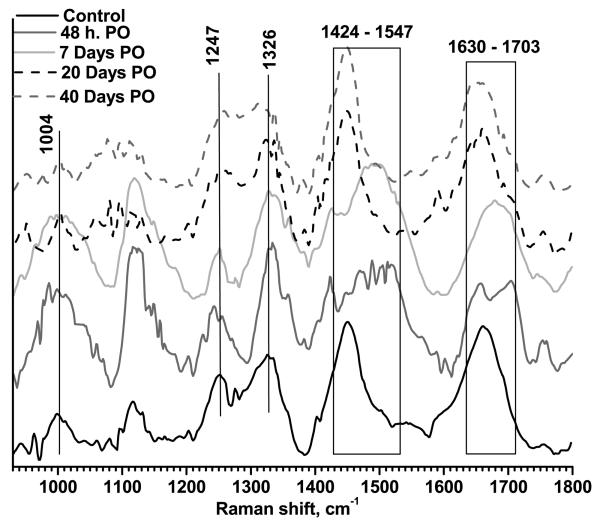
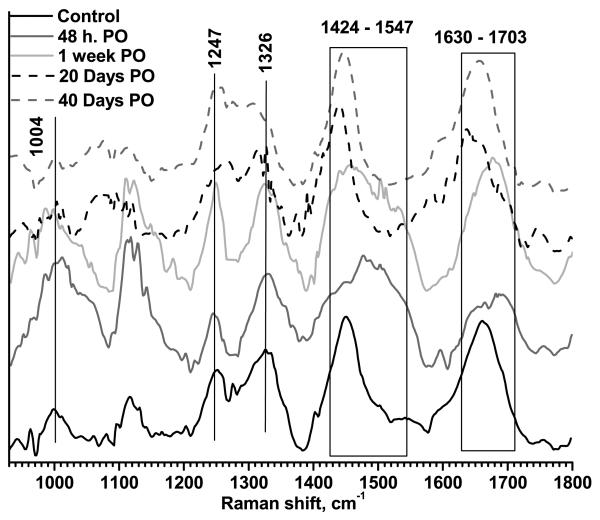
The typical Raman spectra at 48 hours, 7, 20, and 40 days PO are displayed in Fig. 2, for LTW incisions, and Fig. 3, for sutured incisions. Control skin samples (spectra acquired prior to incision) are also shown in the figures. The most intense and characteristic Raman peaks from normal skin are at 1004 cm−1 (phenylalanine), 1117 cm−1 and 1247 cm−1 (both from amide III), 1326 cm−1 (superposition of elastin and keratin bands), 1448 cm−1 (protein CH2- CH3- bending) and 1656 cm−1 (amide I).
Figure 2.
Typical Raman spectra for LTW skin. Measurements were performed for a control sample, 48 hours PO, and 7, 20, and 40 days PO. Data were normalized to unity.
Figure 3.
Typical Raman spectra for surgically sutured skin. Measurements were performed for a control sample, 48 hours PO, and 7, 20, and 40 days PO. Data were normalized to unity.
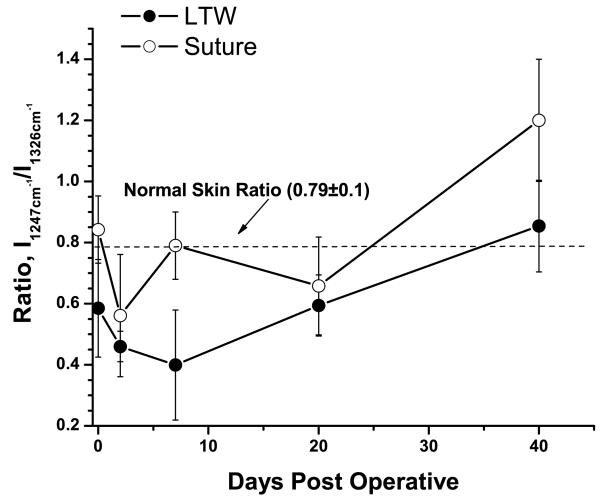
In order to characterize the degree of tissue repair at the incision site, the intensity of the amide III band at 1247 cm−1 relative to the intensity at 1326 cm−1 was used. The 1326 cm−1 Raman spectrum consisted of a superposition of the desmosine and isodesmosine bands at 1335 cm−1 (components of elastin) and keratin band at 1320 cm−1. Both elastin and keratins are indicators of the status of tissue repair. The I1247/I1326 ratio calculated for both welded and sutured incisions was plotted as a function of time in Fig. 4. The I1247/I1326 ratio for non-incised skin was 0.79±0.10.
Figure 4.
Ratio of intensities of the amide III band (1247 cm−1) to elastin/keratin bands (1326 cm−1) as a function of time PO. Solid circles show the changing of the ratio for LTW incisions; open circles, for the sutured incisions. The dashed line shows the ratio value for normal skin.
Immediately following LTW, a small decrease in the ratio, to 0.55±0.16 (p=0.19), was observed, most likely due to the thermal denaturation of collagen fibers. The sutured tissue experienced no thermal exposure; hence, its I1247/I1326 ratio, 0.83±0.11, was close to that of normal skin (p>0.5). A shift of the amide I band to 1670 cm−1 from 1656 cm−1 was observed for laser-welded skin incisions. This shift was likely due to thermal denaturation of the collagen fibers and transformation from highly ordered α-helix (1654 cm−1) to lower-ordered β-sheets (1670 cm−1). In sutured incisions, the amide I peak position shifted to 1653 cm−1, indicating that the collagen remained well ordered at the sutured incision site.
On day 2 PO, a significant decrease in the I1247/I1326 ratio occurred for both welded and sutured tissues. For LTW incisions, the ratio value was 0.46±0.05 (p<0.1) and, for the sutured incisions, it was 0.54±0.2 (p<0.1). Both welded and sutured samples exhibited a lower ratio compared to the normal skin I1247/I1326 ratio. The amide I band continued to shift to lower energy (1690 cm−1) for both LTW and sutured incisions. The amide I band also exhibited broadening due to an increase in Raman spectra contributions from many different conformational states — both ordered and random. At this stage of the tissue repair process, the damaged tissue was being removed by the action of macrophages and was being replaced by a provisional matrix. The removal of the damaged tissue was accompanied by tissue denaturation, which caused conformational changes in proteins, such as α-helical transitions to β-sheet and/or to random coils. Significant broadening of the band in the 1448 cm−1 to 1547 cm−1 range was observed for both LTW and sutured tissues. The incision area contained clotted blood and exhibited significant inflammation. Thus, the Raman markers from the blood could be observed. The 1520 cm−1 peak is associated with β-carotene [15, 31, 41] in blood serum or from the crust of fibrin and inflammatory cell debris, and peaks at the 1501 to 1512 cm−1 range are associated with enzyme-catalyzed ring openings from the hem proteins [41]. The superposition of the 1448 cm−1 protein band onto the 1501 cm−1, 1523 cm−1, and 1547 cm−1 peaks contributed to the broadening of the Raman spectra in the 1448 to 1547 cm−1 region. The integral intensity of the Raman spectra from the 1448 to 1547 cm−1 range was greater for LTW incisions than for sutured ones.
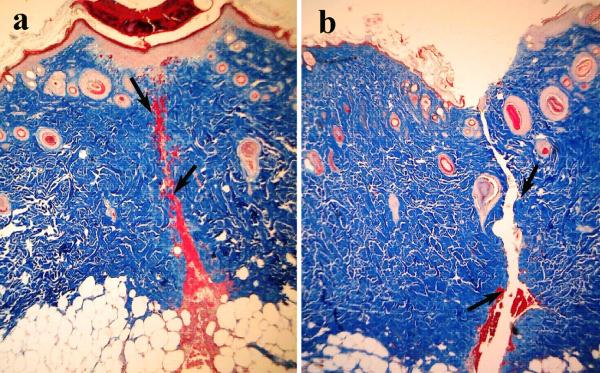
On day 7 PO, the I1247/I1326 ratio for the LTW skin incisions continued to decrease, reaching a value of 0.4±0.18 (p<0.1), but for sutured tissue, the I1247/I1326 ratio, 0.79±0.11 (p>0.5), returned to that of normal skin. The decrease in Raman intensity of the amide III band at this time point is related to the removal of damaged tissue and formation of granulation tissue. Serial sections of Masson's trichrome staining performed on LTW skin at day 7 PO show almost complete wound healing of the epidermis, the presence of granulation tissue in the dermis, and significant inflammatory cell infiltration (Fig. 5a). Hyperkeratosis was also observed in the LTW tissue. In contrast, the sutured incision exhibited very minimal healing of the epidermis, minimal granulation tissue in the dermis, and no inflammatory cell infiltration (Fig. 5b). A significant shift in the amide I band to 1680 cm−1 was observed on day 7 PO for both sutured and LTW samples. Broadening of the band in the 1448 to 1547 cm−1 range was observed. The position of the peak maximum shifted to 1447 cm−1 for sutured skin, but for LTW skin incisions, the position of the maxima was 1488 cm−1.
Figure 5.
40x microscopic images of Masson's trichrome histology of serial sections of LTW (a) and sutured (b) skin at day 7 PO. Arrows show the incision lines.
On day 20 PO, an increase in the I1247/I1326 ratio to a value of 0.59±0.1 (p<0.1) was observed for LTW skin. The ratio was still significantly lower than that of normal skin. For sutured incisions, the ratio decreased to 0.66±0.16 (p<0.1), which was not significantly different the day 7 ration, within a 90 percent confidence interval (p=0.34). At this time point, several observed changes in the Raman spectra indicated that the incised tissues were beginning to return to a normal state. The peak of the amide I band was 1659 cm−1 for LTW and two peaks at 1636 cm−1 and at 1657 cm−1 for sutured incisions. Shift to the higher energy indicates the formation more ordered structural proteins. The Raman spectra in the 1448 to 1547 cm−1 range narrowed and appeared similar to those of normal skin, which is dominated by CH2-CH3 bending in protein.
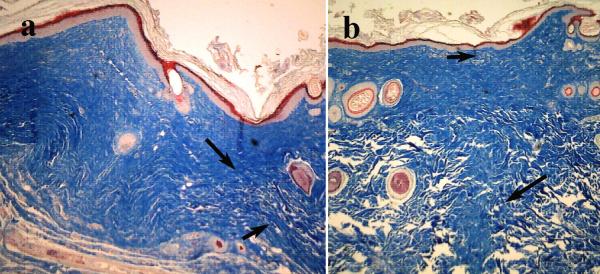
On day 40 PO, the I1247/I1326 ratio, 0.85±0.15 (p>0.1), for the LTW incisions was close to normal levels, but for sutured skin, the I1247/I1326 ratio was higher than the normal skin ratio, with a value of 1.2±0.2 (p>0.5). Raman markers for the amide I and CH2-CH3 protein bending bands were similar to those of normal skin. While collagen deposition, as evidenced by an increase in the I1247/I1326 ratio, started at an earlier time and continued more excessively for the surgically sutured skin than for LTW one. On day 40 PO, the sutured skin exhibited excessive collagen formation compared to normal skin, whereas LTW skin exhibited the same collagen content as normal skin. The intensity of the amide III band for the sutured skin was higher than the amide III bands of either the normal or LTW skin, reflecting the excessive collagen formation. Histology images reveal that the laser-welded skin incisions exhibited a near-normal epidermis with minimal hyperkeratosis, minimal collagen deposition, near-normal surface contour, and minimal loss of dermal appendages (Fig. 6a). The sutured tissues exhibited hyperkeratosis and a thickened epidermis, extensive collagen deposition in an irregular pattern, an irregular surface contour, and extensive loss of dermal appendages (Fig. 6b). The histology data confirmed the results from the analysis of the Raman spectra.
Figure 6.
40x microscopic images of Masson's trichrome histology of serial sections of LTW (a) and sutured skin incisions (b) at day 40 PO. Arrows show the incision lines.
4. Conclusion
LTW of the skin is very promising method of wound closure, especially when scar formation is undesirable, such as in plastic surgery. In situ Raman measurements of the healing process allowed in vivo investigation into the degree of collagen deposition, formation of new tissue, and conformational changes in proteins. The intensity ratio of the 1247 cm−1 band to the 1326 cm−1 band proved to be a good marker for collagen deposition and for measuring the extent of the healing process. LTW skin after 40 days PO exhibited an appearance like normal skin; the Raman spectra show that the skin successfully healed and was practically identical to normal skin. Raman analysis of the amide I band revealed that the sutured skin exhibited greater collagen content than either normal or LTW tissue, which was confirmed by histology. The amide III band and protein bands exhibited shifts and broadening during the healing process, but returned to a more normal appearance at 40 days PO, when healing was complete.
Acknowledgments
This study was supported by grant R01EB000297 from the National Institute of Biomedical Imaging and Bioengineering. We thank Y. Budansky of CCNY for helpful suggestions for improving the LTW apparatus.
Footnotes
Publisher's Disclaimer: This is a PDF file of an unedited manuscript that has been accepted for publication. As a service to our customers we are providing this early version of the manuscript. The manuscript will undergo copyediting, typesetting, and review of the resulting proof before it is published in its final citable form. Please note that during the production process errors may be discovered which could affect the content, and all legal disclaimers that apply to the journal pertain.
References
- 1.Midwood KS, Williams LV, Schwarzbauer JE. Tissue repair and the dynamics of the extracellular matrix. Int. J. Biochem. Cell Biol. 2004;36:1031–1037. doi: 10.1016/j.biocel.2003.12.003. [DOI] [PubMed] [Google Scholar]
- 2.Martin P, Leibovich SJ. Inflammatory cells during wound repair: the good, the bad and the ugly. Trends Cell Biol. 2005;15:599–607. doi: 10.1016/j.tcb.2005.09.002. [DOI] [PubMed] [Google Scholar]
- 3.Segal AW. How neutrophils kill microbes. Annu Rev Immunol. 2005;23:197–223. doi: 10.1146/annurev.immunol.23.021704.115653. [DOI] [PMC free article] [PubMed] [Google Scholar]
- 4.Underhill DM, Ozinsky A. Phagocytosis of microbes: complexity in action. Annu Rev Immunol. 2002;20:825–852. doi: 10.1146/annurev.immunol.20.103001.114744. [DOI] [PubMed] [Google Scholar]
- 5.Underhill DM, Ozinsky A. Toll-like receptors: key mediators of microbe detection. Curr Opin Immunol. 2002;14:103–110. doi: 10.1016/s0952-7915(01)00304-1. [DOI] [PubMed] [Google Scholar]
- 6.Levenson SM, Geever EF, Crowley LV, Oates JF, Berard CW, Rosen H. The healing of rat skin wounds. Ann. Surg. 1965:293–308. doi: 10.1097/00000658-196502000-00019. [DOI] [PMC free article] [PubMed] [Google Scholar]
- 7.Bass LS, Treat MR. Laser tissue welding: a comprehensive review of current and future clinical applications. Lasers Surg Med. 1995;17:315–349. doi: 10.1002/lsm.1900170402. [DOI] [PubMed] [Google Scholar]
- 8.Brodsky B, Ramshaw JA. The collagen triple-helix structure. Matrix Biol. 1997;15:545–554. doi: 10.1016/s0945-053x(97)90030-5. [DOI] [PubMed] [Google Scholar]
- 9.Tang J, Zeng F, Savage H, Ho PP, Alfano RR. Fluorescence spectroscopic imaging to detect changes in collagen and elastin following laser tissue welding. J. Clin. Laser Med. Surg. 2000;18:3–8. doi: 10.1089/clm.2000.18.3. [DOI] [PubMed] [Google Scholar]
- 10.Tang J, Zeng F, Evans JM, Xu B, Savage H, Ho PP, Alfano RR. A comparison of Cunyite and Fosterite NIR tunable laser tissue welding using native collagen fluorescence imaging. J. Clin. Laser Med. Surg. 2000;18:117–123. doi: 10.1089/clm.2000.18.117. [DOI] [PubMed] [Google Scholar]
- 11.Gayen TK, Katz A, Savage HE, McCormick SA, Al-Rubaiee M, Budansky Y, Lee J, Alfano RR. Aorta and skin tissues welded by near-infrared Cr4+:YAG laser. J. Clin. Laser Med. Surg. 2003;21:259–269. doi: 10.1089/104454703322564460. [DOI] [PubMed] [Google Scholar]
- 12.Savage HE, Halder RK, Kartazayeu U, Rosen RB, Gayen T, McCormick SA, Patel NS, Katz A, Perry HD, Paul M, Alfano RR. NIR laser tissue welding of in vitro porcine cornea and sclera tissue. Lasers Surg. Med. 2004;35:293–303. doi: 10.1002/lsm.20094. [DOI] [PubMed] [Google Scholar]
- 13.Tang J, Zeng F, Savage H, Ho PP, Alfano RR. Laser irradiative tissue probed in situ by collagen 380-nm fluorescence imaging. Lasers Surg Med. 2000;27:158–164. doi: 10.1002/1096-9101(2000)27:2<158::aid-lsm7>3.0.co;2-i. [DOI] [PubMed] [Google Scholar]
- 14.Baraga JJ, Feld MS, Rava RP. In situ optical histochemistry of human artery using near infrared Fourier transform Raman spectroscopy. Proc Natl Acad Sci U S A. 1992;89:3473–3477. doi: 10.1073/pnas.89.8.3473. [DOI] [PMC free article] [PubMed] [Google Scholar]
- 15.Buschman HP, Deinum G, Motz JT, Fitzmaurice M, Kramer JR, van der Laarse A, Bruschke AV, Feld MS. Raman microspectroscopy of human coronary atherosclerosis: biochemical assessment of cellular and extracellular morphologic structures in situ. Cardiovascular Pathology. 2001;10:69–82. doi: 10.1016/s1054-8807(01)00064-3. [DOI] [PubMed] [Google Scholar]
- 16.Greve TM, Andersen KB, Nielsen OF. ATR-FTRI, FT-NIR and near-FT-Raman spectroscopic studies of molecular composition in human skin in vivo and pig ear skin in vitro. Spectroscopy. 2008;22:437–457. [Google Scholar]
- 17.Ferry l.L., Argentieri G, Lochner DH. The comparative histology of porcine and guinea pig skin with respect to iontophoretic drug delivery. Pharmaceutica Acta Helvetiae. 1995;70:43–56. doi: 10.1016/0031-6865(94)00050-6. [DOI] [PubMed] [Google Scholar]
- 18.Uitto J. The role of elastin and collagen in cutaneous aging: intrinsic aging versus photoexposure. J. of Drugs in Dermatology. 2008;7:x12–x16. [PubMed] [Google Scholar]
- 19.Starcher B, Aycock RL, Hill CH. Multiple roles for elastic fibes in the skin. J. of Histochemistry and Cytochemistry. 2005;53:431–443. doi: 10.1369/jhc.4A6484.2005. [DOI] [PubMed] [Google Scholar]
- 20.Tarnowski CP, Stewart S, Holder K, Campbell-Clark L, Thoma RJ, Adams AK, Moore MA, Morris MD. Effects of treatment protocols and subcutaneous implantation on bovine pericardium: a Raman spectroscopy study. J. Biomed. Opt. 2003;8:179–184. doi: 10.1117/1.1559729. [DOI] [PubMed] [Google Scholar]
- 21.Tsunoda K, Sugiura M, Sonoyama M, Yajima H, Ishii T, Taniyama J, Itob H. Characterization of water contribution to excimer laser ablation of collagen. J. Photochem. Photobiol., A. 2001;145:195–200. [Google Scholar]
- 22.Chi Z, Chen XG, Holtz JS, Asher SA. UV resonance Raman-selective amide vibrational enhancement: quantitative methodology for determining protein secondary structure. Biochemistry. 1998;37:2854–2864. doi: 10.1021/bi971160z. [DOI] [PubMed] [Google Scholar]
- 23.Goheen SC, Lis LJ, Kauffman JW. Raman spectroscopy of intact feline corneal collagen. Biochem. Biophys. Acta. 1978;536:197–204. doi: 10.1016/0005-2795(78)90065-x. [DOI] [PubMed] [Google Scholar]
- 24.Lednev IK, Ermolenkov VV, Higashiya S, Popova LA, Topilina NI, Welch JT. Reversible thermal denaturation of a 60-kDa genetically engineered beta-sheet polypeptide. Biophys. J. 2006;91:3805–3818. doi: 10.1529/biophysj.106.082792. [DOI] [PMC free article] [PubMed] [Google Scholar]
- 25.Sonoyama M, Motoki A, Okamoto G, Hirano M, Ishida H, Katoh S. Secondary structure and thermostability of the photosystem II manganese-stabilizing protein of the thermophilic cyanobacterium Synechococcus elongatus. Biochem. Biophys. Acta. 1996;1297:167–170. doi: 10.1016/s0167-4838(96)00099-4. [DOI] [PubMed] [Google Scholar]
- 26.Payne KJ, Veis A. Fourier transform IR spectroscopy of collagen and gelatin solutions: deconvolution of the amide I band for conformational studies. Biopolymers. 1988;27:1749–1760. doi: 10.1002/bip.360271105. [DOI] [PubMed] [Google Scholar]
- 27.Lin SY, Hsieh TF, Wei YS, Li MJ. Mechanical compression affecting the thermal-induced conformational stability and denaturation temperature of human fibrinogen. Int. J. Biol. Macromol. 2005;37:127–133. doi: 10.1016/j.ijbiomac.2005.09.008. [DOI] [PubMed] [Google Scholar]
- 28.Gnanakaran S, Hochstrasser RM, Garcia AE. Nature of structural inhomogeneities on folding a helix and their influence on spectral measurements. Proc. Nat. Acad. Sci. U.S.A. 2004;101:9229–9234. doi: 10.1073/pnas.0402933101. [DOI] [PMC free article] [PubMed] [Google Scholar]
- 29.Uzunbajakava N, Lenferink A, Kraan Y, Volokhina E, Vrensen G, Greve J, Otto C. Nonresonant confocal Raman imaging of DNA and protein distribution in apoptotic cells. Biophys J. 2003;84:3968–3981. doi: 10.1016/S0006-3495(03)75124-8. [DOI] [PMC free article] [PubMed] [Google Scholar]
- 30.Thomas GJ, Jr., Prescott B, Day LA. Structure similarity, difference and variability in the filamentous viruses fd, If1, IKe, Pf1 and Xf. Investigation by laser Raman spectroscopy. J Mol Biol. 1983;165:321–356. doi: 10.1016/s0022-2836(83)80260-5. [DOI] [PubMed] [Google Scholar]
- 31.Camerlingo C, Zenone F, perna G, Capozzi V, Cirillo N, garcia GM, Lepore M. An investigation on Micro-Raman spectra and wavelet data analysis for pemphigus Vulgaris follow-up monitoring. Sensors. 2008;8:3656–3664. doi: 10.3390/s8063656. [DOI] [PMC free article] [PubMed] [Google Scholar]
- 32.Zhang G, Demos SG, Alfano RR. Far-red and NIR Spectral Wing Emission from Tissues under 532 and 632 nm Photo-excitation. Lasers in the Life Science. 1999;9:1–16. [Google Scholar]
- 33.Jirasek A, Schulze G, Yu MM, Blades MW, Turner RF. Accuracy and precision of manual baseline determination. Appl Spectrosc. 2004;58:1488–1499. doi: 10.1366/0003702042641236. [DOI] [PubMed] [Google Scholar]
- 34.Schulze G, Jirasek A, Yu MM, Lim A, Turner RF, Blades MW. Investigation of selected baseline removal techniques as candidates for automated implementation. Appl Spectrosc. 2005;59:545–574. doi: 10.1366/0003702053945985. [DOI] [PubMed] [Google Scholar]
- 35.Baraga JJ, Rava RP, Taroni P, Kittrell M, Fitzmaurice M, Feld MS. Laser induced fluorescence spectroscopy of normal and atherosclerotic human aorta using 306-310 nm excitation. Laser Surg. Med. 1990;10:245–261. doi: 10.1002/lsm.1900100305. [DOI] [PubMed] [Google Scholar]
- 36.de Paula JAR, Sathaiah S. Raman spectroscopy for diagnosis of atherosclerosis: a rapid analysis using neural networks. Med. Eng. Phys. 2005;27:237–244. doi: 10.1016/j.medengphy.2004.10.007. [DOI] [PubMed] [Google Scholar]
- 37.Hu Y, Jiang T, Shen A, Li W, Wang X, Hu J. A background elimination method based on wavelet transform for Raman spectra. Chemometrics and Intelligent Laboratory systems. 2007;85:94–101. [Google Scholar]
- 38.Curcio JA, Petty CC. The near infrared absorption spectrum of liquid water. Journal of the Optical ociety of America. 1951;41:302–306. [Google Scholar]
- 39.Kane SA. Introduction to physics in modern medicine. Taylor & Francis; 2003. [Google Scholar]
- 40.Tzeng S-H, Grant A, Durkin AJ. In vivo determination of skin near-infrared optical properties using diffuse optical spectroscopy. J. Biomed. Opt. 2008;13 doi: 10.1117/1.2829772. [DOI] [PMC free article] [PubMed] [Google Scholar]
- 41.Yang B, Morris MD. Rasonance Raman Spectroscopy of Bilirubin: Band assignment and application to Bilirubin/lipid complexation. Biochemistry. 1991;30:688–694. doi: 10.1021/bi00217a015. [DOI] [PubMed] [Google Scholar]


