Abstract
Dispersion is well known to be important in biological systems, but the effect of electron correlation in such systems remains unclear. In order to assess the relationship between the structure of a protein and its electron correlation energy, we employed both full system Hartree-Fock (HF) and second-order Møller-Plesset perturbation (MP2) calculations in conjunction with the Polarizable Continuum Model (PCM) on the native structures of two proteins and their corresponding computer-generated decoy sets. Due to the expense of the MP2 calculation, we have utilized the fragment molecular orbital method (FMO) in this study. We show that the sum of the Hartree-Fock (HF) energy and force field (LJ6) derived dispersion energy (HF + LJ6) is well correlated with the energies obtained using second-order Møller-Plesset perturbation (MP2) theory. In one of the two examples studied the correlation energy as well as the empirical dispersive energy term was able to discriminate between native and decoy structures. On the other hand, for the second protein we studied, neither the correlation energy nor dispersion energy showed discrimination capabilities; however, the ab initio MP2 energy and the HF+LJ6 both ranked the native structure correctly. Furthermore, when we randomly scrambled the Lennard-Jones parameters, the correlation between the MP2 energy and the sum of the HF energy and dispersive energy (HF+LJ6) significantly drops, which indicates that the choice of Lennard-Jones parameters is important.
Introduction
The search for an energy-based “scoring” function that can routinely discriminate natively folded proteins from the non-native conformations is a major challenge for computational structural biology.1 Based on the thermodynamic hypothesis, which states that the native state has the lowest free energy relative to misfolded states2, current effort focuses on looking for reliable physics-based potentials that can distinguish native states from non-native ones.3–7 Importantly, the free energy of the folded state in a protein is only 5–15Kcal/mol less than the denatured state ensemble.8,9; hence, it is clear that the final solution to this problem will require very high accuracy.
Not only are hydrogen bonding interactions important, but other non-covalent interactions, such as long range electrostatic and van der Waals interactions are important in defining protein structures. Recent theoretical and experimental studies have demonstrated the importance of non-covalent interactions.10 In the protein folding process, the hydrophobic forces associated with non-polar residues results in the formation of the so-called hydrophobic core.11,12 Indeed, a rather large attractive energy arises from the dispersion-dominated hydrophobic core collapse. By performing correlated ab initio calculations, Vondrasek et al. predicted the presence of a strong attraction inside the hydrophobic core of a small globular protein, which originates from the London dispersion energy between hydrophobic residues.8 Riley and Merz, however, demonstrated that the extent of this interaction energy is mitigated by solvation effects reinforcing the well-known importance of solvation on the modeling of intramolecular interactions in proteins.13 Moreover, studies by Fedorov et.al. showed the importance of dispersion in protein-ligand binding systems using ab initio MP2 calculation.14 They also illustrated that the gas phase binding energy gap between the strongest binder and the weakest binder is much larger than the gap in the experimental binding free energies unless solvation effects are included. Therefore, it is clear that accurate solvation energies should be included in any effective energy-based scoring function for protein structure prediction.
Individual dispersion interactions are generally quite small, but when summed over all possible non-covalent interactions present in a protein the individual energies accumulate resulting in a significant contribution to the total free energy. To achieve accurate dispersion energies, correlated ab initio methods are required. Neither Hartree-Fock (HF) nor Density Functional Thoery (DFT) are formally able to capture these dispersion interactions.8 Among all conventional ab initio electron correlation methods, second-order Møller-Plesset perturbation (MP2) theory is the least expensive non-empirical approach.
Within the framework of Møller-Plesset (MP) perturbation theory, the electron correlation energy is obtained as the sum of second, third, fourth and higher order electron correlation energies:
| (1) |
MP2 which only takes the second-order correlation contribution into account generally gives a good estimate of the correlation energy.15 In practice, MP2 is widely used as a benchmark calculation to describe van der Waals interactions in dispersion-dominated complexes.15–17 However, the second-order correlation energy obtained using MP2 (ΔE(2)) is not exactly equal to the dispersion energy. As has been shown by Cybulski et.al.18 and Chalasinski and Szczesniak19,ΔE(2) can be decomposed into the intermolecular dispersion energy , intramolecular electron correlation of the electrostatic energy , exchange correlation εex and the deformation correlation εdeform
| (2) |
Although the dispersion energy frequently dominates ΔE(2) , the intramolecular electron correlation and exchange correlation effects can have the same magnitude as the dispersion energy in some cases.20 Hence, one needs to keep in mind that employing MP2 calculations to study biological systems not only captures the dispersion energy, but also includes local electron correlation and exchange effects.
Until recently, due to the relatively large size of proteins, it was not practical to apply standard all-electron quantum chemistry methods to compute the total energy of biomacromolecules because of the poor scaling of ab initio methods.21 Much effort has been devoted to the development of linear-scaling methods over the past several decades to compute the total energy of large molecular systems at the Hartree-Fock (HF) or density functional method (DFT) level.22–29 The biggest challenge is to assemble the Fock matrix elements, which have poor scaling properties due, in large part, to long range Coulomb interactions. Fast multipole based approaches have successfully reduced the scaling in system size to linear26,27,30–32 and made HF and DFT calculations affordable for larger systems when small to moderate sized basis sets are utilized. The more recently developed Fourier Transform Coulomb method of Fusti and Pulay33,34 reduced the steep O(N4) scaling in basis set size to quadratic and makes the calculations much more affordable with larger basis sets.35 There is also a class of fragment-based methods for quantum calculation of protein systems including the divide and conquer (DAC) method of Yang23, Yang and Lee,24 Dixon and Merz,36 and Gogonea et al.,37 the adjustable density matrix assembler (ADMA) approach method of Exner and Mezey,28 the molecular fractionation with conjugate caps (MFCC) approach developed by Zhang and co-workers, 38 and the fragment molecular orbital (FMO) method of Kitaura and co-workers. 39–41 Most applications of these methods to protein systems have been mostly limited to semiempirical, HF and DFT calculations. Among these approaches, FMO has been used to carry out second-order Møller-Plesset perturbation theory (MP2)42 and coupled cluster theory (CC) calculations.43 Moreover, the Polarizable Continuum Model44 (PCM) has been combined with the FMO approach to incorporate solvation effects.45
The FMO2-MP2 method (in conjunction with PCM) is based on a two-body expansion, which makes it substantially faster than full system calculations. Furthermore, the fragment based FMO-MP2/PCM approach has reduced memory and disk requirements which makes all-electron ab initio quantum mechanical calculation on macromolecules possible.41 In order to validate the FMO scheme, a recent FMO-MP2/6-31(+)G* study based on two-body expansions showed that the error in the correlation energy relative to standard MP2/6-31(+)G* calculations was only 2.1kcal/mol error for Trp-cage.42 Therefore, we have chosen the FMO-MP2/PCM method for our present calculations. Our goal is to validate that ab initio HF and MP2 methods can discriminate between native protein structures relative to a set of decoy structures. Simultaneously, we investigated how the electron correlation energy and dispersion energy varies between the native state of a protein and its corresponding decoy set. Our study is the first large-scale application of correlated ab initio methods to the study of protein decoy detection.
Computational Approach
Ab initio calculation
Our goal is to find an energy “scoring” function for proteins that can discriminate the native protein structures from their decoys. More specifically, the total energy of a native structure should be lower than all decoys,2 and an energy gap, which separates the native state(s) from the misfolded states, should be observed. Effective free energy functions have been reported in previous decoy studies;1–6 however, the evaluation of physics-based potentials was limited to molecular mechanics (MM) and semiempirical methods. Herein, we present a correlated ab initio study of decoy detection. The energy-based scoring function we use to evaluate the relative stability of the protein structures is:
| (3) |
where ΔEint ra and ΔG solv represent the intra-molecular energy (the sum of the electronic and nuclear-nuclear repulsion energies) and the solvation energy of the protein, respectively. The fragment molecular orbital method (FMO) was used to calculate the total energy of the protein ΔEint ra at the HF and MP2 levels.
The FMO computational procedure is as follows39,40: first, the protein is divided into N fragments containing one or two amino acid residues each. The electronic structure of a single fragment (monomer) is solved in the external coulomb field contributed by the remaining(N −1) monomers repeatedly until all the density matrices of the monomers are self-consistent. Secondly, the energy of every fragment pair (dimer) is solved in an approximate electrostatic field generated by the remaining (N − 2) monomers. The energy of each trimer can be calculated in the same way. Finally, the total energy of the protein is obtained using the following expression (higher order many-body interaction energies are neglected):
| (4) |
where N represents the number of fragments. In our implementation, we take two consecutive amino acid residues as a fragment. EI, EIJ and EIJK are the monomer, dimer and trimer energies, respectively. Because of the computational cost, we truncated the energy contributions after the two-body expansion (termed as FMO2). As shown in a previous study,42 the deviation between FMO2-MP2 computed correlation energies and full MP2 calculations, on several model protein systems, is ~2.1kcal/mol. Thus, FMO2 is a practical approach that strikes a compromise between the attained accuracy and the computational expense in studies of macromolecules. Using the FMO2 expansion, the restricted Hartree-Fock (RHF) energy and the MP2 correlation energy are calculated similarly to equation 4
| (5) |
| (6) |
where are the MP2 correlation energy of the monomer and dimer, respectively. By adding the MP2 electron correlation energy to the FMO2-HF energy, one can obtain the FMO2-MP2 energy:
| (7) |
The solvation energy term, ΔGsolv , in equation 3 is calculated using CPCM46,47 combined with the FMO2 approach (i.e., FMO2/CPCM[1(2)]).45 Following the same spirit of the fragmentation algorithm, the induced apparent surface charges (ASC) are predetermined self-consistently based on the one-body expansion of the electrostatic potential, followed by a single ASC calculation using the two-body expansion of the electrostatic potential to further refine the ASCs. Then the HF-FMO2 energy (equation 5) and MP2-FMO2 correlation energy (equation 6) are calculated in the electrostatic field of the fixed ASCs. All the HF/PCM and MP2/PCM calculations were carried out using the FMO2/CPCM[1(2)] approach implemented in GAMESS-US.48 The C-PCM calculations used 240 tesserae per sphere and the following atomic radii:49 RH = 0.01 Å, RC = 1.77 Å, RN = 1.68 Å, RO = 1.59 Å, RS = 2.10 Å. All of the solvation energies included the cavitation energy contributions and van der Waals interactions between the solvent and solute.
The 6-31G* basis set was chosen for our calculations. Geometry optimization based on MP2/6-31G* gives reasonable molecular structures as shown in previous studies.17 It is known that MP2 is able to describe the dispersion energy, but the quality of the results depends on the basis set used as well. MP2 with large basis sets overestimates the correlation interaction energy for some clusters.50 Nevertheless, for other clusters the MP2 correlation interaction energy is close to the best estimate obtained via CCSD(T) calculations.15 MP2/6-31G* usually underestimates the correlation interaction energy20 and suffers from basis set superposition error (BSSE) due to basis set incompleteness. When we use a relatively small basis set, such as 6–31G*, to study macromolecules, there is no affordable way to eliminate or estimate the BSSE. MP2/6-31G* without BSSE correction always lowers the interaction energy compared to the “real” physical interaction values given by MP2/6-31G*. To illustrate these features, we have investigated two small molecule complexes: the methane dimer and the methane-benzene complex. Ab initio calculations using various basis sets were carried out to compute the interaction energies for these two complexes using Qchem.35
Decoy selection
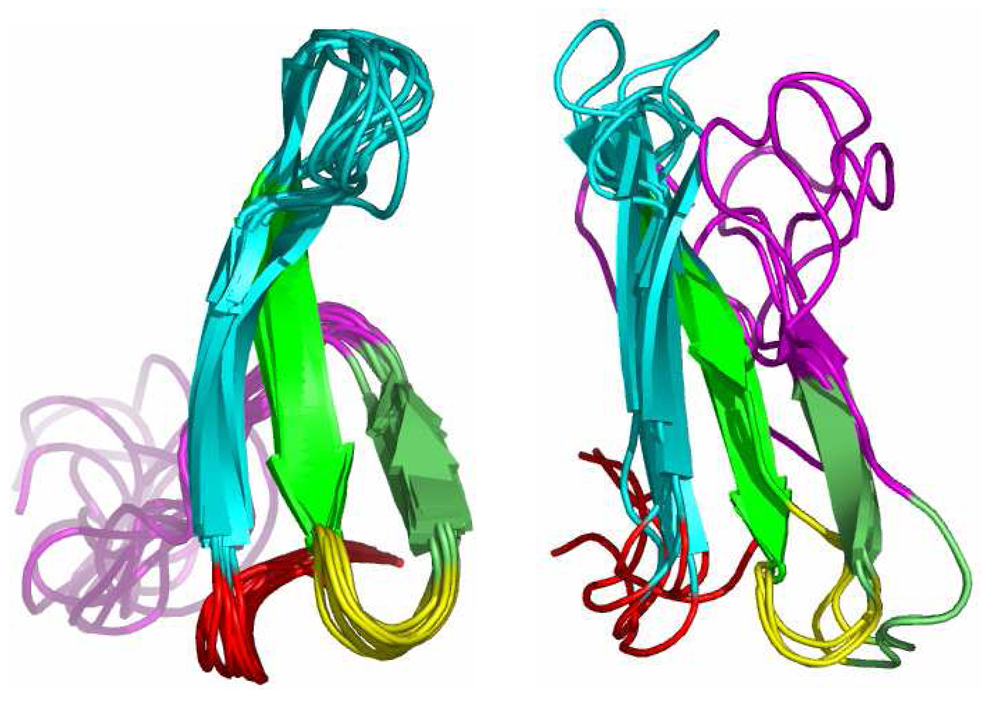
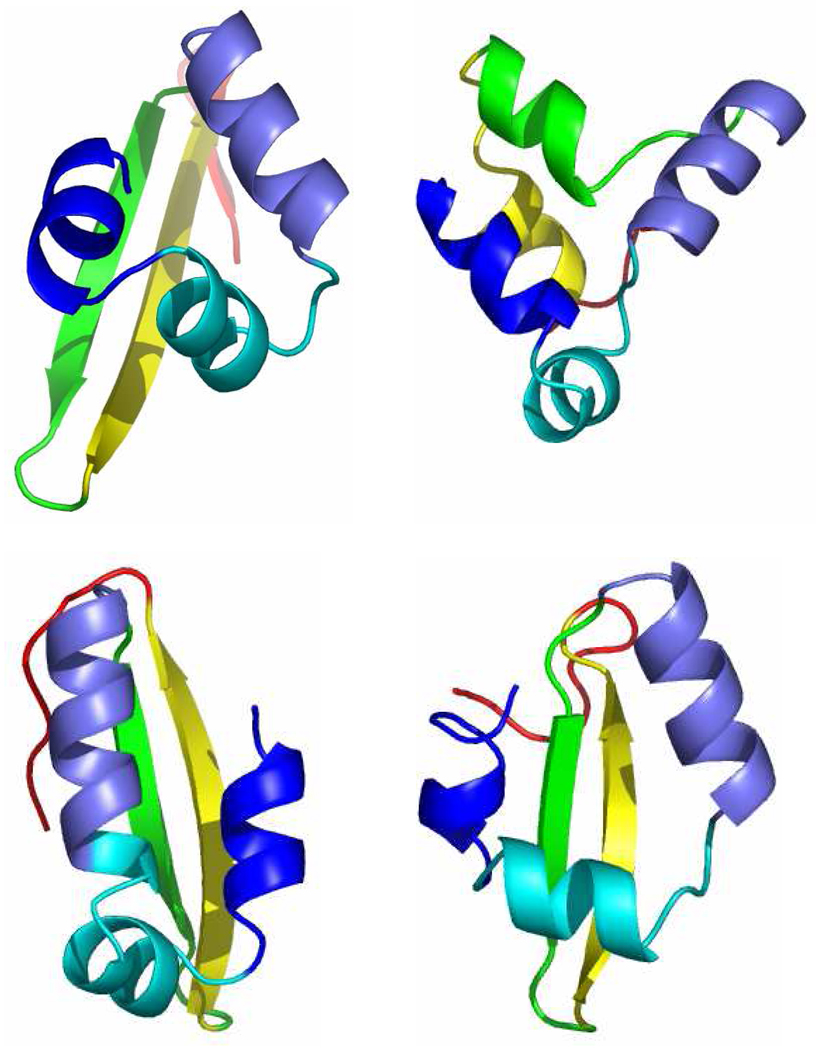
Nine (9) NMR structures (pdb id:1i6c) of the Pin1 WW domain were taken as our native conformations. Pin1 has 39 amino acids and contains 612 atoms in total (including hydrogen). A set of 1,000 decoy structures was generated using Rosetta.51 Due to the relatively high expense of FMO-MP2/PCM calculations, we perform fixed radius clustering of the entire decoy set based on the mutual RMSD of Cα and Cβ atoms for residues 6 through 29 using MMTSB.52 We focused on residues 6 through 29 because this region forms an antiparallel β–sheet in native structures while the remaining residues are in flexible loop regions (see Figure 1a). Note that the energies we report are still for residues 1 through 39. The structures are overlaid using a least square fit before calculating RMSD values for every protein structure pair. By setting the clustering radius to 3Å, 27 subclusters were obtained. 110 structures were chosen at random from these 27 subclusters. The second protein we examined was the Cro repressor protein. The X-ray structure (pdb id: 1orc, residues 7 through 57) was taken as the native conformation and after protonation, it contained 877 atoms in total (including hydrogen atoms). Out of its Rosetta decoy set produced earlier by Baker and co-workers53, we chose 50 decoys for this study (see below for details). Figure 1b shows the X-ray structure of the Cro repressor along with three representative decoy conformations. Since it is computationally expensive to minimize all the structures at a quantum mechanical level, we performed optimizations on all of the native and decoy structures using the Generalized-Born solvation model with the AMBER FFPM3 force field 54 in order to remove bad contacts prior to the ab initio calculations.
Figure 1.
The NMR structures of the Pin1 WW domain are shown on the left, while five representative decoy structures generated by Rosetta are given on the right side of the figure. Each color denotes the same fragment for different conformations (red: residues 1–5; cyan: residues 6–16; green: residues 17–21, yellow: residues 22–24; lime: residues 25–28; magenta: residues 29–39).
The X-ray structure of the Cro repressor (1orc, residues 7 through 57) is shown in the top left corner, while the rest three are representative decoy structures. Each color represents the same fragment for different protein conformers.
Results and Discussion
Small molecule complexes
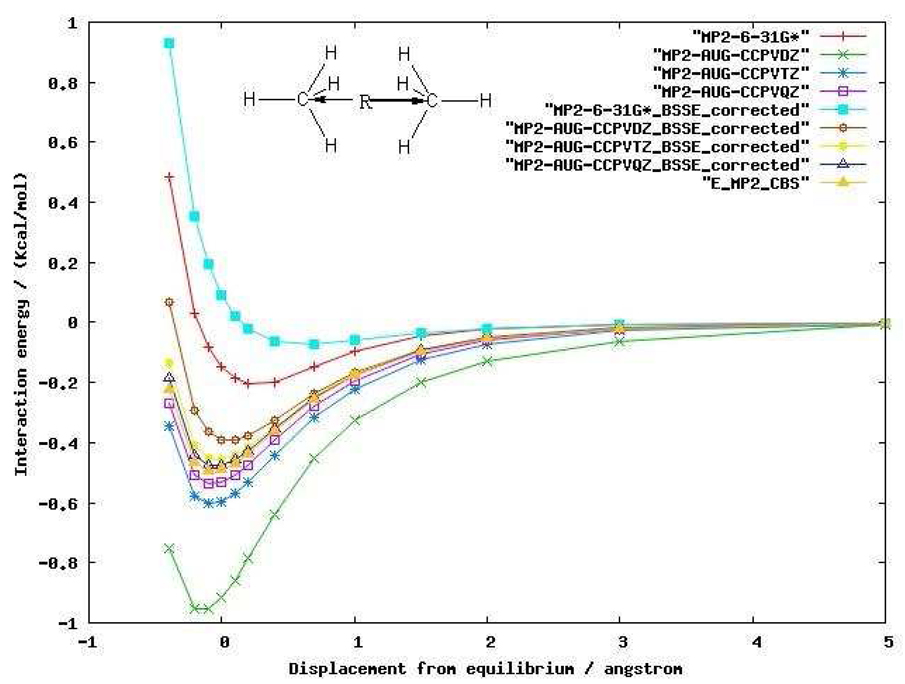
Before carrying out MP2 calculations on larger protein systems, we first investigated two small complexes in order to better understand the impact of that basis set and correlation method choices have on our computed results. The first system studied was the methane dimer. MP2 calculations were performed to derive the potential energy curves for the methane dimer using both 6–31G* and Dunning’s augmented correlation consistent basis sets.55 We also used the counterpoise correction (CP) method56 to account for the basis set superposition error (BSSE). The energy curves with counterpoise and without counterpoise correction are shown in Figure 2. For a small basis set such as 6–31G*, even MP2 is unable to capture the dispersion interaction between the methane dimer after counterpoise correction. The attractive energy predicted by MP2/6-31G* without the counterpoise correction actually does not represent the physical interaction. Ironically, most of the attractive interaction energy is from BSSE emphasizing the difficulty of computing these quantities. When the basis set size is increased to Dunning’s augmented correlation consistent basis sets, the dispersion energy begins to be captured at the MP2 level. In comparison to the MP2 CBS (Complete basis set method) energy at the equilibrium geometry, MP2/aug-cc-pVDZ without the counterpoise correction overestimates the dispersion energy by 0.43 Kcal/mol (88% of the MP2 CBS energy) and has a large BSSE of 0.53 Kcal/mol (108%). As the basis set increases to aug-cc-pVTZ and aug-cc-pVQZ, the potential energy curve with the CP correction converges to the MP2 CBS energy, and, not unexpectedly, BSSE decreases as the basis set increases.
Figure 2.
MP2 interaction energy curves for the methane dimer as a function of the center of masses (COM) distance between each methane molecule using various basis sets.
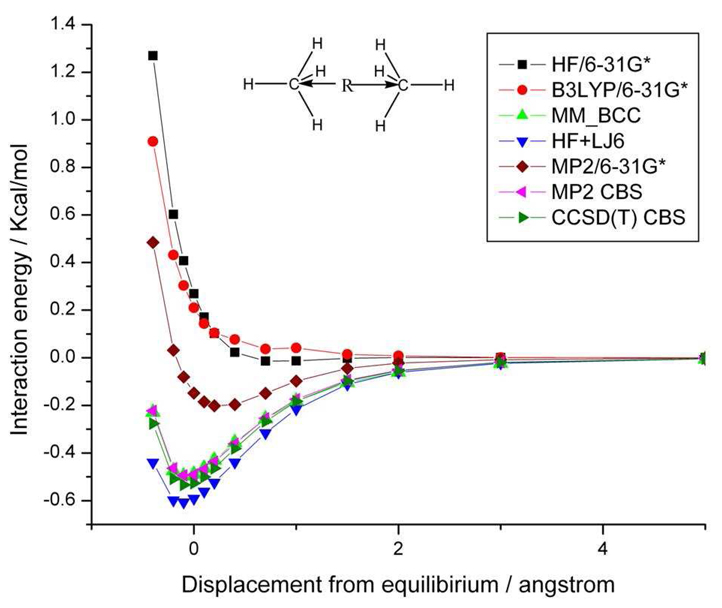
We further compare the potential energy curves by using different ab initio methods and the generalized AMBER force field (GAFF) 57 in Figure 3. Because the counterpoise correction method cannot be applied to our protein calculations, we compare the energy curves without BSSE correction using HF/6-31G*, B3LYP/6-31G* and MP2/6-31G*. The HF and DFT/B3LYP calculations, as expected, fail to capture the dispersive interaction between the methane dimer. At the equilibrium configuration, the interaction energy given by MP2/6-31G* without BSSE correction is −0.15 Kcal/mol, which underestimates the dispersion energy by 0.38 Kcal/mol (72%), when compared to the −0.53 kcal/mol value obtained by CCSD(T) CBS at the equilibrium geometry. The energy curves obtained by MP2 CBS and CCSD(T) CBS are very similar to each other. The AMBER force field potential energy curve is in good agreement with the CCSD(T) CBS results, indicating that the van der Waals parameters of this complex are finely tuned.58,59 Moreover, by adding the attractive term of the Lennard-Jones energy to the HF energy curve labeled as HF+LJ6 in equation 8, the energy curve reproduces the CCSD(T) CBS energy curve, which demonstrates that the attractive term of AMBER force field compensates for the dispersion energy that is missing in the Hartree-Fock energy.
| (8) |
Figure 3.
Comparison of interaction energy curves for the methane dimer as a function of the COM distance between each methane molecule at different levels of theory. See text for further details.
Dispersion is a pure electron correlation effect originating from the weak attractive interaction between an instantaneous dipole moment on one site and induced dipole moment on another site of the system.60 The dipole-induced-dipole interaction is proportional to for large intermolecular separations.61 Recent studies have developed dispersion corrected semiempirical62, HF60,63,64 and DFT65–67 methods to remedy this problem in a pragmatic way. The dispersion corrected total energy is
| (9) |
where ESCF is the semiempirical, HF or DFT total energy using traditional self-consistent-filed(SCF) procedure. Edisp is an empirical dispersion potential given by:
| (10) |
Here, N is the number of atoms in the system, Rij and Cij denote the distance and dispersion coefficient between atom pair ij , respectively. fdamp (Rij) is a damping function used to avoid singularities when the distance Rij → 0. S6 is a global scaling factor. Thus, the dispersion energy can be evaluated in negligible computational time, which is an advantage over, more computationally expensive, non-empirical electron correlation methods. Nevertheless, same as for all other empirical methods, in order to obtain universal dispersion coefficients for different atom pairs, a thorough validation on numerous systems needs to be carried out.20 In this study, we use the Lennard-Jones parameters from the AMBER force field.
| (11) |
Note that a damping function is not used here and, in addition, we did not scale the dispersive energy by any global scaling factor. In the AMBER LJ parameterization procedure, both the charge model RESP68 (restrained electrostatic potential) at HF/6-31G* and AM1-BCC69 (bond charge correction) are designed to match the electrostatic potential obtained at the HF/6-31G* level.59 As a result, the Lennard-Jones parameters are suitable to be used with HF/6-31G* calculations.
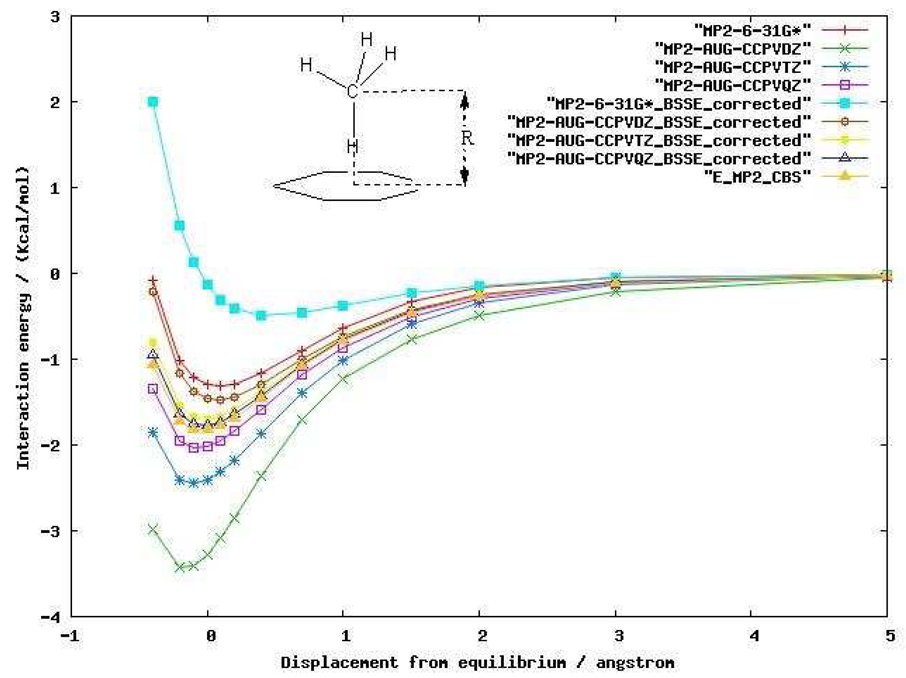
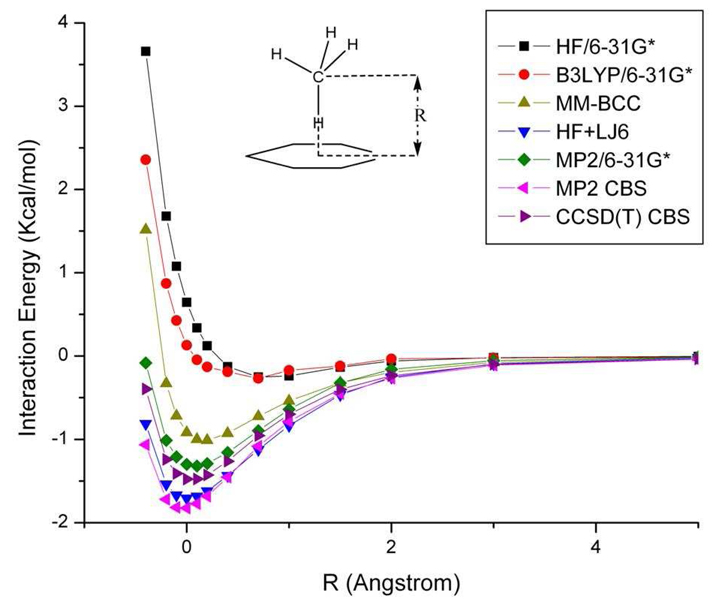
Shibasaki et al. have experimentally and theoretically determined the interaction energy between methane and benzene.70 In their calculations, the BSSE was corrected in all calculations using the CP method. We compare our computed interaction energies via MP2 calculation with CP and without CP correction in Figure 4. It shows features similar to those observed for the methane dimer. MP2/6-31G* with counterpoise correction has an attractive energy of −0.13 Kcal/mol, which is only 7.1% of the total dispersion energy of −1.82 Kcal/mol calculated using MP2 CBS. MP2/aug-cc-pVDZ and MP2/aug-ccpVTZ without CP correction overestimate the dispersion energy by 80% and 32%, respectively. MP2/aug-cc-pVDZ with CP correction underestimates the dispersion energy by 0.35 Kcal/mol (19%) for the geometry at equilibrium. Until the basis set increases to aug-cc-pVTZ and aug-cc-pVQZ, the energy curves with CP correction are almost identical to the MP2 CBS results. Here the curve generated by MP2/6-31G* calculations without CP correction is very close to MP2/aug-cc-pVDZ with CP correction. We further compare the results with HF, DFT, MP2, GAFF (AMBER force field), MP2 CBS and CCSD(T) CBS in Figure 5. Again, HF and DFT/B3LYP fail to capture the dispersion energy for this complex. For the equilibrium geometry, the interaction energies are −0.92 kcal/mol, −1.30kcal/mol, −1.82kcal/mol, −1.48kcal/mol given by GAFF, MP2/6-31G* without CP correction, MP2 CBS and CCSD(T) CBS, respectively. MP2/6-31G* without CP correction fortuitously gives 88% of the total dispersion energy evaluated using CCSD(T) CBS. Most of the attractive energy originates from BSSE, rather than from dispersion. GAFF gives a qualitatively correct potential energy curve for this complex, but it underestimates the dispersive energy by 0.56 kcal/mol. In this case, MP2/6-31G* without CP correction gives a deeper energy minimum than GAFF. We also tested the performance of different levels of theory for hydrogen bonding interactions and these results will be reported elsewhere.71
Figure 4.
MP2 interaction energy curves for the benzene-methane dimer as a function of the COM distance between benzene and methane using various basis sets.
Figure 5.
Comparison of interaction energy curves for the benzene-methane dimer as a function of the COM distance between each molecule at different levels of theory. See text for further details.
As will be shown below dispersion-dominated interactions summed over an entire protein are significant. This attractive energy has a large contribution to the total free energy of the system. Minor errors in the computed dispersion energies from large number of non-covalent interactions present in a protein will result in a deviation from the “exact” energy. The challenges faced for small molecule clusters, as summarized above, helps to set the stage for our studies using similar methods on larger macromolecules.
Protein decoy detection
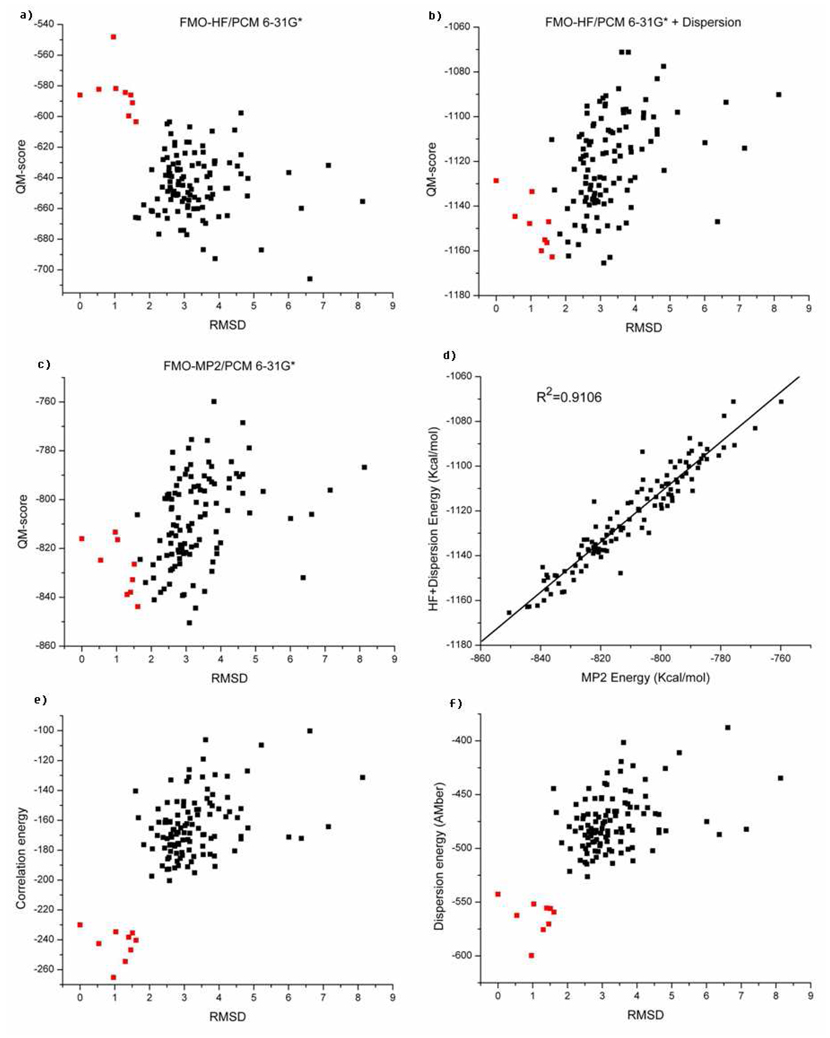
Based on equation 3, the HF scores of the native NMR structures (pdb id:1i6c) are higher than for most of the decoy conformations in the decoy set as shown in Figure 6a. The average HF energy is −584.7 kcal/mol among the native structures, while the average energy of the decoy set is −644.6 kcal/mol. Perhaps this was not too surprising because HF theory doesn’t capture the dispersion energy in protein systems as illustrated in the previous HF calculations on the methane-methane and methane-benzene complexes. To compensate for this deficiency in the HF “scoring function”, we added the atom-typed attractive term from the AMBER Lennard-Jones potential to the HF potential energy. We label this scoring function as HF+LJ6.
| (12) |
Figure 6b shows the results using the HF+LJ6 scoring function. We find that the original trend is now reversed; all the scores of the native structures are shifted to scores lower than the average score −1120.5 Kcal/mol of the decoy set.
Figure 6.
Six different energy scores for the native and decoy states of the Pin1 WW domain (1i6c). Solvation energies are included in (a),(b),(c),(d). (a) HF/6-31G*. (b) HF/6-31G*+LJ6. (c) MP2/6-31G*. (d) The correlation between MP2/6-31G* energies and (HF/6-31G*+LJ6) energies. (e) Electron correlation energies given by MP2/6-31G*. (f) The attractive term of the Lennard-Jones energies (LJ6). The X-axis (excluding d) denotes the root mean square deviation of backbone atoms between residue 6 and 29 with reference to one of the nine NMR structures. The red squares represent the native NMR structures, and the black squares represent the decoys.
FMO-MP2/6-31G* calculations, in conjunction with the PCM model, were also carried out on all the structures. The energy function is then evaluated by summing the MP2 energy and the solvation energy using the PCM model.
| (13) |
Figure 6c shows the outcome of these calculations, which turn out to be very similar to the (HF+LJ6) energies. Indeed, the two scores are well correlated as shown in Figure 6d (R2 is 0.91). After overlaying the two sets of scores with a linear square fit, the average unsigned error and root mean square deviation of the (HF+LJ6) energy from the MP2 energy are 5.09 kcal/mol and 6.79 kcal/mol, respectively. One of the “native” NMR structures was ranked third lowest in the MP2 scoring function. The decoy set created by Rosetta as shown in Figure 1a, mostly preserved the antiparallel β-sheet-like structure of the native protein for residues 6 through 29, which likely makes this a demanding test case. Compared to X-ray structures, the NMR structures are usually more difficult to discriminate from the decoy sets.6,7 Moreover, recent efforts to fold the WW domain have proven challenging indicating the difficulty of this example even for force field based methods with extensive sampling.72
None of the “native” NMR structures have the lowest energy based on the MP2 calculations. From a computational perspective, some deficiencies in our current MP2 scoring function may be the source of this observation. Firstly, the FMO method based on a two-body expansion may cause a few kcal/mol error in the total energy calculation. We did not take 3-body interactions into account in this study due to the excessive computational cost. Secondly, MP2 calculations using the 6–31G* basis set may not be sufficient to capture all of the dispersive effect. For example, we showed for the methane dimer and the methane-benzene complex that MP2/6-31G* without CP correction, underestimates the correlation energy by 0.38 kcal/mol and 0.18 kcal/mol, respectively. Note that for those intramolecular dispersion-rich interactions, the attractive energy given by MP2/6-31G* is mainly attributed to BSSE, other than the real dispersion energy.71 Thirdly, to accurately evaluate the solvation energy of a protein is still a significant challenge for theoretical chemists and the PCM model, while effective may not ultimately be the best choice. Even for small ionic species the mean unsigned errors of various theoretical models can be more than 4.0 kcal/mol compared to experimental results.73,74 Hence, the PCM solvation model likely contributes to the observed errors in our scoring function. A final source of concern is the quality of NMR structures in general. The variability in the stability of the 9 NMR structures examined here is on the order of 30 kcal/mol at the MP2/6-31G* level. We have noted issues with NMR structures in the past when using semiempirical QM scoring functions.6
We also extracted the electron correlation energy in the solvent by subtracting the HF energy from the MP2 energy as given in equation 14 to determine the role of electron correlation energy plays in decoy detection.
| (14) |
where ψsolvdenotes the ground-state wavefunction of the protein in the solvent.
We find that the electron correlation energy has significant discrimination ability between decoy and native structures (see Figure 6e). Likely this reflects a tighter packing of amino acids in this dispersion dominated case. This is further reinforced if we only use the dispersive term of the Lennard-Jones energy (LJ6) as a scoring function.
| (15) |
Figure 6f illustrates the LJ6 scores for all the structures. The scoring function in terms of dispersion energy works as well as the electron correlation energy in this system. The energy gap between the average score of the native states and the decoys using the electron correlation scoring function is 79.3Kcal/mol, while the energy gap given by LJ6 score is 87.7Kcal/mol.
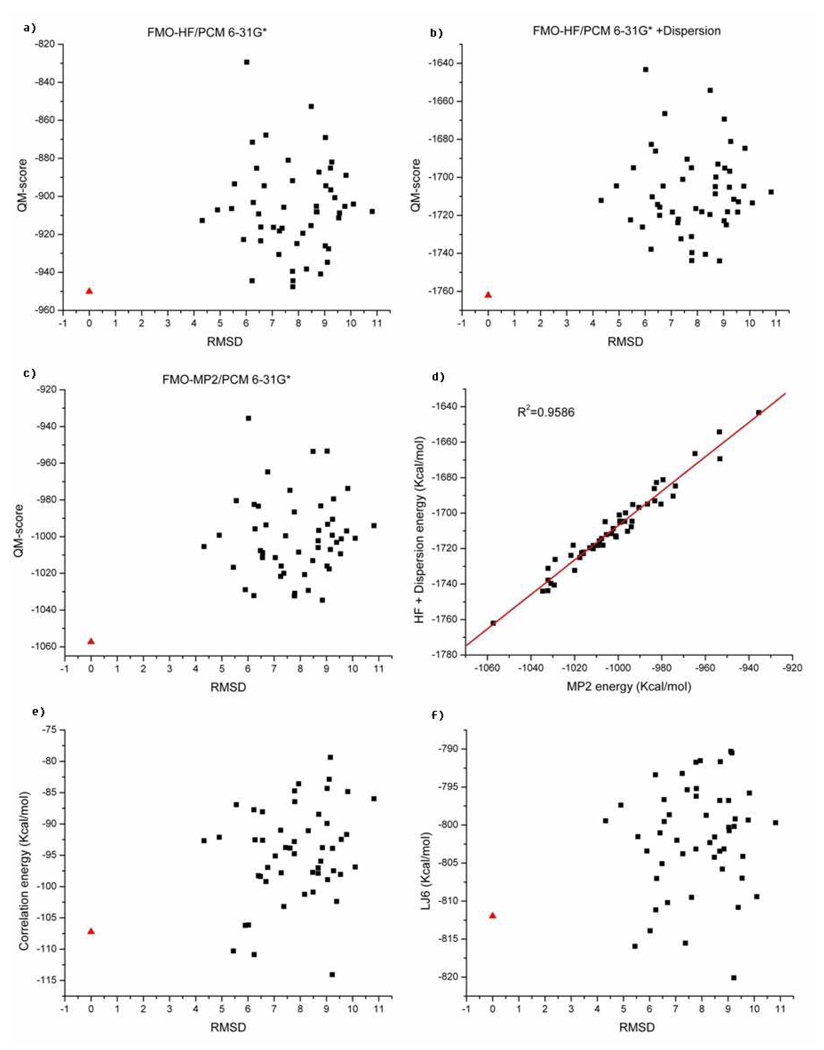
To push our analysis further we analyzed several systems in search for a case where dispersion is not the dominant driving force (as evaluated using the AMBER dispersion term). The Cro repressor (pdb id:1orc) was identified as a suitable test case for our purposes. The Rosetta decoys for this protein have already been published by Baker and co-workers53. In order to streamline our calculations, we first evaluated the AMBER dispersive energies of all of the 1,000 decoys and then took the 50 decoy structures which had the lowest dispersive energies when compared to the rest of the decoys. As shown in Figure 7f, the empirical dispersive energy ΣLJ 6 of the native structure is ranked 5th in comparison to the decoys. The HF energy of the native structure is only 2.54kcal/mol less than the lowest HF energy of the decoy set (see Figure 7a). By adding the empirical dispersive term to the HF energy, the native structure becomes well separated from the decoy set by 18.1 kcal/mol compared to the lowest score of the decoys (see Figure 7b). The MP2 based scoring works as well as HF+LJ6 score with a difference of 22.7 kcal/mol between the native conformation and the lowest energy decoy (see Figure 7c). The correlation between the computed MP2 energy and HF+LJ6 energy is 0.96 (see Figure 7d). They are highly correlated as was observed for the Pin1 WW domain (1i6c) (see Figure 6d). We also extracted the ab initio electron correlation energy (eq. 14) as shown in Figure 7e. In this case neither the empirical dispersive energy nor the electron correlation energy was a suitable descriptor to rank this non-dispersion dominated protein folding example correctly.
Figure 7.
Similar to Figure 6, but for the Cro repressor (1orc). The red triangle represents the native X-ray structure while the black squares represent the decoys.
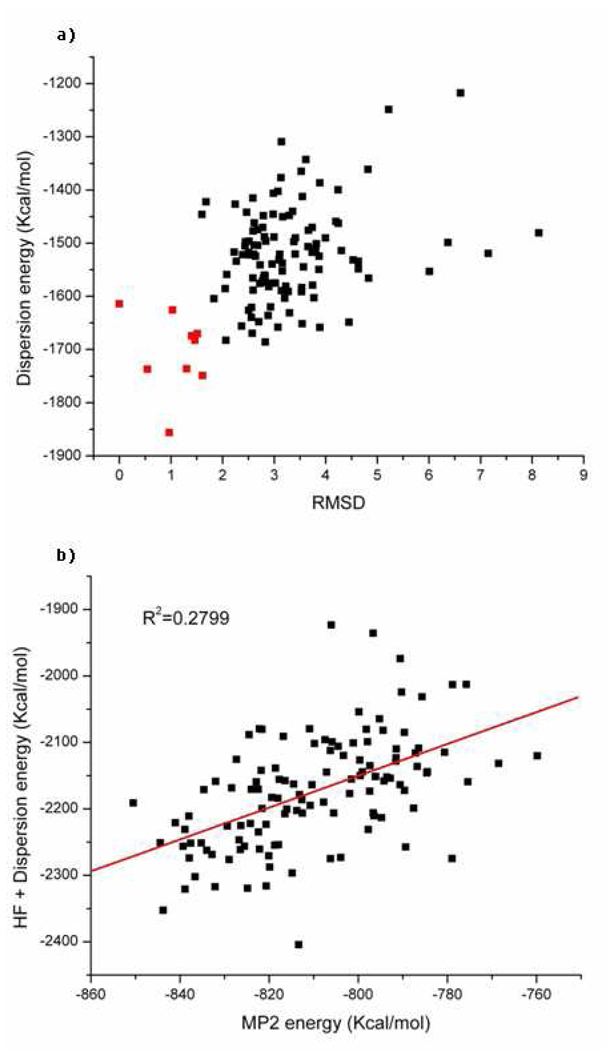
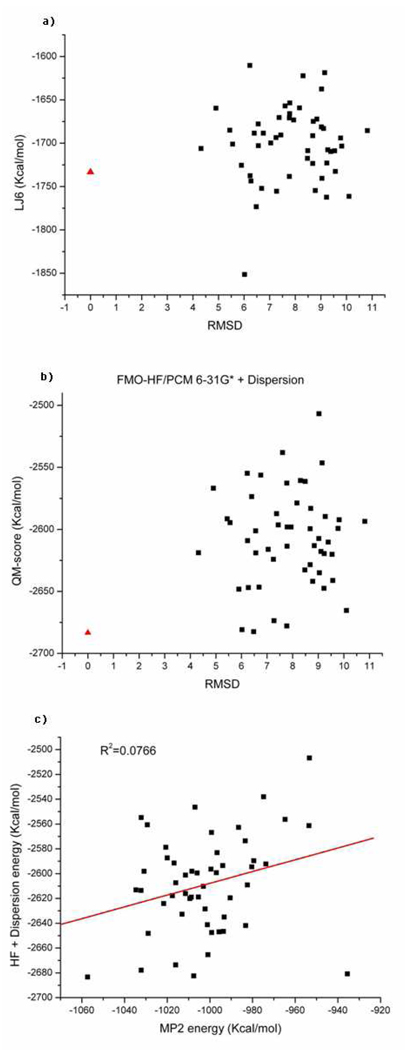
It is interesting to consider how important the choice of Lennard-Jones dispersion parameters is on ranking protein decoys. In general, these terms are finely tuned for their specific interaction types, but is this “tuning” absolutely necessary? Since these individual terms are relatively small in magnitude and do not have a radial dependence one could speculate that the choice of parameter is less important than simply providing some measure of dispersive type interactions. To further investigate this we randomly scrambled the “standard” Lennard-Jones parameters and then rescored accordingly. As shown in Figure 8a, after the Lennard-Jones parameters for the LJ6 term were randomly scrambled for the Pin1 WW domain, the dispersive energy does not separate the 9 NMR structures from the decoy set. The energies of a few native structures are higher than some of the decoys. The correlation between the MP2 energy and the HF+LJ6 energy drops from 0.91 to 0.28 clearly indicating a degradation in the correlation (see Figure 8b). For the Cro repressor (1orc), the rank of the native structure drops from fifth to twelfth after the Lennard-Jones parameters were randomly scrambled (compare Figure 9a with Figure 7f). The sum of HF energy and the dispersion energy (HF+LJ6) of the native structure is only 0.88 kcal/mol less than the lowest HF+LJ6 energy decoy (see Figure 9b). The gap was 18.1 kcal/mol as shown in Figure 7b when the “correct” Lennard-Jones parameters were employed. Similar to the Pin1 WW domain (1i6c), the correlation between the MP2 energy and HF+LJ6 energy dramatically drops from 0.96 to 0.08 for the Cro repressor again indicating that the MP2 energy and HF+LJ6 energy are uncorrelated when “incorrect” Lennard-Jones parameters are employed. Regardless of how the LJ6 parameters were scrambled we obtained similar results as those described here. Hence, we conclude that the nature of the LJ6 parameter set is critical to correctly detect decoys over native structures. Moreover, the correlation energy we obtain using our MP2 calculations (in so far as these terms represent effective dispersion) could be used to improve LJ6 terms employed in standard force fields through the optimization of the correlation coefficient between the MP2 and HF+LJ6 results. Overall, our study suggests that van der Waals parameters need to be carefully parameterized to experimental interaction energies or accurate ab initio calculations and in the case of the AMBER LJ6 set this seems to of been achieved.
Figure 8.
Randomly scrambled Lennard-Jones LJ6 parameters. (a) Labels are similar to Figure 6f for the Pin1 WW domain (1i6c). (b) The correlation between the MP2 and (HF+LJ6) energies for the Pin1 WW domain (1i6c) after the Lennard-Jones LJ6 parameters are randomly scrambled.
Figure 9.
Randomly scrambled Lennard-Jones LJ6 parameters for the Cro repressor (1orc). (a) Labels are similar to Figure 7f. (b) Labels are similar to Figure 7b. (c) The correlation between the MP2 and (HF+LJ6) energies for the Cro repressor (1orc) after the Lennard-Jones LJ6 parameters are randomly scrambled.
Conclusions
In this work, we carried out large scale MP2 calculations on native and computer-generated decoy sets of two protein systems. The two proteins employed represent a case where dispersion appears to dominate the folding (WW domain) and one where this is less so (Cro repressor). In general, HF calculations fail to rank the native protein structures in the dispersion dominated Pin1 WW domain, because HF formally cannot capture dispersion interactions. When the MP2 correlation energy is added to the HF energy, the energies of native structures improve relative to the decoy structures. In the dispersion dominated case we studied here, the correlation energy turns out to be very good at discriminating the native NMR structures from the non-native conformations, which suggests a more favorable packing of non-polar residues in native states relative to the decoy sets. In the non-dispersion dominated Cro repressor protein, both the MP2 calculations (including solvation) as well as the HF+LJ6 calculations performed well in ranking native versus decoy structures.
Furthermore, we found that the sum of the Hartree-Fock energy and the dispersion energy given by the AMBER LJ6 term correlates extremely well with our computed MP2 energies for both proteins studied. Since MP2 calculations are much more computationally intensive than HF; the HF+LJ6 energies provide a route to rapidly obtain near MP2 quality results. We also find that the nature of the Lennard-Jones parameters is critical to make this approach work. In this regard the current AMBER LJ6 parameters associated with the HF energy computed using 6–31G* basis set reproduce MP2/6-31G* trends.
The application of efficient and accurate linear-scaling ab initio calculations to biological systems is coming of age.27,36–38,41 In the current study, single point FMO2-HF/6-31G* PCM and FMO2-MP2/6-31G* PCM calculations on the Pin1 WW domain (1i6c) cost 12 days and 23 days on average on a single 2.4GHz AMD Opteron(tm) 250 Processor, respectively. Clearly these are still quite expensive calculations using a single processor. The FMO implementation in GAMESS is not particularly efficient and other codes (for example, QChem35, CP2K75, etc.) have more efficient direct SCF calculations when using a single processor. FMO is more efficient when run in parallel, but given the large number of decoys we studied we opted for the trivially parallel approach where we ran hundreds of calculations on single processors at more-or-less the same time (given the vagaries of machine crashes, power outages, etc.). Looking for more robust algorithms using linear-scaling methods clearly continues to be a very significant challenge for theoretical chemists. Furthermore, accurate solvation models are indispensable for high quality scoring functions. PCM, while quite stable and robust, underperforms other approaches available in the literature.73,74 We also note that recently described density functionals such as PWB6K and the M06-class provides good performance for interaction energies both in hydrogen-bonding and dispersion-dominated complexes.76,77 Dispersion corrected DFT65–67 is another alternative approach since the dispersion energy can be calculated rapidly, but the universal parameters need to be well fit using large data sets. For large calculations using the MP2 method, high quality basis sets are usually required to achieve accurate potential energies. Most of the intramolecular dispersion interaction calculated by MP2/6-31G* is attributed to BSSE.71 For full MP2 calculations on protein systems it is not feasible either to correct the basis set superposition error associated with 6–31G* or to use large basis sets such as Dunning’s augmented correlation consistent basis sets. Alternatively, the (LJ6) term in the dispersion corrected HF scoring function adds in the dispersion energy empirically, hence, (HF+LJ6) offers a more physical and affordable model to describe the potential energy for proteins.
Acknowledgment
We would like to thank Dmitri Fedorov for helping us using FMO/PCM program in GAMESS-US. Acknowledgements are extended to Benoit Roux, Alessandro Genoni, Bing Wang and Andrew Wollacott for many useful discussions. We thank the NSF (MCB-0211639) and NIH (GM044974) for financial support of this research.
References
- 1.Park B, Levitt M. Journal of Molecular Biology. 1996;258:367. doi: 10.1006/jmbi.1996.0256. [DOI] [PubMed] [Google Scholar]
- 2.Lazaridis T, Karplus M. Current Opinion in Structural Biology. 2000;10:139. doi: 10.1016/s0959-440x(00)00063-4. [DOI] [PubMed] [Google Scholar]
- 3.Lazaridis T, Karplus M. Journal of Molecular Biology. 1999;288:477. doi: 10.1006/jmbi.1999.2685. [DOI] [PubMed] [Google Scholar]
- 4.Dominy BN, Brooks CL. Journal of Computational Chemistry. 2002;23:147. doi: 10.1002/jcc.10018. [DOI] [PubMed] [Google Scholar]
- 5.Felts AK, Gallicchio E, Wallqvist A, Levy RM. Proteins-Structure Function and Genetics. 2002;48:404. doi: 10.1002/prot.10171. [DOI] [PubMed] [Google Scholar]
- 6.Wollacott AM, Merz KM. Journal of Chemical Theory and Computation. 2007;3:1609. doi: 10.1021/ct600325q. [DOI] [PMC free article] [PubMed] [Google Scholar]
- 7.Lee MR, Kollman PA. Structure. 2001;9:905. doi: 10.1016/s0969-2126(01)00660-8. [DOI] [PubMed] [Google Scholar]
- 8.Vondrasek J, Bendova L, Klusak V, Hobza P. Journal of the American Chemical Society. 2005;127:2615. doi: 10.1021/ja044607h. [DOI] [PubMed] [Google Scholar]
- 9.Brändén C-I, Tooze J. Introduction to protein structure. 2nd ed. New York: Garland Pub; 1999. [Google Scholar]
- 10.Muller-Dethlefs K, Hobza P. Chemical Reviews. 2000;100:143. doi: 10.1021/cr9900331. [DOI] [PubMed] [Google Scholar]
- 11.Abkevich VI, Gutin AM, Shakhnovich EI. Biochemistry. 1994;33:10026. doi: 10.1021/bi00199a029. [DOI] [PubMed] [Google Scholar]
- 12.Fersht AR. Proceedings of the National Academy of Sciences of the United States of America. 2000;97:1525. doi: 10.1073/pnas.97.4.1525. [DOI] [PMC free article] [PubMed] [Google Scholar]
- 13.Riley KE, Merz KM. Journal of Physical Chemistry B. 2006;110:15650. doi: 10.1021/jp062594j. [DOI] [PubMed] [Google Scholar]
- 14.Nakanishi I, Fedorov DG, Kitaura K. Proteins-Structure Function and Bioinformatics. 2007;68:145. doi: 10.1002/prot.21389. [DOI] [PubMed] [Google Scholar]
- 15.Hobza P, Sponer J. Chemical Reviews. 1999;99:3247. doi: 10.1021/cr9800255. [DOI] [PubMed] [Google Scholar]
- 16.Hobza P, Sponer J, Polasek M. Journal of the American Chemical Society. 1995;117:792. [Google Scholar]
- 17.Hobza P, Sponer J. Chemical Physics Letters. 1998;288:7. [Google Scholar]
- 18.Cybulski SM, Chalasinski G, Moszynski R. Journal of Chemical Physics. 1990;92:4357. [Google Scholar]
- 19.Chalasinski G, Szczesniak MM. Molecular Physics. 1988;63:205. [Google Scholar]
- 20.Cybulski SM, Bledson TM, Toczylowski RR. Journal of Chemical Physics. 2002;116:11039. [Google Scholar]
- 21.Strout DL, Scuseria GE. Journal of Chemical Physics. 1995;102:8448. [Google Scholar]
- 22.Goedecker S. Reviews of Modern Physics. 1999;71:1085. [Google Scholar]
- 23.Yang WT. Physical Review Letters. 1991;66:1438. doi: 10.1103/PhysRevLett.66.1438. [DOI] [PubMed] [Google Scholar]
- 24.Yang WT, Lee TS. Journal of Chemical Physics. 1995;103:5674. [Google Scholar]
- 25.Kohn W. Physical Review Letters. 1996;76:3168. doi: 10.1103/PhysRevLett.76.3168. [DOI] [PubMed] [Google Scholar]
- 26.Strain MC, Scuseria GE, Frisch MJ. Science. 1996;271:51. [Google Scholar]
- 27.Scuseria GE. Journal of Physical Chemistry A. 1999;103:4782. [Google Scholar]
- 28.Exner TE, Mezey PG. Journal of Physical Chemistry A. 2002;106:11791. [Google Scholar]
- 29.Friesner RA, Murphy RB, Beachy MD, Ringnalda MN, Pollard WT, Dunietz BD, Cao YX. Journal of Physical Chemistry A. 1999;103:1913. [Google Scholar]
- 30.Challacombe M, Schwegler E. Journal of Chemical Physics. 1997;106:5526. [Google Scholar]
- 31.White CA, Johnson BG, Gill PMW, Headgordon M. Chemical Physics Letters. 1994;230:8. [Google Scholar]
- 32.White CA, Johnson BG, Gill PMW, HeadGordon M. Chemical Physics Letters. 1996;253:268. [Google Scholar]
- 33.Fusti-Molnar L. Journal of Chemical Physics. 2003;119:11080. [Google Scholar]
- 34.Fusti-Molnar L, Pulay P. Journal of Chemical Physics. 2002;117:7827. [Google Scholar]
- 35.Shao Y, Molnar LF, Jung Y, Kussmann J, Ochsenfeld C, Brown ST, Gilbert ATB, Slipchenko LV, Levchenko SV, O'Neill DP, DiStasio RA, Lochan RC, Wang T, Beran GJO, Besley NA, Herbert JM, Lin CY, Van Voorhis T, Chien SH, Sodt A, Steele RP, Rassolov VA, Maslen PE, Korambath PP, Adamson RD, Austin B, Baker J, Byrd EFC, Dachsel H, Doerksen RJ, Dreuw A, Dunietz BD, Dutoi AD, Furlani TR, Gwaltney SR, Heyden A, Hirata S, Hsu CP, Kedziora G, Khalliulin RZ, Klunzinger P, Lee AM, Lee MS, Liang W, Lotan I, Nair N, Peters B, Proynov EI, Pieniazek PA, Rhee YM, Ritchie J, Rosta E, Sherrill CD, Simmonett AC, Subotnik JE, Woodcock HL, Zhang W, Bell AT, Chakraborty AK, Chipman DM, Keil FJ, Warshel A, Hehre WJ, Schaefer HF, Kong J, Krylov AI, Gill PMW, Head-Gordon M. Physical Chemistry Chemical Physics. 2006;8:3172. doi: 10.1039/b517914a. [DOI] [PubMed] [Google Scholar]
- 36.Dixon SL, Merz KM. Journal of Chemical Physics. 1996;104:6643. [Google Scholar]
- 37.Gogonea V, Westerhoff LM, Merz KM. Journal of Chemical Physics. 2000;113:5604. [Google Scholar]
- 38.He X, Zhang JZH. Journal of Chemical Physics. 2005;122:031103. [Google Scholar]
- 39.Nakano T, Kaminuma T, Sato T, Fukuzawa K, Akiyama Y, Uebayasi M, Kitaura K. Chemical Physics Letters. 2002;351:475. [Google Scholar]
- 40.Fedorov DG, Kitaura K. Chemical Physics Letters. 2006;433:182. [Google Scholar]
- 41.Fedorov DG, Kitaura K. Journal of Physical Chemistry A. 2007;111:6904. doi: 10.1021/jp0716740. [DOI] [PubMed] [Google Scholar]
- 42.Fedorov DG, Ishimura K, Ishida T, Kitaura K, Pulay P, Nagase S. Journal of Computational Chemistry. 2007;28:1476. doi: 10.1002/jcc.20645. [DOI] [PubMed] [Google Scholar]
- 43.Fedorov DG, Kitaura K. Journal of Chemical Physics. 2005;123:134103. doi: 10.1063/1.2007588. [DOI] [PubMed] [Google Scholar]
- 44.Tomasi J, Mennucci B, Cammi R. Chemical Reviews. 2005;105:2999. doi: 10.1021/cr9904009. [DOI] [PubMed] [Google Scholar]
- 45.Fedorov DG, Kitaura K, Li H, Jensen JH, Gordon MS. Journal of Computational Chemistry. 2006;27:976. doi: 10.1002/jcc.20406. [DOI] [PubMed] [Google Scholar]
- 46.Cossi M, Rega N, Scalmani G, Barone V. Journal of Computational Chemistry. 2003;24:669. doi: 10.1002/jcc.10189. [DOI] [PubMed] [Google Scholar]
- 47.Li H, Jensen JH. Journal of Computational Chemistry. 2004;25:1449. doi: 10.1002/jcc.20072. [DOI] [PubMed] [Google Scholar]
- 48.Schmidt MW, Baldridge KK, Boatz JA, Elbert ST, Gordon MS, Jensen JH, Koseki S, Matsunaga N, Nguyen KA, Su SJ, Windus TL, Dupuis M, Montgomery JA. Journal of Computational Chemistry. 1993;14:1347. [Google Scholar]
- 49.Barone V, Cossi M, Tomasi J. Journal of Chemical Physics. 1997;107:3210. [Google Scholar]
- 50.Hobza P, Selzle HL, Schlag EW. Journal of Physical Chemistry. 1996;100:18790. [Google Scholar]
- 51.Bonneau R, Strauss CEM, Rohl CA, Chivian D, Bradley P, Malmstrom L, Robertson T, Baker D. Journal of Molecular Biology. 2002;322:65. doi: 10.1016/s0022-2836(02)00698-8. [DOI] [PubMed] [Google Scholar]
- 52.Feig M, Karanicolas J, Brooks CL. Journal of Molecular Graphics & Modelling. 2004;22:377. doi: 10.1016/j.jmgm.2003.12.005. [DOI] [PubMed] [Google Scholar]
- 53.Tsai J, Bonneau R, Morozov AV, Kuhlman B, Rohl CA, Baker D. Proteins-Structure Function and Genetics. 2003;53:76. doi: 10.1002/prot.10454. [DOI] [PubMed] [Google Scholar]
- 54.Wollacott AM, Merz KM. Journal of Chemical Theory and Computation. 2006;2:1070. doi: 10.1021/ct0600161. [DOI] [PubMed] [Google Scholar]
- 55.Dunning TH. Journal of Physical Chemistry A. 2000;104:9062. [Google Scholar]
- 56.Boys SF, Bernardi F. Molecular Physics. 1970;19:553. [Google Scholar]
- 57.Case DA, Cheatham TE, Darden T, Gohlke H, Luo R, Merz KM, Onufriev A, Simmerling C, Wang B, Woods RJ. Journal of Computational Chemistry. 2005;26:1668. doi: 10.1002/jcc.20290. [DOI] [PMC free article] [PubMed] [Google Scholar]
- 58.Wang JM, Cieplak P, Kollman PA. Journal of Computational Chemistry. 2000;21:1049. [Google Scholar]
- 59.Wang JM, Wolf RM, Caldwell JW, Kollman PA, Case DA. Journal of Computational Chemistry. 2004;25:1157. doi: 10.1002/jcc.20035. [DOI] [PubMed] [Google Scholar]
- 60.Johnson ER, Becke AD. Journal of Chemical Physics. 2005;123:024101. doi: 10.1063/1.2065267. [DOI] [PubMed] [Google Scholar]
- 61.Becke AD, Johnson ER. Journal of Chemical Physics. 2006;124:014104. doi: 10.1063/1.2139668. [DOI] [PubMed] [Google Scholar]
- 62.Tuttle T, Thiel W. Physical Chemistry Chemical Physics. 2008;10:2159. doi: 10.1039/b718795e. [DOI] [PubMed] [Google Scholar]
- 63.Gonzalez C, Lim EC. Journal of Physical Chemistry A. 2003;107:10105. [Google Scholar]
- 64.Ahlrichs R, Penco R, Scoles G. Chemical Physics. 1977;19:119. [Google Scholar]
- 65.Becke AD, Johnson ER. Journal of Chemical Physics. 2005;123:154101. doi: 10.1063/1.2065267. [DOI] [PubMed] [Google Scholar]
- 66.Grimme S. Journal of Computational Chemistry. 2004;25:1463. doi: 10.1002/jcc.20078. [DOI] [PubMed] [Google Scholar]
- 67.von Lilienfeld OA, Tavernelli I, Rothlisberger U, Sebastiani D. Physical Review Letters. 2004;93:153004. doi: 10.1103/PhysRevLett.93.153004. [DOI] [PubMed] [Google Scholar]
- 68.Besler BH, Merz KM, Kollman PA. Journal of Computational Chemistry. 1990;11:431. [Google Scholar]
- 69.Jakalian A, Jack DB, Bayly CI. Journal of Computational Chemistry. 2002;23:1623. doi: 10.1002/jcc.10128. [DOI] [PubMed] [Google Scholar]
- 70.Shibasaki K, Fujii A, Mikami N, Tsuzuki S. Journal of Physical Chemistry A. 2006;110:4397. doi: 10.1021/jp0605909. [DOI] [PubMed] [Google Scholar]
- 71.Fusti-Molnar L, He X, Wang B, Merz KM. (to be submitted) [Google Scholar]
- 72.Freddolino PL, Liu F, Gruebele M, Schulten K. Biophysical Journal. 2008;94:L75. doi: 10.1529/biophysj.108.131565. [DOI] [PMC free article] [PubMed] [Google Scholar]
- 73.Kelly CP, Cramer CJ, Truhlar DG. Journal of Chemical Theory and Computation. 2005;1:1133. doi: 10.1021/ct050164b. [DOI] [PubMed] [Google Scholar]
- 74.Marenich AV, Olson RM, Kelly CP, Cramer CJ, Truhlar DG. Journal of Chemical Theory and Computation. 2007;3:2011. doi: 10.1021/ct7001418. [DOI] [PubMed] [Google Scholar]
- 75.VandeVondele J, Krack M, Mohamed F, Parrinello M, Chassaing T, Hutter J. Computer Physics Communications. 2005;167:103. [Google Scholar]
- 76.Zhao Y, Truhlar DG. Journal of Chemical Theory and Computation. 2007;3:289. doi: 10.1021/ct6002719. [DOI] [PubMed] [Google Scholar]
- 77.Zhao Y, Truhlar DG. Accounts of Chemical Research. 2008;41:157. doi: 10.1021/ar700111a. [DOI] [PubMed] [Google Scholar]


