

Abstract
Alkylation chemotherapy has been a long-standing treatment protocol for human neoplasia. N-methyl-N’–nitro-N-nitrosoguanidine (MNNG) is a direct-acting monofunctional alkylator. Temozolomide is a clinical chemotherapeutic equivalent requiring metabolic breakdown to the alkylating agent. Both chemicals have similar mechanistic efficacy against DNA mismatch repair proficient tumor cells that lack expression of methylguanine methyltransferase (MGMT). Clinically relevant concentrations of both agents affect replicating cells only after the first cell cycle. This phenomenon has been attributed to replication fork arrest at unrepaired O6methyldeoxyguanine lesions mispaired with thymine during the first replication cycle. Here we demonstrate, by several different approaches, that MNNG-treated tumor cells do not arrest within the second cell cycle. Instead the population slowly traverses through mitosis without cytokinesis into a third cell cycle. The peak of both ss- and ds-DNA breaks occur at the height of the long mitotic phase. The majority of the population emerges from mitosis as multinucleated cells that subsequently undergo cell death. However, a very small proportion of cells, less than 1:45,000, survive to form new colonies. Taken together, these results indicate that multinucleation within the third cell cycle, rather than replication fork arrest within the second cell cycle, is the primary trigger for cell death. Importantly, multinucleation and cell death is consistently avoided by a small percentage of the population that continues to divide. This information should prove clinically relevant for the future design of enhanced cancer chemotherapeutics.
Keywords: DNA mismatch repair, cell cycle synchronization, monofunctional alkylating agents, methylguanine methyltransferase, O6methyldeoxyguanine
INTRODUCTION
N-methyl-N’–nitro-N-nitrosoguanidine (MNNG) produces several different alkylated DNA lesions, the majority of which are repaired efficiently by the base excision repair (BER) pathway and are of low mutagenic potential (1-3). One exception is the O6methyldeoxyguanine (O6meG) modification that is repaired by methylguanine methyltransferase (MGMT). The MGMT suicide mechanism covalently transfers the O6methyl group to an active site residue, thereby rendering the enzyme useless after a single repair reaction (4). If left unrepaired, O6meG is frequently mispaired with thymine by replicating polymerases, resulting in a G→A mutation if not corrected before the succeeding replication cycle (5, 6). DNA mismatch repair (MMR) proficient cells that lack MGMT expression demonstrate significantly enhanced sensitivity to alkylating agents by decreased colony survival and increased G→A mutation frequency of surviving cells (5-7). MMR proficient cells exposed to low concentrations of monofunctional alkylating agents have been reported to undergo G2 arrest within the second cell cycle and subsequent apoptosis (8-10). Conversely, cells that lack MMR and MGMT activity are highly tolerant to alkylation damage (decreased G2 arrest, increased colony survival) with surviving cells sustaining a high mutation frequency. This is likely due to the combined effects of increased cell survival, and absence of both MMR and MGMT repair activities (11-14). From this, it is apparent that the MMR pathway is required for O6meG-induced damage signaling, but not for the actual repair of this DNA lesion.
The phenomenon of second cell cycle arrest and subsequent apoptosis after exposure to low concentrations of monofunctional alkylating agents has been attributed to the recruitment of MMR proteins to O6meG:T mispairs formed during the first S phase (15, 16). Two different models have been proposed for triggering of a DNA damage response and cell cycle arrest within the second G2 phase. One model involves direct activation of the ATR signaling pathway by these complexes (16, 17). This model has been substantiated by the generation of knock-in mice harboring separation-of-function mutations in the MMR pathway (18, 19). Another model describes an indirect triggering of the DNA damage signaling pathway by futile rounds of mismatch excision repair opposite the damaged nucleotide (8, 20). Persistent excision intermediates would lead to replication fork arrest that, in turn, would trigger the ATR damage signaling cascade (21).
Because fairly broad concentration ranges of monofunctional alkylators such as MNNG have been reported to induce this phenomenon within different cell lines, the terminology of low-level MNNG is defined to be within a concentration range that does not induce immediate cell cycle arrest, but eventually induces cell death as evidenced by the colony survival assay (13, 22). The extended length of time between initial low-level alkylation exposure and subsequent onset of death of the tumor cell population provides significant challenges for understanding cellular mechanisms contributing to this process. Delayed cell cycle arrest and DNA damage and repair events contributing to cell death by exposure to temozolomide (TMZ), a clinical chemotherapeutic agent, have been reported to be mechanistically identical to tumor cell lines exposed to low-level MNNG (23). Therefore exposure of tumor cells to direct-acting alkylators, such as MNNG, has become a useful tool to decipher mechanisms that limit chemotherapeutic efficacy of alkylating drugs such as TMZ. Major limitations of treatment protocols involving alkylating agents include toxicity to the patient, development of tumor resistance, and chemotherapy-induced secondary tumors (24-27).
Here we have investigated the long-term consequences of low-level MNNG exposure to HeLa MR cells that are MMR proficient and lack expression of MGMT. A methodical examination of late temporal events within the MNNG-treated tumor cell population demonstrates that G2 arrest within the second cell cycle, as has been generally accepted, does not occur to any measurable extent, despite that activation of the ATR signaling pathway does occur during this part of the cell cycle (10, 15, 28). Rather, the cell population continues to slowly traverse through the subsequent mitotic phase, with the majority of mitotic cells exhibiting aberrant centrosomes and increased strand breakage. After completion of mitosis, multinucleated cells predominant. The majority of this population eventually succumbs to cell death over the next few days. However, once this crisis has passed, multiple overlapping clones of mononucleated cells that have escaped cell death continue to divide to form growing colonies.
MATERIALS & METHODS
Cell lines
HeLa MR cells (MGMT-) were grown in Dulbecco’s Modified Eagles’s Medium/Ham’s F12 50/50 mix (DMEM/F12; Invitrogen) + 10% fetal bovine serum (FBS; Atlanta Biologicals Inc.) at 37°C in a 5% CO2 humidified atmosphere. HeLa MR cells were a kind gift from Dr. Sankar Mitra.
Chemicals and reagents
N-methyl-N’-nitro-N-nitrosoguanidine (MNNG), etoposide, camptothecin, and thymidine were all purchased from Sigma. Z-Val-Ala-DL-Asp(OMe)-fluoromethylketone (Z-VAD) was purchased from Bachem. 4’,6-Diamidine-2-phenylindale, dihydrochloride (DAPI) was purchased from Molecular Probes. Antibodies against caspase 8 and phospho-cdc2 (Tyr15) were from Cell Signaling Technology; antibody against cdc2 was from Santa Cruz; antibody against Replication Protein A (RPA) was from Calbiochem; antibody against phospho-Histone H3 was from Millipore; antibody against phospho-Chk1 (s345) (#2344) was from Cell Signaling; antibody against Chk1 was from Bethyl; antibody against phosphorylated (γ)H2AX was from Abcam; anti-PARP [Poly (ADP-ribose) Polymerase] was from BD PharMingen; antibodies against α-Tubulin and γ-Tubulin were from Sigma. Secondary antibodies; Alexa Fluor 488 goat anti-rabbit IgG and Alexa Fluor 546 goat anti-mouse IgG were purchased from Molecular Probes.
Cell cycle synchronization, DNA damage treatment and inhibition of apoptosis
Cell cycle synchronization into late G1/early S by double thymidine block (DTB) has been described previously (7, 29). For MNNG treatment, 0.2 μM MNNG was added to media immediately after release from DTB. Z-VAD (50 nM) was added to cells starting 24 hrs after release from DTB to inhibit apoptosis. Cells were treated with etoposide (500 nM) for 20 hrs or camptothecin (1 μM) for 4 hrs as positive hyperphosphorylated RPA controls.
Cell cycle analyses
Cells subjected to DNA content analysis were trypsinized, pelleted by centrifugation (600 × g for 5 min) and resuspended in 500 μl PBS. Ice cold 70% ethanol (4.5 ml) was slowly added to each cell suspension while gently vortexing to inhibit clumping. Prior to flow analysis, cells were repelleted, rinsed with PBS, and incubated for 30 min in staining solution containing 0.1% triton X-100, 0.2 mg/ml RNase A and 20 μg/ml of propidium iodide. Monitoring of cell cycle phase distribution was accomplished by using a Beckman/Coulter EPICS Elite flow cytometer, using 10,000 cells per time point, as described previously (30). These 96 hr experiments were repeated three times in duplicate.
Protein isolation and immunoblot analysis
Whole cells, nuclear lysates, and chromatin cross-linked proteins were isolated as described previously (7). After determination of protein concentrations (Biorad), supernatants were stored at -80°C. DNA concentrations of chromatin cross-linked experiments were determined by 260/280 absorbance ratio, as described previously (7). For immunoblots, equal protein concentrations of whole cell or nuclear extracts, or protein extracted from equal DNA concentrations (chromatin-protein cross-link experiments), were resuspended in SDS sample buffer and separated by denaturing SDS–polyacrylamide gel electrophoresis (SDS–PAGE). Transfer to PVDF membranes and immunoblot analyses were performed as described previously (7). Immunoreactive proteins were visualized by enhanced chemiluminescence following manufacturer’s directions (ECL solution; Amersham Pharmacia Biotech, INC.) via exposure to X-ray film. Chemiluminescence quantification of each protein band was measured using the Alpha Innotech Fluorochem HD2.
Indirect immunofluorescence and microscopy
For indirect immunofluorescence detection by microscopy, HeLa MR cells were plated onto glass coverslips at a density of 20,000 cells per coverslip. After synchronization and MNNG treatment, cells were fixed at indicated times with either 4% paraformaldehyde, pH 7.5, or ice-cold methanol for 15 minutes, depending on the antibody to be used, per manufacturers protocol. Images were acquired using a Nikon TE2000U fluorescence microscope equipped with a Photometrics Coolsnap EZ Monochrome digital camera system and NIS Elements Basic Research software package.
Comet assays
Double-strand DNA breaks within cells synchronized by DTB +/- MNNG were measured by neutral comet assay, as described by Olive et al. (31), and single-strand breaks were measured by alkaline comet assay as described by Singh et al. (32), with modifications as described below.
For neutral comet assay, cell suspensions were mixed with 0.75% low melting point agarose, layered onto the microscope slides precoated with 1% normal agarose and allowed to solidify. A final layer of 0.75% low melting point agarose was then added. The slides were immersed in cold lysis solution (2.5 M NaCl, 100 mM EDTA, 10 mM Tris, pH 10; with 1% Triton X-100 added just before use) for 1 h at 4°C in the dark. Slides were rinsed 3 times in TBE buffer (90 mM Tris, 90 mM boric acid, 1mM EDTA, pH 8.3) and incubated for 30 min in the dark. Electrophoresis was carried out in fresh TBE buffer at 25 V for 30 min. The alkaline comet assay was performed similar to the neutral comet assay, except that after lysis, the slides were transferred to an electrophoresis tank containing ice-cold alkaline solution (300 mM NaOH, 1 mM EDTA, pH > 13) and incubated for 20 min in the dark. Electrophoresis was carried out for 25 min at 300 mA. The slides were then placed into neutralizing solution (0.4 M Tris–HCl, pH 7.5) for 10 min, and stained with SYBR green (Trevigen). Comets were scored using a Nikon epifluorescence microscope at 200x magnification. Fifty cells were analyzed per slide using Komet Assay Software 5.5F (Kinetic Imaging, Liverpool, UK). The parameters used to evaluate DNA damage were Olive tail moment, a measurement of tail length and fluorescent intensity of DNA within the tail, and % of tail DNA, a measurement of amount of DNA migrated into the tail and expressed as a percentage of DNA present in the comet head. Each time point of the experiment was repeated at least twice.
RESULTS
We have investigated low-level MNNG-induced events occurring after the first cell cycle to better understand mechanisms within the cell contributing towards cell death. HeLa MR cells synchronized to late G1/early S phase by DTB were released into media containing 0.2 μM MNNG, allowing HeLa MR cells to traverse the first cell cycle in a normal fashion, after which the cells begin to exhibit several effects of alkylation treatment.
Initially, we examined phosphorylation patterns of RPA, as this information can be used to distinguish between synchronized cells undergoing mitosis or a DNA damage response. Figure 1A depicts two separate experimental time lines of the phosphorylation status of RPA, after MNNG treatment of synchronized HeLa MR cells. The upper immunoblot is of RPA cross-linked to chromatin at several time points, up to 48 hrs after release from synchrony. Both MNNG-treated and untreated cells exhibit the mitotic phosphorylation form of RPA (form 3, demonstrated in RPA phosphorylation forms box) at 6 hrs, indicating similar synchronous traversal of the first cell cycle. Cells not exposed to MNNG lose synchrony after 8 hrs, therefore the second mitotic phase of untreated cells is undetectable (7). MNNG-treated cells appear to undergo a delayed and very prolonged mitotic phase starting at 24 hrs after treatment, as evidenced by the predominance of the mitotic RPA form. This form is in addition to the hyperphosphorylated form (form 5) of RPA bound to the chromatin at 32-48 hrs, indicating a DNA damage response as well (33). We then performed an experiment using equal amounts of protein from whole cell lysates (rather than extracted protein from equal amounts of cross-linked chromatin), and a longer time line after MNNG treatment. For this experiment, we included plates that were treated with the anti-apoptotic Z-VAD, at 24 hrs after release from DTB. The lower immunoblot in Figure 1A demonstrates the presence of the mitotic form of phosphorylated RPA within whole cell lysates from 48-72 hrs, with or without Z-VAD treatment. Unlike the cross-linked chromatin immunoblot, there was no evidence of hyperphosphorylated RPA, even up to 96 hrs after treatment. We believe this is because hyperphosphorylated RPA is concentrated on the chromatin, and too dilute within whole cell lysates to detect by immunoblot (7). We also observed that the mitotic form of RPA decreased after 72 hrs. To determine if there was additional evidence of this phenomenon by flow cytometry, we employed a preparative protocol in which the whole cell is fixed with ethanol, rather than the usual method of fixation of isolated nuclei. We discovered that careful fixation of the whole cell (slowly adding ethanol to carefully dispersed cell pellets) prior to flow cytometry inhibits mechanical degradation of the chemically damaged nuclei. By this method we were able to demonstrate that MNNG-treated HeLa cells appear to undergo a very prolonged traversal of the second G2/M → G1 phase of the third cell cycle (Figure 1B, Table 1), with a portion of the population cycling further (note 84 - 96 hr time points). This MNNG-induced slow traversal of the cell cycle is unaltered by the addition of Z-VAD to inhibit apoptosis. Flow analysis also indicates that the bulk of the population does not undergo cytokinesis at the end of the second cell cycle. The largest peak throughout 48 – 96 hrs is of cells containing 4n DNA, which is not distinguishable by flow analysis between G2 or M or G1 phase of cells failing to undergo cytokinesis during mitosis. Table 1 demonstrates the percent of cells in each phase of the second and third cell cycles containing 4n → 8n DNA. Cells containing subG1 (apoptotic) DNA do not appear until 72 – 96 hrs and do not exceed 23% of the population. The smallest number of cells contain from 2n up to 4n DNA, which is likely a mixture of cells that have halted within the second cell cycle and cells that are dividing normally during this period of time.
Figure 1.
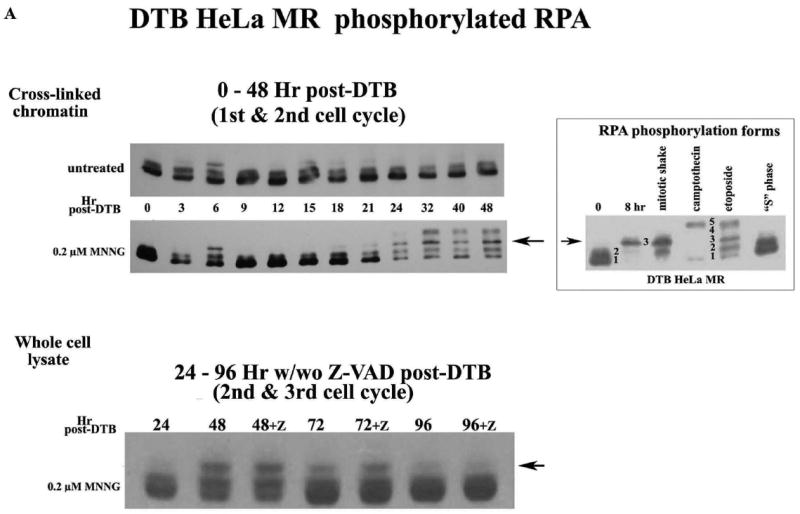

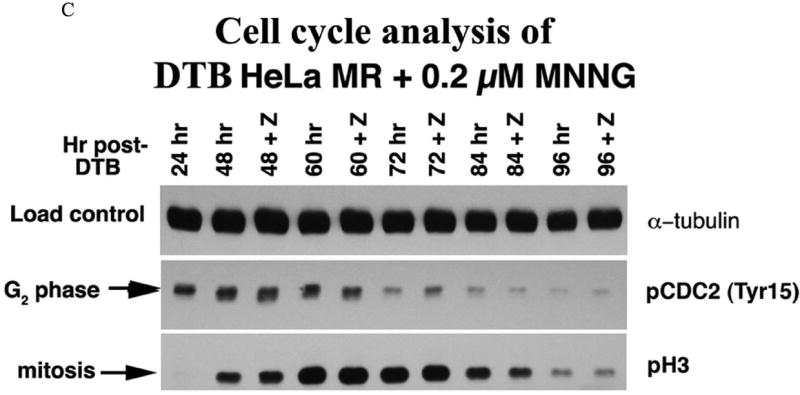
A. Phosphorylated RPA within DTB HeLa MR cells over time. Cells were synchronized by DTB and released into medium with or without 0.2 μM MNNG (0 hr) and then harvested at indicated times. Upper immunoblot: Cells were exposed to 1% formalin and cross-linked chromatin was purified at each time point. Equal amounts of cross-linked chromatin were immunoblotted with antibody to RPA-p34. Lower immunoblot: Cells were harvested at each time point and equal amounts of protein from whole cell lysates were immunoblotted for RPA-p34. The +Z lanes indicate cells were treated with Z-VAD at 24 hrs after DTB release. RPA phosphorylation controls (right panel) are 0 hrs for non-phosphorylated RPA (forms 1 and 2). Both 8 hrs (nocodazole arrested) and mitotic shake indicate the first mitotic phase after DTB release (mitotic RPA; form 3). CPT (camptothecin) and ET (etoposide) treatment produced hyperphosporylated RPA (form 5). S phase contains phosphorylated RPA that is neither mitotic nor hyperphosphorylated (form 2). B. Cell cycle analysis by flow cytometry of DNA content. HeLa cells were synchronized by DTB and treated with 0.2 μM MNNG. Whole cells were fixed with ethanol for flow cytometry at indicated times. The lower panel of the upper flow diagrams depict cells treated with Z-VAD at 24 hrs after DTB. The middle panel is an enlargement of the 72-96 hr time points. C. Cell cycle analysis by phase specific phosphorylated proteins. Equal amounts of protein from whole cell lysates harvested at the indicated times were immunoblotted for phosphorylated CDC2 (Tyr15) (G2 phase) and phosphorylated H3 (mitotic phase). Loading control was α-tubulin.
Table 1.
Flow analysis of DTB HeLa MR + 0.2 μM MNNG
Percent of population in each phase of the cell cycle
| 2nd cell cycle | 24 hr | 2nd + 3rd cell cycle* | 48 hr | 48 hr+Z | 60 hr | 60 hr+Z | 72 hr | 72 hr+Z | 84 hr | 84 hr+Z | 96 hr | 96 hr+Z |
|---|---|---|---|---|---|---|---|---|---|---|---|---|
| G1 (%) | 11 | (G2/M/G1) | 95 | 96 | 96 | 94 | 86 | 85 | 69 | 75 | 60 | 64 |
| S(%) | 79 | S | 3 | 2 | 3 | 4 | 13 | 13 | 27 | 21 | 31 | 31 |
| G2 (%) | 10 | G2 | 2 | 2 | 2 | 2 | 1 | 1 | 4 | 4 | 9 | 5 |
Percent of cells containing 4n-8n DNA in each phase of second and third cell cycle.
We then investigated phosphorylation of CDC2 (also known as CDK1) and of histone H3 to determine if there is biochemical evidence for MNNG-induced cell cycle arrest in G2 or M of the second cell cycle. Dephosphorylation of tyrosine 15 of the Cdk1/cyclinB1 complex triggers entrance into mitosis (34), whereas H3 is only phosphorylated from prophase through anaphase of mitosis (35). The sequential phosphorylation/dephosphorylation of these two proteins indicates that G2 phase (pCDC2) of the second cell cycle has started by 24 hrs, peaks at 48 hrs and is almost complete by 72 hrs, whereas the mitotic phase (pH3) begins at 48 hrs, peaks at 60-72 hrs and is almost complete by 96 hrs (Figure 1C). Inhibition of apoptosis with Z-VAD does not alter these biochemical cell cycle events, in agreement with flow analysis and RPA phosphorylation events. Z-VAD does inhibit the apoptotic process beginning at 72 hrs after MNNG treatment, evident by immunoblot analyses of PARP and caspase cleavage products (Supplement Figure 1). Flow analysis indicates that up to 23% of the cells at 84 through 96 hrs contain subG1 DNA. This is also substantiated by the number of cells still adhered to plates at each time point +/- Z-VAD (Figure 2A). Although a significantly increased number of cells in Z-VAD-treated plates occurs only at 72 and 96 hrs, there are consistently more cells in each Z-VAD plate, beginning at 60 hrs after MNNG (35 hrs after Z-VAD) treatment. Phosphorylation of Chk1 by ATR has been hypothesized to trigger the second cell cycle G2 arrest and subsequent apoptosis after MNNG treatment (15, 16), therefore we investigated the phosphorylation of Chk1 over time. Chk1 is highly phosphorylated through 48 hrs, but begins to decrease at 60 hrs and is almost completely gone by 96 hrs regardless of treatment with Z-VAD (Figure 2B). This decrease of pChk1 is in synchrony with cells leaving G2 phase of the second cell cycle (Figure 1A-C).
Figure 2.
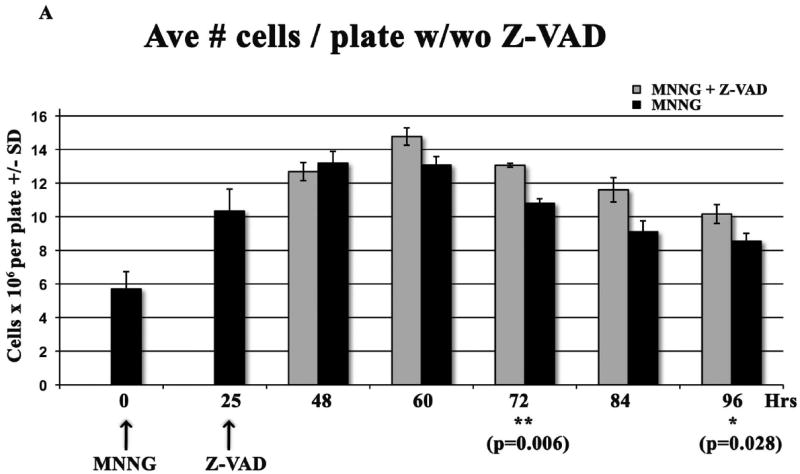
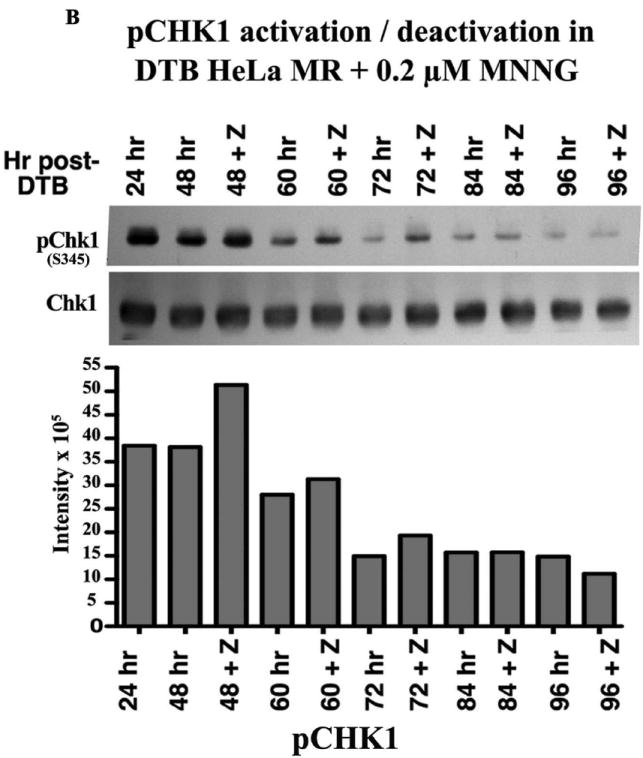
A. Effect of Z-VAD treatment on synchronized HeLa MR cells. Cells were plated in triplicate at 8 × 10⁵ cells/100 mm plate, synchronized by DTB and treated with 0.2 μM MNNG (0 hr), and with Z-VAD at 25 hrs as indicated. At each indicated time, plates were rinsed in PBS, cells were trypsinized, and counted using a Coulter Z2. Each bar is the average # of cells/plate +/- standard deviation (SD). Paired t-tests were performed between untreated and Z-VAD-treated cells at each time point. Bar graph and statistics were achieved using Prism Graphpad software. B. Phosphorylation of Chk1 over time within synchronized cells. Equal amounts of protein from whole cell lysates harvested at the indicated times were immunoblotted for total Chk1 and pChk1 (S345). Bar graph is quantification of chemiluminescent immunoblot signals using Alpha Innotech Fluor Chem HD2 imaging system and Prism Graphpad software.
The above results led us to investigate the fraction of the MNNG-treated population undergoing mitosis over this time period. Microscopic visualization of pH3 stained cells confirmed that the percent of mitotic cells peaked at 72 hrs (~20%) with or without Z-VAD (Figure 3A). We have previously treated HeLa cells with nocodazole to arrest in prophase, released and observed pH3-stained cells for up to 2 hours (unpublished results). We were unable to determine what percent of the MNNG-treated population entered or completed mitosis between 24 – 96 hrs, a 72 hr time period. However, this microscopic evaluation revealed an increasing population of multinucleated cells as mitotic cells decreased over time. An equivalent number of cells were either in mitosis or multinucleated at 72 hrs, indicating a crucial time point after MNNG-treatment for evidence of abnormal mitosis preceding multinucleation (36). Indeed, we observed approximately three times the number of abnormal mitotic cells as compared to cells undergoing normal mitosis at 72 hrs, (Figure 3B, Table 2). The abnormal mitotic cells contained increased numbers of centrosomes, and the multinucleated cells contained numerous nuclear lobes. In contrast, untreated HeLa cells completely lacked abnormal mitotic or multinucleated cells, with less than 5% of the population undergoing normal mitosis.
Figure 3.
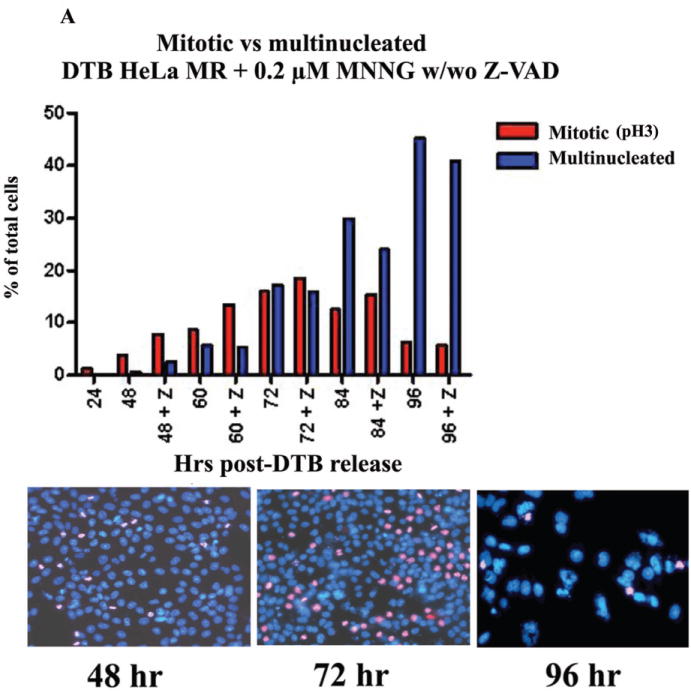
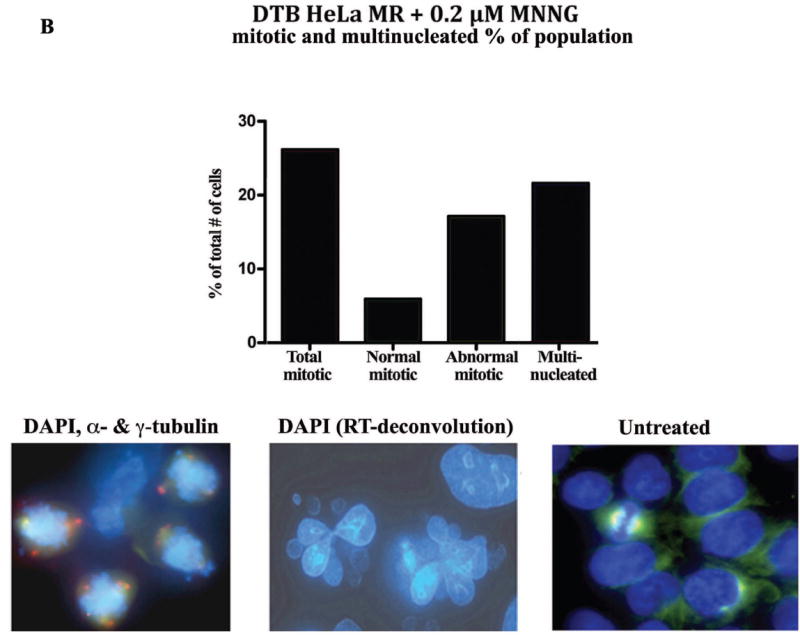
A. Percentage of mitotic and multinucleated HeLa MR cells at each time point. HeLa MR cells were synchronized by DTB and released into medium with 0.2 μM MNNG. The +Z lanes indicate cells were treated with Z-VAD at 24 hrs after DTB release. At the indicated times, cells were fixed and stained with DAPI and antibody to pH3. A (30) minimum of 500 cells was counted per time point. The bar graph was constructed using Prism Graphpad software. Photographs demonstrate typical distributions of DAPI (blue) and pH3 (pink) stained nuclei at 48, 72 and 96 hr time points. B. Percent of normal and abnormal mitotic and multinucleated cells at 72 hrs after synchronization by DTB and 0.2 μM MNNG treatment. Bar graph was derived from a total of 963 cells. The photograph on the left depicts mitotic cells containing abnormal numbers of centrosomes (DAPI, α- and γ-tubulin stained), the photograph in the middle depicts multinucleated cells (DAPI, RT-deconvolution). A normal mitotic cell is depicted on the right (untreated).
Table 2.
DTB HeLa MR + 0.2 μM MNNG mitotic and multinucleated % of population
| 72 hr post-DTB release | |
|---|---|
| Total percent mitotic* | 26.2% |
| Normal mitotic | 5.9% |
| Abnormal mitotic | 17.1% |
| Total percent multinucleated | 21.6% |
3.2% undetermined normal or abnormal mitosis from total of 963 cells.
We then asked if increased DNA breaks preceded the abnormal mitotic phase, as strand breaks during the second replication phase have been hypothesized to be the proximate cause of cell death after low-level MNNG treatment (8, 15). Figure 4A instead demonstrates a surprisingly close correlation between the height of mitotic phase (pH3) and elevation of γH2AX (ds-DNA breaks) within the MNNG treated cells. To determine if the increased γH2AX was cell cycle related or induced by actual strand breaks within individual cells, we performed comet assays after MNNG-treatment. Figure 4B demonstrates that both ss- and ds-DNA breaks are in highest abundance at 72 hrs by measurements of both Olive tail moment and % of tail DNA. Although ~ 40% of the population is either mitotic or multinucleated at this time (Figure 3A), multinucleated cells increase to almost 50% of the population by 96 hrs, which has less strand breaks. Also, G2 phase of the cell population is highest at 48 hrs, with lower strand breaks (Figures 1C and 2B). Taken together, these results point toward increased DNA strand breaks occurring during abnormal mitosis. Surprisingly both ss- and ds-DNA breaks are decreased by 96 hrs. This may simply indicate that living cells at 96 hrs have either sustained less, or repaired more, of the previously occurring DNA damage.
Figure 4.
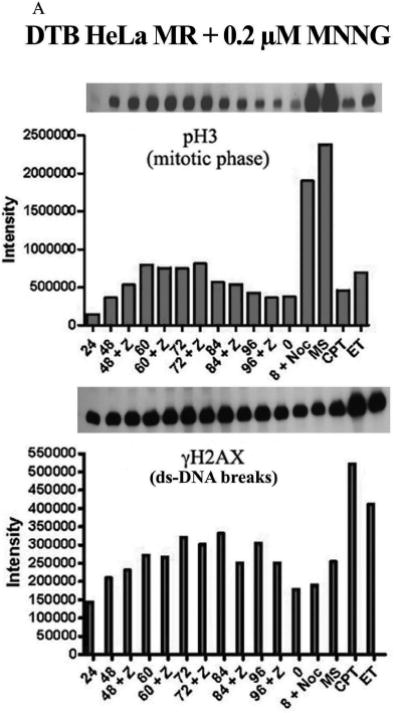
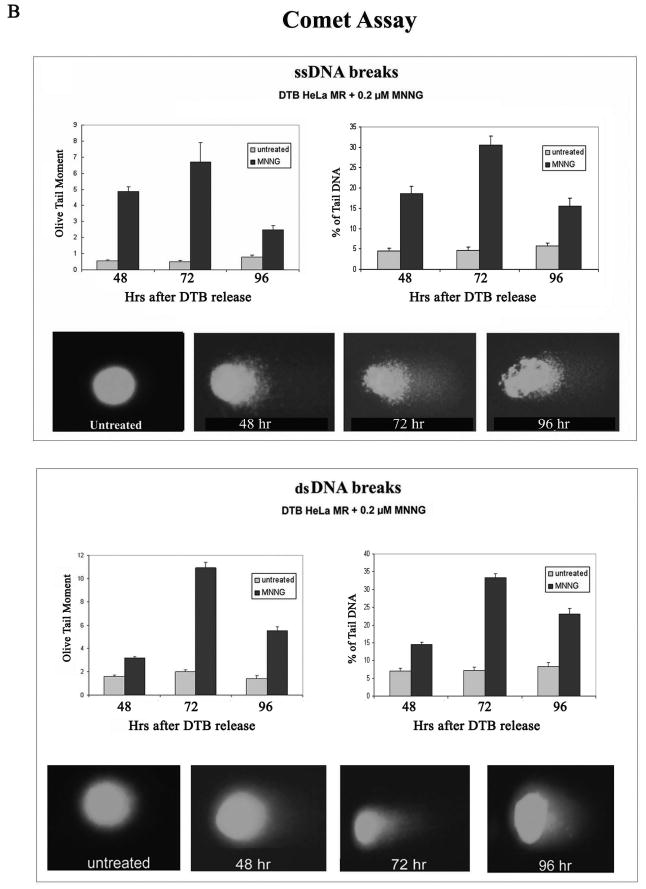
A. Comparison of pH3 (mitosis) and γH2AX (ds-DNA breaks) over time within HeLa MR cells synchronized by DTB and 0.2 μM MNNG treatment. The +Z lanes indicate cells were treated with Z-VAD at 24 hrs after DTB release. Equal amounts of protein from whole cell lysates were immunoblotted for pH3 and γH2AX. Bar graph is quantification of chemiluminescent immunoblot signals using Alpha Innotech Fluor Chem HD2 imaging system and Prism Graphpad software. B. Comet assays to quantitate ss-DNA breaks (upper panel) and ds-DNA breaks (lower panel) over time after synchronization of HeLa MR cells by DTB and treated, as indicated, with 0.2 μM MNNG. Quantification of olive tail moment and % of tail DNA, +/- standard error, was achieved using Komet Assay software 5.5F with a minimum of 50 cells per slide. Each experimental time point was repeated at least twice. Photographs below each bar graph depict a typical comet appearance at each time point.
As a whole, immunoblot, flow, and microscopic analyses indicate that low-level MNNG treatment of this neoplastic cell line does not induce a generalized G2 arrest within the second cell cycle, nor replication fork arrest during the preceding DNA synthesis phase. Instead, the majority of the population continues to survive through G2 and mitosis into the third cell cycle, up to 96 hrs after treatment.
These studies have demonstrated that MNNG-treated cells survive even beyond 96 hrs. Therefore we examined cell survival using our current plating protocol, rather than the standard colony survival assay (300 cells/150 mm plate) that we have previously determined to result in 100% cell death after 0.2 μM MNNG (7). The current protocol results in 1.4 × 10⁷ synchronized cells to be exposed to MNNG treatment. From this number, we have repeatedly observed that at least 300 cells per 150 mm plate continue to grow into overlapping colonies within two weeks of MNNG treatment. Therefore ~1:46,000 of the original MNNG-treated cells appears to survive the treatment protocol. Standard colony survival assays would not detect this low percentage of surviving cells. Survival may also depend on closer cell proximity. We are currently investigating biochemical and genetic alterations contributing to the survival of these colonies.
DISCUSSION
Our current studies demonstrate that low-level MNNG-treated tumor cells are not undergoing a detectable amount of second cell cycle G2 arrest, as has been previously reported (9, 16). These cells are instead undergoing a prolonged G2 and mitotic phase, with a significant proportion of the population surviving into the third cell cycle by 96 hrs after treatment. During this time, a very small subset continues to cycle normally. This population-wide traversal beyond mitosis is evident by several parameters, including mitotic RPA and flow cytometric profiles, as well as cell phase specific markers for G2 (pCDC2) and mitotic phase (pH3). We have also shown that phosphorylated Chk1 is increased during G2, in agreement with reports of others (15, 16). However, here we demonstrate that Chk1 is decreased to background levels as the cell population moves into mitosis and beyond. Although the onset of apoptotic cell death is apparent by apoptotic cleavage products and decreased cell numbers as the cells traverse G2 into the mitotic phase, multiple indicators demonstrate this to be a low-level ongoing event up to 96 hrs beyond treatment. Most significantly, at 72 hrs mitotic and multinucleated populations are equal, after which the mitotic fraction decreases as the multinucleated fraction increases. From this, we hypothesize that cell death of the MNNG-treated tumor cell population occurs primarily after cells have become multinucleated within the third cell cycle. Our results indicate that cell death does not occur to a measurable extent during S or G2 of the second cell cycle despite previous evidence by several conventional biomarkers (10, 15-17, 21, 28, 30, 37). Therefore, DNA strand breaks caused by replication fork collapse during S phase leading to cell death in G2 is an unlikely mechanism of cell death after low-level alkylation exposure. It is important to note that our current results are not in disagreement with previous investigations. Here we have demonstrated a very protracted G2 phase, as well as activation of the ATR DNA damage-signaling pathway and subsequent onset of apoptotic indicators, all of which are generally attributed to cell cycle arrest and apoptosis of the entire population. Conventional flow cytometry of ethanol-fixed nuclei demonstrates that DNA content moves only from second phase G2/M into sub-G1, also indicating population-wide apoptosis (15, 30). We now believe that this type of flow cytometry profile reflects the alkylation-damaged nuclei undergoing artifactual (mechanical) disintegration during the flow cytometric process. Thus, by replacing conventional flow cytometric procedures and extending the experimental time-line, we have observed that there is consistent population-wide survival of MNNG-treated cells beyond G2 of the second cell cycle. These results indicate that after low-level alkylation damage, tumor cells undergo a transient second cell cycle pause rather than permanent arrest and cell death. Although HeLa cells do not contain active p53, it should be noted that the majority of human neoplasms either do not contain active p53, or contain other mutations that inactivate DNA damage checkpoint genes (38).
Some fraction of the MNNG-treated tumor cell population likely undergoes mitotic catastrophe, as the prolonged mitotic phase is significantly impaired by ss- and ds-DNA breaks and the presence of multiple centrosomes (34, 36, 39). It has been reported that cells with damaged DNA that undergo activation of pCDC2 (pCDK1) enter mitosis, but develop highly aberrant mitotic figures and enter the ensuing G1 as highly multinucleated and non-viable (36). Indeed, we have found that the majority of cells complete the second mitotic phase without undergoing cytokinesis (cell division), but instead become multinucleated with highly abnormal, multi-lobed nuclei containing 4n DNA. These cells eventually die without further replication, although a fraction of the population gain up to 8n DNA indicating traversal through S phase. The remaining long-term surviving cells are much fewer in number and do not appear multinucleated (studies ongoing). These studies should help to refine targeting of future chemotherapy regimes. Ensuring that tumor cells do not escape mitotic catastrophe after alkylation treatment could be a viable direction to examine more closely.
Supplementary Material
Acknowledgments
Grant support. This work was supported by the National Institutes of Health [grant numbers CA84412 and CA106575 to K.J.W); and the American Cancer Society (RSG-06-163-01GMC to S.M.P).
Footnotes
Disclosure of Potential Conflicts of Interest No potential conflicts of interest were disclosed.
References
- 1.Drablos F, Feyzi E, Aas PA, et al. Alkylation damage in DNA and RNA -repair mechanisms and medical significance. DNA Repair. 2004;3:1389–407. doi: 10.1016/j.dnarep.2004.05.004. [DOI] [PubMed] [Google Scholar]
- 2.Sedgwick B, Bates PA, Paik J, Jacobs SC, Lindahl T. Repair of alkylated DNA: Recent advances. DNA Repair. 2007;6:429–42. doi: 10.1016/j.dnarep.2006.10.005. [DOI] [PubMed] [Google Scholar]
- 3.Trivedi RN, Almeida KL, Forsaglio JL, Schamus S, Sobol RW. The Role of Base Excision Repair in the Sensitivity and Resistance to Temozolomide-Mediated Cell Death. Cancer Res. 2005;65:6394–400. doi: 10.1158/0008-5472.CAN-05-0715. [DOI] [PubMed] [Google Scholar]
- 4.Gerson SL. MGMT: it’s role in cancer aetiology and cancer therapeutics. Nat Rev Cancer. 2004;4:296–307. doi: 10.1038/nrc1319. [DOI] [PubMed] [Google Scholar]
- 5.Karran P, Hampson R. Genomic Instability and Tolerance to Alkylating Agents. Cancer Surveys. 1996;28:69–85. [PubMed] [Google Scholar]
- 6.Tomita-Mitchell A, Kat AG, Marcelino La, Li-Sucholeiki X-C, Goodluck-Griffith J, Thilly WG. Mismatch repair deficient human cells: spontaneous and MNNG-induced mutational spectra in the HPRT gene. Mut Research. 2000;450:125–38. doi: 10.1016/s0027-5107(00)00020-8. [DOI] [PubMed] [Google Scholar]
- 7.Schroering AG, Williams KJ. Rapid induction of chromatin-associated DNA mismatch repair proteins after MNNG treatment. DNA Repair. 2008;7:951–69. doi: 10.1016/j.dnarep.2008.03.023. [DOI] [PMC free article] [PubMed] [Google Scholar]
- 8.Mojas N, Lopes M, Jiricny J. Mismatch repair-dependent processing of methylation damage gives rise to persistent single-stranded gaps in newly replicated DNA. Genes & Develop. 2007;21:3342–55. doi: 10.1101/gad.455407. [DOI] [PMC free article] [PubMed] [Google Scholar]
- 9.Stojic L, Brun R, Jiricny J. Mismatch repair and DNA damage signaling. DNA Repair. 2004;3:1091–101. doi: 10.1016/j.dnarep.2004.06.006. [DOI] [PubMed] [Google Scholar]
- 10.Tominaga Y, Tsuzuki T, Shiraishi A, Kawate H, Sekiguchi M. Alkylation-induced apoptosis of embryonic stem cells in which the gene for DNA-repair, methyltransferase, has been disrupted by gene targeting. Carcinogenesis. 1997;18:889–96. doi: 10.1093/carcin/18.5.889. [DOI] [PubMed] [Google Scholar]
- 11.Dosch J, Christmann M, Kaina B. Mismatch G-T binding activity and MSH2 expression is quantitatively related to sensitivity of cells to methylating agents. Carcinogenesis. 1998;19:567–73. doi: 10.1093/carcin/19.4.567. [DOI] [PubMed] [Google Scholar]
- 12.Hickman MJ, Samson LD. Apoptotoic Signaling in Response to a Single Type of DNA Lesion, O6-Methylguanine. Molecular Cell. 2004;14:105–16. doi: 10.1016/s1097-2765(04)00162-5. [DOI] [PubMed] [Google Scholar]
- 13.Jiricny J. The multifaceted mismatch-repair system. Nature Reviews Molecular Cell Biology. 2006;7:335–47. doi: 10.1038/nrm1907. [DOI] [PubMed] [Google Scholar]
- 14.Schofield MJ, Hsieh P. DNA Mismatch Repair: Molecular Mechanisms and Biological Function. Annu Rev Microbiol. 2003;57:579–608. doi: 10.1146/annurev.micro.57.030502.090847. [DOI] [PubMed] [Google Scholar]
- 15.Stojic L, Mojas N, Cejka P, et al. Mismatch repair-dependent G2 checkpoint induced by low doses of SN1 type methylating agents requires the ATR kinase. Genes & Develop. 2004;18:1331–44. doi: 10.1101/gad.294404. [DOI] [PMC free article] [PubMed] [Google Scholar]
- 16.Yoshioka K-I, Yoshioka Y, Hsieh P. ATR kinase activation mediated by MutSα and MutLα in response to cytotoxic O6-methylguanine adducts. Molecular Cell. 2006;22:501–10. doi: 10.1016/j.molcel.2006.04.023. [DOI] [PMC free article] [PubMed] [Google Scholar]
- 17.Wang Y, Qin J. MSH2 and ATR form a signaling module and regulate two branches of the damage response to DNA methylation. PNAS. 2003;100:15387–92. doi: 10.1073/pnas.2536810100. [DOI] [PMC free article] [PubMed] [Google Scholar]
- 18.Lin DP, Wang Y, Scherer SJ, et al. An Msh2 Point Mutation Uncouples DNA Mismatch Repair and Apoptosis. Cancer Res. 2004;64:517–22. doi: 10.1158/0008-5472.can-03-2957. [DOI] [PubMed] [Google Scholar]
- 19.Yang G, Scherer SJ, Shell SS, et al. Dominant effects of an Msh6 missense mutation on DNA repair and cancer susceptibility. Cancer Cell. 2004;6:139–50. doi: 10.1016/j.ccr.2004.06.024. [DOI] [PubMed] [Google Scholar]
- 20.York SJ, Modrich P. Mismatch Repair-dependent Iterative Excision at Irreparable O6Methylguanine Lesions in Human Nuclear Extracts. J Biol Chem. 2006;281:22674–83. doi: 10.1074/jbc.M603667200. [DOI] [PMC free article] [PubMed] [Google Scholar]
- 21.Iyer RR, Pluciennik A, Burdett V, Modrich P. DNA Mismatch Repair: Functions and Mechanisms. Chem Rev. 2006;106:302–23. doi: 10.1021/cr0404794. [DOI] [PubMed] [Google Scholar]
- 22.Kunkel TA, Erie DA. DNA Mismatch Repair. Annu Rev Biochem. 2005;74:681–710. doi: 10.1146/annurev.biochem.74.082803.133243. [DOI] [PubMed] [Google Scholar]
- 23.Friedman HS, Kerby T, Calvert H. Temozolomide and treatmetn of malignant glioma. Clin Cancer Res. 2000;6:2585–97. [PubMed] [Google Scholar]
- 24.Alvino E, Castiglia D, Caporali S, et al. A single cycle of treatment with temozolomide, alone or combined with O6-methylguanine-DNA methyltransferase and the mismatch repair system. Intl J Oncol. 2006 [PubMed] [Google Scholar]
- 25.Clark MJ, Mulligan EA, Grogan PT, et al. Effective sensitization by ABT-888 is lost with development of temozolomide resistance in glioblastoma xenograft lines. Molecular Cancer Thera. 2009 doi: 10.1158/1535-7163.MCT-08-0854. [DOI] [PMC free article] [PubMed] [Google Scholar]
- 26.Tentori L, Graziani G. Recent approaches to improve the antitumor efficacy of temozolomide. Current Medicinal Chem. 2009;16:245–57. doi: 10.2174/092986709787002718. [DOI] [PubMed] [Google Scholar]
- 27.Karran P, Offman J, Bignami M. Human mismatch repair, drug-induced DNA damage, and secondary cancer. Biochimie. 2003;85:1149–60. doi: 10.1016/j.biochi.2003.10.007. [DOI] [PubMed] [Google Scholar]
- 28.Hawn MT, Umar A, Carethers JM, et al. Evidence for a connection between the mismatch repair system and the G2 cell cycle checkpoint. Cancer Res. 1995;55:3721–5. [PubMed] [Google Scholar]
- 29.Bostock CJ, Prescott DM, Kirkpatrick JB. An evaluation of the double thymidine block for synchronizing mammalian cells at the G1-S border. Exp Cell Res. 1971;68:163–8. doi: 10.1016/0014-4827(71)90599-4. [DOI] [PubMed] [Google Scholar]
- 30.Schroering AG, Edelbrock MA, Richards TJ, Williams KJ. The cell cycle and DNA mismatch repair. Exp Cell Res. 2007;313:292–304. doi: 10.1016/j.yexcr.2006.10.018. [DOI] [PubMed] [Google Scholar]
- 31.Olive PL, Wlodek D, Banath JP. DNA double-strand breaks measured in individual cells subjected to gel electrophoresis. Cancer Res. 1991;51:4671. [PubMed] [Google Scholar]
- 32.Singh NP, McCoy MT, Tice RR, Schneider EL. A simple technique for quantitation of low levels of DNA damage in individual cells. Exp Cell Res. 1988;175:184–91. doi: 10.1016/0014-4827(88)90265-0. [DOI] [PubMed] [Google Scholar]
- 33.Oakley GG, Patrick SM, Yao J, Carty MP, Turchi JJ, Dixon K. RPA phosphorylation in mitosis alters DNA binding and protein-protein interactions. Biochemistry. 2003;42:3255–64. doi: 10.1021/bi026377u. [DOI] [PubMed] [Google Scholar]
- 34.Castedo M, Perfettini J-L, Roumier T, Andreau K, Medema R, Kroemer G. Cell death by mitotic catastrophe: a molecular definition. Oncogene. 2004;23:2825–37. doi: 10.1038/sj.onc.1207528. [DOI] [PubMed] [Google Scholar]
- 35.Bossard C, Jarry A, Colombeix C, et al. Phosphohistone H3 labelling fo histoprognositc grading of breast adenocarcinomas and computer-assisted determination of mitotic index. J Clin Pathol. 2006;59:706–10. doi: 10.1136/jcp.2005.030452. [DOI] [PMC free article] [PubMed] [Google Scholar]
- 36.Morrison C, Rieder CL. Chromosome damage and progression into and through mitosis in vertabrates. DNA Repair. 2004;3:1133–9. doi: 10.1016/j.dnarep.2004.03.005. [DOI] [PubMed] [Google Scholar]
- 37.Edelbrock ME, Kaliyaperumal S, Williams KJ. DNA mismatch repair efficiency and fidelity are elevated during DNA synthesis in human cells. Mutation Research. 2009;662:59–66. doi: 10.1016/j.mrfmmm.2008.12.006. [DOI] [PMC free article] [PubMed] [Google Scholar]
- 38.Mendelsohn J, Howley PM, Israel MA, Gray JW, Thompson CB. The Molecuar Basis of Cancer. Third. Saunders: Elsevier; 2008. [Google Scholar]
- 39.Castedo M, Perfettini J-L, Roumier T, et al. Mitotic catastrophe constitutes a special case of apoptosis whose suppression entails aneuploidy. Oncogene. 2004;23:4362–70. doi: 10.1038/sj.onc.1207572. [DOI] [PubMed] [Google Scholar]
Associated Data
This section collects any data citations, data availability statements, or supplementary materials included in this article.