

Abstract
Fibroblast growth factor receptors (FGFRs) play key roles in proliferation, differentiation and tumorigenesis. Many urothelial carcinomas (UC) contain activating point mutations or increased expression of FGFR3. However, little is known about the role of other FGFRs. We have examined FGFR expression in immortalised normal human urothelial cells (TERT-NHUC), UC cell lines and tumor samples and demonstrated that FGFR1 expression is increased in a high proportion of cell lines and tumors independent of stage and grade. To determine the role of FGFR1 in low-stage bladder cancer we over-expressed FGFR1 in TERT-NHUC, and examined changes in proliferation and cell survival in response to FGF2. FGFR1 stimulation increased proliferation and reduced apoptosis. To elucidate the mechanistic basis for these alterations we examined the signaling cascades activated by FGFR1. FRS2α and PLCγ were activated in response to FGF2, leading to activation of the MAPK pathway. The level of MAPK activation correlated with the level of cyclinD1, MCL1 and phosphorylated BAD, which also correlated with FGFR-induced proliferation and survival. Knockdown of FGFR1 in UC cell lines revealed differential FGFR1-dependence. JMSU1 cells were dependent on FGFR1 expression for survival but 3 other cell lines were not. Two cell lines (JMSU1 and UMUC3) were dependent on FGFR1 for growth in soft agar. Only one of the cell lines tested (UMUC3) was frankly tumorigenic and here FGFR1 knockdown inhibited tumor growth. Our results indicate that FGFR1 has significant effects on urothelial cell phenotype and may represent a useful therapeutic target in some cases of UC.
Keywords: FGFR1, urothelial cell carcinoma, therapeutic target
Introduction
Bladder cancer is the fifth most common cancer in the United Kingdom and the United States (1, 2). Molecular and pathological studies suggest that bladder cancers comprise at least two major groups (3, 4). The majority of urothelial carcinomas (UC) (around 70%) are non-invasive papillary tumors (stage Ta) that commonly recur but rarely progress and therefore have a good prognosis. Patients with tumors in this group require long-term monitoring, which makes bladder cancer the most expensive cancer to treat (5). Invasive bladder tumors are more aggressive, presenting with penetration of the basement membrane (stage T1) or invasion into muscle (stage T2). Patients with invasive disease have a much worse prognosis, with a 50% 5-year survival. The high frequency of recurrence of non-invasive UC and the poor prognosis of invasive UC highlight the necessity for development of effective targeted therapies.
FGFR3 was implicated in UC following the discovery of frequent activating mutations (6) and recent publications demonstrate that it may represent a good therapeutic target. Numerous studies have demonstrated significant association of FGFR3 mutation with non-invasive papillary tumors with good prognosis (7, 8). In addition, a high proportion of tumors, including many invasive non-mutant tumors, show over-expression of FGFR3 (9). Thus significant numbers of tumors in both major groups of UC may benefit from FGFR-targeted therapies. Cell culture systems have been used to validate mutant FGFR3 as a target in bladder cancer (10, 11). These studies showed that the most common FGFR3 mutations, S249C and Y375C, play a role in regulating proliferation, anchorage independent growth and clonogenicity at low density. Examination of the effects of FGFR inhibitors in preclinical UC models in vivo is now required to confirm that dependence on FGFR3 in culture models can be translated into therapeutic efficacy.
In other tumor types, FGFR1 is implicated as an oncogene whose expression is increased compared to normal tissue (12, 13). Constitutive activation of FGFR1 is also associated with the generation of fusion transcripts via chromosomal translocations in myeloproliferative diseases (14). Activation of FGFR1 induces both mitogenic and chemotactic responses in various cell types. In NIH3T3 cells, activated FGFR1 induced a survival response, prevented contact inhibition and inhibited apoptosis (15). Recently, mouse models of prostate and breast carcinoma have been developed by tissue-specific expression of a conditionally activated, chemically-induced dimerisation (CID) chimeric FGFR1 protein (15, 16). Premalignant prostate cells expressing activated FGFR1 exhibited accelerated progression to malignancy (17). Similar results were observed in a breast model with sustained activation of FGFR1 leading to alveolar hyperplasia and invasive lesions. In addition, a recent report demonstrated increased expression of FGFR1 in a subset of breast tumors and in vitro studies showed that FGFR1 signaling contributed to the survival of a breast cancer cell line (18).
Small molecule inhibitors and antibodies have been used successfully to target FGFR3 in multiple myeloma both in vitro and in animal models (19-22). As such inhibitors show activity against other FGFR family members, they could in theory target multiple FGFRs simultaneously in tumors that express more than one family member. Currently, little is known about the role of other FGFRs in bladder cancer. FGFR1 and FGFR4 transcripts are expressed at low levels in normal urothelium (23) but no information regarding their expression in bladder tumors has been reported. More is known about FGFR2, and evidence suggests that FGFR2b may have tumor suppressor properties (24). However, alternative splicing resulting in expression of FGFR2c has been described and showed to be upregulated during metastasis in a bladder cancer model (25).
The clear role of FGFR3 in bladder cancer and the possibility that targeted agents may be able to inhibit other FGFR family members prompted us to measure FGFR transcript levels in bladder cancer cell lines. Here we demonstrate that FGFR1 expression is increased in the majority of bladder cancer cell lines and tumors. We examined the effect of increased FGFR1 expression in normal urothelial cells and showed that FGFR1 induces increased proliferation and cell survival. We used shRNA to knock down FGFR1 in bladder tumor-derived cell lines and showed differential roles of FGFR1 in regulating survival and tumor growth. Our results demonstrate that FGFR1 plays a role in several aspects of the UC transformed phenotype and is implicated in both major groups of UC.
Materials and Methods
Cell lines
The following cell lines were used; JMSU1, 94-10, 97-7, RT4, RT112, 97-18, BFTC905, SCaBER, DSH1, VMCUB3, SW1710, 96-1, VMCUB2, 97-24, J82, HT1376, 97-1, 647V, 253J, BFTC909, TCCSUP, SD, JO’N, UMUC3, VMCUB1, 5637 and T24. Cells were grown in standard growth media at 37°C in 5% CO2. Primary normal human urothelial cells (NHUC) or telomerase-immortalised NHUC (TERT-NHUC) were derived from stripped ureteric urothelium (26). NHUC and TERT-NHUC were maintained in KFSM keratinocyte medium (Life Technologies) supplemented with EGF and bovine pituitary extract (Invitrogen).
Quantitative real-time reverse transcriptase-PCR for FGFRs
Total RNA was extracted from frozen tumor sections containing more than 90% tumor cells. RNA was extracted using Qiagen RNeasy Mini Kit (Qiagen) and 1 μg was reverse transcribed in the presence or absence of reverse transcriptase (Invitrogen) according to the manufacturer’s instructions. Real-time RT-PCR analysis was performed using SYBR Green I as reporter and ROX as reference dye (Applied Biosystems). FGFR-specific primers and SDHA (succinate dehydrogenase subunit A) control primers were as described (23).
shRNA constructs
Oligonucleotides targeting FGFR1 or a non-specific target (FGFR1 shRNA1 - forward oligo 5′ - CACAAAGTGTATAAATCTGTTCAAGAGACAGATTTATACACTTTGTGTTTTTGGGCC - 3′, reverse oligo 5′ -CAAAAAACACAAAGTGTATAAATCTGTCTCTTGAACAGATTTATACACTTTGTG- 3′, shRNA2 forward oligo 5′ - GAAGTGCATACACCGAGACTTCAAGAGAGTCTCGGTGTATGCACTTCTTTTTTGGGCC - 3′, reverse oligo 5′ - CAAAAAAGAAGTGCATACACCGAGACTCTCTTGAAGTCTCGGTGTATGCACTTC - 3′, non-specific control - forward oligo 5′ - CTTCAGCCGTTACGCTCGGTTCAAGAGACCGAGCGTAACGGCTGAAGTTTTTGGGCC - 3′, reverse oligo 5′ - CAAAAACTTCAGCCGTTACGCTCGGTCTCTTGAACCGAGCGTAACGGCTGAAG - 3′) were cloned into pRetroSuper-puro (pRS-puro) as described previously (11). pRS-GFP was a kind gift from Reuven Agami (27).
Cloning of FGFR1, production of retroviruses and transductions
FGFR1 was amplified by RT-PCR from cDNA derived from the JMSU1 bladder cancer cell line using FGFR1 specific primers (forward 5′- ctctaactgcagaactggg - 3′, and reverse 5′- tgcggcgtttgagtccgcc - 3′). The product was cloned into pGEM T-easy, sequenced and sub-cloned into pFB-HYG. We used site-directed mutagenesis to create FGFR1 Y766F and verified by sequencing. FGFR1, FGFR1 Y766F and shRNA constructs were transfected into Phoenix A packaging cells (ATCC), using siPORT™ XP-1 transfection agent (Ambion). After 48 hours, viral supernatants were filtered, mixed in equal amounts with medium containing 16μg/ml of polybrene (Sigma) and incubated with cells for 8 hours. After forty-eight hours, cells were transferred into medium containing puromycin or hygromycin.
Western blotting and immunoprecipitation
Cells were lysed in RIPAE buffer containing protease inhibitor cocktail (Sigma) and lysates cleared by centrifugation at 10000 rpm at 4°C. Antibodies used for western blotting were anti-phospho-ERK, FRS2α, ERK, actin, FGFR1 (Santa Cruz), phospho-PLCγ, PLCγ, MCL1, phospho-BAD, and 4G10 anti-phosphotyrosine (Cell Signaling). Immunoprecipitation of FGFR1 was carried out at 4°C. Lysates were incubated with rotation overnight with FGFR1 antibody, followed by protein A sepharose beads (Amersham Biosciences) for 2 h. The beads were washed twice in lysis buffer, resuspended in sample buffer (Laemmli, β-mercaptoethanol), boiled for 3 min and proteins resolved in 7% SDS-polyacrylamide gels. Proteins were transferred to PVDF membranes (Amersham Biosciences) blocked in 5% BSA in PBS 0.1% Tween, then incubated with 4G10 anti-phosphotyrosine antibody or FGFR1 antibody. Bound antibody was detected using anti-mouse horseradish peroxidase-conjugated antibody and chemiluminescence (ECL Plus Kit, Amersham Biosciences).
Phenotypic assays
For proliferation assays 5×10⁴ cells were plated in six-well dishes. Duplicate wells were counted on day 1, washed in media without supplements, cultured with heparin and/or FGF2 as described and counted at relevant time points. Each experiment was performed a minimum of three times. Cells were cultured with 10μM U0126 or 50μM PD98059 (Calbiochem) for 1 hour prior to the addition of growth factors. Viability and apoptosis assays were performed using the Guava EasyCyte™ System (Guava Technologies), according to the manufacturer’s instructions. To determine the proportion of cells undergoing DNA replication, cells were cultured with 10μM BrdU for 1 hour, 24 hours after addition of FGF2. Cells were harvested and fixed in 70% ethanol for two hours, rehydrated and suspended in 2M HCl for 20 minutes then washed in PBS. Mouse anti-BrdU (1:100) (DAKO) was added for 1 hour, washed in PBS and incubated with FITC-conjugated rabbit anti-mouse (DAKO) at a 1:50 dilution for 30 minutes. Cells were washed in PBS and resuspended in PI/RNase staining buffer (BD Bioscience) for 30 minutes. For MTT assays, 3000 cells were plated per well in a 96 well plate in quadruplicate. PD173074 was added the following day and left for 96 hours. MTT was added to the medium for 4 hours, the medium was removed and the precipitate dissolved in DMSO (n=3). For assessment of anchorage independent growth, 1×10⁵, 5×10⁴ or 1×10⁴ cells, in duplicate, were suspended in 0.3% agar in medium and cultured for 21 days (n=3). Cultures were fed weekly with 0.3% agar. Viable colonies were stained with p-iodonitrotretrazolium violet (Sigma).
Tumorigenicity testing
Female Balb/C immunodeficient nude mice (Harlan UK, Blackthorn, UK) aged 6-8 weeks were used. Mice received CRM diet (SDS, Witham, UK) and water ad libitum. All procedures were carried out under a project licence issued by the UK Home Office and UKCCCR guidelines were followed throughout. Tumor cells in cell culture medium were mixed 50:50 with matrigel (BD Biosciences) and implanted subcutaneously into each flank. Tumor growth was evaluated as described (28). Briefly, once palpable tumors were evident, daily 2-dimensional caliper measurements were taken, and volumes calculated using the formula (a2 x b) / 2, where a is the smaller and b the larger diameter of the tumor.
Results
FGFR1 expression is increased in bladder cancer cell lines and tumor samples
Recent data has demonstrated that activation and increased expression of FGFR3 is common in bladder tumorigenesis (9). To determine if other members of the FGFR family may play a role in bladder cancer we measured FGFR transcript levels in UC cell lines and tumors by real-time RT-PCR (Figure 1). FGFR1 transcript levels were increased in the majority of UC cell lines compared to normal human urothelial cells (NHUC) (Figure 1A). Transcript levels of FGFRs 2-4 were reduced in the majority of cell lines. To further investigate FGFR1, we measured transcript levels in bladder tumor samples and compared them to uncultured normal human urothelial cells (Figure 1B). FGFR1 transcript levels were increased in the majority of tumors. No relationship between expression level and stage or grade was observed.
Figure 1.
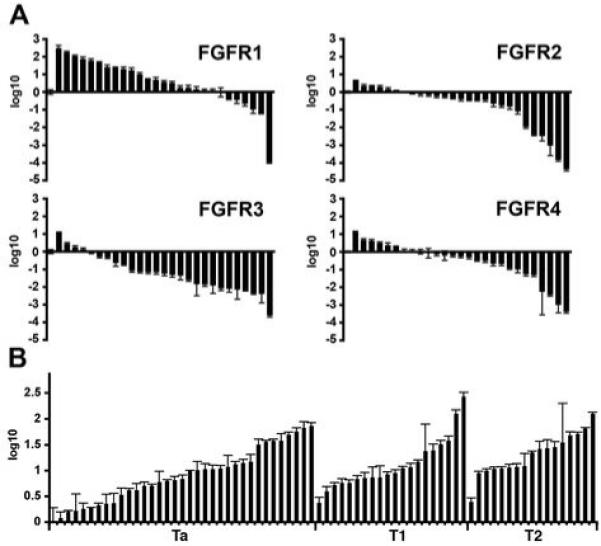
Expression levels of FGFRs in bladder cancer cell lines and bladder tumors. Transcript levels were measured by real-time RT-PCR and normalised to SDHA. Values represent fold difference compared to NHUC. A, FGFR transcript levels in 27 bladder cancer cell lines; fold change is represented using log10. B, FGFR1 transcript levels in 35 Ta, 20 T1 and 18 T2 bladder tumors.
FGFR1 regulates proliferation and survival in normal human urothelial cells
To model the increased expression measured in low stage and grade tumors and to determine the function of increased expression of FGFR1 in normal urothelium, FGFR1 was cloned and expressed in telomerase-immortalised NHUC (TERT-NHUC). These cells were designated NHUC-FR1. Numerous FGFR1 isoforms have been identified (29). We amplified and cloned the full length FGFR1 (alpha, IIIC) isoform. Expression was confirmed by western blotting (data not shown). Immunoprecipitation of FGFR1 and western blotting with an anti phospho-tyrosine antibody confirmed that FGF2 activated FGFR1 in NHUC-FR1 (Figure 2A). We also demonstrated that FGF1 activates FGFR1 in NHUC-FR1 (data not shown). However, FGFR3b is expressed in NHUC (23) and as FGF1 but not FGF2 can activate FGFR3b (30), we performed our studies with FGF2 to avoid possible confounding effects of FGFR3 stimulation. NHUC-FR1 and control cells (NHUC-VEC) were cultured in supplement-free medium in the presence of FGF2 for 5 days (Figure 2B). FGF2 increased the number of NHUC-FR1 cells compared to NHUC-VEC. To confirm that FGFR1 stimulated proliferation, BrdU incorporation was measured. NHUC-FR1 cultured with FGF2 showed the highest level of BrdU incorporation (24.63% +/-0.37) demonstrating increased proliferation compared to NHUC-VEC (0.96% +/- 0.1) and cells cultured with heparin alone (NHUC-VEC 1.57% +/- 0.3; NHUC-FR1 1.69% +/- 0.11) (Figure 2C). The time-period for cell viability and apoptosis analysis was derived empirically by analysing cell survival at different time points (data not shown). Effects were maximal at 96 hours post-addition of FGF2 (Figure 2D). No difference in viability was observed between NHUC-VEC and NHUC-FR1 cultured with heparin alone (NHUC-VEC 69.5% +/- 3.4; NHUC-FR1 73.28% +/- 3.9). However, FGF2 significantly (P = 0.013, Student’s t test) increased the viability of NHUC-FR1 compared to NHUC-VEC (NHUC-VEC 69% +/- 3.6; NHUC-FR1 84.1% +/- 3). Next we determined the level of apoptosis by AnnexinV staining (Figure 2D). No difference was observed between NHUC-VEC and NHUC-FR1 cultured with heparin (NHUC-VEC 15.7 % +/- 2.2; NHUC-FR1 14.9 +/- 1.2). In the presence of FGF2 apoptosis decreased significantly in NHUC-FR1 compared to NHUC-VEC (5.1% +/- 1.1 compared to 17.1% +/- 2.8) (P < 0.05).
Figure 2.
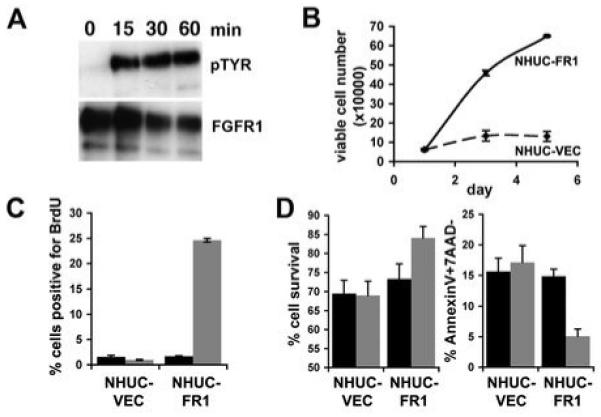
Activation of FGFR1 regulates proliferation and survival. A, Immunoprecipitation of FGFR1 from NHUC-FR1 cultured with FGF2 for 15, 30 and 60 minutes. Blots were probed with an anti-phosphotyrosine antibody (pTYR) and reprobed with anti-FGFR1 antibody as loading control. B, NHUC-VEC (dashed line) and NHUC-FR1 (solid line) were grown in supplement-free medium with heparin and FGF2 (10ng/ml). C, NHUC-VEC and NHUC-FR1 were grown in supplement-free medium with heparin (black bar), or heparin and FGF2 (grey bar) for 24 hours prior to addition of BrdU. BrdU incorporation was measured by FACS. D, NHUC-VEC and NHUC-FR1 were grown in supplement-free medium for 96 hours in the presence of heparin (black bar), or heparin and FGF2 (grey bar). Viability and apoptosis were analysed by FACS.
Activation and modulation of the MAPK pathway
Both the mitogen activated protein kinase (MAPK) and phosphatidylinositol-3-kinase (PI-3K) pathways may be activated by FGFR1 (31). In NHUC-FR1 the MAPK pathway was activated (Figure 3A) and only negligible levels of activated AKT were detected (data not shown). MAPK pathway activation was measured via phosphorylation of ERK1/2, which was maximally activated after 5 minutes and remained activated up to 60 minutes post stimulation. Activation of the MAPK pathway occurs via recruitment of signaling proteins that bind to phosphorylated tyrosine sites on activated FGFR1 and via closely linked docking proteins that become phosphorylated in response to FGF-stimulation (31, 32). FRS2α and PLCγ were phosphorylated in response to activation of FGFR1 (Figure 3B).
Figure 3.
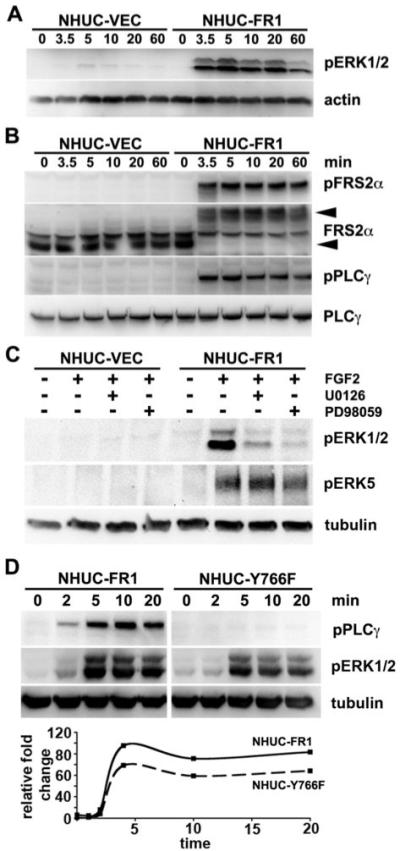
FGFR1 activates the MAPK pathway. Cells were cultured in supplement-free medium for 1 hour prior to culture with heparin and FGF2 for indicated times. A, Protein lysates were blotted with anti-pERK antibodies then reprobed with anti-actin. B, Protein lysates were blotted with phospho-specific antibodies against FRS2α and PLCγ. Blots were reprobed with anti-FRS2α or PLCγ antibodies. C, Cells were cultured with DMSO (control), U0126 or PD98059 for 1 hour. FGF2 was added for 5 minutes and lysates probed with anti-phospho ERK5 antibody that also cross-reacts with pERK1/2. Blots were reprobed with tubulin. D, NHUC-FR1 and NHUC-Y766F were cultured with FGF2 and lysates blotted for pPLCγ or pERK. Loading contol, tubulin. Graph represents the change in pERK levels in NHUC-FR1 (solid line) and NHUC-Y766F (dashed line) quantified from a representative experiment.
To relate the changes in MAPK activity to the changes in proliferation and survival, we modulated MAPK activation by utilizing MAP kinase kinase (MEK1/2) inhibitors and site-directed mutagenesis of FGFR1. NHUC-VEC and NHUC-FR1 were pre-cultured with MEK1/2 inhibitors, U0126 or PD98059, then stimulated with heparin and FGF2 for 5 minutes (Figure 3C). Both inhibitors prevented FGFR1 activation of ERK1/2. The MEK1/2 inhibitors are reported to inhibit ERK5 and hence previous studies describing phenotypes that were altered with these inhibitors may be a result of inhibiting both ERK5 and ERK1/2 (33). The MEK1/2 inhibitors did not reduce ERK5 activation in our system (Figure 3C) indicating that the phenotypes identified were the result of inhibiting ERK1/2 activation. It has been reported that inhibition of PLCγ activation by mutation of the PLCγ binding site on FGFR1 (Y766F) reduces the level of MAPK activation (34). To determine if the level of MAPK activation correlated with the level of proliferation and survival we used site directed mutagenesis to destroy the PLCγ binding site on FGFR1 (Y766F). Y766F-FGFR1 was transduced into TERT-NHUC (NHUC-Y766F). NHUC-Y766F expressed the same level of FGFR1 as NHUC-FR1, as determined by western blotting (data not shown). NHUC-Y766F showed no FGF2-induced activation of PLCγ and reduced FGFR1 activation of ERK1/2 (Figure 3D).
The level of MAPK signaling determines proliferative and apoptotic indices
NHUC-Y766F and MEK-inhibitors were used to determine the effect of modulating MAPK signaling on cell proliferation and survival (Figure 4). NHUC-Y766F showed reduced levels of DNA replication in the presence of FGF2 compared to NHUC-FR1 (Figure 4A). In the presence of MEK inhibitors, the levels of DNA replication in NHUC-FR1 and NHUC-Y766F were similar to control cells. FGFR1-induced pro-survival responses were also significantly (P < 0.01) reduced in NHUC-Y766F compared to NHUC-FR1 (Figure 4B). Neither NHUC-FR1 nor NHUC-Y766F showed a difference in FGFR1-induced survival compared to NHUC-VEC when cultured with MEK inhibitors (Figure 4C), suggesting that the level of MAPK activation determines the observed differences in proliferation and survival.
Figure 4.
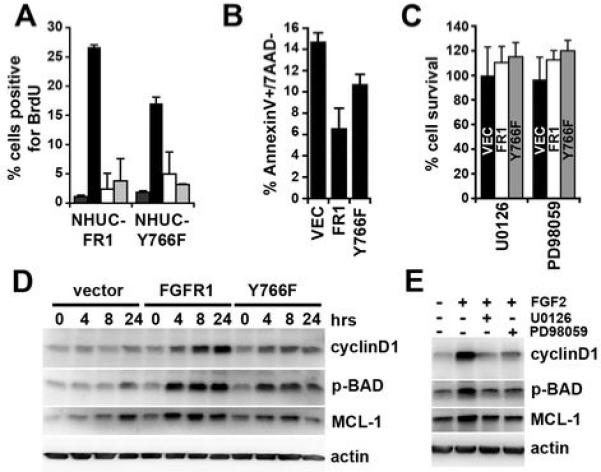
MAPK activation regulates proliferation and survival. A, NHUC-FR1 and NHUC-Y766F were cultured with heparin (dark grey), FGF2 (black), FGF2 and U0126 (white), or FGF2 and PD98059 (light grey) for 24 hours prior to addition of BrdU. BrdU incorporation was analysed using FACS. B, Cells were cultured in supplement-free medium with heparin and FGF2 for 96 hours. Apoptosis was analysed by AnnexinV staining. C, NHUC-VEC (black bar), NHUC-FR1 (white bar) and NHUC-Y766F (grey bar) were cultured with heparin, FGF2 and U0126 or PD98059 for 96 hours. D, NHUC-VEC, NHUC-FR1 and NHUC-Y766F were cultured with heparin and FGF2 for indicated times and their lysates blotted for cyclinD1, MCL1 and phosphorylated BAD. E, NHUC-FR1 were cultured with indicated substances for 4 hours and their lysates blotted for cyclin D1, MCL1 and phosphorylated BAD.
MAPK activation regulates pro-survival and pro-apoptotic factors
We used western blotting to identify factors downstream of MAPK signaling that may regulate proliferation and pro-survival responses (Figure 4D). CyclinD1 expression was increased in response to FGF2 in a time-dependent manner. Two factors associated with pro-survival and pro-apoptotic responses are MCL1 and BAD, respectively. Stimulation of FGFR1 increased MCL1 expression and BAD was inactivated via phosphorylation. Increased phosphorylation of BAD occurred at ser112 but not ser136 (data not shown), indicative of MAPK rather than AKT inactivation. The changes in expression correlated with the level of MAPK activation and observed changes in proliferation and survival (Figure 2). In addition, MEK inhibitors prevented the increase in CyclinD1 expression, MCL1 expression and phosphorylation of BAD (Figure 4E).
Bladder cancer cell lines show differential dependence on FGFR1 expression
In an inducible FGFR1-driven model of prostate cancer in mice, early dependence of hyperplasia and prostatic intraepithelial neoplasia on FGFR1 signaling is partially lost in the invasive adenocarcinomas that develop after long-term FGFR1 activation (17). Thus it has been proposed that a “susceptibility window” may exist for targeting FGFR1 in this tissue. To determine the role of FGFR1 in muscle invasive bladder cancer, we used shRNA to knock down expression in four UC cell lines, JMSU1, UMUC3, 253J and HT1197, which are derived from invasive tumors and express high levels of FGFR1. These were transduced with retroviruses containing a U6 promoter (11) driving expression of FGFR1 specific shRNA. Two shRNAs were successful in reducing expression of FGFR1 (Figure 5A). Interestingly, knockdown of FGFR1 in JMSU1 was consistently less than in the other cell lines. We hypothesised that JMSU1 may be dependent on FGFR1 expression and that only cells with a low level of knockdown could survive. To test this hypothesis we cloned the shRNAs into a retroviral construct containing GFP, transduced these into UMUC3 and JMSU1 and monitored the number of GFP- and non-GFP-expressing cells by FACS (Figure 5B). The relative proportion of GFP-expressing cells with FGFR1 shRNA expression in NHUC-VEC and UMUC3 cells did not alter compared to the non-specific control. However in JMSU1, the proportion of GFP-expressing cells with shRNA targeted against FGFR1 decreased compared to controls suggesting that these cells are FGFR1-dependent. To test this further, we cultured cells with the FGFR inhibitor PD173074 and measured cell survival by MTT assay. Compatible with the shRNA data, PD173074 reduced JMSU1 survival but had no effect on TERT-NHUC or UMUC3 (Figure 5C).
Figure 5.
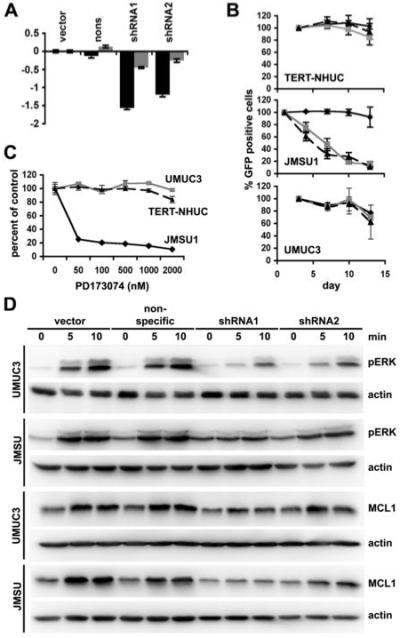
Bladder cancer cell line dependence on FGFR1. A, FGFR1 transcript levels in JMSU1 (grey bars) and UMUC3 (black bars) transduced with vector, non-specific shRNA, shRNA1 or shRNA2 were measured by real-time RT-PCR. B, TERT-NHUC, JMSU1 and UMUC3 were transduced with non-specific shRNA (solid black), shRNA1 (dashed black), or shRNA2 (grey) in retroviruses expressing GFP. Graph represents the percentage of GFP expressing cells remaining in culture compared to the number at the start of the experiment. C, TERT-NHUC (dashed black), UMUC3 (grey) and JMSU1 (solid black) were cultured with FGFR inhibitor PD173074. Cell survival was determined by MTT assay. D, JMSU1 and UMUC3 were starved in 0.1% FCS for 24 hours prior to culture with heparin and FGF2. Lysates were probed for pERK, MCL1 and actin.
To examine the effects of FGFR1 knockdown on downstream signaling pathways, knockdown cell lines were starved for 24 hours then cultured with FGF2. Similar to NHUC-FR1, the MAPK pathway was activated by FGF2 stimulation in the tumour cell lines without knockdown, increased expression of MCL1 was observed and both were attenuated by FGFR1 knockdown (Figure 5D). Phosphorylation of BAD was undetectable in these lines. Cells expressing shRNA2, which was less efficient at knocking down FGFR1 (Figure 5A), showed less attenuation of signaling than shRNA1, as demonstrated by higher levels of pERK and MCL1 expression.
Both UMUC3 and JMSU1 parental lines grow independently of anchorage in soft agar. 253J and HT1197 do not. FGFR1 knockdown reduced the ability of UMUC3 (Figure 6A) and JMSU1 (Figure 6B) to form colonies in soft agar, suggesting that FGFR1 plays a role in preventing cell death and promoting anchorage independent growth.
Figure 6.
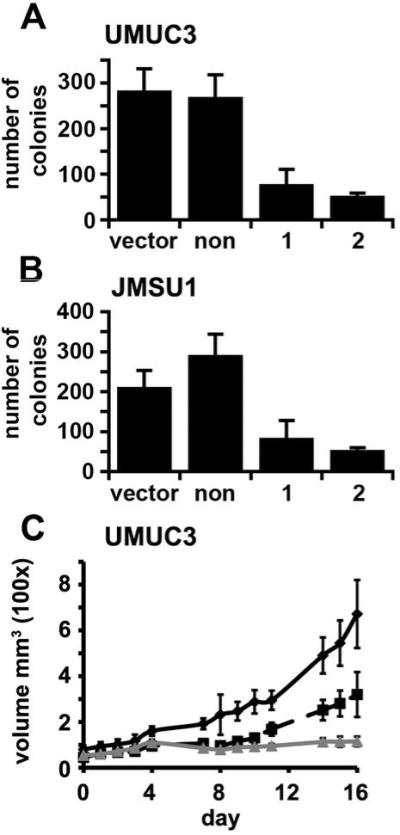
FGFR1 knockdown reduces anchorage independent growth and growth in vivo. UMUC3 (A) or JMSU1 (B) expressing a non-specific shRNA, shRNA1 or shRNA2 were cultured in soft agar for 21 days and stained with p-iodonitrotretrazolium violet. Graph shows viable colonies greater than 1mm in size per 10cm2. UMUC3 were injected subcutaneously into nude mice and tumor volume measured (C). Solid black line, cells expressing the non-specific control; dashed black line, cells expressing shRNA1; grey line, cells expressing shRNA2. Error bars represent standard error.
To determine if knockdown of FGFR1 altered the growth rate or tumorigenicity in vivo, cells were injected subcutaneously into nude mice (Figure 6C,D). FGFR1 shRNAs significantly (P < 0.001) reduced the growth of UMUC3 from day 4 in vivo compared to the non-specific control (Figure 6C). Tumorigenicity tests of JMSU1 were not successful, as only small tumors developed which inevitably ulcerated independent of cell number or the use of Matrigel. To determine if FGFR1 affected the rate of tumor invasion into surrounding tissue, tumors were harvested at different time points during the experiment (data not shown). No difference in invasion was observed between FGFR1 knockdown cell lines and controls, suggesting that FGFR1 is not a key factor in promoting invasion in these cell lines. 253J and HT1197 formed only transient subcutaneous nodules that regressed within 3-4 weeks and this was not affected by FGFR1 knockdown.
Discussion
Although much recent research has focused on the role of FGFR3 in bladder cancer, little is known about the expression and effects of other FGFR family members in bladder tumorigenesis. We examined the transcript levels of FGFRs1-4 and demonstrated that FGFR1 expression is increased in a high proportion of bladder cancer cell lines and in the majority of tumors independent of stage and grade. This suggests that upregulation of FGFR1 expression is an early event in the development of bladder cancer. FGFR1 is located at 8p12, a region that is amplified in a small proportion of bladder tumors (35, 36), and this may explain some cases of increased expression observed in our study. Amplification of FGFR1 has also been identified in lobular breast cancer (18). In breast cancer cell lines, amplification of FGFR1 was associated with increased expression and this contributed to cell survival. However, the low proportion of tumors showing amplification in bladder cancer does not account for the high frequency of increased expression, suggesting that this may be due to altered transcriptional regulation or increased transcript stability. Studies of rat and chicken FGFR1 promoters have identified a promoter region and transcription factors that regulate FGFR1 transcription (37, 38). We have identified a similar region in the human FGFR1 promoter that when deleted reduces promoter activity in bladder cancer cell lines (our unpublished data) indicating that upregulation of FGFR1 by transcription factor binding maybe causative of high levels of FGFR1 expression in bladder tumors.
Superficial low-grade bladder cancers have few genetic alterations (3). To recapitulate the increased levels of FGFR1 found in such tumors, we expressed FGFR1 in telomerase-immortalised normal human urothelial cells (39) using a retroviral expression system to establish mass populations of cells expressing physiological levels of receptor. High expression levels of tyrosine kinase receptors can lead to auto-activation, as described for ERBB2 (40). However this did not occur in our system and FGFR1 activation was ligand-dependent. Thus we propose that activation of upregulated FGFR1 observed in UC requires ligand. FGF1 and FGF2 levels are increased in the urine of patients with bladder cancer (41, 42), and increased FGF1 expression has been observed in UC, with strongest expression in high-grade tumors (43). Furthermore, FGF5 and FGF8 mRNA have been detected in bladder cancer cell lines (44), both of which can stimulate proliferation via FGFR1 (30).
Signaling downstream of FGFRs has been comprehensively studied and reviewed (31). In urothelial cells, ERK1/2 were phosphorylated in response to FGF2 treatment. Much attention has focused on the duration of ERK activation and its role in stimulating proliferation and differentiation (45). In PC12 cells, stimulation of ERK1/2 for several hours resulted in differentiation, while stimulation that resulted in a relatively short ERK1/2 activation resulted in proliferation. Interestingly, stimulation of FGFR1 in urothelial cells induced sustained activation of ERK1/2 but unlike previously described systems (46, 47) this promoted proliferation rather than differentiation. To determine if FGFR1-induced proliferation and survival were caused by ERK activation, we modulated the level of ERK activation by using either site-directed mutagenesis of FGFR1 or MEK1/2 inhibitors. We created a Y766F mutation in FGFR1, as phosphorylation at Y766 allows binding and activation of PLCγ. Inhibition of PLCγ activation was shown to reduce the level of MAPK activity in FGF-stimulated L6 myoblasts, indicating that PLCγ via PKC modifies the activity of the MAPK pathway (34). In addition, a previous report demonstrated that cells expressing FGFR1 lacking the PLCγ binding site still responded to FGF stimulation, although not as efficiently as cells expressing wild-type receptor (48). We also observed decreased MAPK activation and a reduced level of proliferation and survival in Y766F-expressing cells compared to wild-type receptor in response to FGF2. MEK inhibitors prevented FGF2-induced proliferation and survival in NHUC-FR1 and NHUC-Y766F, suggesting that PLCγ regulates these phenotypes via activation of the MAPK pathway. This demonstrates that changes in proliferation and survival were a result of ERK activation and that the level of ERK activation is important in regulating the level of response. The level of ERK activation also correlated with changes in downstream signaling proteins, which correlated with the phenotypic changes.
Next we sought to reduce levels of FGFR1 in bladder cancer cell lines using shRNA, to determine the role of FGFR1 in cells derived from invasive carcinoma. Intriguingly, the level of FGFR1 knockdown in JMSU1 was much less than that observed in other cell lines. As we have been able to efficiently knock down other proteins in JMSU1, we hypothesised that JMSU1 are dependent on FGFR1 for survival i.e. they show addiction to this oncogene (49) and our findings supported this. Interestingly, survival or proliferation of UMUC3, 253J and HT1197 was not dependent on FGFR1 signaling even though these cells express high levels of FGFR1 (data not shown). However UMUC3 also contain a KRAS2 mutation and HT1197 an NRAS mutation (50), which may activate similar signaling pathways to FGFR1 and hence reduce FGFR1-dependence. Even though UMUC3 has a KRAS2 mutation and only a low level of knockdown of FGFR1 was observed in JMSU1, both cell lines showed reduced anchorage independent growth, a phenotypic marker of transformation. UMUC3 knockdown cells showed decreased tumor volume in nude mice compared to controls. However, the low levels of knockdown of FGFR1 in expanded populations of JMSU1 might not have been sufficient to reduce tumor growth in vivo. A major problem in extrapolating results obtained in human bladder tumor cell lines to the situation in bladder tumors in patients is the lack of relevant in vivo models. Few UC cell lines are tumorigenic in immunocompromised mice and thus we have been unable to test the in vivo effects of FGFR1 adequately in other cell lines. It is not clear what the transient subcutaneous growth of 253J and HT1197 represents, but knockdown of FGFR1 had no effect on this phenotype.
A possible explanation for the differences observed between cell lines is suggested by recent work performed in a mouse prostate model system in which FGFR1 activation was regulated via an inducible dimerization system and led to step-wise progression to adenocarcinoma (17). Withdrawal of FGFR1 activation prior to the development of prostate cancer, reversed FGFR1-induced prostatic hyperplasia and reduced progression to adenocarcinoma but FGFR1-induced advanced prostate cancer became independent of the inducible system. However, endogenous FGFR1 activity was not inhibited in these experiments, leaving the possibility that endogenous activity compensated for the loss of dependence on the inducible system. Our results suggest that FGFR1-dependent growth may be altered or overcome during bladder tumor development and that invasive tumors may show different degrees of dependence on FGFR1 for growth and survival. This now requires more detailed analysis both in human cancers and in model systems where FGFR1 signaling can be monitored and regulated.
In conclusion, we have demonstrated that FGFR1 expression is increased in bladder cancer and that FGFR1 can drive proliferation and promote survival in normal bladder cells. Proliferation and survival are driven via the MAPK pathway and the level of ERK activation is directly related to the level of response. We have observed differential FGFR1-dependence in UC cell lines. Significantly, TERT-NHUC showed no dependence on FGFR1 for either proliferation or survival. This may allow non-toxic therapies targeted to multiple FGFRs to be developed for bladder tumors.
Acknowledgements
We thank Michael Seckl for advice regarding experimental design, Patricia Cooper for performing animal experiments and Beryl Cronin for histological analysis of tumor samples.
Financial support: Association for International Cancer Research (06-034); Cancer Research UK (C6228/A5437).
Footnotes
Potential conflicts of interest: None
References
- 1.Jemal A, Siegel R, Ward E, et al. Cancer statistics, 2008. CA Cancer J Clin. 2008;58:71–96. doi: 10.3322/CA.2007.0010. [DOI] [PubMed] [Google Scholar]
- 2.Cancer Research UK . UK Bladder Cancer Statistics. 2008. [Google Scholar]
- 3.Knowles MA. Molecular subtypes of bladder cancer: Jekyll and Hyde or chalk and cheese? Carcinogenesis. 2006;27:361–73. doi: 10.1093/carcin/bgi310. [DOI] [PubMed] [Google Scholar]
- 4.Wu XR. Urothelial tumorigenesis: a tale of divergent pathways. Nat Rev Cancer. 2005;5:713–25. doi: 10.1038/nrc1697. [DOI] [PubMed] [Google Scholar]
- 5.Sangar VK, Ragavan N, Matanhelia SS, Watson MW, Blades RA. The economic consequences of prostate and bladder cancer in the UK. BJU Int. 2005;95:59–63. doi: 10.1111/j.1464-410X.2005.05249.x. [DOI] [PubMed] [Google Scholar]
- 6.Cappellen D, De Oliveira C, Ricol D, et al. Frequent activating mutations of FGFR3 in human bladder and cervix carcinomas. Nat Genet. 1999;23:18–20. doi: 10.1038/12615. [DOI] [PubMed] [Google Scholar]
- 7.Billerey C, Chopin D, Aubriot-Lorton MH, et al. Frequent FGFR3 mutations in papillary non-invasive bladder (pTa) tumors. Am J Pathol. 2001;158:1955–9. doi: 10.1016/S0002-9440(10)64665-2. [DOI] [PMC free article] [PubMed] [Google Scholar]
- 8.van Rhijn BW, Lurkin I, Radvanyi F, Kirkels WJ, van der Kwast TH, Zwarthoff EC. The fibroblast growth factor receptor 3 (FGFR3) mutation is a strong indicator of superficial bladder cancer with low recurrence rate. Cancer Res. 2001;61:1265–8. [PubMed] [Google Scholar]
- 9.Tomlinson DC, Baldo O, Harnden P, Knowles MA. FGFR3 protein expression and its relationship to mutation status and prognostic variables in bladder cancer. J Pathol. 2007;213:91–8. doi: 10.1002/path.2207. [DOI] [PMC free article] [PubMed] [Google Scholar]
- 10.Bernard-Pierrot I, Brams A, Dunois-Larde C, et al. Oncogenic properties of the mutated forms of fibroblast growth factor receptor 3b. Carcinogenesis. 2006;27:740–7. doi: 10.1093/carcin/bgi290. [DOI] [PubMed] [Google Scholar]
- 11.Tomlinson DC, Hurst CD, Knowles MA. Knockdown by shRNA identifies S249C mutant FGFR3 as a potential therapeutic target in bladder cancer. Oncogene. 2007 doi: 10.1038/sj.onc.1210399. [DOI] [PMC free article] [PubMed] [Google Scholar]
- 12.Giri D, Ropiquet F, Ittmann M. Alterations in expression of basic fibroblast growth factor (FGF) 2 and its receptor FGFR-1 in human prostate cancer. Clin Cancer Res. 1999;5:1063–71. [PubMed] [Google Scholar]
- 13.Penault-Llorca F, Bertucci F, Adelaide J, et al. Expression of FGF and FGF receptor genes in human breast cancer. Int J Cancer. 1995;61:170–6. doi: 10.1002/ijc.2910610205. [DOI] [PubMed] [Google Scholar]
- 14.Cross NC, Reiter A. Tyrosine kinase fusion genes in chronic myeloproliferative diseases. Leukemia. 2002;16:1207–12. doi: 10.1038/sj.leu.2402556. [DOI] [PubMed] [Google Scholar]
- 15.Welm BE, Freeman KW, Chen M, Contreras A, Spencer DM, Rosen JM. Inducible dimerization of FGFR1: development of a mouse model to analyze progressive transformation of the mammary gland. J Cell Biol. 2002;157:703–14. doi: 10.1083/jcb.200107119. [DOI] [PMC free article] [PubMed] [Google Scholar]
- 16.Freeman KW, Welm BE, Gangula RD, et al. Inducible prostate intraepithelial neoplasia with reversible hyperplasia in conditional FGFR1-expressing mice. Cancer Res. 2003;63:8256–63. [PubMed] [Google Scholar]
- 17.Acevedo VD, Gangula RD, Freeman KW, et al. Inducible FGFR-1 activation leads to irreversible prostate adenocarcinoma and an epithelial-to-mesenchymal transition. Cancer Cell. 2007;12:559–71. doi: 10.1016/j.ccr.2007.11.004. [DOI] [PubMed] [Google Scholar]
- 18.Reis-Filho JS, Simpson PT, Turner NC, et al. FGFR1 emerges as a potential therapeutic target for lobular breast carcinomas. Clin Cancer Res. 2006;12:6652–62. doi: 10.1158/1078-0432.CCR-06-1164. [DOI] [PubMed] [Google Scholar]
- 19.Chen J, Lee BH, Williams IR, et al. FGFR3 as a therapeutic target of the small molecule inhibitor PKC412 in hematopoietic malignancies. Oncogene. 2005;24:8259–67. doi: 10.1038/sj.onc.1208989. [DOI] [PubMed] [Google Scholar]
- 20.Grand EK, Chase AJ, Heath C, Rahemtulla A, Cross NC. Targeting FGFR3 in multiple myeloma: inhibition of t(4;14)-positive cells by SU5402 and PD173074. Leukemia. 2004;18:962–6. doi: 10.1038/sj.leu.2403347. [DOI] [PubMed] [Google Scholar]
- 21.Trudel S, Li ZH, Wei E, et al. CHIR-258, a novel, multitargeted tyrosine kinase inhibitor for the potential treatment of t(4;14) multiple myeloma. Blood. 2005;105:2941–8. doi: 10.1182/blood-2004-10-3913. [DOI] [PubMed] [Google Scholar]
- 22.Trudel S, Stewart AK, Rom E, et al. The inhibitory anti-FGFR3 antibody, PRO-001 is cytotoxic to t(4;14) multiple myeloma cells. Blood. 2006 doi: 10.1182/blood-2005-10-4179. [DOI] [PubMed] [Google Scholar]
- 23.Tomlinson DC, L’Hote CG, Kennedy W, Pitt E, Knowles MA. Alternative splicing of fibroblast growth factor receptor 3 produces a secreted isoform that inhibits fibroblast growth factor-induced proliferation and is repressed in urothelial carcinoma cell lines. Cancer Res. 2005;65:10441–9. doi: 10.1158/0008-5472.CAN-05-1718. [DOI] [PubMed] [Google Scholar]
- 24.Diez de Medina SG, Chopin D, El Marjou A, et al. Decreased expression of keratinocyte growth factor receptor in a subset of human transitional cell bladder carcinomas. Oncogene. 1997;14:323–30. doi: 10.1038/sj.onc.1200830. [DOI] [PubMed] [Google Scholar]
- 25.Chaffer CL, Brennan JP, Slavin JL, Blick T, Thompson EW, Williams ED. Mesenchymal-to-epithelial transition facilitates bladder cancer metastasis: role of fibroblast growth factor receptor-2. Cancer Res. 2006;66:11271–8. doi: 10.1158/0008-5472.CAN-06-2044. [DOI] [PubMed] [Google Scholar]
- 26.Southgate J, Hutton KA, Thomas DF, Trejdosiewicz LK. Normal human urothelial cells in vitro: proliferation and induction of stratification. Lab Invest. 1994;71:583–94. [PubMed] [Google Scholar]
- 27.Voorhoeve PM, Agami R. The tumor-suppressive functions of the human INK4A locus. Cancer Cell. 2003;4:311–9. doi: 10.1016/s1535-6108(03)00223-x. [DOI] [PubMed] [Google Scholar]
- 28.Shnyder SD, Cooper PA, Millington NJ, Pettit GR, Bibby MC. Auristatin PYE, a novel synthetic derivative of dolastatin 10, is highly effective in human colon tumour models. Int J Oncol. 2007;31:353–60. [PubMed] [Google Scholar]
- 29.Powers CJ, McLeskey SW, Wellstein A. Fibroblast growth factors, their receptors and signaling. Endocr Relat Cancer. 2000;7:165–97. doi: 10.1677/erc.0.0070165. [DOI] [PubMed] [Google Scholar]
- 30.Zhang X, Ibrahimi OA, Olsen SK, Umemori H, Mohammadi M, Ornitz DM. Receptor specificity of the fibroblast growth factor family. The complete mammalian FGF family. J Biol Chem. 2006;281:15694–700. doi: 10.1074/jbc.M601252200. [DOI] [PMC free article] [PubMed] [Google Scholar]
- 31.Eswarakumar VP, Lax I, Schlessinger J. Cellular signaling by fibroblast growth factor receptors. Cytokine Growth Factor Rev. 2005;16:139–49. doi: 10.1016/j.cytogfr.2005.01.001. [DOI] [PubMed] [Google Scholar]
- 32.Klint P, Claesson-Welsh L. Signal transduction by fibroblast growth factor receptors. Front Biosci. 1999;4:D165–77. doi: 10.2741/klint. [DOI] [PubMed] [Google Scholar]
- 33.Kamakura S, Moriguchi T, Nishida E. Activation of the protein kinase ERK5/BMK1 by receptor tyrosine kinases. Identification and characterization of a signaling pathway to the nucleus. J Biol Chem. 1999;274:26563–71. doi: 10.1074/jbc.274.37.26563. [DOI] [PubMed] [Google Scholar]
- 34.Huang J, Mohammadi M, Rodrigues GA, Schlessinger J. Reduced activation of RAF-1 and MAP kinase by a fibroblast growth factor receptor mutant deficient in stimulation of phosphatidylinositol hydrolysis. J Biol Chem. 1995;270:5065–72. doi: 10.1074/jbc.270.10.5065. [DOI] [PubMed] [Google Scholar]
- 35.Simon R, Richter J, Wagner U, et al. High-throughput tissue microarray analysis of 3p25 (RAF1) and 8p12 (FGFR1) copy number alterations in urinary bladder cancer. Cancer Res. 2001;61:4514–9. [PubMed] [Google Scholar]
- 36.Veltman JA, Fridlyand J, Pejavar S, et al. Array-based comparative genomic hybridization for genome-wide screening of DNA copy number in bladder tumors. Cancer Res. 2003;63:2872–80. [PubMed] [Google Scholar]
- 37.Parakati R, DiMario JX. Dynamic transcriptional regulatory complexes, including E2F4, p107, p130, and Sp1, control fibroblast growth factor receptor 1 gene expression during myogenesis. J Biol Chem. 2005;280:21284–94. doi: 10.1074/jbc.M410744200. [DOI] [PubMed] [Google Scholar]
- 38.Seyed M, Dimario JX. Sp1 is required for transcriptional activation of the fibroblast growth factor receptor 1 gene in neonatal cardiomyocytes. Gene. 2007;400:150–7. doi: 10.1016/j.gene.2007.06.010. [DOI] [PubMed] [Google Scholar]
- 39.Chapman EJ, Hurst CD, Pitt E, Chambers P, Aveyard JS, Knowles MA. Expression of hTERT immortalises normal human urothelial cells without inactivation of the p16/Rb pathway. Oncogene. 2006;25:5037–45. doi: 10.1038/sj.onc.1209513. [DOI] [PubMed] [Google Scholar]
- 40.Carraway KL, 3rd, Sweeney C. EGF receptor activation by heterologous mechanisms. Cancer Cell. 2002;1:405–6. doi: 10.1016/s1535-6108(02)00076-4. [DOI] [PubMed] [Google Scholar]
- 41.Chodak GW, Hospelhorn V, Judge SM, Mayforth R, Koeppen H, Sasse J. Increased levels of fibroblast growth factor-like activity in urine from patients with bladder or kidney cancer. Cancer Res. 1988;48:2083–8. [PubMed] [Google Scholar]
- 42.O’Brien TS, Smith K, Cranston D, Fuggle S, Bicknell R, Harris AL. Urinary basic fibroblast growth factor in patients with bladder cancer and benign prostatic hypertrophy. Br J Urol. 1995;76:311–4. doi: 10.1111/j.1464-410x.1995.tb07706.x. [DOI] [PubMed] [Google Scholar]
- 43.Ravery V, Jouanneau J, Gil Diez S, et al. Immunohistochemical detection of acidic fibroblast growth factor in bladder transitional cell carcinoma. Urol Res. 1992;20:211–4. doi: 10.1007/BF00299719. [DOI] [PubMed] [Google Scholar]
- 44.Yoshimura K, Eto H, Miyake H, Hara I, Arakawa S, Kamidono S. Messenger ribonucleic acids for fibroblast growth factors and their receptor in bladder and renal cell carcinoma cell lines. Cancer Lett. 1996;103:91–7. doi: 10.1016/0304-3835(96)04198-5. [DOI] [PubMed] [Google Scholar]
- 45.Marshall CJ. Specificity of receptor tyrosine kinase signaling: transient versus sustained extracellular signal-regulated kinase activation. Cell. 1995;80:179–85. doi: 10.1016/0092-8674(95)90401-8. [DOI] [PubMed] [Google Scholar]
- 46.Dikic I, Schlessinger J, Lax I. PC12 cells overexpressing the insulin receptor undergo insulin-dependent neuronal differentiation. Curr Biol. 1994;4:702–8. doi: 10.1016/s0960-9822(00)00155-x. [DOI] [PubMed] [Google Scholar]
- 47.Traverse S, Seedorf K, Paterson H, Marshall CJ, Cohen P, Ullrich A. EGF triggers neuronal differentiation of PC12 cells that overexpress the EGF receptor. Curr Biol. 1994;4:694–701. doi: 10.1016/s0960-9822(00)00154-8. [DOI] [PubMed] [Google Scholar]
- 48.Klint P, Kanda S, Claesson-Welsh L. Shc and a novel 89-kDa component couple to the Grb2-Sos complex in fibroblast growth factor-2-stimulated cells. J Biol Chem. 1995;270:23337–44. doi: 10.1074/jbc.270.40.23337. [DOI] [PubMed] [Google Scholar]
- 49.Weinstein IB. Cancer. Addiction to oncogenes--the Achilles heal of cancer. Science. 2002;297:63–4. doi: 10.1126/science.1073096. [DOI] [PubMed] [Google Scholar]
- 50.Jebar AH, Hurst CD, Tomlinson DC, Johnston C, Taylor CF, Knowles MA. FGFR3 and Ras gene mutations are mutually exclusive genetic events in urothelial cell carcinoma. Oncogene. 2005;24:5218–25. doi: 10.1038/sj.onc.1208705. [DOI] [PubMed] [Google Scholar]