

Abstract
We describe a new approach to DNA hybridization assays using metal-enhanced fluorescence. Thiolated oligonucleotides were bound to silver particles on a glass substrate. Addition of a complementary fluorescein-labeled oligonucleotide resulted in a dramatic time-dependent 12-fold increase in fluorescence intensity during hybridization. Proximity to silver particles resulted in a decreased fluorescence lifetime. This effect is thought to be the result of enhanced fluorescence from fluorescein near metallic silver particles. Hybridization could thus be measured from the decay kinetics of the emission, which can be measured independently from the emission intensity. These results suggest the use of silver particles as a general approach to measure DNA hybridization as a method to increase the sensitivity of DNA detection.
Keywords: DNA hybridization, Metal-enhanced fluorescence, Silver nanoparticles
Detection of DNA hybridization is the basis of a wide range of biotechnology and diagnostic applications [1]. DNA hybridization is measured on gene chips [2,3], during PCR [4,5] and for fluorescence in situ hybridization [6], to name a few. In all these applications increased sensitivity is desirable, particularly for detection of a small number of copies of biohazard agents. Also, it would be valuable to have a general approach to detect the changes in fluorescence intensity upon hybridization. In general, the detectability of a fluorophore is determined by two factors, the extent of background emission from the sample and the photostability of the fluorophore. A highly photostable fluorophore undergoes about 106 excitation–relaxation cycles prior to photobleaching, yielding about 103–104 measured photons per fluorophore [7,8]. Background emission from the samples can easily overwhelm weak emission signals.
In the present report we describe a simple approach which should provide a readily measurable change in fluorescence intensity in many DNA hybridization formats. Additionally, our approach increases the intensity relative to the background and increases the number of detected photons per fluorophore molecule by a factor of 10-fold or more. This method is based on our recent studies of metal-enhanced fluorescence (MEF) which showed that proximity of fluorophores to metallic silver particles increases the brightness and photostability of many commonly used fluorophores [9–13]. We now show how this technology can be applied to DNA hybridization assays.
Materials and methods
Sample preparation
All oligonucleotides (Fig. 1) were obtained from the Biopolymer Core Facility at the University of Maryland, School of Medicine. Nanopure H2O (>18.0MΩ), purified using Millipore Milli-Q Gradient System, was used for all experiments. All other compounds were purchased from Sigma–Aldrich (St. Louis, MO) and used without additional purification.
Fig. 1.

Structures of DNA oligomers. The lower panel shows a schematic of the oligomers bound to silver particles.
The quartz slides used for silver deposition were first cleaned overnight by soaking in 10:1 (v/v) mixture of H2SO4 (95–98%) and H2O2 (30%). Use of this cleaning solution requires extreme caution to avoid organic materials. After washing with ultrapure water, the quartz surface was coated with amino groups by dipping the slides in a 1% aqueous solution of 3-aminopropyltriethoxysilane (APS) for 30 min at room temperature. The slides were washed extensively with water and air-dried. Silver island film (SIF) deposition was accomplished as described previously [10–13]. Briefly, ten drops of fresh 5% NaOH solution were added to a stirring silver nitrate solution (0.25 g in 35ml of water). One ml of ammonium hydroxide was added drop by drop to redissolve the dark-brown precipitate. The solution was cooled to 5 °C in an ice bath and a fresh solution of D-glucose (0.36 g in 10 ml of water) was added, followed by placing four pairs of APS-coated quartz slides into the solution. The mixture was stirred for 2 min in ice bath and then allowed to warm up to 30 °C for the next 5 min. As the color of the mixture turned from yellow–greenish to yellow–brown the color of the slides became greenish. The slides were removed from the beaker, rinsed with water, and bath sonicated for 1 min at room temperature. Only one side of each slide was coated with silver islands. All free amino groups remaining on the quartz surface were blocked with succinic anhydride placing them into the freshly prepared solution of 0.111 g succinic anhydride in 7ml of 1-methyl-2-pyrrolidone and 0.77 ml of 0.2M sodium borate buffer, pH 8. After 15 min incubation at room temperature slides were washed in three changes of water.
The quartz slides described above formed one side of a 0.2mm demountable cuvette (12.5mm×45mm; Starna Cells, Atascadero, CA). Monolayers of thiol-derivatized oligonucleotides deposited on silver islands were prepared by placing each slide in 3ml of 5 nM solution of ss DNA-SH in 5mM Hepes (pH 7.5), 0.1M KCl, and 0.25mM EDTA buffer in 1 cm2 cuvette for 48 h at 5 °C, followed by washing three times using the same buffer. The concentrations of thiol-derivatized oligonucleotides and the fluorescein-labeled oligonucleotide were determined using ε(260 nm)=225,000M−1 cm−1 for ss DNA-SH and ε(495 nm) = 76,000M−1 cm−1 for ss Fl-DNA (pH 9). To estimate the oligo surface coverage on silver island area we incubated one of the slides in 3ml of 5 nM solution of previously hybridized Fl-DNA-SH in above buffer. By measuring the decrease in emission of double-stranded Fl-DNA-SH in solution we calculated the surface coverage is about 0.36 pmol/cm2. We prepared a 18 nM solution of complementary oligonucleotide ss Fl-DNA in hybridization buffer (5mM Hepes (pH 7.5), 0.1M KCl, and 0.25mM EDTA). This 18nM concentration of ss Fl-DNA in 0.2mm cuvette could result in maximum surface coverage 0.36 pmol/cm2. For kinetic hybridization measurements we filled the 0.2mm demountable cuvette with 18nM solution of complementary oligomers.
Fluorescence measurements
Emission spectra from DNA-silver island layers were collected using front face geometry on a SLM 8000 spectrofluorometer with 470nm excitation from a Xenon lamp. For photostability measurements we used 514nm excitation from argon ion laser. Lifetimes were measured on 10GHz frequency-domain fluorometer [14] using mode-locked argon ion laser 514 nm, 76MHz repetition rate. The emission was selected with a combination of 520nm long pass liquid chromate filter ( , 0.3M, pH 8) and an interference filter centered at 540 nm. For frequency-domain measurements the excitation was vertically polarized and the emission was observed through a polarizer oriented at 54.7° from the vertical position. The FD intensity decays were analyzed in terms of the multi-exponential model
where τi are the lifetimes with amplitudes αi and Σ αi = 1.0. The contribution of each component to the steady-state intensity is given by
The amplitude-weighted lifetime is given by
The value of 〈τ〉 is proportional to the area under an intensity decay curve. If the αi values are not normalized, and the data are collected under identical conditions, then the value of 〈τ〉 should be proportional to the relative steady-state intensities.
Results
Description of studied system
Fig. 1 (top) shows the sequence and structure of the oligomers used in these experiments. The thiolated oligonucleotide ss DNA-SH was used as the capture sequence which bound spontaneously to the silver particles. The sample containing the silver-bound DNA was positioned in a fluorometer (Fig. 2, bottom) followed by addition of 18nM ss Fl-DNA, which is an amount approximately equal to the amount of silver-bound capture DNA.
Fig. 2.

Time-dependent hybridization of ss Fl-DNA to ss DNA-SH. The lower panel shows the sample configuration.
Emission intensity and spectra
The fluorescence intensity began to increase immediately upon mixing and leveled off after about 20 min (Fig. 2, top). We believe this increase in intensity is due to localization of ss Fl-DNA near the silver particles by hybridization with the capture oligomer (Fig. 1, bottom). Since metallic silver particles can increase the emission intensity of many fluorophores [10–13] this result suggests that localization of labeled oligomers near silver particles can be used in a wide range of hybridization assays. In control experiments we hybridized ss DNA-SH with ss Fl-DNA prior to deposition on silver particles. We found a similar 12-fold increase in intensity upon immobilization on silver as compared to an equivalent amount of ds Fl-DNA-SH in solution.
We examined the emission spectra of ss Fl-DNA before and after hybridization to form ds Fl-DNA-SH (Fig. 3). The fluorescence intensity was found to be 12-fold higher for the bound form.
Fig. 3.

Emission spectra of ss Fl-DNA in solution (dashed line) and bound (solid line) to silver particles. Roughly the same number of molecules of ss Fl-DNA and ds Fl-DNA-SH was in the illuminated area. The lower panel shows photographs of ss Fl-DNA in solution (top) and ds Fl-DNA-SH on SIFs (bottom).
This dramatic increase can be seen visually by the photographs in Fig. 3 bottom. There was no detectable shift in the emission spectra. The intensity increase was reversed by melting the DNA at 80 °C (Fig. 4) and increased once again upon cooling and presumed rehybridization. The intensity did not recover completely upon slow cooling, which may be due to loss of capture DNA from the silver surfaces.
Fig. 4.

Thermal melting of ds Fl-DNA-SH on a SIF near 80 °C and rehybridization of Fl-DNA-SH on SIFs.
Time-resolved study
It is well known that fluorescent intensities can change as a result of numerous factors such as the local polarity or presence of nearby quenching groups [15]. Typically the intensities and lifetimes change in the same direction, that is, both increased or decreased in unison. In contrast, for MEF, the lifetime decreases as the intensity increases [9,10]. This unusual effect is due to a change in the radiative decay rate of the fluorophores, which depends on the photonic mode density near the fluorophore [16,17]. Fig. 5 shows the frequency-domain intensity decays of the single-stranded fluorescein-labeled oligomer in solution and the double-stranded oligomer when bound to silver particles. The lifetime is dramatically shortened for the silver-bound oligomer, which strongly supports our conclusion that the intensity increase is due to localization of the fluorophore near the silver surfaces. In control experiments we found that emissions of fluorescein in the single- and double-stranded oligos were similar to within 10%. The double-stranded form displayed an approximate 10% smaller intensity. Hence the differences in intensity and lifetime between the solution and silver-bound forms are not due to effects of hybridization on the fluorescein probe. It is interesting to note that there is no detectable 4 ns component for the sample with silver particles, indicating that all the emission is due to the silver-bound DNA.
Fig. 5.

Intensity decays of ss Fl-DNA in solution and ds Fl-DNA-SH on SIFs measured in the frequency-domain (left) and reconstructed in the time-dependent decays (right).
Phase-modulation study of hybridization
The differences in lifetime of fluorescein between the solution and silver-bound form suggested an alternative approach to measuring hybridization. We used the frequency-domain instrument [14] to measure the emission phase angle and modulation. These values depend on the fluorescence lifetime and were thus expected to change upon hybridization. These measurements revealed a rapid decrease in phase angle and increase in modulation following addition of ss Fl-DNA to the silver-bound capture oligomer (Fig. 6). These changes are due to the decrease in lifetime upon binding to the capture oligomers on the silver particles. The changes in phase and modulation (Fig. 6) occur somewhat more rapidly than the change in intensity (Fig. 2). This difference occurs because the phase and modulation are intensity-weighted parameters [15]. It is important to note that phase angle and modulation measurements are mostly independent of total intensity, to within the limitations of the instrumentation and the extent of background fluorescence in the sample [18]. This is important because the extent of hybridization can be measured using optical components such as optical fibers where the intensity may vary, or in micro well plates where the well-to-well intensity may vary due to the plate or adsorbing species in the sample.
Fig. 6.

Phase angle (top) and modulation (bottom) of ss Fl-DNA upon hybridization to silver-bound ss DNA-SH. The light modulation frequency and detection frequency were 152.3MHz.
Photostability
It is known that proximity to silver particles can result in increased rates of excitation [19] as well as increased quantum yields. An increased rate of excitation may not be useful if the fluorophore photobleaches more rapidly. We examined the intensity of Fl-DNA-SH on the silver surfaces with continuous illumination (Fig. 7). As a comparison we examined a similar biotinylated oligomer bound to a silvered quartz slide using biotinylated bovine serum albumin and avidin [12]. We found that fluorescein in our samples deposited on silver particles photobleaches more slowly than when deposited on a protein monolayer. It should be noted that with the protein monolayer the Fl-DNA was uniformly deposited on entire silvered slide, that is, also between silver particles. The lifetimes measured for sample on protein monolayer contained a long, about 4 ns component [12]. This component indicates that there is some fluorescein bound to the glass surface between the silver particles. If the increased intensity was mostly due to an increased rate of excitation near silver particles then we expect slower photobleaching with the protein monolayers when there are regions without an increased rate of excitation.
Fig. 7.
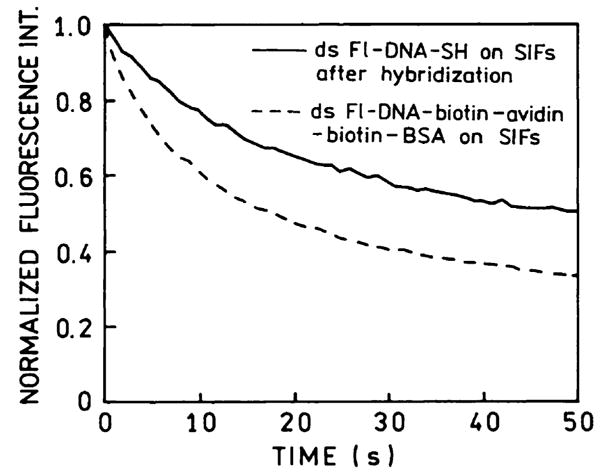
Photostability of ds Fl-DNA-SH bound to SIFs (solid line). For comparison we show the photostability of a similar biotinylated oligomer bound to a protein monolayer of BSA–biotin–avidin uniformly deposited on SIFs (dashed line). In this case some of Fl-DNA–biotin are distant from and not affected by the silver particles.
Discussion
In our opinion, metal-enhanced fluorescence is useful for a wide range of DNA analysis formats. A metal-bound oligomer could serve as a capture probe. A labeled oligomer could bind to both the capture DNA and the target sequence. Presence of the target sequence would bring the labeled oligomer closer to the silver and enhance its fluorescence. Alternatively, hybridization of the target and labeled oligomers could be performed in solution followed by hybridization to a capture oligomer bound to the silver particles. Depending upon the needed sensitivity the target DNA could be at its natural abundance or amplified with PCR. Silver is non-toxic and insensitive to thermal cycling. Silver may tarnish with long term storage, but fresh surfaces can be created by simple chemical treatments, or the surfaces may be coated to minimize reactions with air. It appears that the use of silver and metal-enhanced fluorescence can be rapidly introduced into DNA arrays, PCR, and similar technologies.
Acknowledgments
This work was supported by the NIH National Center for Research Resources, RR-08119, HG-002655, EB-000682, and EB-00981. The authors thank Dr. Zygmunt Gryczynski for taking photographs used in Fig. 3.
References
- 1.Morrison LE. Fluorescence in nucleic acid hybridization assays. In: Lakowicz JR, editor. Topics in Fluorescence Spectroscopy, vol. 7, DNA Technology. Kluwer Academic Publishers/Plenum Press; New York: 2003. pp. 69–103. [Google Scholar]
- 2.Brown PO, Botstein D. Exploring the new world of the genome with DNA microarrays. Nat Genet Suppl. 1999;21:33–37. doi: 10.1038/4462. [DOI] [PubMed] [Google Scholar]
- 3.Schena M, Heller RA, Theriault TP, Konrad K, Lachenmeier E, Davis RW. Microarrays: Biotechnology’s discovery platform for functional genomics. TIBTECH. 1998;16:301–306. doi: 10.1016/s0167-7799(98)01219-0. [DOI] [PubMed] [Google Scholar]
- 4.Komurian-Pradel F, Paranhos-Bacala G, Sodoyer M, Chevallier P, Mandrand B, Lotteau V, Andre P. Quantitation of HCV RNA using real-time PCR and fluorimetry. J Virol Methods. 2001;95:111–119. doi: 10.1016/s0166-0934(01)00300-7. [DOI] [PubMed] [Google Scholar]
- 5.Walker NJ. A technique whose time has come. Science. 2002;296:557–559. doi: 10.1126/science.296.5567.557. [DOI] [PubMed] [Google Scholar]
- 6.Difilippantonio MJ, Ried T. Technicolor genome analysis. In: Lakowicz JR, editor. Topics in Fluorescence Spectroscopy, vol. 7, DNA Technology. Kluwer Academic Publishers/Plenum Press; New York: 2003. pp. 291–316. [Google Scholar]
- 7.Soper SA, Nutter HL, Keller RA, Davis LM, Shera EB. The photophysical constants of several fluorescent dyes pertaining to ultrasensitive fluorescence spectroscopy. Photochem Photobiol. 1993;57:972–977. [Google Scholar]
- 8.Amrbose WP, Goodwin PM, Jett JH, Van Orden A, Werner JH, Keller RA. Single molecule fluorescence spectroscopy at ambient temperature. Chem Rev. 1999;99:2929–2956. doi: 10.1021/cr980132z. [DOI] [PubMed] [Google Scholar]
- 9.Lakowicz JR. Radiative decay engineering: biophysical and biomedical applications. Anal Biochem. 2001;298:1–24. doi: 10.1006/abio.2001.5377. [DOI] [PMC free article] [PubMed] [Google Scholar]
- 10.Lakowicz JR, Shen Y, D’Auria S, Malicka J, Gryczynski Z, Gryczynski I. Radiative decay engineering 2: effects of silver island films on fluorescence intensity lifetimes and resonance energy transfer. Anal Biochem. 2002;301:261–277. doi: 10.1006/abio.2001.5503. [DOI] [PMC free article] [PubMed] [Google Scholar]
- 11.Malicka J, Gryczynski I, Geddes CD, Lakowicz JR. Metal-enhanced emission from Indocyanine Green: a new approach to in-vivo imaging. J Biomed Opt. doi: 10.1117/1.1578643. in press. [DOI] [PMC free article] [PubMed] [Google Scholar]
- 12.Malicka J, Gryczynski I, Lakowicz JR. Enhanced emission of highly labeled DNA oligomers near silver metallic surfaces. Anal Chem. doi: 10.1021/ac020739m. in press. [DOI] [PMC free article] [PubMed] [Google Scholar]
- 13.Malicka J, Gryczynski I, Fang J, Lakowicz JR. Fluorescence spectral properties of cyanine dye-labeled DNA oligomers on surfaces coated with silver particles. Anal Biochem. doi: 10.1016/S0003-2697(03)00005-8. in press. [DOI] [PMC free article] [PubMed] [Google Scholar]
- 14.Laczko G, Gryczynski I, Gryczynski Z, Wiczk W, Malak H, Lakowicz JR. A 10-GHz frequency-domain fluorometer. Rev Sci Instrum. 1990;61:2331–2337. [Google Scholar]
- 15.Lakowicz JR. Principles of Fluorescence Spectroscopy. 2. Kluwer Academic Publishers/Plenum Press; New York: 1999. [Google Scholar]
- 16.Barnes WL. Topical review. Fluorescence near interfaces: the role of photonic mode density. J Mod Opt. 1998;45:661–699. [Google Scholar]
- 17.Worthing PT, Barnes WL. Spontaneous emission within metal-clad microcavities. J Opt A Pure Appl Opt. 1999;1:501–506. [Google Scholar]
- 18.Szmacinski H, Lakowicz JR. Lifetime-based sensing. In: Lakowicz JR, editor. Topics in Fluorescence Spectroscopy. Plenum Press; New York: 1994. pp. 295–334. [Google Scholar]
- 19.Kummerlen J, Leitner A, Brunner H, Aussenegg FR, Wokaun A. Enhanced dye fluorescence over silver island films: analysis of the distance dependence. Mol Phys. 1993;80:1031–1046. [Google Scholar]