

Abstract
Surface plasmon-coupled emission (SPCE) is the directional radiation of light into a substrate due to excited fluorophores above a thin metal film. To date, SPCE has only been observed with visible wavelengths using silver or gold films. We now show that SPCE can be observed in the ultraviolet region of the spectrum using thin (20 nm) aluminum films. We observed directional emission in a quartz substrate from the DNA base analogue 2-aminopurine (2-AP). The SPCE radiation occurs within a narrow angle at 59° from the normal to the hemicylindrical prism. The excitation conditions precluded the creation of surface plasmons by the incident light. The directional emission at 59° is almost completely p-polarized, consistent with its origin from surface plasmons due to coupling of excited 2-AP with the aluminum. The emission spectra and lifetimes of the SPCE are those characteristic of 2-AP. Different emission wavelengths radiate at slightly different angles on the prism providing intrinsic spectral resolution from the aluminum film. These results indicate that SPCE can be used with numerous UV-absorbing fluorophores, suggesting biochemical applications with simultaneous surface plasmon resonance and SPCE binding assays.
Surface plasmon resonance (SPR) is widely used for detection of bioaffinity reactions on surfaces.1–3 Surface plasmons are oscillating electrical charges on a metallic surface. When a thin metal film is illuminated through a glass prism, and the angle of incidence is appropriate, the surface plasmons in resonance with the incident light occur at the metal–air or water interface. This results in strong absorption, which is measured as a decrease of reflectivity. The SPR angle is sensitive to the refractive index of the sample above the metal, distal from the glass prism. The origin of this sensitivity is the evanescent field from the plasmons, which penetrates approximately λ/3 into the sample.
In several recent reports we described a related phenomenon, surface plasmon-coupled emission (SPCE).4,5 We found that excited fluorophores near a thin metal surface can couple with the surface plasmons, resulting in directional radiation into the glass substrate. The spectral properties of the radiation were found to be essentially identical to those of the fluorophore, except for a highly p-polarized emission, too large to be due to optical photoselection. The angular dependence of the radiation, as well as the p-polarization, are consistent with radiating surface plasmons, the reverse process of surface plasmon absorption.
Our previous studies of SPCE used thin silver5–7 or gold8 surfaces. This choice of metals restricts the selection of fluorophores to those absorbing and emitting at visible or longer wavelengths. However, many widely used fluorophores absorb or emit at ultraviolet wavelengths. We now report that SPCE at UV wavelengths can be observed using thin aluminum films, enabling the use of SPCE with a wide variety of fluorophores and surface affinity reactions.
MATERIALS AND METHODS
Sample Preparation
Quartz slides were coated by vapor deposition by EMF Corp. (Ithaca, NY). A 20-nm-thick layer of aluminum was deposited on the quartz followed by a 10-nm SiO2 protective layer (Scheme 1). Fluorophores were deposited on the surface by spin coating at 3000 rpm 1% solution of low molecular weight poly(vinyl alcohol) (PVA, MW. 13 000–23 000; Aldrich) in water. The PVA solutions contained 2-aminopurine (2-AP; 1.2 × 10⁻³ M) from Aldrich. The reference slide for the control experiment was prepared from identical 1% PVA solution without 2-aminopurine.
Scheme 1.
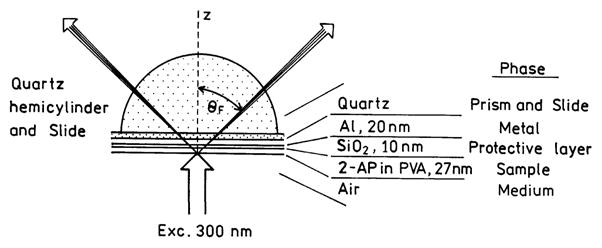
Reverse Kretschmann Sample Configuration for SPCE Using a Thin Aluminum Film
Reflectance Calculations
The reflectance profiles of the thin film were calculated with TFCalc. 3.5 software (Software Spectra, Inc., Portland, OR). The thicknesses of the samples were estimated by comparing the measured SPCE with the calculated reflectance for the emission wavelength.
Fluorescence Measurements
The spin-coated slides were attached to a hemicylindrical prism made of quartz using non-fluorescent index matching fluid (mixture of propylene glycol n = 1.43 and acetophenone n = 1.53). This combined sample was positioned on a precise rotary stage, which allows excitation and observation at any desired angle relative to the vertical axis around the cylinder.5 For excitation we used the reverse Kretschmann (RK) configuration (Scheme 1). In this configuration, the sample was excited from the air or sample side, which has a refractive index lower than the prism. In this case, it is not possible to excite surface plasmons with the incident light. The angle of incidence does not matter, but we used normal incidence.
Observation of the angular distribution of the emission was performed with a 3-mm-diameter UV-transmitting fiber, covered with a 500-μm vertical slit, positioned ~15 cm from the sample. This corresponds to an acceptance angle below 0.2°. The output of fiber was directed to 8000 SLM spectrofluorometer or 10-GHz frequency domain fluorometer.9
For excitation, we used the second harmonic (300 nm) from a Rhodamine 6G dye laser. Dye laser was pumped by a mode-locked argon ion laser, 76-MHz repetition rate, 120-ps half-width, and cavity dumped at 3.8-MHz repetition rate. Scattered light at 300 nm was suppressed by observation through a cutoff 320-nm-long wave pass filter supported for intensity and lifetime measurements with a 370-nm interference filter.
The multifrequency phase and modulation data were analyzed in terms of the multiexponential model
| (1) |
where τi are the lifetimes with amplitudes αi and Σαi= 1.0. The parameters αi and τi were determined by nonlinear least squares, as described previously.10 The multiexponential model is used to describe the form of the intensity decay. We are not assigning molecular significance to the recovered parameters. The contribution of each component to the steady-state intensity is given by
| (2) |
The mean decay time is given by
| (3) |
The amplitude-weighted lifetime is given by
| (4) |
THEORY
SPCE is closely related to SPR. The angular distribution of the radiated light in the prism is determined by the same wavevector matching conditions as for SPR. For this reason, the theory for SPR can be used to describe the angular distribution of SPCE. The physics of surface plasmons has been described in detail.11–13 Surface plasmons are excited when a metal surface is illuminated under specific conditions that allow wavevector matching at the sample–metal interface. Surface plasmons cannot be excited from air by incident light. SPR occurs when light is incident on a metal through a higher refractive index medium such as glass. The surface plasmons are only excited at a specific angle of incident (θSP) where the reflectivity decreases. At other angles of incidence (θI), the reflectivity of the metal is high.
The wavevector of the incident light in the prism is given by kp = 2π/λ= npk0, where λ is the wavelength in the prism, np is the refractive index of the prism, and k0 is the wavevector in a vacuum or air. The in-plane x-component of the wavevector is given by
| (5) |
where θI is measured from the normal axis. SPR occurs when
| (6) |
where kSP is the wavevector for the surface plasmons at the metal–sample interface. Calculation of the surface plasmon wavevector is somewhat complex. For a metal, the dielectric constant is usually an imaginary number
| (7) |
where i = −11/2 and the subscripts indicate the real (r) and imaginary (im) components. These constants are wavelength (frequency) dependent. Because the real part of εm is larger than the imaginary part, the surface plasmon wavevector can usually be approximated by
| (8) |
where εs is the effective dielectric constant of the sample near the silver surface. SPR only occurs for p-polarized incident light.
SPCE is similar to SPR in reverse. Instead of illumination through a prism, the metal film feels near-field interactions with an excited fluorophore, resulting in creation of surface plasmons. These plasmons then radiate into the glass substrate at the surface plasmon angle for the emission wavelength (θF in Scheme 1). The plasmons radiate at the plasmon angle because this is needed to match the wavevectors. The plasmons cannot radiate into the sample because the wavevectors cannot be matched. The angle θSP depends on wavelength because kx and the optical properties of the metal depend on wavelength. Free-space (FS) emission of the fluorophore can also occur.
The dependence of SPR on the refractive index of the sample is due to the evanescent field from the plasmons which penetrates into the sample and decays exponentially away from the metal surface.14 Based on the analogy between SPR and SPCE, we expect fluorophore coupling to the metal to also depend on the depth of the evanescent field. For SPR, the electrical field decays exponentially as
| (9) |
where E0 is the field strength at z = 0 and kz−1 is the penetration depth into the sample. The values of kz can be calculated using
| (10) |
where ω is the frequency of the incident light.
RESULTS
As shown in previous reports,4–7 the occurrence and angular distribution of SPCE can be predicted from the reflectivity curves of the thin silver and gold films. Knowing of the widespread use of UV fluorophores, we considered the use of different films of different metals. Aluminum was an obvious choice given the high reflectivity of aluminum mirrors at short wavelengths. An additional advantage of aluminum is that on exposure to air it forms a thin oxide film with a uniform self-limiting thickness. In our case, the aluminum film was coated with SiO2. The use of aluminum with fluorescence was not obvious because of earlier reports of strong quenching on aluminum surfaces.15 However, several reports described the transmission of ultraviolet light by thin aluminum films as seen by excitation of fluorescence with total internal reflection,16 attenuated total internal reflection,17 or light scattering.18 Additionally, aluminum has been suggested for use in SPR,19 and calculations of the spatial distribution have been reported for fluorophores near an aluminum surface.20 However, we are not aware of any experimental reports of SPR or SPCE using aluminum films.
Based on the absence of UV absorption by aluminum, we decided to calculate the reflectivity curves for thin aluminum films on quartz. These calculations were performed using commercial software (TFCalc) or our own equivalent programs. Reflectivity curves are shown in Figure 1 for various thicknesses of aluminum. These curves were calculated using the dielectric constant for aluminum at 370 nm. These results show that the deepest reflectivity minimum is for an aluminum thickness of 20 nm, which is the thickness we chose for our coated slides.
Figure 1.
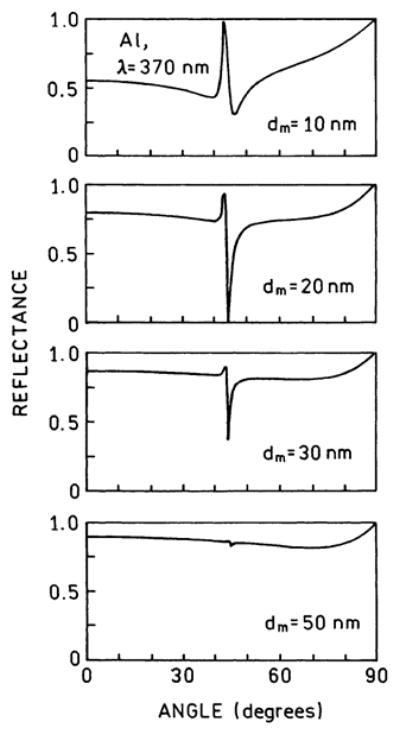
Calculated reflectivity at 370 nm for a three-phase system of quartz–aluminum–air, for different thicknesses of aluminum. For 370 nm, we used εm = −17.02 + i2.95.
We were aware of aluminum oxidation, which can change an effective thickness of the metal layer. In the vapor deposition procedure, the slides were protected with a 100-Å SiO2 layer, twice as thick as we used previously for silver mirrors.5–7 The second reason for using thicker protection layer is to avoid the well-known quenching effect of aluminum.15,20,21
Because of earlier reports of quenching on aluminum surfaces, we first examined the free-space emission of spin-coated samples on quartz and an aluminum-coated quartz (Figure 2). Emission spectra were recorded for illumination and observation from the same side of the sample. Hence, plasmons were not created by the incident light and the emission of 2-AP was the free-space (FC) emission mostly uninfluenced by the metal. The emission spectrum of the spin-coated sample on quartz or aluminum was essentially the same as the spectrum observed for 2-AP in water in a square cuvette. This result is not in conflict with the reports of quenching on aluminum because our sample was distal from the metal surface by 100 Å and SPCE is thought to occur for distances up to 200 nm. Quenching probably occurs at shorter distances. The background emission from a reference slide without 2-AP (Figure 2, dotted line) is significantly lower than the observed 2-AP emission.
Figure 2.
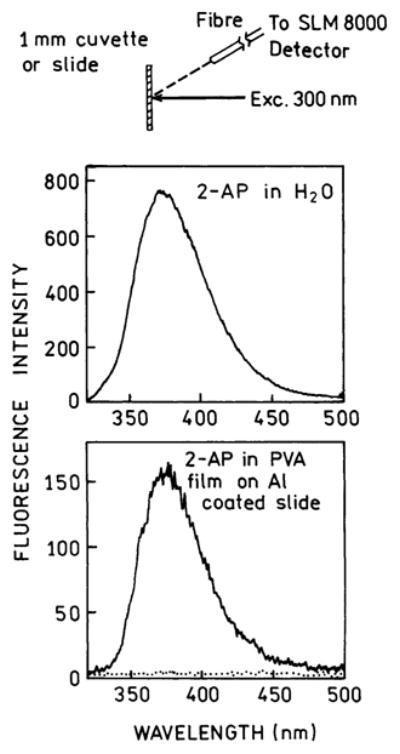
Front face emission spectra of 2-AP in water (top) and spin-coated from 1% PVA on a 20-nm aluminum film (bottom). The spectrum of 2-AP in water (top) is identical to the spectrum measured in square geometry using a 1-cm square cuvette. The spectrum of 2-AP in PVA film on Al mirror is similar to the spectrum of 2-AP spin-coated from 1% PVA on unmetallized quartz slide. The dotted line is the background emission from the reference slide without 2-AP.
The presence of a sharp reflectivity minimum for 20-nm aluminum (Figure 1) suggested the presence of SPCE at the plasmon angle for the emission wavelength. The angle-dependent intensities are shown in Figure 3. The emission was found to be sharply distributed around ±59° from the normal axis. We were unable to measure the intensities for all angles on the sample side of the metal, but it appears that roughly 30% of the total emission from 2-AP appears as SPCE. This percentage does not represent the maximum coupling efficiency but is the result found with our particular thicknesses of aluminum, SiO2, and PVA.
Figure 3.
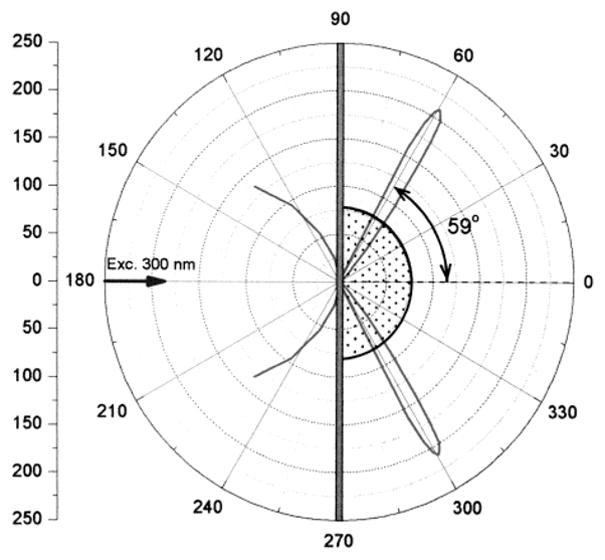
Angle-dependent emission intensity of 2-AP at 370 nm with reverse Kretschmann excitation.
Next, we stored the samples in a dry environment at room temperature and measured SPCE once again next day. The measurement was highly reproducible in both angular distribution and intensity. Later, we washed out the PVA from the slide and spin-coated once again with 1% PVA solution doped with 2-AP as described in Materials and Methods. We repeated the SPCE measurements, and we were pleasantly surprised that the aluminum-coated slide with SiO2 protection can be reused. We were not able to reuse the silvered slides with 50-Å SiO2 protection. We concluded that there is no significant damage to the aluminum layer when protected with 100-Å SiO2 coating.
Emission spectra of the SPCE are shown in Figure 4. Emission was only observed when the emission polarizer was in the p-orientation, meaning parallel to the plane of observation. The signal was over 20-fold less for an s-oriented polarizer. The high p-polarization of the signal proves its origin with surface plasmons and not free-space emission of 2-AP.
Figure 4.
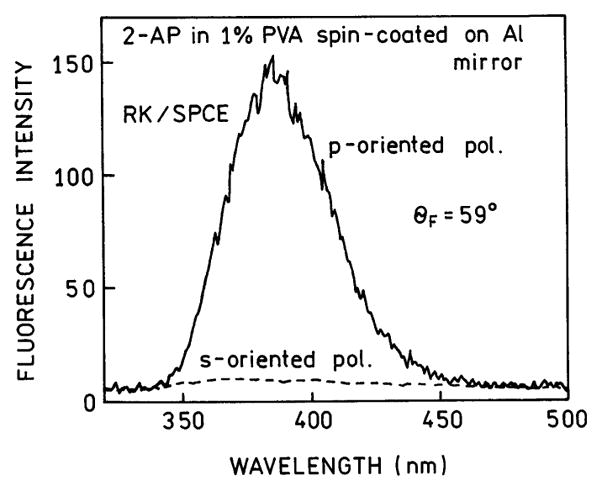
Emission spectra of the SPCE from 2-AP with reverse Kretschmann excitation. The polarizer (pol.) orientation refers to the emission polarizer.
Examination of Scheme 1 shows that there is symmetry about the axis normal to the metal surface. There is no reason for the SPCE to occur in a plane, but rather should appear as a cone with equal intensities at all azimuthal angles around the normal axis. Because of the large angle θF it is difficult to capture the emission from the entire cone. We were able to capture and image the SPCE using a parabolic reflector (Figure 5). The cone of emission collected using the parabolic reflectance is seen in the lower panel. The angular distribution appears to be narrow, but this is in part due to the reflector, which is focusing this distribution. These images show that a relatively simple optical configurations can be used to capture a large fraction of the total emission.
Figure 5.

Parabolic reflector used to capture SPCE (top) and the cone of emission for 2-AP observed using the reflector (bottom).
While we observed directional emission from 2-AP on aluminum, the 59° maximum angle was ~16° larger than that calculated for 20-nm aluminum on glass, which was ~43° (Figure 1). This difference is a result of the presence of two dielectric layers, a protective 10 nm of SiO2 and the PVA doped with 2-AP. Hence, we repeated the reflectivity calculations using the five-phase system shown in Scheme 1, with an assumed PVA thickness of ds = 26.3 nm. In this case, the reflectivity minimum for p-polarized incident light was at 59° (Figure 6), in precise agreement with the observed value. An s-polarized incident light did not show a calculated reflectivity minimum.
Figure 6.
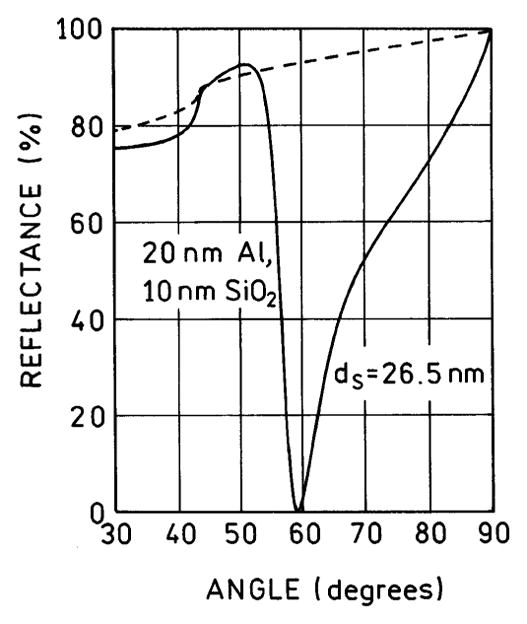
Calculated reflectivity at 370 nm for the five-phase system shown in Scheme 1.
It is known that the angle of minimum reflectivity of silver and gold films depends on the incident wavelength.22 As a result, different wavelengths radiate at slightly different angles in the prism.5 Figure 7 shows the free-space emission spectra of 2-AP (top) and the emission spectra for different observation angles in the prism (bottom). The spectra are blue shifted at larger angles (62°) and red shifted at smaller angles (56°) compared to the central angle of 59°. This shift is not due to different local environments of 2-AP but rather to the intrinsic wavelength dispersion of SPCE.
Figure 7.
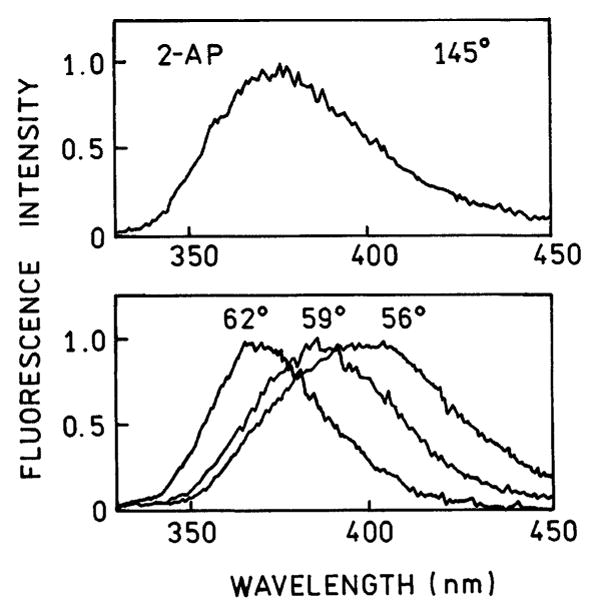
Surface plasmon-coupled emission spectra of 2-AP recorded at different observation angles θF. The angles are defined on the figures.
In earlier studies of fluorophores near metallic particles,23,24 we found decreases in lifetimes as compared to fluorophores distant from the particles. Hence, we examined the lifetime for 2-AP (Figure 8). The amplitude-weighted lifetime for the free-space emission was found to be 0.53 ns (top). The amplitude-weighted lifetime for SPCE was found to be 0.43 ns (bottom). In both cases, the lifetimes were multiexponential (Table 1). Compared to the dramatic reduction in lifetime near metallic particles,23,24 the effect of the aluminum film is minimal. At this time we do not fully understand how the surface plasmons and fluorophores interact to determine the SPCE intensity decay.
Figure 8.
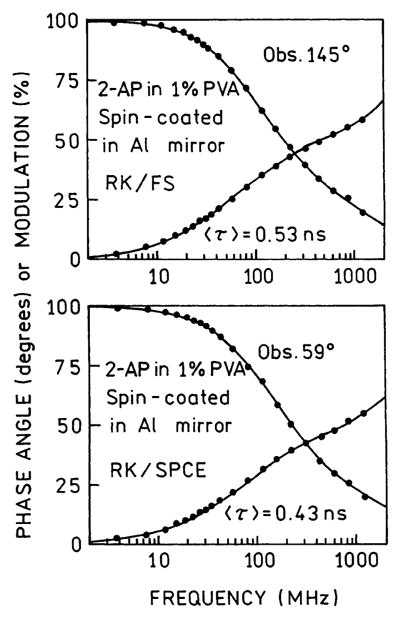
Frequency-domain intensity decays of 2-AP with RK excitation. Top, FS. Bottom, SPCE.
Table 1.
Multiexponential Intensity Decay Parameters for 2-AP in PVA on the Aluminum Film
| measurement | αi | fi | τi (ns) | τ̄ (ns) | 〈τ〉 (ns) |
|---|---|---|---|---|---|
| FS | 0.69 | 0.15 | 0.12 | 1.84 | 0.53 |
| 0.25 | 0.41 | 0.87 | |||
| 0.06 | 0.44 | 3.33 | |||
| SPCE | 0.74 | 0.20 | 0.12 | 1.65 | 0.44 |
| 0.22 | 0.47 | 0.93 | |||
| 0.04 | 0.33 | 3.60 |
It is of interest to consider the range of distances over which fluorophores couple with surface plasmons. This distance is likely to be related to the depth of the surface plasmon evanescent field in the sample. Hence, we calculated the penetration depths for gold, silver, and aluminum for several wavelengths (Table 2). These calculations show similar penetration depth in water for all three metals. The penetration depths of the evanescent waves are similar in PVA. Additionally, the optical properties of aluminum suggest that SPR and SPCE can occur down to 280 nm. This result suggests that SPR and SPCE will be possible using the intrinsic tryptophan fluorescence from proteins.
Table 2.
Penetration Depth of the Surface Plasmon Evanescent Field into the Sample
| metal | wavelength (nm) | εma | kz−1 (nm) metal/water |
|---|---|---|---|
| gold | 600 | −8.37 + i 1.16 | 139 |
| silver | 600 | −14.60 + i 0.45 | 193 |
| aluminum | 600 | −42.30 + i 14.32 | 344 |
| aluminum | 370 | −17.02 + i 2.95 | 131 |
| aluminum | 300 | −11.03 + i 1.67 | 82 |
| aluminum | 280 | −9.55 + i 1.37 | 70 |
Interpolated values from TF Calc.
DISCUSSION
The measurements reported in this article are in a good agreement with the existing theory of SPR and the angle θF of the directional SPCE can be reliably predicted. The aluminized slides protected with the 100-Å SiO2 layer are surprisingly stable and can be reused after washing. The wavelength resolution demonstrated in Figure 7 can be potentially used in construction of miniaturized SPCE based spectrofluorometer.
The observation of ultraviolet SPCE with aluminum suggests numerous applications in biochemistry, biotechnology, and medical testing. UV fluorophores are routinely used to label proteins and membranes. Examples include diphenylhexatriene and its derivatives, pyrenes, dansyl, and anilinonaphthalene-type fluorophores. Based on the results using 2-AP, such fluorophores should also display SPCE. Additionally, the optical properties of aluminum suggest SPCE will also be useful with intrinsic protein fluorescence.
Medical assays and biotechnology applications such as drug discovery frequently utilize surface-localized chemistry. Our results with aluminum indicate that the range of wavelengths can be extended down to the ultraviolet. This will provide a wide range of wavelengths for development of multianalyte assays using different color fluorophores. In summary, we believe SPCE will soon become a widely used technology in biomedical research and health care.
Acknowledgments
This work was supported by the National Institute of Biomedical Imaging and Bioengineering, EB-00682, and Philip Morris USA, Inc., with partial support from the National Center for Research Resources, RR-08119.
References
- 1.Salamon Z, Macleod HA, Tollin G. Biochim Biophys Acta. 1997;1331:131–152. doi: 10.1016/s0304-4157(97)00003-8. [DOI] [PubMed] [Google Scholar]
- 2.Melendez J, Carr R, Bartholomew DU, Kukanskis K, Elkind J, Yee S, Furlong C, Woodbury R. Sens Actuators, B. 1996;35–36:212–216. [Google Scholar]
- 3.Liedberg B, Lundstrom I. Sens Actuators, B. 1993;11:63–72. [Google Scholar]
- 4.Lakowicz JR. Anal Biochem. 2004;324:153–169. doi: 10.1016/j.ab.2003.09.039. [DOI] [PMC free article] [PubMed] [Google Scholar]
- 5.Gryczynski I, Malicka J, Gryczynski Z, Lakowicz JR. Anal Biochem. 2004;324:170–182. doi: 10.1016/j.ab.2003.09.036. [DOI] [PMC free article] [PubMed] [Google Scholar]
- 6.Matveeva E, Malicka J, Gryczynski I, Gryczynski Z, Lakowicz JR. Biochem Biophys Res Commun. 2004;313:721–726. doi: 10.1016/j.bbrc.2003.12.010. [DOI] [PMC free article] [PubMed] [Google Scholar]
- 7.Lakowicz JR, Malicka J, Gryczynski I, Gryczynski Z. Biochem Biophys Res Commun. 2003;307:435–439. doi: 10.1016/S0006-291X(03)01214-2. [DOI] [PMC free article] [PubMed] [Google Scholar]
- 8.Gryczynski I, Malicka J, Gryczynski Z, Lakowicz JR. J Phys Chem B. submitted for publication. [Google Scholar]
- 9.Laczko G, Lakowicz JR, Gryczynski I, Gryczynski Z, Malak K. Rev Sci Instrum. 1990;61:233–2337. [Google Scholar]
- 10.Lakowicz JR, Laczko G, Cherek H, Gratton E, Limkeman M. Biophys J. 1984;46:463–477. doi: 10.1016/S0006-3495(84)84043-6. [DOI] [PMC free article] [PubMed] [Google Scholar]
- 11.Zayats AV, Smolyaninov II. J Opt A: Pure Appt Opt. 2003;5:516–550. [Google Scholar]
- 12.Raether H. Surface plasma oscillations and their applications. In: Hass G, Francombe MH, Hoffman RW, editors. Physics of Thin Films, Advances in Research and Development. Vol. 9. Academic Press; New York: 1977. pp. 145–261. [Google Scholar]
- 13.Raether H. Surface Plasmons on Smooth and Rough Surfaces and on Gratings. Springer-Verlag; New York: 1988. p. 136. [Google Scholar]
- 14.Hanken DG, Jordan CE, Frey BL, Corn RM. Electroanalytical Chemistry: A Series of Advances. Vol. 20. Marcel Dekker; New York: 1998. Surface plasmon resonance measurements of ultrathin organic films at electrode surfaces; pp. 141–225. [Google Scholar]
- 15.Weitz DA, Garoff S, Gersten JI, Nitzan A. J Chem Phys. 1983;78(9):5324–5338. [Google Scholar]
- 16.Yokota H, Saito K, Yanagida T. Phys Rev Lett. 1998;80(20):4606–4609. [Google Scholar]
- 17.Zerulla D, Isfort G, Kolbach M, Otto A, Schierbaum K. Electrochim Acta. 2003;48:2943–2947. [Google Scholar]
- 18.Kume T, Hayashi S, Yamamoto K. Mater Sci, Eng. 1996;A217/218:171–175. [Google Scholar]
- 19.de Bruijn HE, Kooyman RPH, Greve J. Appl Opt. 1992;31(4):440–442. doi: 10.1364/AO.31.0440_1. [DOI] [PubMed] [Google Scholar]
- 20.Axelrod D, Hellen EH, Fulbright RM. Total internal reflection fluorescence. In: Lakowicz JR, editor. Topics in Fluorescence Spectroscopy: Biochemical Applications. Vol. 3. Plenum Press; New York: 1992. pp. 289–343. [Google Scholar]
- 21.Ford GW, Weber WH. Electromagnetic Interaction of Molecules with Metal Surfaces. Vol. 113. North-Holland Physics Publishing; Amsterdam: 1984. pp. 195–287. [Google Scholar]
- 22.Natan MJ, Lyon LA. Surface plasmon resonance biosensing with colloidal Au amplification. In: Feldheim DL, Foss CA Jr, editors. Metal Nanoparticles: Synthesis, Characterization, and Applications. Marcell Dekker; New York: 2002. pp. 183–205. [Google Scholar]
- 23.Lakowicz JR, Shen Y, D’Auria S, Malicka J, Gryczynski Z, Gryczynski I. Anal Biochem. 2002;301:261–277. doi: 10.1006/abio.2001.5503. [DOI] [PMC free article] [PubMed] [Google Scholar]
- 24.Malicka J, Gryczynski I, Fang J, Lakowicz JR. Anal Biochem. 2003;317:136–146. doi: 10.1016/S0003-2697(03)00005-8. [DOI] [PMC free article] [PubMed] [Google Scholar]