

Abstract
The detection of submonolayers of proteins based on native fluorescence is a potentially valuable approach for label-free detection. We have examined the possibility of using silver nanostructures to increase the emission of tryptophan residues in proteins. Fluorescence spectra, intensities, and lifetimes of multilayers and submonolayers of proteins deposited on the surfaces of silver island films were measured. Increased fluorescence intensities from two- to three-fold and similar decreases in lifetimes were observed in the presence of the silver nanoparticles compared with the proteins on the surface of the bare quartz. The observed spectral effects of silver nanoparticles on tryptophan fluorescence indicates the possibility for the design of analytical tools for the detection of proteins without traditional labeling by extrinsic fluorophores.
Keywords: Metal-enhanced fluorescence, Intrinsic fluorescence of proteins, Localized surface plasmon resonance, Label-free detection
Fluorescence detection is a central technology in clinical chemistry, drug discovery, proteomics, genomics, and cell biology. Almost without exception, detection is accomplished using extrinsic fluorophores that are used to label the biomolecules. The need for labeling of the biomolecules with extrinsic fluorophores results in increased costs and complexity. Because of this added complexity, there is a rapidly growing interest in methods that provide label-free detection. A wide variety of surface-based methods are being tested for label-free detection of binding. These methods include surface plasmon resonance (SPR)1 [1,2], surface-enhanced Raman scattering [3,4], electrochemical approaches [5,6], nanowires [7], optical microcavities [8], optical transmission [9,10], reflectivity [11], interferometry [12], and photonic crystals [13]. The most widely used label-free detection method is SPR, which is being extended to high-throughput capabilities by the use of imaging modality [14–16]. The sensing mechanism of SPR is based on high-sensitivity of reflected light at a specific SPR angle. The system uses a thin continuous metal film (~ 40–50 nm) of gold or silver to which molecules bind or dissociate, causing detectable changes in the refractive index in the interface between metallic film and bulk solution. The quantitative interpretation of SPR signal to adsorbed biomolecules and estimated detection sensitivity of approximately 1 to 10 pg/mm2 have been described elsewhere [17,18]. Another approach for construction of label-free detection has exploited the localized surface plasmon resonance (LSPR) of metallic nanostructures. Transmission surface plasmon resonance (T-SPR) was introduced for measurement changes in extinction peak of plasmon spectra of discontinuous gold films in the visible and near-infrared wavelength range [19]. Wavelength shifts of extinction spectra of metallic nanoparticles on dielectric substrates and nanoholes in gold film have also been demonstrated for optical biosensors [20,21].
In this report, we describe the use of intrinsic fluorescence of proteins for detection of binding reactions on surfaces. Proteins possess three intrinsic fluorophores: phenylalanine, tyrosine, and tryptophan. The emission from proteins is dominated by tryptophan because of its longer excitation and emission wavelengths, good quantum yield, and fluorescence resonance energy transfer (FRET) from tyrosine to the tryptophan residues [22]. On average, tryptophan is present at 1.3% of the amino acid residues, resulting in many proteins containing multiple tryptophan residues. For example, a typical protein with a molecular weight of 50 kDa will contain approximately 400 amino acid residues and, thus, an average of 5.2 tryptophan residues. The abundance of tryptophan residues in proteins is both an advantage and a disadvantage for fluorescence label-free detection. The abundance is an advantage because most target proteins will contain this intrinsic label and is a disadvantage because all of the other proteins in the sample will also contain tryptophan and be fluorescent. For this reason, tryptophan fluorescence has not been used in analytical applications. However, there have been several recent reports on using ultraviolet (UV) fluorescence for detection and quantification of protein interactions [23–27]. Relatively high detection sensitivities were reported using frequency tripled output of Ti:sapphire lasers, 1 to 5 ng per spot on two-dimensional gel electrophoresis for several proteins [23], and better than 10 pM of antibody BP53-12 bound to immobilized p53 on nitrocellulose membrane [26].
We believe that recent progress in metal-enhanced fluorescence (MEF) can be used for high-sensitivity detection of target proteins in samples that contain other tryptophan-containing proteins. The MEF approach is based on short-range interactions of fluorophores with metallic nanostructures that, depending on the metal geometry, occur at distances from 5 to 100 nm. The emission can be modified by the presence of a nearby metal nanostructured surface. The metal nanostructure can result in more rapid emission of the fluorophore or may change the normally isotropic emission into directional emission. For fluorophores, which absorb and emit at visible wavelengths, it has been shown in many experiments that proximity to silver and/or gold particles results in increases of intensity, radiative decay rate, and photostability [28,29]. Observations of MEF due to silver and aluminum nanostructures have been also reported for the UV wavelength range [30–34].
Materials and methods
Preparation of silver island films and surface deposition of proteins
The wet chemical deposition method was used to coat the quartz substrate with the silver island films (SIFs). The procedure of deposition of SIFs on glass and quartz substrates has been described elsewhere [29,35]. The wet chemical deposition technique results in variability of the particle sizes and shapes, as has been shown previously using atomic force microscopy with particle sizes up to 500 nm and thicknesses of 50 to 100 nm [29]. The absorption spectrum maximum of the fabricated SIFs is near 450 nm with an optical density of approximately 1.15, indicating that the particles were of subwavelength size. We used high-density silver islands to limit the void areas between particles where the proteins can also adsorb and tryptophan residues would not effectively interact with particle plasmon resonance.
The proteins used were biotinylated bovine serum albumin (BSA-Bt) from Sigma–Aldrich (St. Louis, MO, USA), avidin from Pierce Biotechnology (Rockford, IL, USA), and immunoglobulins (IgG3 and anti-IgG3) from Southern Biotech (Birmingham, AL, USA). For deposition of proteins on the SIFs and bare quartz substrates, we used direct deposition of proteins by spotting from aqueous solution and by noncovalent electrostatic immobilization. Because the fluorescence of tryptophan molecule is relatively weak in comparison with organic fluorophores, due mostly to its low extinction coefficient (5500 M−1 cm−1 at 280 nm) and UV spectral range where autofluorescence can usually be high, we performed initial experiments using avidin. This protein contains 16 tryptophan residues and is relatively bright compared with other proteins. First, avidin was deposited through spotting a water solution on the SIF surface that allowed an increase in protein concentration on the surface and facilitated easy measurements of tryptophan fluorescence. Second, a layer-by-layer method was used to deposit layers of BSA-Bt and avidin. The initial BSA-Bt layer was electrostatically immobilized on the SIFs and quartz through incubation of a solution of 20 μg/ml in phosphate buffer at pH 7.4 for 1 h. After washing out unbound BSA-Bt, the avidin solution of 10 μg/ml was incubated for 1 h, creating one layer of BSA-Bt– avidin. The procedure was repeated to construct up to four BSA-Bt –avidin layers [(BSA-Bt–avidin)n, n = 1, 2, 3, or 4]. Finally, a model immunoassay was performed with a monolayer of BSA-Bt adsorbed on the substrate with SIFs (capture bioactive layer) and various concentrations of avidin (binding analyte) demonstrating detection of submonolayer of avidin. In addition, an antibody system using IgG3 and anti-IgG3 was evaluated in the presence of blocking solution. Schematics of experimental configurations are shown in Fig. 1.
Fig. 1.

Schematics of experimental configurations of protein layers on SIFs: (A) avidin deposited from aqueous solution; (B) binding of avidin to the BSA-Bt functionalized surface; (C) binding of anti-IgG3 to functionalized surface with capture IgG3 and blocked with blocking agent.
Spectroscopic measurements
The extinction spectra of SIFs were measured using a single beam spectrophotometer (Hewlett–Packard model 8453). The emission spectra of avidin were measured using Varian Cary Eclipse fluorometer with excitation of 280 nm.
Fluorescence lifetimes were measured using a frequency domain fluorometer (K2, ISS, Champaign, IL, USA). The excitation source was frequency-doubled output from rhodamine 6G dye laser pumped with mode-locked argon ion laser. The excitation was 280 nm, and the emission observed through the bandpass filter was 320 to 360 nm. We are aware that the tryptophan fluorescence properties, quantum yield, and lifetime depend strongly on the environment [36]; thus, experiments were performed at identical conditions for samples on bare quartz and SIFs.
The intensity decays were analyzed using the multiexponential model
| (1) |
where αi is the amplitude (Σiαi= 1.0) and τi is the decay time. The intensity decay parameters (αi and τi) were determined using nonlinear least-squares fitting. Two average lifetimes were calculated, amplitude (〈τ〉) and intensity (τM), weighted for comparison between values on bare quartz and SIFs:
| (2) |
where the fractional contribution of each component (fi) to the steady- state intensity is defined as
| (3) |
Results and discussion
Avidin layers deposited on the SIFs
Fig. 2 shows the intensities of avidin on the quartz and SIF surfaces with consecutive spotting (see schematic in Fig. 1A). Water solution of avidin with 1 μM concentration was spotted in 1-μl aliquots (1 pmol of avidin), creating a dry spot of approximately 5 mm diameter. Assuming that avidin is distributed uniformly within the spot area, one can estimate the maximal surface density to be 5.1 pmol/cm2, corresponding approximately to a monolayer of avidin. The calculated surface density of a full crystalline monolayer of streptavidin (similar size as avidin) is approximately 2.8 ng/mm2 [37], corresponding to approximately 4.4 pmol/cm2. The intensity measurements were performed by illuminating the whole spot to facilitate comparison of signals from an equal number of avidin molecules spotted on quartz and SIFs. The whole spot was illuminated with excitation light at 280 nm, and emission spectra were recorded. Sequentially added 1-μl sample volumes resulted in increased surface density of avidin and in proportionally increased intensities. The intensities on SIFs were more than twofold larger than those on quartz (Fig. 2). The experiment with deposited avidin demonstrates that detection of less than 66 ng (1 μl of 1 μM) avidin is possible, and this is better than 1 μg per protein band in detection with polyacrylamide gels using UV absorbance and native protein fluorescence [24,25]. The optimization of metallic nanostructures will lead to a higher enhancement factor than twofold in the current experiment, and likely the sensitivity to be achieved will be in the range of 1 to 10 ng per spot, as shown for a more sophisticated system that uses a high-power UV laser for excitation and a charge-coupled device (CCD) camera [23].
Fig. 2.
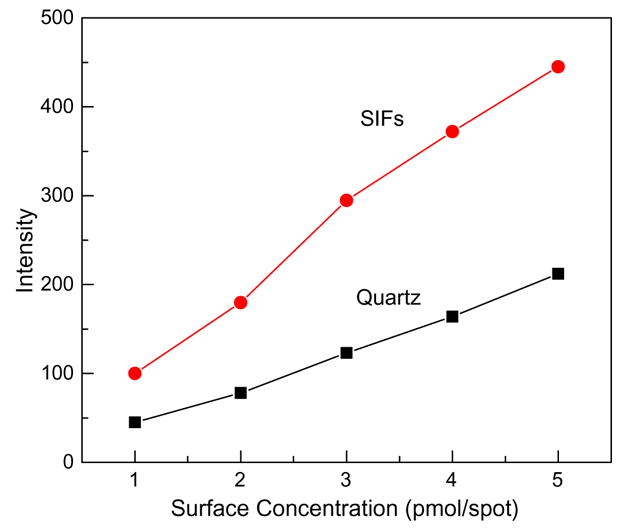
Intensity of avidin spotted on bare quartz and SIFs with sequentially increased surface concentration.
The lifetime measurements for avidin deposited on the quartz and SIFs with three and five 1-μl aliquots are shown in Fig. 3. The solid lines indicate the best fit of the multiexponential fitting model to the experimental phase shifts and modulations measured over the modulation frequencies from 3.8 to 296.4 MHz. The detailed analysis of intensity decays is summarized in the Table 1. The intensity decays of tryptophan residues were found to be complex and required a three-exponential model using nonlinear least-squares fitting with goodness-of-fit determined by the reduced χ2 value. There were observed small contributions of background signal from SIFs (<5%) and from bare quartz (~7%) that have very little effect on the measured intensity decays and calculated average lifetimes. Despite the complex multiexponential intensity decays, it is clear that the intensity decays of tryptophan residues are faster on SIFs compared with those on bare quartz. The calculated average lifetimes decreased 1.8-fold (amplitude-weighted) and 1.4 (intensity weighted) on SIFs compared with quartz for 3 μl (~three avidin layers). The shorter average lifetime and increased intensity on the SIFs indicate that there is an interaction between excited tryptophan residues and silver particle plasmons [28–30]. The observed changes in intensity and lifetime of tryptophan are moderate compared with those observed for organic fluorophores in the visible range of wavelength [28–30]. The intensity decays also show that the lifetime for three layers of avidin is shorter than that for five layers on the SIFs. This indicates that the effect of particle plasmons on spectral properties of tryptophan decreases with an increase of distance from the surface of the metal. The estimated thickness of a single avidin layer is 5 nm [37]. It is observed that the values of all lifetime components decreased, whereas the amplitudes remained almost not affected by the presence of SIFs, indicating that the average radiative decay rate of tryptophan residues increased.
Fig. 3.

Phase shift and modulation responses of the intensity decays of avidin spotted on bare quartz (three layers of avidin) and SIFs.
Table 1.
Analysis of intensity decays of avidin deposited on quartz slide and SIFs.
| Avidin | τi (ns) | αi | fi | <τ> (ns) | τM (ns) |
|---|---|---|---|---|---|
| On quartz (5 μl) | 5.50 | 0.064 | 0.313 | 1.13 | 2.72 |
| 1.89 | 0.294 | 0.493 | |||
| 0.34 | 0.642 | 0.194 | |||
| On SIFs (3 μl) | 3.73 | 0.070 | 0.419 | 0.62 | 1.94 |
| 0.95 | 0.227 | 0.346 | |||
| 0.21 | 0.703 | 0.235 | |||
| On SIFs (5 μl) | 4.17 | 0.064 | 0.341 | 0.78 | 2.05 |
| 1.23 | 0.299 | 0.472 | |||
| 0.23 | 0.637 | 0.188 |
Note. Excitation wavelength = 280 nm (frequency-doubled output of rhodamine 6G dye laser). Emission was observed through bandpass filter (320–360 nm).
The observed increase in intensities and decrease in lifetime of avidin by approximately twofold due to the presence of SIFs is in agreement with the recent theoretical calculations of field enhancements by silver particles in the UV wavelength range [38]. On the other side, our result is somewhat unexpected in view of other theoretical calculations of effects of particle plasmons on radiative and nonradiative decay rates of fluorophores with emission in the UV wavelength range [39]. Both theoretical calculations considered single silver particles, whereas our observations are for an ensemble of many particles of various shapes and sizes that construct the SIFs, usually with a broad plasmon spectrum. In addition, closed spaced particles can interact with each other, resulting in high electromagnetic fields between them. The plasmon resonance spectrum of SIFs relative to the absorption and emission spectra of the avidin is shown in Fig. 4. The absorption spectrum of avidin is in aqueous solution and normalized (to 1.0) to the maximum at 280 nm. The emission spectra of avidin are on the SIFs and quartz substrates for three layers [(BSA-Bt–avidin)3]. The theoretical calculation of field enhancements for several metallic nanoparticles indicates that absorption and emission spectra overlap well with the field enhancement generated by silver particles [38]. Thus, experimental results and theoretical calculations indicate that the silver nanostructures can be used for enhanced tryptophan fluorescence and applied for label-free detection schemes where submonolayer of proteins on the surface can be detected. To obtain larger intensity enhancements of tryptophan residues, a further optimization of the silver nanostructures and exploration of the use of other metallic nanoparticles are needed. Fabrication of silver nanoparticles with smaller sizes will result in a shift of the plasmon resonance peak to a shorter wavelength and will likely result in larger effects on the emission properties of the tryptophan. It was recently reported that the intensity enhancements of BSA depend strongly on the sample configuration and the nature of the silver nanostructures such as SIFs (12.2-fold), Ag colloids (5.3-fold), and Ag fractals (3.8-fold) [34]. One can predict obtaining an enhanced fluorescence signal from tryptophan residues that can be comparable to signals of extrinsic fluorophores. The calculated enhanced field (E2) around the silver nanoparticles in the UV range can vary from several-fold to approximately 100-fold [38], and this will improve the absorption probability of tryptophan (5500 M−1 cm−1 at 280 nm) and increase the quantum efficiency to values comparable to those of rhodamine and cyanine dyes.
Fig. 4.

Absorption spectrum of avidin in aqueous solution (1) and emission spectra of avidin measured on SIFs (2) and quartz (3) after being spotted from aqueous solution and dried (~ three avidin layers). The absorption spectrum of SIFs is also shown (4, dashed line).
It is known that one of the limitations of fluorophores is their photostability. We performed measurements of steady-state emission intensity as a function of time and observed that the photobleaching of avidin deposited on quartz was similar to that deposited on SIFs, resulting in approximately 50% loss of initial intensities after continuous illumination (over 20 min) of focused excitation light at 280 nm. This result indicates that tryptophan photostability is improved due to interaction with particle plasmons, consistent with observations for organic fluorophores in the presence of metallic particles [28–30].
Variation of protein thickness using layer-by-layer protein immobilization
The initial experiments with simple spotting deposition illustrated that multilayers of protein can be easily detected on quartz and SIFs. Due to the spotting deposition and drying of the sample, the environments for tryptophan residues are not the same as those for proteins in biological samples. In the next step of the experiments, we constructed subsequent monolayers of BSA-Bt and avidin in phosphate buffer (pH 7.4) [40] and measured relative intensities and lifetimes on the (BSA-Bt–avidin)n multilayers, where n = 1, 2, 3, or 4. The schematic shown in Fig. 1B illustrates the one layer of BSA-Bt–avidin. The multilayer system also provided the means to investigate the distance effect of SIFs on fluorescence of tryptophan residues. The protein multilayer system does not provide a single distance because the tryptophan residues are distributed throughout the protein. Nonetheless, the obtained data have a value for the future design of label-free assays. Fig. 5 shows the emission spectra of the two and three layers of BSA-Bt –avidin constructed on quartz and SIFs. The measured emission spectra confirm that the observed signal is a characteristic of tryptophan emission, with increased intensity corresponding to increased layers of proteins.
Fig. 5.

Emission spectra of (BSA-Bt–avidin)n layers deposited on quartz (top) and SIFs (bottom). Number of layers (n) = <1 (less than a full layer of avidin), 2, or 3.
For lifetime measurements and relative intensities, a bandpass filter (320–360 nm) was used. Frequency domain intensity decays of avidin in solution and for three layers of BSA-Bt–avidin on quartz and SIFs are shown in Fig. 6. It is also observed that the intensity decay of avidin on quartz is faster than of avidin in buffer solution. This is due to environmental difference to which tryptophan is sensitive [36]. A similar effect of decreased fluorescence lifetime of tryptophan residues has been observed for immobilized p53 peptide on nitrocellulose and subsequently for bound BP53-12 antibodies [26].
Fig. 6.

Phase shift and modulation responses of the intensity decays of avidin in buffer solution and multi-layers deposited on quartz surface and SIFs via a layer of BSA-biotin. The multi-layer consisted of three BSA-Bt-avidin layers. The lifetime value in solution is for avidin in phosphate buffer.
The analysis of intensity decay of (BSA-Bt–avidin)n multilayers was performed similarly as for spotted avidin. The observed intensity decays on SIFs were faster than those on quartz for all multilayer proteins, whereas the intensities were larger. The frequency responses were fit to the three-exponential model, and amplitude- weighted lifetimes were calculated according to Eq. (2). Fig. 7 shows the calculated average lifetimes on bare quartz and SIFs and the relative intensities of the BSA-Bt–avidin layers. It is evident that the presence of SIFs results in decreased lifetime and increased intensity of tryptophan relative to the dielectric quartz surface. The observed values of average lifetimes and relative intensities for the first three layers are similar. This is likely due to the combined effects of enhancement and quenching. It is known that the tryptophans close to the metal surface experience the highest field enhancements and, simultaneously, the highest quenching by metallic particles. In such a case, one may expect that part of intensity enhancement is compensated by the quenching and that effective enhancement is similar to that at larger distances (two and three layers). It is important to note that the effective distance where the tryptophan interacts with plasmon is relatively large, observed at up to three BSA-Bt–avidin layers, which can be estimated to approximately 30 nm. Such a distance will allow the design of a potential label-free fluorometric sand-wich type of assay.
Fig. 7.
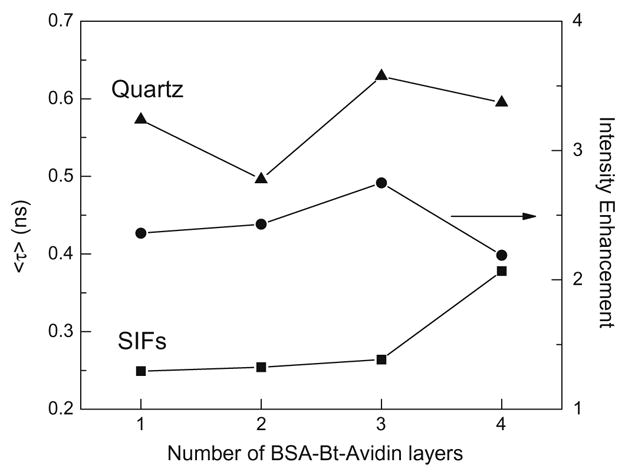
Amplitude weighted lifetime for multilayer of BSA-Bt_Avidin deposited on quartz (triangles) and SIFs (squares). Intensity enhancement (circles) is a ratio of intensity observed on SIFs to intensity on quartz. The excitation was 280 nm from frequency- doubled rhodamine 6G dye laser and emission observed through band pass filter 320–360 nm.
BSA-Bt and avidin as a model label-free assay
The experiment involving construction of multilayers of BSA-Bt –avidin in buffer solution and measurements of their intensities and lifetimes indicates that detection of submonolayers of protein on SIF surfaces should also be possible. To illustrate the usefulness of this observation, we performed a model label-free bioassay using an SIF surface onto which the layer of BSA-Bt was electrostatically deposited. Subsequently, the SIF substrates were exposed to the avidin solutions at concentrations ranging from 1 ng/ml to 10 μg/ml (15 pM to 154 nM). The surface biotin concentration is determined by the 9 biotin molecules per BSA that allow the avidin molecule to bind to 2 BSA biotin sites [41]; thus, the 1:1 avidin-to-BSA binding can be assumed. This is illustrated schematically in Fig. 1B for a full monolayer of avidin on the surface of BSA-Bt. The intensity measurements were performed in buffer after washing away unbound avidin. The results of the binding of avidin to the surface-immobilized BSA-Bt are shown in Fig. 8. Titration data were fit to the Langmuir adsorption isotherm:
| (4) |
where θ is the fraction of the bound avidin of the total number of available binding sites on the surface (θ ~IA/IAmax, where IA is the intensity at avidin concentration [A] and IAmax is the intensity at saturation) and K is the surface binding constant. The fit to Eq. (4) resulted in a surface binding constant of 9 ×10⁷ M−1. This surface binding constant is smaller than expected in buffer solution between avidin and biotin of 1013 to 1015 M−1; however, a similar low value was also observed for the surface binding constant between streptavidin and biotin on gold nanoparticles [42].
Fig. 8.

Intensity of BSA-Bt–avidin assay using SIF substrate. The intensity readouts were performed in the absence of free avidin. The intensity signals were corrected for background from the buffer and SIF bare substrate and are based on the average intensity from at least three different spots within a well.
On binding of avidin to the surface of BSA-Bt on the SIFs, the intensity increased 6.4-fold. The intensity increase is larger than 3.5-fold, as observed for equimolar concentrations of BSA-Bt and avidin in the buffer solution. It should be noted that the intrinsic fluorescence of proteins is not usually directly proportional to the number of tryptophan residues because of the various environments that affect the quantum efficiencies of the individual tryptophan residues. The higher intensity ratio of avidin-to-BSA found on SIFs is likely due to potential quenching of emission of BSA because the average tryptophan residues distance is less than 3 nm from silver islands, whereas the tryptophans in avidin are separated by a larger distance where the silver quenching effects are expected much less.
One can estimate the amount of avidin bound to the surface that can be detected assuming that the maximal avidin surface concentration is similar to that of the BSA-Bt saturation surface coverage, typically in the range from 120 to 180 ng/cm2 (1.8–2.7 pmol/cm2) [43,44]. Titration data in Fig. 8 show that with our model system, we are capable of detecting the 1 to 5% of maximal avidin surface concentration. This indicates that less than 2 ng/cm2 of avidin generated the measurable signal on top of a full monolayer of BSA. One can forecast that optimization of metallic nanostructures and assays will result in detection capabilities using intrinsic protein fluorescence comparable to those of SPR systems in the range of 100 pg/cm2 [17,18]. One should note that detection sensitivity for SPR systems is dependent on molecular weight, whereas detection sensitivity of proteins based on UV fluorescence is dependent on the tryptophan density of the binding biomolecule. As a result, it will be possible to design capture proteins that do not contain tryptophan residues, and one can use unlabeled aptamers that do not absorb and emit at the wavelengths used for tryptophan.
Potential of label-free detection with interfering blocking solution
When designing a label-free detection method, consideration must be given to the potential signal from a blocking agent used in most surface-based assays. The blocking solution usually contains proteins that adhere well to most dielectric and metallic surfaces and minimizes or prevents nonspecific binding. As a capture antibody, we used IgG3, a protein-based blocker formulation used in Western blotting and enzyme-linked immunosorbent assay (ELISA) applications (StartingBlock [phosphate] Blocking Buffer, Pierce Biotechnology). As the binding antigen, we used anti-IgG3. The blocking solution displayed strong fluorescence with a peak intensity of approximately 340 nm, which was comparable to approximately 20 μM of IgG3 in solution. However, despite its strong fluorescence, the intensity from the surface with immobilized capture IgG3 increased only 64 and 80% after blocking solution on quartz and SIFs, respectively (Fig. 9). This increased intensity due to the blocking solution can be regarded as moderate, and in future assays the intensity due to blocking reagents could be even less if covalent immobilization of capture antibodies will be performed with higher surface density or using blocking solutions without proteins.
Fig. 9.

Intensity increase in sequential immobilizing of capture IgG3, adding blocking solution, and adding anti-IgG3.
Our initial experiments were performed with sub- and multi-layers of proteins on the SIF surface in the absence of the unbound proteins in the buffer solution above the surface. The goal was to demonstrate the ability for detection of small amounts of proteins bound to the SIFs deposited on quartz substrate. The important question is how the bulk concentration of the same analyte or combined signal from biomolecules in the sample will affect the signal from the bound analyte to the MEF surface. The most abundant protein in biological samples is human serum albumin (HSA), which displays similar tryptophan fluorescence as BSA. Assuming conservatively the surface density of capture antibody as 1 pmol/cm2 (150 ng/cm2, antibody size ~ 10 × 10 nm) and the bulk solution of HSA of 1 mg/ml, one can find that the molar ratio of capture antibodies to the free HSA in solution of 1 μm thickness above the surface is 1:1.5. Assuming further that the intensity of bound analyte will be enhanced by MEF within the distance of 5 to 30 nm, one can realize that label-free detection using protein fluorescence can be easily accomplished in the presence of bulk sample solution without washing steps.
Conclusion
We have demonstrated the potential of using silver nanostructures for enhancement of tryptophan fluorescence in several proteins. Four experiments with various configurations of surface-bound proteins provided promising results for the design of label- free detection based on intrinsic fluorescence of proteins. The intensity and lifetime measurements confirmed that the fluorescence of tryptophan residues is enhanced due to tryptophan–silver nanoparticle plasmon interactions. The fluorescence signal from a submonolayer of avidin of less than 2 ng/cm2 was detected on silver nanostructured surfaces. These preliminary experimental results suggest that label-free detection could be achieved using the MEF in the UV–blue wavelength range and intrinsic tryptophan residue fluorescence in proteins.
Acknowledgments
This research was supported by National Institutes of Health (NIH) grants EB006521 and HG002655.
Footnotes
Abbreviations used: SPR, surface plasmon resonance; LSPR, localized surface plasmon resonance; T-SPR, transmission surface plasmon resonance; FRET, fluorescence resonance energy transfer; UV, ultraviolet; MEF, metal-enhanced fluorescence; SIF, silver island film; BSA-Bt, biotinylated bovine serum albumin; IgG, immunoglobulin; CCD, charge-coupled device; ELISA, enzyme-linked immunosorbent assay; HSA, human serum albumin.
References
- 1.Yu X, Xu D, Cheng Q. Label-free detection methods for protein microarrays. Proteomics. 2006;6:5493–5503. doi: 10.1002/pmic.200600216. [DOI] [PubMed] [Google Scholar]
- 2.Cooper MA. Non-optical screening platforms: the next wave in label-free screening? Drug Discov Today. 2006;11:1068–1074. doi: 10.1016/j.drudis.2006.10.001. [DOI] [PubMed] [Google Scholar]
- 3.Sun L, Yu C, Irudayaraj J. Surface-enhanced Raman scattering based nonfluorescent probe for multiplex DNA detection. Anal Chem. 2007;79:3981–3988. doi: 10.1021/ac070078z. [DOI] [PMC free article] [PubMed] [Google Scholar]
- 4.Grow AE, Wood LL, Chaycomb JL, Thompson PA. New biochip technology for label-free detection of pathogens and their toxins. J Microbiol Methods. 2003;53:221–233. doi: 10.1016/s0167-7012(03)00026-5. [DOI] [PubMed] [Google Scholar]
- 5.Vestergaard M, Kerman K, Tamiya E. An overview of label-free electrochemical protein sensors. Sensors. 2007;7:3442–3458. doi: 10.3390/s7123442. [DOI] [PMC free article] [PubMed] [Google Scholar]
- 6.Hansen JA, Wang J, Kawde AN, Xiang Y, Gothelf KV, Collins G. Quantum-dot/aptamer-based ultrasensitive multi-analyte electrochemical biosensor. J Am Chem Soc. 2006;128:2228–2229. doi: 10.1021/ja060005h. [DOI] [PubMed] [Google Scholar]
- 7.Patolsky F, Zheng G, Lieber CM. Fabrication of silicon nanowire devices for ultrasensitive, label-free real-time detection of biological and chemical species. Nat Protocols. 2006;1:1711–1724. doi: 10.1038/nprot.2006.227. [DOI] [PubMed] [Google Scholar]
- 8.Armani AM, Kulkarni RP, Fraser SE, Flagan RC, Vahala KJ. Label-free, single molecule detection with optical microcavities. Science. 2007;317:783–786. doi: 10.1126/science.1145002. [DOI] [PubMed] [Google Scholar]
- 9.Acharya G, Chang CL, Savran C. An optical biosensor for rapid and label-free detection of cells. J Am Chem Soc. 2006;128:3862–3863. doi: 10.1021/ja057490l. [DOI] [PubMed] [Google Scholar]
- 10.Zeskind BJ, Jordan CD, Timp W, Trapani L, Waller G, Horodincu V, Ehrlich DJ, Matsudaira P. Nucleic acid and protein mass mapping by live-cell deep-ultraviolet microscopy. Nat Methods. 2007;4:567–569. doi: 10.1038/nmeth1053. [DOI] [PubMed] [Google Scholar]
- 11.Landry JP, Zhu XD, Gregg JP. Label-free detection of microarrays of biomolecules by oblique-incidence reflectivity difference microscopy. Optics Lett. 2004;29:581–583. doi: 10.1364/ol.29.000581. [DOI] [PubMed] [Google Scholar]
- 12.Varma MM, Inerowicz HD, Regnier FE, Nolte DD. High-speed label-free detection by spinning-disk. Biosens Bioelectron. 2004;19:1371–1376. doi: 10.1016/j.bios.2003.12.033. [DOI] [PubMed] [Google Scholar]
- 13.Mathias PC, Ganesh N, Chan LL, Cunningham BT. Combined enhanced fluorescence and label-free biomolecular detection with a photonic crystal surface. Appl Optics. 2007;46:2351–2360. doi: 10.1364/ao.46.002351. [DOI] [PubMed] [Google Scholar]
- 14.Phillips KS, Cheng Q. Recent advances in surface plasmon resonance based techniques for bioanalysis. Anal Bioanal Chem. 2007;387:1831–1840. doi: 10.1007/s00216-006-1052-7. [DOI] [PubMed] [Google Scholar]
- 15.Wegner GJ, Wark AW, Lee HJ, Codner E, Saeki T, Fang S, Corn RM. Real-time surface plasmon resonance imaging measurements for the multiplexed determination of protein adsorption/desorption kinetics and surface enzymatic reactions on peptide microarrays. Anal Chem. 2004;76:5677–5684. doi: 10.1021/ac0494275. [DOI] [PubMed] [Google Scholar]
- 16.Lee HJ, Nedelkov D, Corn RM. Surface plasmon resonance imaging measurements of antibody arrays for the multiplexed detection of low molecular weight protein biomarkers. Anal Chem. 2006;78:6504–6510. doi: 10.1021/ac060881d. [DOI] [PubMed] [Google Scholar]
- 17.Jung LS, Campbell CT, Chinowsky TM, Mar MN, Yee SS. Quantitative interpretation of the response of surface plasmon resonance sensors to adsorbed films. Langmuir. 1998;14:5636–5648. [Google Scholar]
- 18.Homola J, Yee SS, Gauglitz G. Surface plasmon resonance sensors: review. Sens Actuat B. 1999;54:3–15. [Google Scholar]
- 19.Lahav M, Vaskevich A, Rubinstein I. Biological sensing using transmission surface plasmon resonance spectroscopy. Langmuir. 2004;20:7365–7367. doi: 10.1021/la0489054. [DOI] [PubMed] [Google Scholar]
- 20.Haes AJ, Van Duyne RP. A nanoscale optical biosensor: sensitivity and selectivity of an approach based on the localized surface plasmon resonance spectroscopy of triangular silver nanoparticles. J Am Chem Soc. 2002;124:10596–10604. doi: 10.1021/ja020393x. [DOI] [PubMed] [Google Scholar]
- 21.Riboh JC, Haes AJ, McFarland AD, Yonzon CR, Van Duyne RP. A nanoscale optical biosensor: real-time immunoassay in physiological buffer enabled by improved nanoparticle adhesion. J Phys Chem B. 2003;107:1772–1780. [Google Scholar]
- 22.Lakowicz JR. Principles of Fluorescence Spectroscopy. 3. Springer; New York: 2006. [Google Scholar]
- 23.Roegener J, Lutter P, Reinhardt R, Blüggel M, Meyer HE, Anselmetti D. Ultrasensitive detection of unstained proteins in acrylamide gels by native UV fluorescence. Anal Chem. 2003;75:157–159. doi: 10.1021/ac020517o. [DOI] [PubMed] [Google Scholar]
- 24.Sluszny C, Yeung ES. One- and two-dimensional miniaturized electrophoresis of proteins with native fluorescence detection. Anal Chem. 2004;76:1359–1365. doi: 10.1021/ac035336g. [DOI] [PubMed] [Google Scholar]
- 25.Schulze P, Ludwig M, Kohler F, Belder D. Deep UV laser-induced fluorescence detection of unlabeled drugs and proteins in microchip electrophoresis. Anal Chem. 2005;77:1325–1329. doi: 10.1021/ac048596m. [DOI] [PubMed] [Google Scholar]
- 26.Schüttpeltz M, Müller C, Neuweiler H, Sauer M. UV fluorescence lifetime imaging microscopy: a label-free method for detection and quantification of protein interactions. Anal Chem. 2006;78:663–669. doi: 10.1021/ac051938j. [DOI] [PubMed] [Google Scholar]
- 27.Engström HA, Andersson PO, Ohlson S. A label-free continuous total-internal- reflection-fluorescence-based immunosensor. Anal Biochem. 2006;357:159–166. doi: 10.1016/j.ab.2006.03.058. [DOI] [PubMed] [Google Scholar]
- 28.Lakowicz JR. Radiative decay engineering: biophysical and biomedical applications. Anal Biochem. 2001;298:1–24. doi: 10.1006/abio.2001.5377. [DOI] [PMC free article] [PubMed] [Google Scholar]
- 29.Lakowicz JR, Shen Y, D’Auria S, Malicka J, Fang J, Gryczynski Z, Gryczynski I. Radiative decay engineering: II. effects of silver island films on fluorescence intensity, lifetimes, and resonance energy transfer. Anal Biochem. 2002;301:261–277. doi: 10.1006/abio.2001.5503. [DOI] [PMC free article] [PubMed] [Google Scholar]
- 30.Lakowicz JR, Shen B, Gryczynski Z, D’Auria S, Gryczynski I. Intrinsic fluorescence from DNA can be enhanced by metallic particles. Biochem Biophys Res Commun. 2001;286:875–879. doi: 10.1006/bbrc.2001.5445. [DOI] [PMC free article] [PubMed] [Google Scholar]
- 31.Gryczynski I, Malicka J, Lukomska J, Gryczynski Z, Lakowicz JR. Surface plasmon-coupled polarized emission of N-acetyl-l-tryptophanamide. Photochem Photobiol. 2004;80:482–485. doi: 10.1562/0031-8655(2004)080<0482:SPPEON>2.0.CO;2. [DOI] [PMC free article] [PubMed] [Google Scholar]
- 32.Gryczynski I, Malicka J, Gryczynski Z, Nowaczyk K, Lakowicz JR. Ultraviolet surface plasmon-coupled emission using thin aluminum films. Anal Chem. 2004;76:4076–4081. doi: 10.1021/ac040004c. [DOI] [PMC free article] [PubMed] [Google Scholar]
- 33.Ray K, Chowdhury MH, Lakowicz JR. Aluminum nanostructured films as substrates for enhanced fluorescence in the ultraviolet–blue spectral region. Anal Chem. 2007;79:6480–6487. doi: 10.1021/ac071363l. [DOI] [PMC free article] [PubMed] [Google Scholar]
- 34.Sun C, Wu X, Ding H, Zhao L, Wang F, Yang J, Liu X. The fluorescence enhancement of the protein adsorbed on the surface of Ag nanoparticle. J Fluoresc. doi: 10.1007/s10895-008-0392-4. [DOI] [PubMed] [Google Scholar]
- 35.Ni F, Cotton TM. Chemical procedure for preparing surface-enhanced Raman scattering active silver films. Anal Chem. 1986;58:3159–3163. doi: 10.1021/ac00127a053. [DOI] [PubMed] [Google Scholar]
- 36.Toptygin D, Savtchenko RS, Meadow ND, Roseman S, Brand L. Effect of the solvent refractive index on the excited-state lifetime of a single tryptophan residue in a protein. J Phys Chem B. 2002;106:3724–3734. [Google Scholar]
- 37.Darst SA, Ahlers M, Meller PH, Kubalek EW, Blakenburg R, Rib HO, Ringsdorf H, Kornberg RD. Two-dimensional crystals of streptavidin on biotinylated lipid layers and their interactions with biotinylated macromolecules. Biophys J. 1991;59:387–396. doi: 10.1016/S0006-3495(91)82232-9. [DOI] [PMC free article] [PubMed] [Google Scholar]
- 38.Tanabe K. Field enhancement around metal nanoparticles and nanoshells: a systematic investigation. J Phys Chem C. 2008;112:15721–15728. [Google Scholar]
- 39.Mertens H, Koendrink AF, Polman A. Plasmon-enhanced luminescence near noble-metal nanospheres: comparison of exact theory and an improved Gersten and Nitzan model. Phys Rev B. 2007;76:115123. [Google Scholar]
- 40.Hoshi T, Saiki H, Anzai J. Layer-by-layer deposition of avidin and biotin labeled antibody on a solid surface to prepare a multilayer array of antibody. J Chem Soc Perkin Trans. 1999;2:1293–1294. [Google Scholar]
- 41.Jung LS, Nelson KE, Stayton PS, Campbell CT. Binding and dissociation kinetics of wild-type and mutant streptavidins on mixed biotin-containing alkylthiolate monolayers. Langmuir. 2000;16:9421–9432. [Google Scholar]
- 42.Nath N, Chilkoti A. Label-free biosensing by surface plasmon resonance of nanoparticles on glass: optimization of nanoparticle size. Anal Chem. 2004;76:5370–5378. doi: 10.1021/ac049741z. [DOI] [PubMed] [Google Scholar]
- 43.Silin V, Weetall H, Vanderah DJ. SPR studies of nonspecific adsorption kinetics of human IgG and BSA on gold surfaces modified by self-assembled monolayers (SAMs) J Colloid Interface Sci. 1997;185:94–103. doi: 10.1006/jcis.1996.4586. [DOI] [PubMed] [Google Scholar]
- 44.Gölander CG, Kiss E. Protein adsorption on functionalized and ESCA-characterized polymer films studied by ellipsometry. J Colloid Interface Sci. 1998;121:240–253. [Google Scholar]