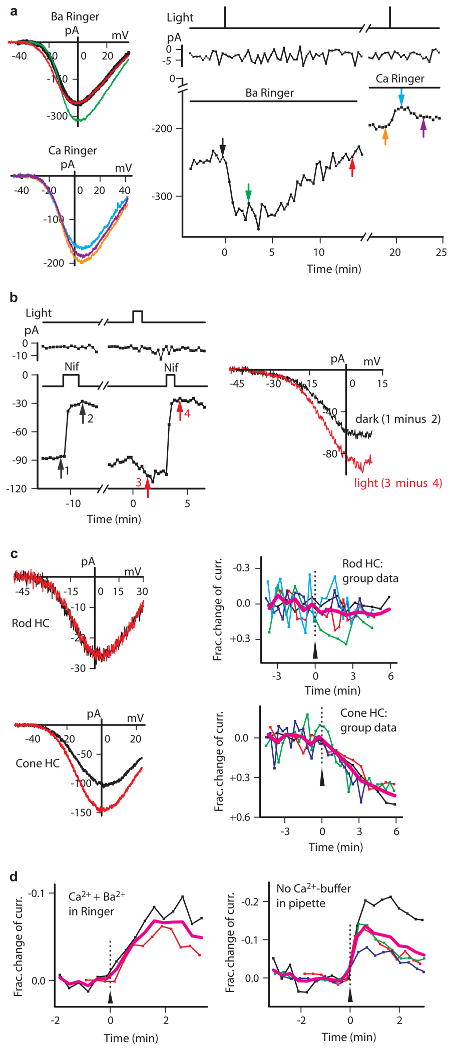
Fig. 2.

Characterization of catfish cone HC light response. a, Light only increased current in Ba solution. Time gap ∼2 min. Identical flashes. K-methanesulfonate pipette solution. b, Ba current and its light-induced increase were both sensitive to nifedipine (Nif, 10 μM). Time gap ∼5 min. c, Ba current of cone HCs (bottom), but not rod HCs (top), was light-sensitive. Left shows sample cell (black, before light; red, ∼3 min after light). n=5 (top) and n=4 (bottom) in group data. Simplified Ba-Ringer and Cs-methanesulfonate pipette solution in b and c. d, Ca2+ influx required for light-induced current decrease. Left, Ca2+ (3 mM) in Ba-Ringer restored light-induced current decrease. n=2 and average (magenta). K-methanesulfonate pipette solution. Right, omitting 10 mM BAPTA in pipette still gave light-induced current decrease (n=4). K-methanesulfonate pipette solution. Ca-Ringer. In all cases, light was 480 nm, (0.8 to 10)×108 photons μm-2 s-1 for 1-50 s.
