

Abstract
Stereoscopic depth processing for static objects depends on retinal disparities between the two eyes and has been shown in previous functional imaging (fMRI) work to involve widely distributed activity in the human visual cortex, including both dorsal and ventral streams. Stereoscopic depth processing of moving objects, on the other hand, can be produced by purely temporal lags between the eyes, and the cortical basis for this kind of stereopsis has received less attention. Using fMRI in human subjects, we measured the activations produced by dynamic visual noise both when it was in phase between the eyes and appeared two-dimensional (2D) and when an interocular delay made it appear like a 3D rotating cylinder. When observers attended to the depth, the stimulus with the interocular delay produced more activity than the 2D stimulus in a large variety of cortical areas, including V1, V3A, caudal intraparietal sulcus (cIPS), and MT. When, on the other hand, observers attended to a digit counting task in the fovea, the stimulus with the interocular delay tended to decrease the BOLD response in V1 while still increasing it significantly in area cIPS. The areas that are activated by interocular delay even when not attending to depth (MT, cIPS) are similar to those previously described for traditional stereoscopic stimuli, and we conclude that the dorsal-stream mechanisms for processing interocular delay are not different at the level of spatial resolution of this study.
Keywords: motion, stereo, fMRI
Introduction
Wheatstone (1838) was the first to show that the small geometrical differences in the retinal images of the two eyes are sufficient to generate the perception of solid objects (stereopsis). These differences, termed binocular disparities, are generated by the different horizontal positions of the eyes in the head. Another landmark in the history of stereopsis was the conclusive demonstration by Julesz (1971) that binocular disparities in computer-generated random-dot patterns are sufficient to produce the perception of an object that is completely invisible in either eye’s image alone. Single neurones sensitive to binocular disparity in the visual cortex of the cat were discovered in the 1960s (Barlow, Blakemore, & Pettigrew, 1967; Nikara, Bishop, & Pettigrew, 1968; Pettigrew, Nikara, & Bishop, 1968) and subsequently in monkey V1 (Fischer & Poggio, 1979; Poggio, 1995). Disparity-selective cells can be considered as having different receptive field positions in the two eyes (Barlow et al., 1967) or alternatively as having the same positions but with different spatial phase tuning within their envelope (DeAngelis, 2000; DeAngelis, Ohzawa, & Freeman, 1991, 1995).
Disparity-selective single cells can only be an early stage in stereoscopic processing since they do not solve in themselves the problem of ambiguous feature matching (Marr & Poggio, 1976, 1979), most obviously in Julesz’s random-dot patterns. Also, single cells in V1 encode only absolute disparity based on a retinal coordinate system, while psychophysical evidence shows that human observers are much more sensitive to relative than to absolute disparity (Regan, 1986; Westheimer, 1979; Westheimer & McKee, 1979). The responses of disparity-selective cells in V1 are modulated by absolute disparity but not by relative disparity (Cumming & Parker, 1999). The emerging consensus is that disparity processing in V1 is confined to absolute disparity and that the processing of relative disparity takes place in extra-striate visual areas. One suggestion is that absolute disparity processing is mostly represented in areas of the dorsal stream (including MT, MST, CIPS, and LIP) and relative disparity processing in the ventral stream, including V4 and perhaps V8 (Neri, Bridge, & Heeger, 2004; Tyler, 1990).
Functional imaging studies of stereopsis in humans and monkeys have confirmed the widespread activation of extra-striate cortical areas by stereoscopic depth processing (Backus, Fleet, Parker, & Heeger, 2001; Neri et al., 2004). A study by Tsao et al. (2003) examined this question with fMRI in both humans and macaque monkey. The basic stimulus used by Tsao et al. (2003) consisted of a 15-Hz dynamic visual noise stimulus carrying a drifting, disparity-defined checkerboard, which was contrasted with a zero-disparity version of the same stimulus. This contrast revealed an increased BOLD response in the disparity condition in areas V3, V3A, and CIPS (monkey) and in humans V3A, V7, V4d-topo, and the caudal parietal disparity area (CPDR). Motion without disparity did not activate these areas preferentially, neither did segmentation produced by orientation rather than disparity contrast. The role of relative versus absolute disparities was unconfounded by modulating either the whole pattern in depth or some of its component disparity-defined squares. The absolute disparity stimulus elicited strongest activation in V3, MST, and MT/FST, while the relative disparity stimulus elicited strongest activation in V3A and CIPS (monkey). Thus, a start can be made in dissecting out the different circuits involved in the different functions of stereopsis.
A noteworthy finding of the Tsao et al. (2003) study is that the contrast between zero and near/far disparity revealed no preferential activation of area V5/MT in monkey, and only weak and subject-idiosyncratic activation in humans. This finding contrasts with the clear single-unit recording evidence that cells in MT/V5 are organized in “near” and “far” disparity-tuned columns (DeAngelis & Newsome, 1999). Cells tuned to the direction of rotation (in depth) of a disparity-defined cylinder have also been reported in monkey area V5/MT by Parker, Krug, and Cumming (2002). We wondered if this discrepancy might indicate the existence of a specialized mechanism in MT/MST for combining motion and disparity for the purposes of segmentation and object recognition. Although the stimulus in the Tsao et al. study was moving, the movement was not necessary for the disparities to segment the pattern: The checks could be seen even with the pattern stationary. There is, however, a stimulus where motion and disparity are inextricably entwined, and we wondered whether this stimulus would be more effective than simple disparity in activating MT/V5. The stimulus is based on the Pulfrich stereophenomenon.
The original Pulfrich (1922) effect is seen when a horizontally moving object is binocularly viewed with a neutral density (ND) filter over one eye. The object appears to move in an ellipse-in-depth, following the apparent path of a dot painted on a transparent rotating cylinder. Indeed, the direction of rotation of an ambiguously rotating cylinder can be disambiguated with an ND filter. Fertsch’s “delay-line” explanation (Morgan & Thompson, 1975) was that the ND filter delayed the transmission of the signal of target position from the retina, leading to a time-varying binocular disparity. The same effect can be seen by delaying the signal to one eye with a rapidly rotating shutter (Dvorak, 1870). The effect is not due to static disparities since depth is seen even with a sampled-motion stimulus, where the samples occur in the same place in the two eyes, with an interocular delay that is an order of magnitude smaller than the time interval between samples (Morgan & Thompson, 1975). The depth effect with sampled motion also increases with the length of the motion sequence (Morgan & Ward, 1980). Thus, the Pulfrich effect depends not just on a disparity between the eyes, but upon a motion signal.
The need for motion in the Pulfrich effect seemed initially to be questioned by the striking observation that interocular delay caused depth in random dynamic noise (Burr & Ross, 1979; Ross, 1974; Tyler, 1974), making the noise appear to rotate like a cylinder around a vertical axis. However, dynamic visual noise contains, by definition, spatiotemporal Fourier components in all directions, including the horizontal, and thus provides a potential input to neurones that are tuned to interocular phase differences (Morgan & Fahle, 2000; Morgan & Tyler, 1995; Qian & Anderson, 1997). A temporally filtered stimulus that allows the measurement of the frequency response of the motion-stereo mechanism was described by Morgan and Fahle (2000) and is illustrated in Figure 1 and the on-line movie. The test stimulus consists of a random gray-level checkerboard, each check of which is sinusoidally modulated in luminance over time. The left- and the right-eye stimuli are identical except for a phase difference in the temporal modulation. The display contains only one temporal frequency but is broadband in spatial frequency. Without interocular delay, the display appears to flicker, but when delay is introduced, it appears to rotate in depth like a transparent cylinder around a vertical axis. The mechanism stimulated by the delay is temporally low-pass, with a high frequency cut off that can be as low as 5 Hz in some observers, and as high as 20 Hz in others. Depth can be seen even with frequencies as low as 0.1 Hz (Morgan & Fahle, 2000). Maximum sensitivity to depth is found with phase lags in the region of 90 deg and minimum in the region of 180 deg.
Figure 1.

One frame of the stereogram presented in the Experiments. Each check is modulated sinusoidally in luminance over time. The left- and the right-eye stimuli are identical except for a phase shift in the temporal modulation. There is only one temporal frequency, corresponding to the modulation frequency of the luminance, which was 1 Hz in the experiments. Click the image for a movie of the stimulus.
We decided to use the Morgan and Fahle (2000) stimulus in an fMRI study with human subjects to see if interocular delay stimulated the same anatomical regions as those described by Tsao et al. (2003) for conventional disparities. The stimulus lends itself to a particularly informative contrast between conditions of zero and nonzero relative interocular phase. The monocular motion energy (Adelson & Bergen, 1985) in these two stimuli is the same, as is the pattern of spatial disparities between the checks. Thus, the stimulus isolates mechanisms jointly tuned to motion direction and interocular phase.
Methods
Stimuli
The dichoptic stimulus consisted of an array of 41 × 41 square elements in each eye with a side length of 15 arcmin at the viewing distance of 26 cm in the scanner. The luminance of each of the individual elements was randomly sampled from a range between the maximum available from the LCD projector (720 cd/m2) and the minimum (2 cd/m2). Mean luminance was thus approximately 360 cd/m2, but these figures should not be taken as exact since actual values varied during the lifetime of the projector. Luminance was modulated sinusoidally at a frequency of 1 Hertz, with starting phase attributed randomly to individual elements at the start of each presentation (Morgan & Fahle, 2000). The subjective impression of this stimulus when viewed monocularlay is that of luminance flicker. In the pilot experiments using a monitor, the stimuli to the two eyes were separated by doubling the frame refresh rate of the monitor while reducing by half the number of lines by special hardware. Liquid crystal shutter glasses (LCD glasses) in front of the eyes opening and closing in synchrony with the frames of the monitor assured that one eye only saw the even while the other eye saw the odd frame numbers. In the scanner, the images for the two eyes were presented side by side, at a distance of 5 cm, with a partition wall extending from the back projection screen in the scanner all the way to the mirror located in front of the eyes (see Figure 2). Contact lenses, individually applied depending on the refraction of every subject (with a strength of 4 diopters for emmetropes), ensured that subjects did not have to accommodate substantially to the screen distance. Hence, vergence movements of the eyes that are coupled with accommodation were prevented, and subjects were easily able to fuse the separate images presented to the two eyes. Note that depth in our stimuli was not produced by binocular disparities, a fact that together with a stable fixation point assured steady eye position.
Figure 2.
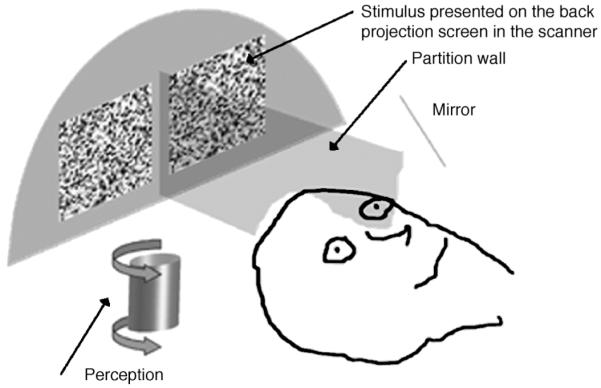
Sketch of the experimental arrangement in the 3-T scanner. Dichoptic viewing was obtained by presenting separate stimuli to the eyes, separated by a partition wall. To prevent accommodation changes and to ease fusion of the stimuli, emmetropic observers were provided with +4 D contact lenses.
There were four stimulus conditions. In the first condition, the stimuli for both eyes were stationary, i.e., the luminances of the individual elements were distributed according to the randomly assigned phase, but did not change over time (static condition). In the second condition, the luminances of all elements were modulated sinusoidally over time at 1 Hz, the phase of the modulation for corresponding elements being the same in the two eyes (2D condition). Subjectively, as mentioned above, the stimulus appears as a randomly flickering 2D dynamic version of Figure 1. In the third (3D) condition, the phase of each individual element in the left eye lagged behind the corresponding element in the other eye (0.1 pi = 18° = 50 ms). This stimulus appears to rotate in depth clockwise (as if viewed from above) around a vertical axis like a transparent rotating cylinder. In the fourth condition, the right eye lagged by 18 deg of phase, and this produced a perception of anti-clockwise motion. In the middle of the display was a red fixation point with a diameter of 12 arcmin, and observers were asked to strictly fixate this dot.
Procedure
Before the experiments in the scanner, all subjects were presented with the stimuli on a computer monitor (1280 × 1024 pixel resolution) to test whether subjects were able to compute depth from temporal delays. The delay varied randomly between right and left eye’s stimulus, and subjects had to indicate the direction of rotation.
Subjects
Seven student observers, aged between 22 and 30 years (3 males, 4 females), and two older observers (KS 43, MF 54) participated in the experiments. The subjects were fully informed about the procedure before they gave written consent to participate. About half of the subjects were experienced psychophysical observers, the others were naive subjects. All had normal or corrected-to-normal vision and had full stereopsis as tested with the Titmus Stereo Test (Stereo Optical Co., Inc., 3539 N Kenton Ave, Chicago IL 60641). The provisions of the declaration of Helsinki were fully implemented and the local Ethics committee issued a positive vote.
Apparatus
For the experiments in the scanner, visual stimuli were generated on a laptop computer. Stimuli were back projected via a video projector (JVC-Projector DLA-G15E with 1280 × 1024 pixel, 75 Hz) onto a screen with a size of around 37 × 30 cm located in the core of the scanner. For the stereo-experiments, subjects viewed the stimuli through a mirror attached to the head coil at a distance of about 26 cm. The displays for the two eyes were separated by means of a partition wall extending from the screen to the mirror as mentioned above, and the central fixation points of the two displays were separated by slightly more than 5 cm horizontally, i.e., little less than the interpupil distance. The fused display accordingly had a side length of around 10 deg of visual angle. Subjects laid supine in the scanner with appropriate contact lenses to prevent them from accommodating and from performing vergence movements. They fixated the central fixation dot. Before the start of the experiments, while laying in the scanner, subjects were again shown the stereo display and asked whether they perceived the depth structure of the stimulus. They were tested on a sequence of negative and positive delays and had to indicate the direction of the rotation in the frontal plane. All subjects performed 100% correct on this task.
Scanning protocol
In a block design, we recorded 285 volumes in one run, lasting for about 12 min. Each run consisted of 19 epochs of about 37.5 s each (15 volumes). The 19 epochs comprised 3 epochs with the stationary stimulus (control condition) and 8 epochs with delays (“depth condition”) as well as 8 epochs without delay (“2D condition”) as shown in Figure 3.
Figure 3.

Time series of percent signal change in areas V1 (top) and V3 (bottom) of the right hemisphere during the condition “attend to depth.” The signal was averaged over all voxels and observers in the selected regions, 285 volumes (x axis) correspond to about 12 min. The black curve shows the best fit of the GLM model, taking the hemodynamic response into account. Dark gray stripes represent the 2D condition, blue stripes the 3D condition. The model fits a differently sized function to each of the 4 predictors (static condition = gray stripes; no delay/2D condition = dark gray stripes; clockwise and anti-clockwise rotation conditions = blue stripes).
In two versions of the basic experiment, we varied the attentional demands of the task. In the first version (“attend to depth”), observers were instructed to attend to the depth structure of the stimulus and were aware that they would subsequently be tested outside the scanner room in a task where they had to adjust the relative disparity between two pointers to equal the depth they had seen in the experiment. In the second version (attend to digits), they had to perform an attention demanding task. In this “digit task,” the central fixation point was replaced by a stream of letters presented every 500 ms. Subjects had to count the number of digits which were interspersed at a rate of about 5%. In the runs of about 12 min, about 72 numbers were presented. Observers had to report the number of digits they had counted after the run and received feedback.
Retinotopy and localizers
Retinotopy for all participants was investigated before the main experiment, using the same basic technique as Grill-Spector et al. (1998) but with a movie rather than radial gratings.
Meridians were mapped by alternating vertical and horizontal wedges displaying a sector taken from a running video film (Futurama, animated cartoon created by Matt Groening, see Figure 4) in blocks of 15 s, respectively. The width of the wedges was 30° of polar angle for the vertical wedge and 15° for the horizontal one. As viewed through a mirror in 42-cm distance from the screen, the horizontal wedge extended over a visual field of 22° and the vertical wedge over 16° as limited by the scanner bore. The order of presentations of the wedges was balanced (ABABAB; BABABA), and presentations were repeated twice always separated by 20 s blocks with presentations of fixation point only. Runs were repeated 2-4 times until a satisfactory mapping result was obtained.
Figure 4.

The left panel shows the vertical and the horizontal wedges used for meridian mapping plotted in one panel. The right shows all the annuli used for eccentricity mapping.
Eccentricity mapping was performed by presenting noncontiguous annuli that were sequences taken from the same film used for meridian mapping with 5 different eccentricity ranges. Radii of the annuli were 0.8-2.3° for the first ring and for the subsequent rings: 2.9-5.3°, 6.2-9.2°, 10.4-15.1°, and 17.0-23.8°. The largest annulus was incompletely seen due to limitations of the visual field in the scanner bore. Annuli were presented in 15 s blocks in increasing or decreasing order separated by 20 s blocks of presentations of fixation point only and repeated several times.
Two different kinds of moving stimuli served as MT/V5 localizers and were presented alternately, separated by periods of stationary stimuli. The first kind of moving stimulus consisted of a random-dot pattern of bright dots on a dark surround moving at 10 deg/s to the right or else up, producing a checkerboard pattern of 5.6° checksize, reversing directions every 72 frames. The second stimulus was a pattern of random bright squares on a dark background moving radially either expanding or contracting, corresponding to an observer speed of 250 cm/s and reversing directions every 72 frames. Blocks of moving stimuli were always followed by blocks containing their stationary counterparts. The order of the two types of blocks was balanced. For each condition, 6 blocks of 20 s each of the moving as well as the stationary pattern were shown, interleaved with 10 s blocks with a fixation point only. To localize area MT/V5, both moving conditions were combined and contrasted with the two stationary stimuli.
We checked results for MT/V5 localizers against our localizer for the lateral occipital complex (LOC) and found extensive overlap. Therefore, our reported results for MT/V5 do not exclude a contribution from LOC.
fMRI measurements
All scanning was performed on a 3-T head scanner (Siemens Allegra). Functional whole brain scans were collected using a gradient-echo echoplanar imaging sequence (EPI, T2*, TR/TE—2510/30 ms, field of view 192 × 192 mm, 64 × 64 matrix, voxel size 3 × 3 × 2.7 mm, gap 0.3 mm, 38 slices, prospective motion correction as implemented by Siemens, PACE). Slices were oriented ±23 deg obliquely to the horizontal plane.
Sagittal anatomical scans were acquired before functional scanning in each session (T1-weighted 3D MPRAGE as implemented on Allegra, TR/TE = 2300 / 4.38 ms, TI = 900 ms, flip angle 8°, spatial resolution 1 × 1 × 1 mm, NA = 1). These scans were used for later coregistration of the anatomical scans to the functional scans. In a separate session, an additional MPRAGE anatomical scan with higher signal-to-noise ratio with the same parameters as indicated above except NA = 2 was acquired for each subject for use in inflating and flattening procedures.
Data analysis and definition of regions of interest (ROIs)
Data analysis was performed using Brain Voyager™ QX software. fMRI preprocessing steps included 3D motion correction, slice scan time correction (elimination of slice-dependent time shifts and of systematic odd-even slice intensity differences caused by interleaved acquisition), temporal smoothing (high-pass 3 cycles per time course), and linear trend removal. Data were not spatially filtered. Preparation of the detailed anatomical scans included determination of Talairach coordinates, cortex reconstruction at the white-gray matter boundary, cortex inflation, and flattening. The intrasession anatomical scans were automatically aligned to the extrasession data set. Intrasession anatomical scans were roughly coregistered with the functional data on the basis of the Siemens slice position parameters and fine aligned with an automatic algorithm implemented in Brain Voyager QX software. BOLD responses were analyzed by applying a general linear model (GLM), taking into account a standard hemodynamic response function (two-Gamma HRF). We did not correct for serial correlations. Results of the GLM were superimposed onto the reconstructed brain of each subject. The results of a fixed effects analysis of the entire group were superimposed on the brain of one subject for visualization. Thresholding of the statistical maps relied on a false discovery rate of q < 0.05 as implemented in the Brain Voyager QX software (Genovese et al., 2002). This method is less conservative than the classical Bonferroni correction for multiple comparisons. A q value does not change the statistical map in any way but merely selects an appropriate statistical threshold ensuring the desired false discovery rate. Alternatively, we used the classical approach of p-values derived from t-statistics with the appropriate Bonferroni correction.
For statistical analysis of group results, we delineated regions of interest (ROIs) in retinotopic visual areas V1, V2, V3/VP, V3A, and V4 for all subjects taking into account the meridian and the eccentricity mapping procedures described in the Stimuli section. Figure 5 shows the regions for one of the subjects used in the study. Drawing borders between areas relied on the established correspondences between the borders and the representations of the horizontal and vertical meridians. The central boundaries of the retinotopic regions were delineated by the activation caused by the smallest ring of the eccentricity mapping (radius 0.8-2.3°) and therefore excluded the fovea. The outer borders of the activation by the second smallest annulus (radius 2.9-5.3°), which included the area of our stereo-stimulus, served to delineate the outer limit of the above named ROIs. For specification of area MT/V5, the region more strongly activated by moving than by static stimuli was used (thresholded p < 0.05 corrected, details of stimuli are described in the Retinotopy and localizers section). Resolution of our mapping procedures was insufficient to delineate the intraparietal area V7 and the caudal parietal disparity region (CPDR) described elsewhere. To account for activations beyond classical retinotopic areas, notably the intraparietal sulcus, we delineated two ROIs on the ascending branch of the intraparietal sulcus, naming the caudal part cIPS and the rostral part rIPS. cIPS includes the area adjacent to V3A that was activated by full field stimulations and hence includes regions V7 and CPDR. The rostral part was the remainder of the ascending intraparietal sulcus. All regions were marked on the surface of the individual inflated brains and then reimbedded into the cortical volume assuming a cortical width ranging from +3 to −1 mm from the white/gray matter boundary. The time courses of the sampled voxels for each ROI of each subject were exported and analyzed using in house software. Subsequently, corresponding regions of each subject were pooled for the group results. For normalization of the data between observers, the mean of the averaged run was set to 100%. The data were analyzed by applying a GLM using predictor time courses computed from the stimulation protocol on the basis of a linear model of the two-Gamma hemodynamic response function. The calculated beta values and contrasts between conditions correspond to percent signal change.
Figure 5.
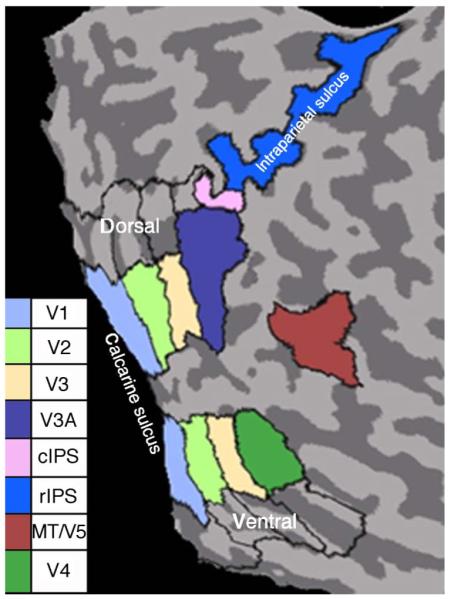
Visual regions of the right hemisphere of one individual subject used in the study, plotted on a flat map. Black lines include the whole field mapping result. Color filled areas are restricted to the areas including the outer border of ring 2 of the eccentricity mapping result, see also fMRI measurements section.
The Talairach coordinates of the principle ROIs used in this study are shown in Table 1.
Table 1.
Average Talairach coordinates of the individually localized regions of interest
| Region | x ± SD | y ± SD | z ± SD |
|---|---|---|---|
| Right | |||
| V1 | 8.4 ± 2.5 | −88 ± 1.9 | −3.3 ± 4.3 |
| V2v | 9.7 ± 2.5 | −79 ± 1.8 | −12 ± 3.3 |
| V2d | 16 ± 3.6 | −94 ± 1.6 | 6 ± 4.9 |
| VP | 18 ± 3.1 | −75 ± 2.8 | −13 ± 3.2 |
| V3d | 23 ± 4.2 | −90 ± 2.8 | 7.8 ± 4.4 |
| V3A | 30 ± 4.8 | −83 ± 3.5 | 11 ± 4.5 |
| V4 | 26 ± 2.4 | −71 ± 3.9 | −13 ± 3.2 |
| cIPS | 28 ± 4.3 | −76 ± 2.8 | 18 ± 6.4 |
| rIPS | 29 ± 3.6 | −62 ± 3.3 | 36 ± 4.4 |
| MT | 46 ± 3.2 | −62 ± 2.4 | 2.6 ± 4.9 |
| Left | |||
| V1 | −5.8 ± 2.6 | −89 ± 2.8 | −5.1 ± 7.9 |
| V2v | −8.8 ± 4.8 | −80 ± 2.9 | −13 ± 4.6 |
| V2d | −13 ± 4.7 | −97 ± 1.5 | 4 ± 8 |
| VP | −17 ± 5 | −77 ± 1.3 | −14 ± 3.8 |
| V3d | −21 ± 4.9 | −92 ± 2.7 | 6.6 ± 6.7 |
| V3A | −27 ± 4.3 | −85 ± 3 | 7.3 ± 5.8 |
| V4 | −25 ± 4.8 | −70 ± 2.9 | −13 ± 4.3 |
| cIPS | −26 ± 3.8 | −78 ± 5.9 | 16 ± 5.3 |
| rIPS | −25 ± 4.4 | −65 ± 4.2 | 35 ± 6.2 |
| MT | −45 ± 2.5 | −63 ± 3.5 | 2.6 ± 4.7 |
Results
In the first experiment (“attend to depth”), we instructed all observers to attend to the amount of depth present in each block and instructed subjects that they would have to indicate the depth distance in a test after the scanning. To that purpose, we developed and applied a specific test for stereo-depth outside of the scanner consisting of two dots that could be shifted in depth by the observer. Results showed that BOLD signals differed strongly between the static (control) condition and both the 2D and the 3D conditions in large parts of the occipital cortex as well as in the ventral and dorsal streams. Moreover, there was a significant difference between the activation during the 2D versus the depth condition, as is evident from the maps in Figure 6. The BOLD response was stronger during the depth condition than during the 2D condition in all areas for all but one observer, for whom the activation was negative in areas V1-V4. (Figure 7). For the group results, the difference was far more pronounced and significant for all areas except V1 and V2, especially in areas V3A, cIPS, rIPS, and MT.
Figure 6.

Single subject analysis of all observers of the experiment “attend to depth” presented on their flattened right hemisphere. Significance threshold show t-values at a significance level of a false discovery rate (fdr) <0.05 (for statistical details see Methods section). GLM contrast analysis detected regions during which activity was higher (shades of yellow) during the perception of the stereo stimulus rotating in depth (phase lag between eyes) than by the random flicker stimulus (2D, no phase lag between eyes). Negative activations (shades of blue) indicate areas more activated by the flicker stimulus. In early visual regions (V1 to V3), 7 out of 9 observers show patchy positive activations, whereas two observers show patchy negative activations. Please note extensive suppression in retinotopic regions beyond the outer border of the second smallest annulus >5.3°, i.e., beyond the edges of the stimulus shown (white arrows).
Figure 7.

fMRI response amplitudes (% BOLD signal modulation) generated by computing the average over all voxels in a given visual area for each subject participating in the experiment “attend to depth.” Differential contrast as described above. Positive values denote stronger activation during the condition with phase lag rotating in depth. The solid lines join the median observer in each ROI. Before analysis for areas V1 to V3, left/right/ventral/dorsal areas were combined; for all other areas, left/right was combined.
The high levels of activation in most ROIs in the “attend to depth” invites the interpretation that the effect of interocular delay is simply to make the stimulus more interesting to the subject (Huk, Ress, & Heeger, 2001) and has nothing to do with functional specialization of cortical areas. However, the increased activation caused by delay in the “attend to depth” condition was significantly greater in areas cIPS and MT than in V1 and V4 (Table 2), so it is not unselective for ROI. The smaller effect in V1 could be because there is less attentional modulation in early versus late areas (Yoshor, Ghose, Bosking, Sun, & Maunsell, 2007), although this is controversial (Ghandi, Heeger, & Boynton, 1999). However, the same cannot be said for area V4, which shows attentional modulation to colour, as does MT to motion (Chawla, Rees, & Friston, 1999). The stronger effect of delay in MT and cIPS than in V4 therefore suggests that it is the combination of delay, ROI, and attention that is important, not delay and attention alone.
Table 2.
Paired t tests carried out on the % signal change due to delay between various ROIs. For example, the cell containing t = 8.4 compares the signal change in V1 in the “attend to depth” condition with the change in cIPS in the same condition
| cIPS | MT | |
|---|---|---|
| V1 (attend depth) | t = 8.4 (***) | t = 4.4 (**) |
| V1 (attend digits) | t = 5.3 (***) | t = 4.0 (**) |
| V4 (attend depth) | t = 6.5 (***) | t = 3.7 (**) |
| V4 (attend digits) | t = 3.3 (**) | t = 3.3 (**) |
p < 0.01
p < 0.001.
To investigate further the effects of attention, we repeated the basic delay experiment with an attentionally demanding concurrent task in central vision (Huk et al., 2001). Before describing the results, we should like to express certain reservations about the technique. First, if a competing central attentional task abolishes or reduces the signal contrast in a particular ROI, this does not necessarily mean that the effect previously found in that area was due to attention alone. It shows that attention is necessary; not that it is sufficient. For example, the signal-noise ratio may be too small for the effect of the stimulus to be found in the absence of attentional amplification. Second, even if the effect of the stimulus is still found with the attentional control, this does not mean that it is independent of attentional modulation. Unless we show by a secondary task involving the ROI that d' = 0 (which Huk et al., 2001, did not do), it is possible that the primary task leaves over sufficient attention to be modulated by the stimulus. Given these problems in interpreting the attentional control experiment, we conclude that the key issue is not whether attention is involved with the stimulus contrast but whether it is specific to the ROI, as in our case it is (Table 2).
In our version of the attentional control experiment (“attend to digits”), subjects fixated the center of the display, and the task consisted of counting the number of digits present in a continuous stream of (mostly) letters presented at the center of the display instead of the central fixation point and to communicate this number after the end of the run as outlined in the Methods section.
Individual data (shown in Figure 8) revealed that six out of seven observers showed a negative contrast in V1 and similar results in V2, V3, and V4. In dorsal areas, the pattern changed in the direction of a positive depth–2D contrast. Paired t tests (Table 2) showed highly significant differences between MT and cIPS on the one hand and V1 and V4 on the other. We can therefore conclude that even with an attentionally demanding central task, interocular delay was modulating the response in areas MT and cIPS differently from V1 and V4. This could be due either to a deactivation of V1 and V4 by delay or an activation of cIPS and MR by delay or to both factors acting in opposite directions. To see whether activations or deactivations were more important, we carried out t tests in all four ROIs with the null hypothesis that the mean signal change was zero. Results were not clear-cut. The decrease in V1 just failed to reach conventional levels of significance (t = 1.86, p = 0.056 one tailed), while that in V4 was just significant (t = 2.09, p = 0.04 one tailed). The increase in cIPS was significant (t = 2.6; p = 0.02 one tailed), while that in MT was not (t = 1.56, p = 0.08 one tailed).
Figure 8.

fMRI response amplitudes (% BOLD signal modulation) of all observers participating in the experiment “attend to digits.”
Paired t test comparisons were carried out on observers who served in both conditions. There was a significant decrease in activity in the “attend to digits” task relative to attend to depth in all areas: V1 (0.036), V2 (0.014), V3 (0.003), V4 (0.004), V3A (0.004), cIPS (0.009), rIPS (0.003), MT (0.003).
Discussion
Our main novel findings are (a) that interocular delay leads to a larger increase in the BOLD response in visual area MT than in early visual areas like V1, when the observer is attending to depth, and (b) that when observers are not attending to depth, interocular delay tends to cause a decrease in the BOLD response in early visual areas and an increase in cIPS and MT. Our main findings confirming previous reports are (a) that directed visual attention to the stimulus causes a large increase in the BOLD response in many visual areas and (b) that a specific increase due to stereo-depth is found in areas V3A and cIPS (Backus et al., 2001; Tsao et al., 2003).
From the flat maps, there was a curious absence of the depth effect in foveal areas, even in the “attend to depth” condition. A possible explanation is that observers were instructed to maintain fixation at all times. In the absence of depth, this may have led to a concentration of attention to the fovea. When depth was introduced some of this attention may have been diverted into the periphery, lowering the BOLD response in the fovea and counter-acting the recruitment of depth-sensitive mechanisms. An alternative, speculative, interpretation is that the relevant mechanisms are more strongly represented in the parafovea and periphery than in the fovea itself, but no relevant threshold measurements with delay-defined depth have, to our knowledge, been performed.
We cannot be certain the interocular delay caused a decreased response in V1 because the effect just failed to reach conventional levels of significance. However, a reduction of the BOLD response in V1 when the pattern becomes more organized is not unprecedented (Murray, Kersten, Olshausen, Schrater, & Woods, 2002). One possible explanation might be thought to be that the change from 2D to 3D structure attracts attention away from the fovea and thus decreases the BOLD response in foveally dominated ROIs (see the preceding paragraph). However, this cannot be the explanation of the reduction in early visual areas since the fovea was excluded from the ROI in these cases. We therefore considered three other explanations for the paradoxical decrease in activity in V1 when delay is introduced. The first is that more neurones in V1 are tuned to zero and near-zero disparities than to planes nearer or further from the fixation plane. This supposition is consistent with the higher stereoacuity for stimuli near to the fixation plane (Badcock & Schor, 1985; Blakemore, 1970; Westheimer & McKee, 1978). To explain why attention to depth reverses this effect, it must be supposed that this stimulus-driven effect is outweighed by a general top-down effect of attention. The observer has been instructed to remember the depth when it is present and may well lose attention to the stimulus when the depth disappears in the “2D” condition. A generalized top-down effect of attention and memory cannot be the only explanation of the effect of interocular delay, however, since we also find an increase due to delay without attention in later areas like MT and cIPS.
The second possible explanation is that the BOLD signal in the absence of attention to depth reflects the activity of neurones carrying out linear summation between the inputs from the two eyes. The modulation depth of such units summating two out-of-phase sinusoids will be less than when summating two in-phase sinusoidal signals. However, this model can probably be rejected, even for simple cells, since binocular interaction fields of most simple cells, at any rate in cat, are well described as the product, not the sum, of left and right eye RFs (Anzai, Ohzawa, & Freeman, 2001). The model is equally inconsistent with energy models of disparity processing by complex cells (Qian & Anderson, 1997). In any case, the model would have to suppose a larger number of units tuned to zero phase difference and is thus a special case of the first model (above).
The final explanation we consider is interocular rivalry. We recall that the depth was produced by a phase lag in the sinusoidal modulation of luminance in the two eyes. A priori this is a stimulus that might be expected to evoke binocular rivalry, just as much as stereopsis. Consider the sign of the contrast boundary between any two neighboring elements in the pattern (Figure 1a). At a certain phase of the modulation, the elements on either side of this boundary must have the same luminance and the boundary thus disappears. If the stimulus in the other eye is identical, the boundary will disappear at the same instant. However, if the eyes are out of phase (the depth condition), there will still be a boundary present in one of the eyes and thus a potential for rivalry. Suppose now that the congruent stimulus between the eyes produces a larger BOLD response than the rivalrous stimulus, for which there is some support in the fMRI rivalry literature (Lee & Blake, 2002). This might produce a greater response in our “2D” condition than in our “depth” condition, provided that the decrement in response due to rivalry is greater than the increment due to the recruitment of neurones analyzing depth. Differences in this balance might produce the differences between subjects that we have observed.
Our finding that the BOLD response in MT is increased by introducing depth into the stimulus is in agreement with the findings of Neri et al. (2004) for absolute disparity, but not with Tsao et al. (2003), who found little effect in human and none in macaques. Our stimulus was designed to stimulate the neurones in MT that are jointly tuned to motion direction and depth plane (Cumming & Parker, 1999; DeAngelis & Newsome, 1999) and would appear to have been successful. Note that the introduction of an interocular delay into the stimulus causes it not only to appear in depth but to have a horizontal movement. In the absence of delay, the stimulus is globally motion balanced, like a counterphasing grating, and would thus not be expected to be a good stimulus for MT (Heeger, Boynton, Demb, Seidemann, & Newsome, 1999).
The need to explain Pulfrich-like phenomena with neurons jointly tuned to disparity and motion has recently been questioned by Read and Cumming (2005). Echoing a previous suggestion by Tyler (1974), Read and Cumming argue that Pulfrich-type stimuli, including dynamic noise with interocular delay, contain correlations between disparity and motion direction, but that jointly tuned neurons are not logically required to detect these correlations. Logically they are correct, but some mechanism for detecting the correlations must exist. A likely candidate are the neurones jointly tuned to disparity and motion direction in MT. Showing that MT is activated by stimuli in which depth and motion are correlated was an additional motivation for this study.
Our data are in accord with other studies implicating V3A and cIPS in depth processing. Our overall conclusion, then, is that the mechanisms for processing dynamic disparity through temporal phase differences are not different, at the level of spatial resolution of fMRI, from mechanisms for processing static disparity. This conclusion agrees with previous models of delay processing (Morgan & Fahle, 2000) and is in accord with a general model attributing stereoscopic processing to spatiotemporal phase differences in receptive field tuning between the eyes (Anzai et al., 2001).
Acknowledgments
We thank Manfred Fahle for support and discussion. Supported by a grant from the Wellcome Trust to MJM.
Footnotes
Commercial relationships: none.
Contributor Information
Karoline Spang, Human Neurobiology, University of Bremen, Germany kspang@uni-bremen.de http://www.humanbio.uni-bremen.de/.
Michael Morgan, Optometry and Visual Science, City University, London, UK m.morgan@city.ac.uk http://www.cns.nyu.edu/corefaculty/jones.html.
References
- Adelson EH, Bergen JR. Spatiotemporal energy models for the perception of motion. Journal of the Optical Society of America A, Optics and Image Science. 1985;2:284–299. doi: 10.1364/josaa.2.000284. [DOI] [PubMed] [Google Scholar]
- Anzai A, Ohzawa I, Freeman RD. Joint-encoding of motion and depth by visual cortical neurons: Neural basis of the Pulfrich effect. Nature Neuroscience. 2001;4:513–518. doi: 10.1038/87462. [DOI] [PubMed] [Google Scholar]
- Backus BT, Fleet DJ, Parker AJ, Heeger DJ. Human cortical activity correlates with stereoscopic depth perception. Journal of Neurophysiology. 2001;86:2054–2068. doi: 10.1152/jn.2001.86.4.2054. [DOI] [PubMed] [Google Scholar]
- Badcock DR, Schor CM. Depth-increment detection function for individual spatial channels. Journal of the Optical Society of America A, Optics and Image Science. 1985;2:1211–1216. doi: 10.1364/josaa.2.001211. [DOI] [PubMed] [Google Scholar]
- Barlow HB, Blakemore C, Pettigrew JD. The neural mechanism of binocular depth discrimination. The Journal of Physiology. 1967;193:327–342. doi: 10.1113/jphysiol.1967.sp008360. [DOI] [PMC free article] [PubMed] [Google Scholar]
- Blakemore C. The range and scope of binocular depth discrimination in man. The Journal of Physiology. 1970;211:599–622. doi: 10.1113/jphysiol.1970.sp009296. [DOI] [PMC free article] [PubMed] [Google Scholar]
- Burr DC, Ross J. How does binocular delay give information about depth? Vision Research. 1979;19:523–532. doi: 10.1016/0042-6989(79)90137-8. [DOI] [PubMed] [Google Scholar]
- Chawla D, Rees G, Friston KJ. The physiological basis of attentional modulation in extra-striate visual areas. Nature Neuroscience. 1999;2:671–676. doi: 10.1038/10230. [DOI] [PubMed] [Google Scholar]
- Cumming BG, Parker AJ. Binocular neurons in V1 of awake monkeys are selective for absolute, not relative, disparity. Journal of Neuroscience. 1999;19:5602–5618. doi: 10.1523/JNEUROSCI.19-13-05602.1999. [DOI] [PMC free article] [PubMed] [Google Scholar]
- DeAngelis GC. Seeing in three dimensions: The neurophysiology of stereopsis. Trends in Cognitive Sciences. 2000;4:80–90. doi: 10.1016/s1364-6613(99)01443-6. [DOI] [PubMed] [Google Scholar]
- DeAngelis GC, Newsome WT. Organization of disparity-selective neurons in macaque area MT. Journal of Neuroscience. 1999;19:1398–1415. doi: 10.1523/JNEUROSCI.19-04-01398.1999. [DOI] [PMC free article] [PubMed] [Google Scholar]
- DeAngelis GC, Ohzawa I, Freeman RD. Depth is encoded in the visual cortex by a specialized receptive field structure. Nature. 1991;352:156–159. doi: 10.1038/352156a0. [DOI] [PubMed] [Google Scholar]
- DeAngelis GC, Ohzawa I, Freeman RD. Neuronal mechanisms underlying stereopsis: How do simple cells in the visual cortex encode binocular disparity? Perception. 1995;24:3–31. doi: 10.1068/p240003. [DOI] [PubMed] [Google Scholar]
- Dvorak V. Versuche uber die nachbilder von reizveranderungen. Sitzungsberichte der Wiener Akademie der Wissenschaften. 1870;61:257–262. [Google Scholar]
- Fischer B, Poggio GF. Depth sensitivity of binocular cortical neurons of behaving monkeys. Proceedings of the Royal Society of London B: Biological Sciences. 1979;204:409–414. doi: 10.1098/rspb.1979.0036. [DOI] [PubMed] [Google Scholar]
- Genovese CR, Lazar NA, Nichols T. Thresholding of statistical maps in functional neuro-imaging using the false discovery rate. Neuroimage. 2002;15:870–878. doi: 10.1006/nimg.2001.1037. [DOI] [PubMed] [Google Scholar]
- Ghandi SP, Heeger DJ, Boynton GM. Spatial attention affects brain activity in primary visual cortex. Proceedings of the National Academy of Sciences of the United States of America. 1999;96:3314–3319. doi: 10.1073/pnas.96.6.3314. [DOI] [PMC free article] [PubMed] [Google Scholar]
- Grill-Spector K, Kushnir T, Hendler T, Edelman S, Itzchak Y, Malach R. A sequence of object-processing stages revealed by fMRI in the human occipital lobe. Human Brain Mapping. 1998;6:316–328. doi: 10.1002/(SICI)1097-0193(1998)6:4<316::AID-HBM9>3.0.CO;2-6. [DOI] [PMC free article] [PubMed] [Google Scholar]
- Heeger DJ, Boynton GM, Demb JB, Seidemann E, Newsome WT. Motion opponency in visual cortex. Journal of Neuroscience. 1999;19:7162–7174. doi: 10.1523/JNEUROSCI.19-16-07162.1999. [DOI] [PMC free article] [PubMed] [Google Scholar]
- Huk AC, Ress D, Heeger DJ. Neuronal basis of the motion aftereffect reconsidered. Neuron. 2001;32:161–172. doi: 10.1016/s0896-6273(01)00452-4. [DOI] [PubMed] [Google Scholar]
- Julesz B. Foundations of cyclopean perception. University of Chicago Press; Chicago: 1971. [Google Scholar]
- Lee SH, Blake R. V1 activity is reduced during binocular rivalry. Journal of Vision. 2002;2(9):4, 618–626. doi: 10.1167/2.9.4. http://journalofvision.org/2/9/4/, doi:10.1167/2.9.4. [DOI] [PubMed] [Google Scholar]
- Marr D, Poggio T. Cooperative computation of stereo disparity. Science. 1976;194:283–287. doi: 10.1126/science.968482. [DOI] [PubMed] [Google Scholar]
- Marr D, Poggio T. A computational theory of human stereo vision. Proceedings of the Royal Society of London B: Biological Sciences. 1979;204:301–328. doi: 10.1098/rspb.1979.0029. [DOI] [PubMed] [Google Scholar]
- Morgan MJ, Fahle M. Motion-stereo mechanisms sensitive to inter-ocular phase. Vision Research. 2000;40:1667–1675. doi: 10.1016/s0042-6989(00)00016-x. [DOI] [PubMed] [Google Scholar]
- Morgan MJ, Thompson P. Apparent motion and the Pulfrich effect. Perception. 1975;4:3–18. doi: 10.1068/p040003. [DOI] [PubMed] [Google Scholar]
- Morgan MJ, Tyler CW. Mechanisms for dynamic stereomotion respond selectively to horizontal velocity components. Proceedings of the Royal Society B: Biological Sciences. 1995;262:371–376. doi: 10.1098/rspb.1995.0219. [DOI] [PubMed] [Google Scholar]
- Morgan MJ, Ward R. Interocular delay produces depth in subjectively moving noise patterns. Quarterly Journal of Experimental Psychology. 1980;32:387–395. doi: 10.1080/14640748008401833. [DOI] [PubMed] [Google Scholar]
- Murray SO, Kersten D, Olshausen BA, Schrater P, Woods DL. Shape perception reduces activity in human primary visual cortex. Proceedings of the National Academy of Sciences of the United States of America. 2002;99:15164–15169. doi: 10.1073/pnas.192579399. [DOI] [PMC free article] [PubMed] [Google Scholar]
- Neri P, Bridge H, Heeger DJ. Stereoscopic processing of absolute and relative disparity in human visual cortex. Journal of Neurophysiology. 2004;92:1880–1891. doi: 10.1152/jn.01042.2003. [DOI] [PubMed] [Google Scholar]
- Nikara T, Bishop PO, Pettigrew JD. Analysis of retinal correspondence by studying receptive fields of binocular single units in cat striate cortex. Experimental Brain Research. 1968;6:353–372. doi: 10.1007/BF00233184. [DOI] [PubMed] [Google Scholar]
- Parker AJ, Krug K, Cumming BG. Neuronal activity and its links with the perception of multi-stable figures. Philosophical Transactions of the Royal Society of London B: Biological Sciences. 2002;357:1053–1062. doi: 10.1098/rstb.2002.1112. [DOI] [PMC free article] [PubMed] [Google Scholar]
- Pettigrew JD, Nikara T, Bishop PO. Binocular interaction on single units in cat striate cortex: Simultaneous stimulation by single moving slit with receptive fields in correspondence. Experimental Brain Research. 1968;6:391–410. doi: 10.1007/BF00233186. [DOI] [PubMed] [Google Scholar]
- Poggio GE. Mechanisms of stereopsis in monkey visual cortex. Cerebral Cortex. 1995;5:193–204. doi: 10.1093/cercor/5.3.193. [DOI] [PubMed] [Google Scholar]
- Pulfrich C. Die Stereoscopie im Dienste der isochromen und heterochromen Photometrie. Naturwissenschaft. 1922;10:553–564. [Google Scholar]
- Qian N, Anderson RA. A physiological model for motion-stereo integration and a unified explanation of Pulfrich-type phenomena. Vision Research. 1997;37:1683–1698. doi: 10.1016/s0042-6989(96)00164-2. [DOI] [PubMed] [Google Scholar]
- Read JC, Cumming BG. All Pulfrich-like illusions can be explained without joint encoding of motion and disparity. Journal of Vision. 2005;5(11):1, 901–927. doi: 10.1167/5.11.1. http://journalofvision.org/5/11/1/, doi:10.1167/5.11.1. [DOI] [PubMed] [Google Scholar]
- Regan D. Visual processing of four kinds of relative motion. Vision Research. 1986;26:127–145. doi: 10.1016/0042-6989(86)90076-3. [DOI] [PubMed] [Google Scholar]
- Ross J. Stereopsis by binocular delay. Nature. 1974;248:363–364. doi: 10.1038/248363a0. [DOI] [PubMed] [Google Scholar]
- Tsao DY, Vanduffel W, Sasaki Y, Fize D, Knutsen TA, Mandeville JB, et al. Stereopsis activates V3A and caudal intraparietal areas in macaques and humans. Neuron. 2003;39:555–568. doi: 10.1016/s0896-6273(03)00459-8. [DOI] [PubMed] [Google Scholar]
- Tyler CW. Stereopsis in dynamic visual noise. Nature. 1974;250:781–782. doi: 10.1038/250781a0. [DOI] [PubMed] [Google Scholar]
- Tyler CW. A stereoscopic view of visual processing streams. Vision Research. 1990;30:1877–1895. doi: 10.1016/0042-6989(90)90165-h. [DOI] [PubMed] [Google Scholar]
- Westheimer G. The spatial sense of the eye. Proctor lecture. Investigative Opthalmology & Visual Science. 1979;18:893–912. [PubMed] [Google Scholar]
- Westheimer G, McKee SP. Steroscopic acuity for moving retinal images. Journal of the Optical Society of America. 1978;68:450–455. doi: 10.1364/josa.68.000450. [DOI] [PubMed] [Google Scholar]
- Westheimer G, McKee SP. What prior uniocular processing is necessary for stereopsis? Investigative Ophthalmology & Visual Science. 1979;18:614–621. [PubMed] [Google Scholar]
- Wheatstone C. Contributions to the physiology of vision. Part the first. On some remarkable, and hitherto unobserved, phenomena of binocular vision. Philosophical Transactions of the Royal Society of London B: Biological Sciences. 1838;2:371–393. [Google Scholar]
- Yoshor D, Ghose GM, Bosking WH, Sun P, Maunsell JH. Spatial attention does not strongly modulate neuronal responses in early human visual cortex. Journal of Neuroscience. 2007;27:13205–13209. doi: 10.1523/JNEUROSCI.2944-07.2007. [DOI] [PMC free article] [PubMed] [Google Scholar]