Abstract
The difficulty in identifying the toxic agents in all amyloid-related diseases is likely due to the complicated kinetics and thermodynamics of the nucleation process and subsequent fibril formation. The slow progression of these diseases suggests that the formation, incorporation and/or action of toxic agents is possibly rate limiting. Candidate toxic agents include precursors (some at very low concentrations), also called oligomers and protofibrils, and the fibrils. Here, we investigate the kinetic and thermodynamic behavior of human insulin oligomers (imaged by cryo-EM) under fibril forming conditions (pH 1.6 and 65°C) by probing the reaction pathway to insulin fibril formation using two different types of experiments – cooling and seeding – and confirm the validity of the nucleation model and its effect on fibril growth.
The results from both the cooling and seeding studies confirm the existence of a time-changing oligomer reaction process prior to fibril formation that likely involves a rate-limiting nucleation process followed by structural rearrangements of intermediates (into β-sheet rich entities) to form oligomers that then form fibrils. The latter structural rearrangement step occurs even in the absence of nuclei (i.e. with added heterologous seeds). Nuclei are formed at the fibrillation conditions (pH 1.6 and 65°C) but are also continuously formed during cooling at pH 1.6 and 25°C. Within the time-scale of the experiments, only after increasing the temperature to 65°C are the trapped insulin nuclei and resultant structures able to induce the structural rearrangement step and overcome the energy barrier to form fibrils. This delay in fibrillation and accumulation of nuclei at low temperature (25°C), result in a decrease in the mean length of the fibers when placed at 65°C. Fits of an empirical model to the data provide quantitative measures of the delay in the lag-time during the nucleation process and subsequent reduction in fibril growth rate resulting from the cooling. Also the seeding experiments, within the time-scale of the measurements, demonstrate that fibers can initiate fast fibrillation with dissolved insulin (fresh or taken during the lag-period) but not with other fibers. Qualitatively this is explained with a conjectual free energy-space plot.
Introduction
Since there is really no clear understanding of the molecular basis for more than 20 amyloid diseases including Huntington's, Parkinson's, prion, type II diabetes etc, it seems reasonable to investigate the changes that amyloid proteins undergo during the nucleation and fibril growth process.1,2 Although the proteins associated with each amyloid disease are structurally different3,4 and do not share complete sequence homology, their fibrillation responses are fairly similar and they form insoluble filaments that exhibit very similar structural properties.5 Using sequence homology searches, Gazit and co-workers have reported that most amyloid proteins/peptides contain aromatic amino acids near their termini.3 Amyloid fibers are linear, non-branched comprising protofilaments wound around one another. The protofilaments have a similar diameter (60–100 Å) irrespective of the precursor protein, and are characterized by their continuous antiparallel hydrogen-bonded β-sheet structure with ∼11 Å gaps between the β-sheets.6-8 The typical fibril formation process is characterized by a lag phase in which the nucleation process proceeds and no detectable fibers are formed, an explosive elongation/broadening phase in which different diameters and lengths of fiber are formed over a time period often shorter than the lag phase, and a saturation phase when elongation/broadening is terminated as most soluble proteins are converted into fibrils.9-13 The period for the lag phase and the apparent fibril growth rate depend upon factors such as the initial protein concentration, pH and ionic strength of the solution, the addition of seeds and foreign surfaces, and the intensity of agitation.14-17
Recently, oligomers have been proposed as possible toxic agents responsible for disease.18-20 However, exactly which species (monomer, dissolved oligomers, protofibrils and fibrils) or structures are the pathogenic agents that cause disease remains unknown.21 Thus, information about the stability and behavior of oligomers and the formation of the nucleus during amyloid fibrillation is critical as these structures trigger fibrillation.22,23 Given the very recent significant finding that clearing the disease associated amyloid aggregates from the brain of Alzheimer's patients does not alleviate disease progression24,25, the need to isolate and test “small oligomeric forms that may be particularly toxic” becomes more urgent. The work reported in this paper addresses these small oligomeric forms. In earlier work, using Small Angle Neutron Scattering (SANS) to measure the temporal formation of insulin oligomers, we showed that although the time required to form the nucleus is dependent on a specific system (environmental conditions), they all follow a universal pathway for nucleus and precursor formation.26 We also propose a simple end-on-end association followed by side-on-side association model that describes the growth of oligomers under a wide range of environmental conditions.
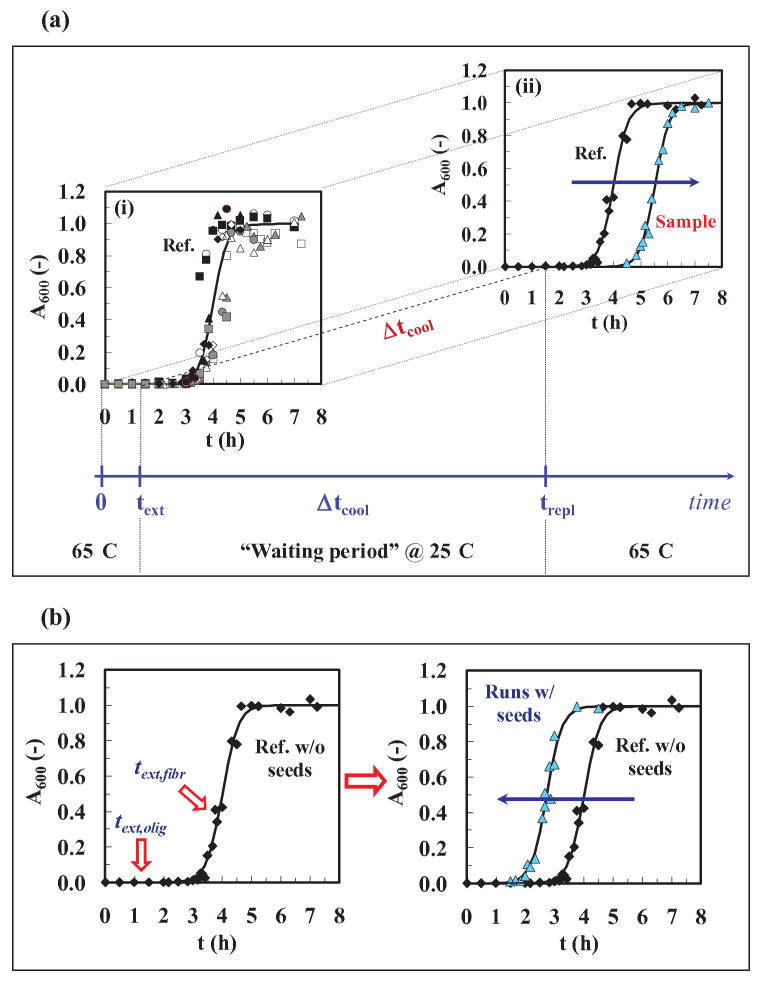
In the work reported here, we take a different tack. Specifically, we ask about the conversion reaction path from native insulin to structurally rearranged intermediates (nucleus and oligomers) to β-sheet rich fibrils. Does the reaction involve a continuous change with time? Is this a nucleation reaction for insulin as suggested by Waugh et al. (1953), Vestergaard et al. (2007) and Nayak et al. (2008)?26-28 How fast do the oligomers convert to intermediates and then to fibers? Can we isolate oligomers along this pathway and if so provide the possibility to test them for toxicity with neuronal cells? For this study, we choose a well-known well-studied model amyloid protein, human insulin, that has been extensively tested in vitro by others as a model amyloid protein.15,29-32 Cryo-electron microscopy (Cryo-EM) is used here to supplement our earlier SANS experiments and to verify the existence of larger structural entities (oligomers) of insulin. Using cooling and seeding protocols mainly to interrogate the amyloid reaction for insulin under fibril-forming conditions at pH 1.6 and 65°C, we attempt to answer these critical questions. In order to compare the effects of cooling and seeding, we analyze the typical sigmoidal fibrillation curve via the time to initiate fibril formation (lag-time, tlag) and the behavior of the fibril growth curve (slope, kapp, and end-asymptote, A600, asym) are measured from experimental fibrillation curves and estimated by a fit of an empirical expression (Fig. 1).
Figure 1.
Protocols for the experiments: (a) The cooling experiment. (1) text (extraction time) to remove samples from the heater at 65±2°C and pH 1.6 (1.5 h was the time chosen). (2) Δtcool (cooling time at 25±2°C and pH 1.6) for different times up to 28 days, and (3) trepl (replacement time) to replace the cooler samples into 65±2°C and pH 1.6. For graph (i), the standard kinetic curve ( ) was obtained by fitting Eq. (2) to averaged data from twelve different runs. The values of the parameters from the model fit using Eq. (2) were: tlag = 3.47 h, t50 = 4 h, kapp = 3.76 h-1 (R2=0.983). For graph (ii), we used averaged data for the standard kinetic experiment (◆) and for cooled and re-heated samples (
 ). (b) The seeding experiment. (1) Left figure: text,olig/fiber (extraction time for oligomer or fiber) is the time at which samples are removed from a run at 65±2°C and pH 1.6, and (2) Right figure: sigmoidal curves with and without seeds. Averaged data were used for the standard kinetic experiment (◆) and for a seeded run (
 ). Model fits using Eq. (2) (
 ).
).
Experimental
Materials
Protein
Human recombinant insulin (r-Ins) was provided by Novo Nordisk A/S, Denmark. Native r-Ins has a molecular weight of 5,808 Da with 51 amino acids and consists of two amino acids chains, linked together by 2 disulphide bonds. Insulin can exist as a monomer (the biologically active form of the hormone), dimer (at 65±2°C and pH 1.6) or hexamer (when excreted from the spleen) depending on the solution conditions. Its isoelectric point is ∼ 5.6.33 The aqueous buffer contained 100 mM NaCl and 25 mM HCl and was titrated with diluted HCl to pH 1.6. The buffer was filtered prior to use through a 0.22 μm poly(ether sulfone) membrane filter (Millipore Corp., Bedford, MA).
Reagents
NaCl and HCl were certified ACS reagent grade (Fisher Scientific, Pittsburgh, PA and Sigma-Aldrich, St. Louis, MO, respectively).
Methods
The standard protocol for insulin fibrillation
Each kinetic experiment was run with fresh insulin solution that was prepared immediately prior to use. The standard kinetic protocol for this work was performed with 2 mg/mL insulin solution in the buffer (pH 1.6) using glass vials kept at 65±2°C. By monitoring the increase in suspended matter via absorbance at 600 nm (A600) at different times, sigmoidal curves for fibril production were obtained. The extracted samples were centrifuged (14.000 rpm, 15 min) to remove the fibrils and assayed for the soluble fractions at A280. A calibration curve for the A280 measurements was prepared using insulin solutions of known concentrations and a linear calibration was obtained with A280 = 0.810 [Cins] (where [Cins], the concentration of insulin, is in mg/mL) with R2 = 0.999. Absorbance readings were performed using a UV–vis spectrophotometer (Hitachi U-2000, Hitachi High Technologies America, Inc., San Jose, CA).
Cooling
In order to determine the effect of cooling on an insulin sample in the midst of a run and prior to the onset of fibril formation, i.e. the appearance of a positive A600 signal at ∼3.5 h, a series of samples were taken for one extraction time text, (1.5 h), cooled from 65±2°C to 25±2°C and held at this temperature for different cooling periods, Δtcool (1, 4, 7, 14, 24 and 28 d) and then returned to their original temperature of 65±2°C at time, trepl. A second series of similar experiments were run for one cooling time, Δtcool (28 d) at different extraction times, text, (0.5, 1, 1.5, 2 and 2.5 h). All the samples were kept at their initial pH of 1.6. A schematic of the first cooling procedure is shown in Fig. 1a.
Seeding
As mentioned earlier, seeding experiments have been extensively used to demonstrate that the nucleation process can be speeded up in the presence of seeds. Three types of seeding experiments were undertaken: (i) Seeding a new insulin run by adding dissolved oligomers from a previous run while keeping the total insulin concentration at 2 mg/ml. (ii) Seeding washed suspended fibrils by adding different amounts of additional insulin. (iii) Seeding washed suspended fibrils by adding other washed fibrils in the absence of dissolved insulin. Here, we ask two new questions. First, does a seed taken at different extraction times, text, affect the nucleation process differently or alternately, how does the advancing oligomer reaction influence fibrillation? Second, do seeds seed seeds or are they only effective in seeding dissolved species? To help answer the first question, insulin samples, at 65±2°C and pH 1.6, were taken at different extraction times, text,i (0.5, 1, 1.5, 2 and 2.5 h) and prior to the onset of fibril formation (<∼3.5 h) and placed back into a solution of a new insulin run (65±2°C and pH 1.6) at time equal to zero, while keeping the total insulin concentration constant at 2 mg/ml. We also added increasing amounts of insulin (10-40 mg) to a constant amount of fresh washed fibers to test for their effect on fibrillation. For the second question, insulin samples, at 65±2°C and pH 1.6, were taken at different extraction times, text,i (3.5, 3.8 and 4 h) and after the onset of fibril formation (>∼ 3.5 h), removed, centrifuged, washed with clean buffer and placed into a solution containing only washed fibrils (65±2°C and pH 1.6), collected after 7 hours at the end of the fibrillation process. A schematic of the first seeding procedure is shown in Fig. 1b.
Measurement of fibril lengths
Images of insulin fibrils were obtained with an atomic force microscope (MFP-3D, Asylum Research, Santa Barbara, CA) and standard Si cantilevers (AC240TS, Olympus America Inc., Center Valley, PA). Each sample was diluted 1:100 with deionized water and then an aliquot of 20 μL was placed on a mica surface for adsorption for 10 min. Nonadsorbed protein was washed away with deionized water. Three dimensional measurements at the nanometer scale were collected in air using the tapping mode technique of AFM and analyzed with IGOR Pro 5 (WaveMetrics, Inc., Lake Oswego, OR).
Cryo-electron microscopy
To prepare electron microscope grids, we followed the protocol described by Grassucci et al. (1988)34. A 300-mesh copper grid was used with thick (approximately 800 Å) holey carbon on top of which was floated a fresh layer of thin (approximately 200 Å) carbon. In order to have a uniform hydrophilic surface, the grids were glow-discharged with air for 25 s and then mounted on a freeze-plunging apparatus. A 5 μL droplet of insulin solution was placed on the grid and, after blotting the buffer excess, the grid was rapidly immersed in liquid ethane or propane to preserve the biological material in a frozen-hydrated state. By maintaining specimens at a temperature (approx. -180°C) close to that of liquid nitrogen (-193°C), the sample was finally transferred into the high-vacuum of the electron microscope column. It was then visualized using a FEI F20 Cryo-electron microscope at approx. 100,000 × magnification.
Theory
Empirical expression
To quantitatively describe the fibrillation process (sigmoidal curve), we used the approach of Nielsen et al. (2001)15, based on an empirical expression describing of the process and assigning meaning to the parameters (lag time, tlag and slope or rate of fibril growth, kapp), where
| (1) |
This can be simplified by assuming yi = mi = 0, and considering only the rise part of the curve (i.e. only when fibrils are formed), and mf = 0 (i.e. the assymptote is horizontal without slope). Hence,
| (2) |
where A600 (-) is the absorbance reading at 600 nm, A600,asym (-) is the asymptotic absorbance reading at 600 nm at the end of the fibrillation process, t (h) is the time, t50 (h) marks the middle of the fibrillation process and τ (h), the normalization constant, is representative of the sigmoid curve slope during the fibril growth phase. In order to estimate the goodness of fit, Eq. (2) can be linearized as
| (3) |
where kapp = 1/τ (h-1). Knowing t50 or A600,asym from experiment and measuring A600 with t, one estimates, from a fit of Eq. (3) to the data, the two fitting parameters, kapp and A600,asym or t50. Then tlag is obtained from
| (4) |
which is a measure along the horizontal time axis of the reaction time prior to fibril formation and is a critical parameter of this study. In the standard kinetic experiment (control), tlag ∼ 3.34 ± 0.16 h for the first appearance of fibrils.
Results and Discussion
Imaging of oligomers using EM
The focus of both cooling and seeding experiments was on the reaction process prior to fibril formation. As presented previously26, using SANS we were able to detect compression of the structural entities of insulin (i.e. an increase of the molecular weight and a smaller increase of the radius of gyration) during the lag phase, suggesting the formation of oligomers. To strengthen this evidence, we imaged samples taken at different time points during the pre-fibrillation process, and prior to fibril formation, using a cryo-electron microscopy (Fig. 2). These results (Fig. 2a-c) qualitatively confirmed the increase of size of different oligomers prior to fibril formation. On the other hand, we were not able to quantify and relate this increase in size with time, since each sample was a complex mixture of different species. Meanwhile, we have detected circular structures (Fig. 2d), similar in shape and size to those proposed by Quist et al. (2005) for several different amyloids.18
Figure 2.
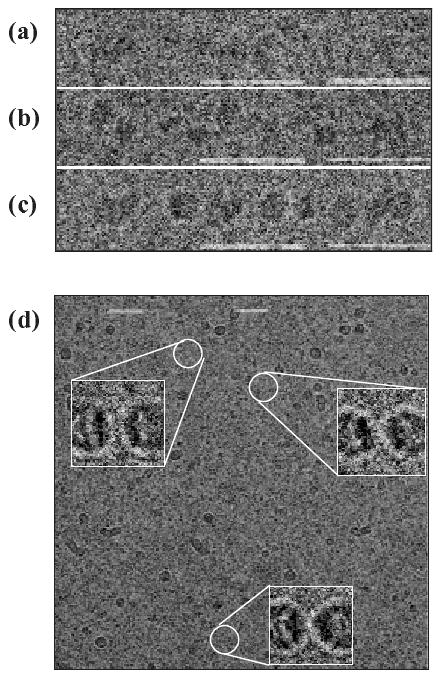
Gallery of electron cryo-microscopy of selected insulin oligomers, collected at different time points during the standard fibrillation process and prior to the unset of fibril formation: (a) 0, (b) 1.5 and (c-d) 3 hours. Inserts in (d) are enlargement by ∼ 4 times. Bar size = 50 nm.
Given these new imaging results and those from SANS for the formation of oligomers during the lag phase, we present here complementary results for two cooling and two seeding experiments. Definitions for the parameters text, Δtcool and trepl are given in Fig. 1 and defined in its legend.
Single extraction time cooling experiment
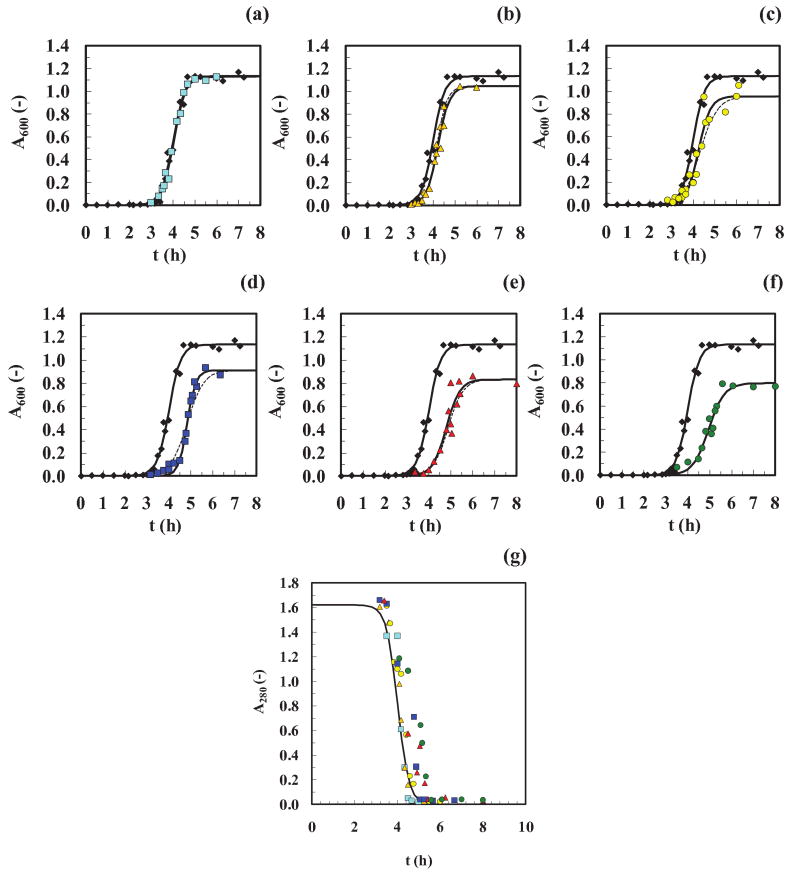
For the cooling experiments, we first present the results at one text = 1.5 h for Δtcool from 1, 4, 7, 14, 24 to 28 d, and then summarize the results for one Δtcool at 28 d at five extraction times, text = 0.5, 1, 1.5, 2 and 2.5 h. The data for text = 1.5 h (shifted by text = 1.5 h to the right on the abscissa) are plotted in Fig. 3 for A600 (suspended matter) and A280 (dissolved protein) (Linearized plots with the goodness-of-fit of the empirical model to the data from Eq. (3) are in given in the Supplementary Information (SI) in Fig. S1. Here each cooling run is compared with the original reference plot without extracting a sample. As Δtcool increases from 1, 4, 7, 14, 24 to 28 d, the lag-times increase and the asymptote values of A600, asym decrease. Also, for all these values of Δtcool the consumption of dissolved protein (A280) behaves similarly and asymptotes approach zero in all cases. From Fig. 3a-f, we notice, within the error of these experiments, the following: (i) For Δtcool<4 d (Fig. 3a), the insulin samples behaved as if they were not cooled from 65±2°C to 25±2°C. Either they retained memory of their original state or the conversion rate at 25±2°C was too low to be observed in one day. (ii) For Δtcool≥4 d, the tlag increased (Fig. 3b-f) and the A600, asym decreased (Fig. 3a) with increasing values of Δtcool. (iii) The slopes and hence the apparent rate of fibril growth, kapp (model fit below), for the sigmoidal curves decreased with increasing Δtcool.
Figure 3. Cooling experiments (single extraction time).
Absolute absorbance readings (not normalized) are shown for (a-f) A600 and (g) A280. Reference data (◆ and ( ) in graphs (a-f) and (g), respectively), data after a Δtcool of 1 day (
 ), 4 days (
 ), 7 days (
 ), 14 days (
 ), 21 days (
 ), 28 days (
 ). All the runs have been shifted to the right by text = 1.5 hours. Fits of the data, using Eq. (2) (
 ) and Eq. (3) (
 ), are displayed in the graphs (a-f) showing good agreement with the experimental data. Goodness-of-fit are given in the legend of Fig. S1. (g) The initial insulin concentration for all the samples (prepared from the same batch) was ∼2 mg/ml. The following linear calibration curve was used in the range 0.0-2.0 mg/ml of dissolved insulin: A280 = 0.810 · c, (R2=0.999).
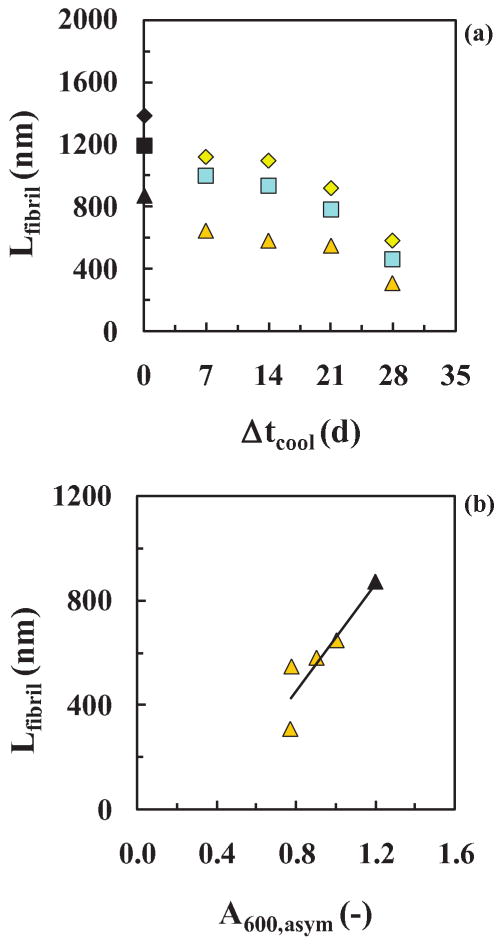
To explain these observations it is important to notice that, since all the samples started with the same initial protein concentration of 2 mg/ml, time-dependent protein degradation likely did not occur since the curves for dissolved protein (A280) all behaved similarly (Fig. 3g). For a mass balance to close, this means all the dissolved protein (except a small dissolved amount at the end of the process) was converted from dissolved species (A280) such as nuclei and oligomers to suspended species (A600) such as fibers. Since little or no protein was left in solution after the fibers were formed, how can one explain the drop in the A600, asym values with increased values of Δtcool? To answer this question, we measured the length of the fibers after each run using an Atomic Force Microscope (AFM) (Fig. 4) and found that the drop in A600, asym values correlated with a decrease in the mean fiber length, Lfiber (Fig. 5). This suggests that during the cooling period, the precursors or nuclei and oligomers continued to be formed at the lower temperature of 25±2°C such that more nuclei and hence fibers but shorter ones are produced at the time of the asymptote. This is based on a mass balance in which 2 mg/ml of insulin was used for all experiments and the assumption the fibers were of the same average thickness (good from AFM). This presumes that there was a delay in the last reaction that forms fibers (i.e. accumulation at an energetic barrier) allowing greater shorter rather than fewer longer fibers to be formed. This delay/accumulation would have to be temperature dependent and hence related to the energy of the system. Thus, the increase in tlag with increasing Δtcool suggests that nuclei, increasing in number, required a longer time to equilibrate from 25±2°C to 65±2°C. Another hyphotesis is that, during the cooling period, the insulin formed some off-pathway oligomers and aggregates. This would also explain the observed increase in tlag with increasing Δtcool and the shorter fibrils at the end of the fibrillation process. On the other end, the linear drop in the A600,asym values with increased values of Δtcool, could be the result of two contributions: (i) fibrils, decreasing in length and (ii) aggregates, increasing in number. We do not have evidence of these non-fibril aggregates from the AFM images. Instead, we know from the literature15 that the nucleation process proceeds at different temperatures with different kinetics (i.e. the lower is the temperature, the longer is the tlag), so we propose that the decrease in Lfiber with increasing Δtcool suggests that more nuclei and oligomers are formed or accumulate prior to an energetic barrier and nucleate more, shorter fibers, since almost all the protein was converted to fiber.
Figure 4. Cooling experiments (single extraction time).
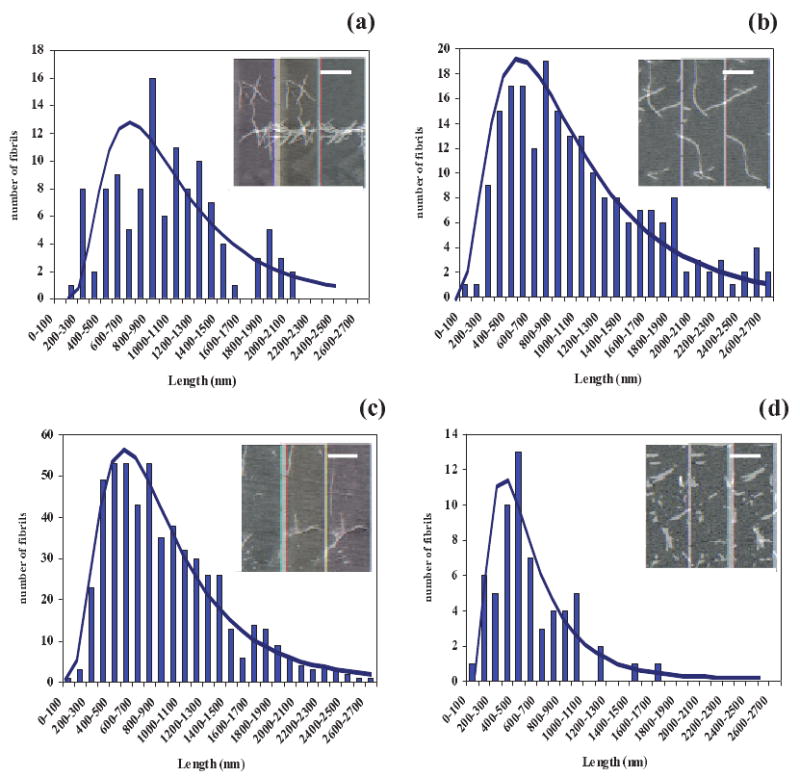
AFM images (inserts: bar size = 1 μm) and a fit of a log-normal distribution to the length of fibers (L) obtained after a run during the asymptotic saturation period for Δtcool equal to (a) 7, (b) 14, (c) 21 and (d) 28 days. The lognormal distribution has the probability density function for L > 0, where μ and σ are the mean and standard deviation of the logarithm of the variable: (a) μ = 6.854 and σ = 0.612, (b) μ = 6.799 and σ = 0.656, (c) μ = 6.658 and σ = 0.590, (d) μ = 6.159 and σ = 0.651.
Figure 5. Cooling experiments (single extraction time).
Mean ( ), median (
 ) and log-normal maximum (
 ) length of fibers (obtained from AFM imaging and a log-normal distribution fit to the data), together with the reference mean (◆), median (■) and log-normal maximum (▲) values, after a run and during the asymptotic saturation period versus (a) Δtcool and (b) A600, asym, with a linear fit of Lfibril = 1028 · A600asym + 364.6, (R2=0.827). After cooling at 25±2°C and pH 1.6, the samples were placed back to 65±2°C and pH 1.6.
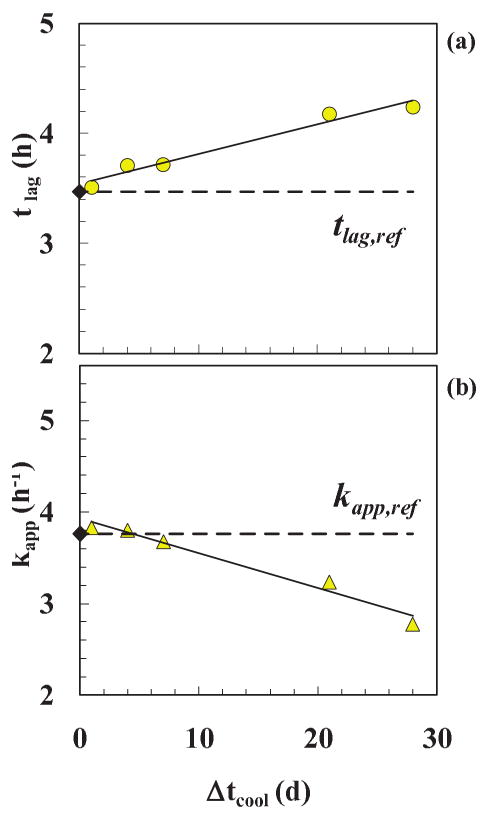
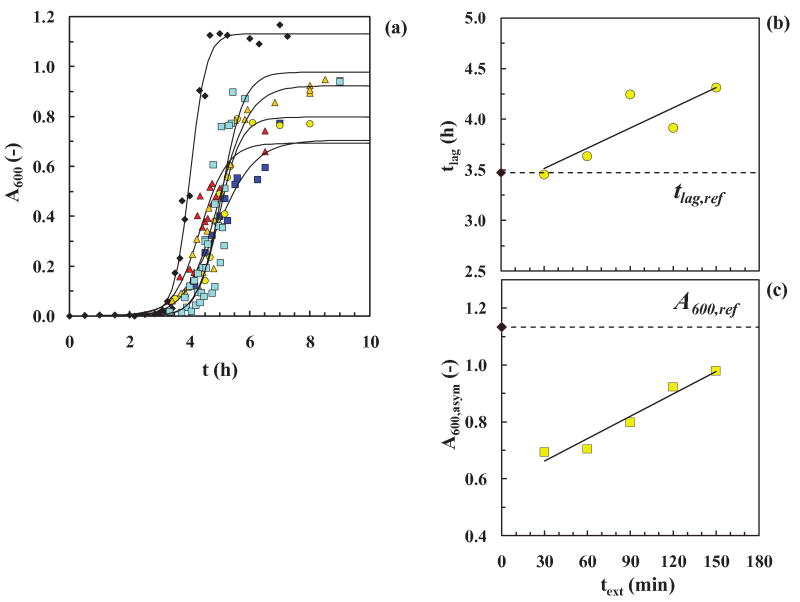
The trends of the parameters from the model fit are presented in Table SI (SI) and are plotted in Fig. 6. With an increase in Δtcool from 0-28 d, the lag-time, tlag, increased from 3.47 h to 4.23 h (+22±3 %) and the apparent growth rate constant for fibers, kapp, decreased from 3.76 to 2.78 h-1 (-26±3 %). Both correlations exhibit linear behavior after about a day with positive and negative slopes for tlag and kapp, respectively (see Fig. 6 legend for details). Thus cooling from 65±2°C to 25±2°C has a slow but linear time-dependent effect on the lag-time (or oligomer reaction rate) and on the apparent fibril reaction rate (for fibril growth) after the first day prior to fibril appearance and growth. This temporal result after a drop in temperature of 40°C of the sample during the in vitro fibrillation process is new and so is the finding that oligomers and fibrils can retain their growths rates within the first day or so. Equally interesting is the finding that this temperature drop likely results in more but shorter fibers with increasing time.—The reaction at the fiber tips, however, decreased due to the increased cooling period.,
Figure 6. Cooling experiments (single extraction time).
Parameters resulting from a best fit of Eq. (2) to the data in Figs. 3 & 4: (a) tlag, and (b) kapp, as a function of cooling time, Δtcool. Reference data (without cooling) (◆) and cooling data ( and
and  ). The linear fits of from Eq. (2) (
 ), tlag = 0.027Δtcool + 3.037, (R2=0.964) and kapp = −0.038Δtcool + 3.930, (R2=0.972) are compared with the reference values (
 ). The relative increase and decrease after 28 days were 22% and 26% for tlag and kapp, respectively.
Single cooling time experiment
In order to probe the time-dependency of the cooling experiment, samples were taken at different times, text,i (0.5, 1, 1.5 (above), 2 and 2.5 h) and cooled for a period, Δtcool of 28 d. The raw data are summarized together with those for text = 1.5 h above in Fig. 3 (control) and the parameters, kapp and tlag, obtained from a fit of the model, are shown in Fig. 7 as a function of text. Samples taken along the reaction coordinate at different text,i during the lag-time prior to fibril formation behave differently! For example (i) the closer text,i is to the critical time for fibril formation (∼3.5 h), the fewer and the longer are the fibers, i.e the higher A600, asym (Fig. 7b and Fig. 5b). The reverse is also true. However, the fibers are still shorter and more frequent than the control (Fig. 5b). (ii) The longer the text,i values at Δtcool of 28 d, the longer the lag-time, tlag. Also, by extending the linear plot in Fig. 7c to intersect with the horizontal line for the reference at A600, asym = 1.13 one obtains a text, of 3.5 h, which is the value of tlag for the reference experiment, supporting the consistency of the data! (iii) The changes are linear with increasing text,i.
Figure 7. Cooling experiments (single cooling time).
(a) Sigmoidal fibrillation curves for samples were taken at different times, text,i (0.5, 1, 1.5 (above), 2 and 2.5 h) and cooled for one period, Δtcool of 28 d. Reference data (without seeding) (◆) and data with text,i of 0.5 h ( ), 1 h (
 ), 1.5 h (
 ), 2 h (
 ), 2.5 h (
 ). Parameters resulting from a best fit of Eq. (2) to the data in (a) above for (b) tlag (
 ), where tlag = 0.006text + 3.037, (R2 = 0.715), and (c) A600,asym (
 ), where A600,asym = 0.002text + 0.583, (R2 = 0.948), as a function of extraction time, text,i. After cooling at 25±2°C and pH 1.6 for 28 d, the samples were placed back to 65±2°C and pH 1.6.
These results suggest that the oligomer reaction process is continuous and steady with time and that removing a sample and cooling it closer to the onset of fibril formation slows the process more and producers fibers that are more similar in length and number to that of the control (without cooling). For both cooling experiments, the lag times, tlag, became longer and the onset of fibril formation occurs later with cooling than without. In summary, samples taken at different times along the oligomer reaction path exhibit linearly changing behavior! This now provides the incentive to isolate time-dependent oligomers for toxicity tests for insulin and, should this same linear changing behavior persist for other amyloid proteins, a similar fractionation is called for.35
Seeding with oligomers
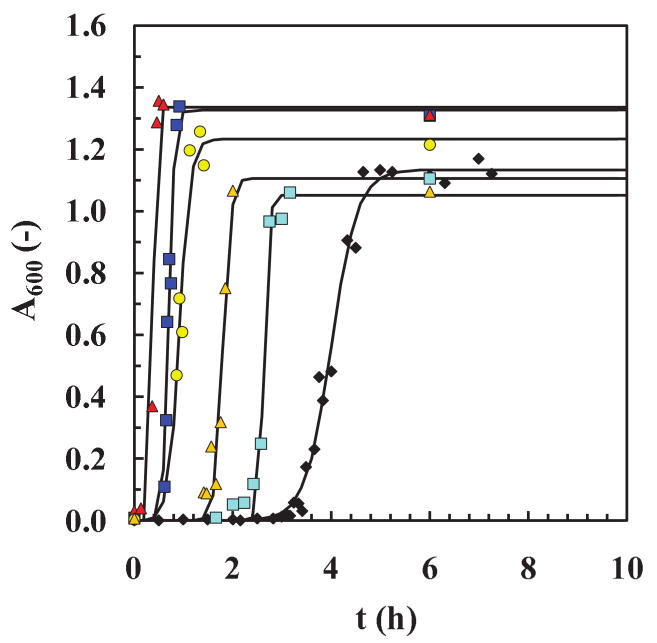
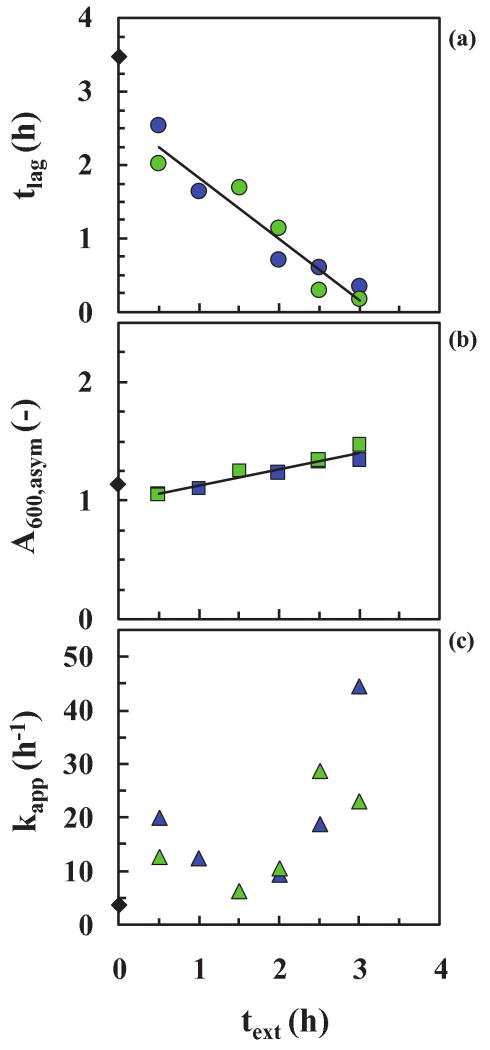
The following question is of interest. Do samples at different stages of the insulin oligomer reaction process, prior to fibril formation, behave differently as seeds when added to a fresh new nucleation process? If they do, then the assumption that reaction species posisbly nuclei, which are assumed to form during this process and are a prerequisite for forming structurally rearranged intermediates and then fibrils is supported.36 To test this hypothesis, samples comprising 2 and 10% insulin by volume were taken at increasing times, text,i during an insulin fibrillation run prior to the formation of fibrils and added to new runs while keeping the total insulin concentrations constant at 2 mg/ml (Fig. 1b). The raw data with empirical model fits for only the run at 2% are shown in Fig. 8. The data (not shown) for the 10% runs were similar to those for the 2% runs. First, we notice, with the addition of both 2 and 10% sample volumes, the following: (i) The on-set of fibril formation occurred earlier than that for the unseeded sample (control). (ii) This onset was related to the extraction time, text,i, that the sample was removed from the first run, i.e. the shorter text,i, the longer the tlag (Fig. 9a), i.e. the later the break-though of the sigmoidal curve and the slower to produce fibers. (iii) The longer text,i, the higher the value of the saturation absorption asymptote, A600,asym, i.e. this effect is the inverse of that for the cooling experiments where A600,asym, decreased with cooling time, Δtcool. Also, larger values of A600,asym correlate with longer fibers. Here, with text = 3 hours for 10% seeds, we obtain 1784 and 1268 nm for the mean and log-normal maximum values of fiber length, respectively, as compared with 1381 and 872 nm, respectively, for the reference (Fig. 5b). Clearly, we have answered the question posed at the top of this paragraph; samples from different stages of the oligomer reaction do affect the fibrillation process differently and more specifically do so in a time-dependent manner. These results are new and are consistent with the cooling experiments.
Figure 8. Seeding experiments (with oligomers).
Samples comprising 2% by volume were taken at increasing times, text,i, during an insulin fibrillation run prior to the formation of fibrils and added as seeds to fresh new insulin runs (total insulin concentration was kept at 2 mg/ml, 65±2°C and pH 1.6). Sigmoidal plots of the fibrillation process for A600 versus time, t, in hours. Reference data (no seeds added) (◆) and data with seeds extracted at text,i of 0.5 h ( ), 1 h (
 ), 2 h (
 ), 2.5 h (
 ), 3 h (
 ). Fits (
 ) were obtained using Eq. (2) from the empirical model.
Figure 9. Seeding experiments (with oligomers).
Parameters resulting from a best fit of Eq. (2) to the data in Fig. 7: (a) tlag, (b) A600,asym and (c) kapp as a function of the extraction time, text,i. Reference data (without seeding) (◆) and seeding experiments using 2% v/v ( ,
,  and
and  , respectively) and 10% v/v (
 ,
,  and
and  , respectively) seeds (total insulin concentration was kept at 2 mg/ml, 65±2°C and pH 1.6). The linear fits (
 ), tlag = −0.831x + 2.652, (R2=0.923) and A600,asym = 0.138text + 0.988, (R2=0.917). The relative decrease in tlag, and increase in A600,asym after 3 hours were 93% and 24%, respectively.
The oligomer reaction during the lag-phase, tlag, is a linear time-dependent process and most likely a nucleation process26-28 that can be modeled via reaction analysis.37 The data in Fig. 9a suggests a two-step process; a fast initial reaction rate followed by a slightly slower reaction rate. The linear increase in A600,asym with time, text,i, also suggests that, by seeding with more mature (reacted longer) seeds, the energy barrier to form fibrils was easily overcome. Using seeds closer to the onset of fibers during the lag-phase suggests that they contained intermediates that had been structurally rearranged (into β-sheet-rich entities) and therefore more conducive to forming fibers. Also, one would expect that increasing the volume percentage of seed from 2 to 10%, while keeping the total insulin concentration constant, would affect the oligomer reaction process. This was not, however, observed (Fig. 9) suggesting that the extent of the reaction with time was more important than the amount of seed added. Again, confirming the presence of a progressing reaction during the pre-fiber forming stage. From a fit of the model, one estimates the apparent growth rate, kapp, with the extraction time of the seed from the first run (Fig. 9c). There does not appear to be a difference between the 2% and the 10% (v/v) seeds. However, for both cases, the values of the kapp increases quickly for text>∼1.5 (= text,crit) hour. In light of the SANS analysis for the same insulin system, where Nayak et al. (2008) report that the three dimer nucleus (6-mer) was formed after 30 min or half the time to fibril formation for a 10 mg/ml insulin fibrillation reaction, the results in Fig. 9c for 2 mg/ml also show that after half the time to form fibers (i.e. text>∼1.5 h), the mature seeds induce fibers formation at a faster rate (kapp).
Seeding with fibrils
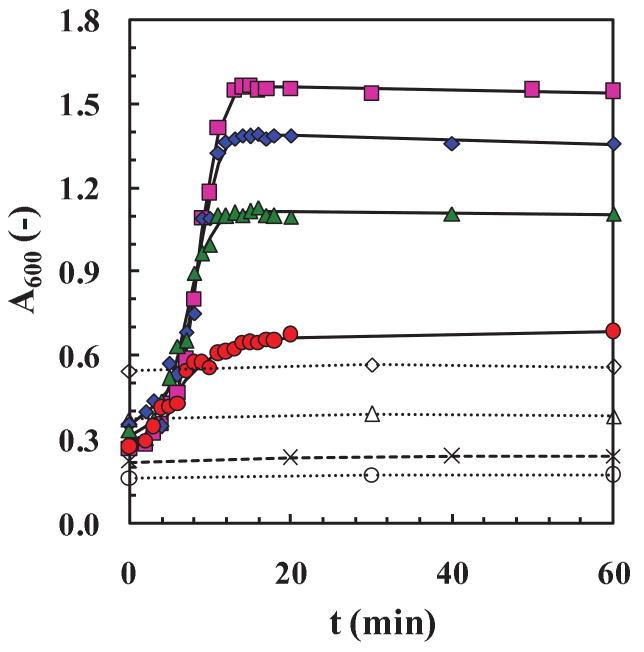
First we measure the effectiveness of adding fresh washed fibrils to a suspension of fresh washed fibrils in buffer without dissolved insulin present. Then, we determine the effect of adding increasing dissolved insulin (10-40 mg) to a 1 ml suspension of fresh washed fibrils in buffer. The data in Fig. 10 show that different amounts of fibers when added to fibers do not result in increased amount or length of fibers, i.e. the A600 signals are flat. This could be because fibrils do not bind to fibrils, their diffusion coefficients are very small such that finding the end of another fiber takes a long time, and/or they were at very low concentrations so the process is likely to be very slow and unobservable in the time-scale of the experiment. However, adding four different amounts of fresh dissolved insulin, characterized by very fast diffusion coefficients, to pre-washed fibril resulted in a fast increase in the A600 signal that flattened out in 15-20 min when the dissolved insulin was utilized and the reaction stopped.
Figure 10. Seeding with oligomers or fibrils (total insulin concentrations were not kept constant).
Two different data sets are shown here in terms of absolute absorbance readings, A600, versus time, t. For the first set, different amounts of dissolved fresh insulin at 40 mg ( ), 30 mg (
 ), 20 mg (
 ), 10 mg (
 ) and 0 mg (×) (control experiment) were added to the same amount (∼ 2 mg) of pre-washed fibrils, collected at the end of a previous fibrillation run. Fits (
 ) were obtained using Eq. (2) from the empirical model. For the second set, the same washed fibrils were added to new pre-washed fibrils, collected at different times during the elongation phase at times: 3.5 h (○), 3.8 h (△) and 4 h (◇) or at 15, 34, and 50 % of the A600,asym values, respectively. All the samples were placed at 65±2°C and pH 1.6. For each run 8 mg of fibers were resuspended in 20 ml of fresh buffer.
These results clearly suggest that at least two reactions occur during the process. Without addition of fibers, the nucleation process is needed to initiate and form fibrils via nucleus formation followed by assembly of structural intermediates (i.e. annular, Quist et al., 2005). This process takes approximately 3.5 h (tlag) at pH 1.6 and 65°C for insulin. On the other hand, if fibers are already formed and present in a solution containing fresh insulin, they grow extremely fast with very short lag-times, i.e. in minutes they react with the ends of the existing fibers. Four observations can be made for the data in Fig. 10: (1) There was no noticeable lag-period when fresh insulin was added to washed fibers. (2) The initial period of growth of fibrils appeared to follow a universal curve, while the latter period for each dissolved insulin amount (10-40 mg) was clearly steeper in slope with higher added insulin concentration. (3) Although the difference in concentration of dissolved insulin was the same between each run (i.e. 10 mg), the difference in A600, asym did not correlate linearly with the increasing added insulin, suggesting a saturation phenomenon. (4) To analyze the dissolved insulin data quantitatively, we fit Eq. (3) to the four data sets to obtain the kapp values from the fits. The full lines in Fig. 10 are the fits and the values of kapp were 0.34, 0.67, 0.85, and 0.79 h-1 for 10, 20, 30, and 40 mg insulin, respectively. These kapp values are plotted in Fig. S2 as a function of insulin amount, m (mg), and confirms a saturation effect above a critical amount of ∼25 mg. Thus, insulin diffusion is likely rate limiting due to viscosity increases above this critical concentration!
Conclusion
The reaction pathway to insulin fibril formation at pH 1.6 and 65°C was investigated using two different types of experiments – cooling and seeding – in order to confirm the validity of the reaction (nucleation) model and determine its effect on fibril growth. For the cooling experiments, samples, taken during the oligomer reaction period prior to the onset of fibril formation, were cooled for fixed periods and then reheated to their original temperature. For seeding, a comprehensive series of experiments involving addition of dissolved insulin seeds from the oligomer reaction period (at constant total insulin concentration of 2 mg/ml), washed fibrils taken at different times during the fibril growth period, and increasing amounts of dissolved insulin (without keeping the insulin concentration constant), were undertaken. The apparent rate of fibril growth, kapp, reached a maximum or saturation condition for fibril growth.
The results from both the cooling and seeding studies confirm the existence of a time-changing oligomer reaction process prior to fibril formation that likely involves a rate-limiting nucleation process followed by structural rearrangements of intermediates (into β-sheet rich entities) that then form fibrils.38 The latter structural rearrangement step can occur even if nuclei are absent (i.e. with dissolved seeds added). Nuclei (and oligomers) are formed at the fibrillation conditions (pH 1.6 and 65°C) but are also continuously formed during cooling at pH 1.6 and 25°C. Since, at this low temperature, they are unable to form fibrils, we demonstrate that, for insulin, the structural rearrangement step requires additional energy than is available at 25°C. However, when the cooled nuclei (and oligomers) are heated back to 65°C, they form fibrils quickly. There was also an inverse linear dependence at constant total insulin concentration between the time the samples were kelp at 25°C and the mean length of the fibers suggesting that, for a given fixed amount of mass of insulin, more nuclei (and oligomers) gave more shorter fibers. A conceptual free-energy diagram together with three simple reaction schemes are used to describe these reactions qualitatively in Fig. 11. Finally, we posit an accumulation of critical oligomers (and nuclei) or structures prior to fibril formation that are less able to efficiently pass over an energy barrier for producing fibers at low temperature than at high temperature. Thus at low temperature for long lag-times (>1 d) more nuclei accumulate and subsequently when the temperature is increased they form more but shorter fibers (Fig. 5).
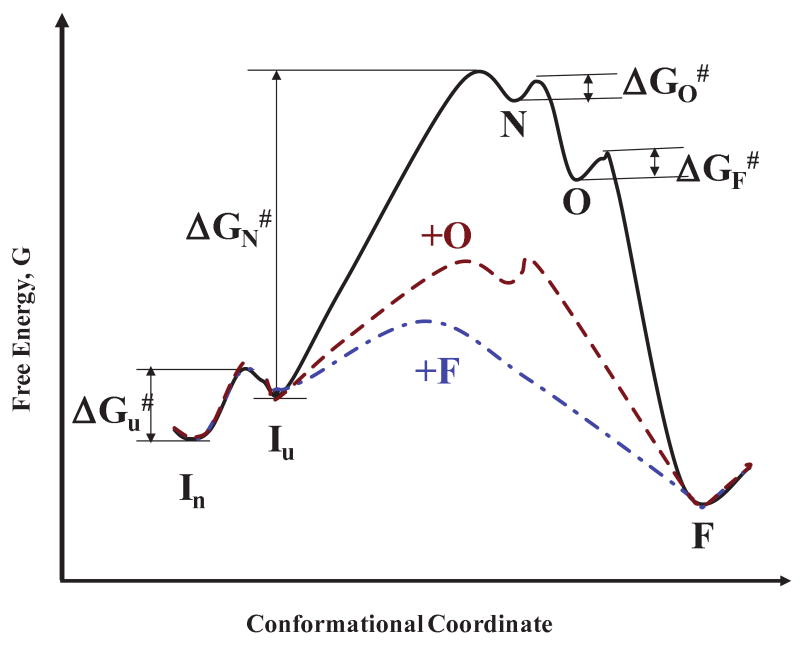
Figure 11.
A conjectural plot of the free energy, G, for conversion of native protein, In (dimer at pH 1.6 and 65±2°C), to unfolded protein, Iu, to nuclei, N, to oligomers, O, and then to amyloid fibrils, F. The proposed reactions are as folows: (i) For the initial reaction without added seed oligomers or fibers (control)
| (5) |
(ii) With added seed oligomers (no fibers added)
| (6) |
(iii) With added seed fibers (no oligomers added)
| (7) |
A four-step, three-step and two step barrier process is proposed for reactions (5), (6) and (7), repsectively. The transiion state energy for each step of the control reaction (Eq. (5)) is ΔGi# where i = u, N, O and F to form the unfolded protein, the nucleus, the oligomer(s) and the fibril species, respectively. Forming the nucleus requires the most energy by far. The process of seeding with oligomers or fibrils obviates the nucleation step and reduces the barrier to fibril formation.
Supplementary Material
Acknowledgments
We thank Arne Staby (Novo Nordisk A/S, Denmark) for supplying the human insulin, Amit Dutta (Rensselaer Polytechnic Institute, Troy, NY) for suggestions on Fig. 11, Evan Powers (The Scripps Research Institute, La Jolla, CA) for comments and suggestions, and acknowledge the support of the US Department of Energy (DE-FG02-90ER14114 and DE-FG02-05ER46249), NSF-NIRT (CTS-0304055), HHMI and NIH (R37 GM29169) (to J.F.) for funding.
References
- 1.Sipe JD, Cohen AS. Review: History of the Amyloid Fibril. J Struct Biol. 2000;130:88–98. doi: 10.1006/jsbi.2000.4221. [DOI] [PubMed] [Google Scholar]
- 2.Cohen E, Bieschke J, Perciavalle RM, Kelly JW, Dillin A. Opposing Activities Protect Against Age-Onset Proteotoxicity. Science. 2006;313:1604–1610. doi: 10.1126/science.1124646. [DOI] [PubMed] [Google Scholar]
- 3.Gilead S, Wolfenson H, Gazit E. Molecular mapping of the recognition interface between the islet amyloid polypeptide and insulin. Angewandte Chem, Int Ed. 2006;45:6476–6480. doi: 10.1002/anie.200602034. [DOI] [PubMed] [Google Scholar]
- 4.Knowles TP, Fitzpatrick AW, Meehan S, Mott HR, Vendruscolo M, Dobson CM, Welland ME. Role of Intermolecular Forces in Defining Material Properties of Protein Nanofibrils. Science. 2007;318:1900–1903. doi: 10.1126/science.1150057. [DOI] [PubMed] [Google Scholar]
- 5.Nelson R, Eisenberg D. Recent atomic models of amyloid fibril structure. Curr Opin Struct Biol. 2006;16:260–265. doi: 10.1016/j.sbi.2006.03.007. [DOI] [PubMed] [Google Scholar]
- 6.Glenner GG, Page D, Isersky C, Harada M, Cuatrecasas P, Eanes ED, DeLellis RA, Bladen HA, Keiser HR. Physical and chemical properties of amyloid fibers. V. Murine amyloid fibril protein: isolation, purification, and characterization. J Histochem and Cytochem. 1971;19:16–28. doi: 10.1177/19.1.16. [DOI] [PubMed] [Google Scholar]
- 7.Makin OS, Atkins E, Sikorski P, Johansson J, Serpell LC. Molecular basis for amyloid fibril formation and stability. Proc Natl Acad Sci USA. 2005;102:315–320. doi: 10.1073/pnas.0406847102. [DOI] [PMC free article] [PubMed] [Google Scholar]
- 8.Stromer T, Serpell LC. Structure and morphology of the Alzheimer's amyloid fibril. Microscopy Research and Technique. 2005;67:210–217. doi: 10.1002/jemt.20190. [DOI] [PubMed] [Google Scholar]
- 9.Kasai M, Oosawa F, Asakura S. The cooperative nature of G-F transformation of actin. Biochim Biophys Acta. 1962;57:22–31. doi: 10.1016/0006-3002(62)91073-9. [DOI] [PubMed] [Google Scholar]
- 10.Wakabayashi K, Hotani H, Asakura S. Polymerization of Salmonella flagellin in the presence of high concentrations of salts. Biochim Biophys Acta. 1969;175:195–203. doi: 10.1016/0005-2795(69)90157-3. [DOI] [PubMed] [Google Scholar]
- 11.Ferrone FA, Hofrichter J, Eaton WA. Kinetics of sickle hemoglobin polymerization. I. Studies using temperature-jump and laser photolysis techniques. J Mol Biol. 1985;183:591–610. doi: 10.1016/0022-2836(85)90174-3. [DOI] [PubMed] [Google Scholar]
- 12.Ferrone FA, Hofrichter J, Eaton WA. Kinetics of sickle hemoglobin polymerization. II. A double nucleation mechanism. J Mol Biol. 1985;183:611–31. doi: 10.1016/0022-2836(85)90175-5. [DOI] [PubMed] [Google Scholar]
- 13.Padrick SB, Miranker AD. Islet amyloid: phase partitioning and secondary nucleation are central to the mechanism of fibrillogenesis. Biochemistry. 2002;41:4694–4703. doi: 10.1021/bi0160462. [DOI] [PubMed] [Google Scholar]
- 14.Sluzky V, Tamada JA, Klibanov AM, Langer R. Kinetics of insulin aggregation in aqueous solutions upon agitation in the presence of hydrophobic surfaces. Proc Natl Acad Sci USA. 1991;88:9377–9381. doi: 10.1073/pnas.88.21.9377. [DOI] [PMC free article] [PubMed] [Google Scholar]
- 15.Nielsen L, Khurana R, Coats A, Frokjaer S, Brange J, Vyas S, Uversky VN, Fink AL. Effect of Environmental Factors on the Kinetics of Insulin Fibril Formation: Elucidation of the Molecular Mechanism. Biochemistry. 2001;40:6036–6046. doi: 10.1021/bi002555c. [DOI] [PubMed] [Google Scholar]
- 16.Zhu M, Souillac PO, Ionescu-Zanetti C, Carter SA, Fink AL. Surface-catalyzed Amyloid Fibril Formation. J Biol Chem. 2002;277:50914–50922. doi: 10.1074/jbc.M207225200. [DOI] [PubMed] [Google Scholar]
- 17.Linse S, Cabaleiro-Lago C, Xue WF, Lynch I, Lindman S, Thulin E, Radford SE, Dawson KA. Nucleation of protein fibrillation by nanoparticles. Proc Natl Acad Sci USA. 2007;104:8691–8696. doi: 10.1073/pnas.0701250104. [DOI] [PMC free article] [PubMed] [Google Scholar]
- 18.Quist A, Doudevski I, Lin H, Azimova R, Ng D, Frangione B, Kagan B, Ghiso J, Lal R. Amyloid ion channels: A common structural link for protein-misfolding disease. Proc Natl Acad Sci USA. 2005;102:10427–10432. doi: 10.1073/pnas.0502066102. [DOI] [PMC free article] [PubMed] [Google Scholar]
- 19.Goedert M, Spillantini MG. A Century of Alzheimer's Disease. Science. 2006;314:777–781. doi: 10.1126/science.1132814. [DOI] [PubMed] [Google Scholar]
- 20.Lansbury PT, Lashuel HA. A century-old debate on protein aggregation and neurodegeneration enters the clinic. Nature. 2006;443:774–779. doi: 10.1038/nature05290. [DOI] [PubMed] [Google Scholar]
- 21.Heemels MT. Neurodegeneration. Nature. 2006;443:767. [Google Scholar]
- 22.Powers ET, Powers DL. The kinetics of nucleated polymerizations at high concentrations: amyloid fibril formation near and above the “supercritical concentration”. Biophys J. 2006;91:122–132. doi: 10.1529/biophysj.105.073767. [DOI] [PMC free article] [PubMed] [Google Scholar]
- 23.Powers ET, Powers DL. Mechanisms of protein fibril formation: nucleated polymerization with competing off-pathway aggregation. Biophys J. 2008;94:379–391. doi: 10.1529/biophysj.107.117168. [DOI] [PMC free article] [PubMed] [Google Scholar]
- 24.Holtzman D. Moving towards a vaccine. Nature. 2008;454:417–420. doi: 10.1038/454418a. [DOI] [PubMed] [Google Scholar]
- 25.Holmes C, Boche D, Wilkinson D, Yadegarfar G, Hopkins V, Bayer A, Jones RW, Bullock R, Love S, Neal JW, Zotova E, Nicoll JAR. Long-term effects of Aβ42 immunisation in Alzheimer's disease: follow-up of a randomised, placebo-controlled phase I trial. Lancet. 2008;372:216–223. doi: 10.1016/S0140-6736(08)61075-2. [DOI] [PubMed] [Google Scholar]
- 26.Nayak A, Sorci M, Krueger S, Belfort G. A universal pathway for amyloid nucleus and precursor formation for insulin. Proteins. 2008 doi: 10.1002/prot.22169. In press. [DOI] [PubMed] [Google Scholar]
- 27.Waugh DF, Wilhemson DF, Commerford SL, Sackler ML. The nucleation and growth reactions of selected types of insulin fibrils. J Am Chem Soc. 1953;75:2592–2600. [Google Scholar]
- 28.Vestergaard B, Groenning M, Roessle M, Kastrup JS, van de Weert M, Flink JM, Frokjaer S, Gajhede M, Svergun DI. A helical structural nucleus is the primary elongating unit of insulin amyloid fibrils. PloS Biol. 2007;5:1089–1097. doi: 10.1371/journal.pbio.0050134. [DOI] [PMC free article] [PubMed] [Google Scholar]
- 29.Jimenez JL, Nettleton EJ, Bouchard M, Robinson CV, Dobson CM, Saibil HR. The protofilament structure of insulin amyloid fibrils. Proc Natl Acad Sci USA. 2002;99:9196–9201. doi: 10.1073/pnas.142459399. [DOI] [PMC free article] [PubMed] [Google Scholar]
- 30.Devlin GL, Knowles TPJ, Squires A, McCammon MG, Gras SL, Nilsson MR, Robinson CV, Dobson CM, MacPhee C. The Component Polypeptide Chains of Bovine Insulin Nucleate or Inhibit Aggregation of the Parent Protein in a Conformation-dependent Manner. J Mol Biol. 2006;360:497–509. doi: 10.1016/j.jmb.2006.05.007. [DOI] [PubMed] [Google Scholar]
- 31.Knowles TPJ, Shu W, Devlin GL, Meehan S, Auer S, Dobson CM, Welland ME. Kinetics and thermodynamics of amyloid formation from direct measurement of fluctuations in fibril mass. Proc Natl Acad Sci USA. 2007;104:10016–10021. doi: 10.1073/pnas.0610659104. [DOI] [PMC free article] [PubMed] [Google Scholar]
- 32.Smith MI, Sharp JS, Roberts CJ. Nucleation and growth of insulin fibrils in bulk solution and at hydrophobic polystyrene surfaces. Biophys J. 2007;93:2143–2151. doi: 10.1529/biophysj.107.105338. [DOI] [PMC free article] [PubMed] [Google Scholar]
- 33.Wintersteiner O, Abramson HA. The isoelectric point of insulin. Electrical properties of adsorbed and crystalline insulin. J Biol Chem. 1933;99:741–753. [Google Scholar]
- 34.Grassucci RA, Taylor DT, Frank J. Preparation of Macromolecular complexes for cryo-electron microscopy. Nature Protocol. 2007;2(12):3239–3246. doi: 10.1038/nprot.2007.452. [DOI] [PMC free article] [PubMed] [Google Scholar]
- 35.Cheon M, Chang I, Mohanty S, Luheshi LM, Dobson CM, Vendruscolo M, Favrin G. Structural reorganisation and potential toxicity of oligomeric species formed during the assembly of amyloid fibrils. PloS Comput Biol. 2007;3:1727–1738. doi: 10.1371/journal.pcbi.0030173. [DOI] [PMC free article] [PubMed] [Google Scholar]
- 36.Scheibel T, Bloom J, Lindquist SL. The elongation of yeast prion fibers involves separable steps of association and conversion. Proc Natl Acad Sci USA. 2004;101:2287–2292. doi: 10.1073/pnas.0308754101. [DOI] [PMC free article] [PubMed] [Google Scholar]
- 37.Lee CC, Nayak A, Sethuraman A, Belfort G, McRae GJ. A three-stage kinetic model of amyloid fibrillation. Biophys J. 2007;92:3448–3458. doi: 10.1529/biophysj.106.098608. [DOI] [PMC free article] [PubMed] [Google Scholar]
- 38.Stohr J, Weinmann N, Wille H, Kaimann T, Nagel-Steger L, Birkmann E, Panza G, Prusiner SB, Eigen M, Riesner D. Mechanisms of prion protein assembly into amyloid. Proc Natl Acad Sci USA. 2008;105:2409–2414. doi: 10.1073/pnas.0712036105. [DOI] [PMC free article] [PubMed] [Google Scholar]
Associated Data
This section collects any data citations, data availability statements, or supplementary materials included in this article.


