

Abstract
Data management software applications specifically designed for the clinical research environment are increasingly available from commercial vendors and open-source communities, however, general-purpose spreadsheets remain widely employed in clinical research data management (CRDM). Spreadsheet suitability for this use is controversial, and no formal comparative usability evaluations have been performed. We report on an application of the UFuRT (User, Function, Representation, and Task (analyses)) methodology to create a domain-specific process for usability evaluation. We demonstrate this process in an evaluation of differences in usability between a spreadsheet program (Microsoft® Excel) and a commercially available clinical research data management system (CDMS) (Phase Forward Clintrial™). Through this domain-specific operationalization of UFuRT methodology, we successfully identified usability differences and quantified task and cost differences, while delineating these from socio-technical aspects. UFuRT can similarly be generalized to other domains.
Keywords: Database management systems, Clinical trials, Usability, HCI
1. Introduction
Clinical and translational researchers are increasingly adopting formal approaches to data collection and management. Many use specialized systems, while others resort to more general tools, such as ubiquitous spreadsheet programs to manage clinical research data. At one author’s (MN) institution, spreadsheets are used for clinical research data management more often than are specialized clinical data management systems (CDMSs). Debate continues unabated over the relative merits of the two approaches: the perceived rigor of specialized CDMSs versus the affordability of general spreadsheets. There are no definitive studies in the published literature that might resolve the argument, or guide institutional decision-making regarding provision of data collection and management software. In order to identify and clarify differences, we need a method for comparing competing products for a particular research setting. We report on the development of an operational process for the User, Function, Representation, and Task analyses (UFuRT) methodology [1,2] and demonstrate this process in the context of a usability comparison of two software packages used to manage clinical research data: Microsoft Excel and Phase Forward Clintrial.
2. Background
The UFuRT analysis methodology of Zhang et al. [1–3] is a generic conceptual framework that adheres to the principles of Work-Centered Design (WCD) [2]; although well-established, UFuRT has not been operationalized in the clinical research domain.
The application of usability evaluations to the domain of clinical and translational research has been limited. Schmier and colleagues argue for applying usability theory to the clinical research domain [4] and describe how the framework of Constantine and Lockwood [5] might be applied to clinical data management systems (CDMSs). This framework was designed to elucidate context and potential usability issues and consists of six categories: environment, device constraints, information, interaction, incumbent, and operational risk profile [5]. Further, Litchfield et al. and Weber et al. both describe controlled comparisons of Web-based electronic data capture (EDC) systems [6,7]. To date, however, there are no published reports of applications of formal usability methods in the clinical research data management (CRDM) domain, and the operationalization of the UFuRT analysis in this domain therefore represents a significant contribution to this field.
UFuRT was chosen because 1) it encompasses functionality evaluation, commonly applied when selecting software; 2) the framework is grounded in WCD; and 3) UFuRT can provide quantitative assessments regarding necessary investments of both time and financial resources. Thus, UFuRT establishes both a qualitative and a quantitative context that supports the decisions clinical and translational researchers will make when evaluating and selecting systems.
3. Methods
3.1. Operationalization of the UFuRT Framework
Our framework for operationalization of UFuRT within this domain (Fig. 1) shows domain-specific methods for applying the generic UFuRT methodology. UFuRT enables characterization and direct comparison of users, functionality, representation, and tasks of software applications. Specific operationalizations for the clinical research data management domain are described for UFuRT’s user, function, representation, and task analysis categories.
Figure 1.

Framework for operationalization of UFuRT within the clinical research domain
3.1.1 User analysis
In the operationalization framework, user roles were identified according to domain expertise and characterized by research-related responsibilities, work environment, level of expertise, and education (Table 1). Research characteristics that affected roles were identified from Clinicaltrials.gov data elements, Medical Subject Headings (MeSH) and associated definitions [8,9] and included in a work domain ontology, which was modeled under the Basic Formal Ontology (BFO) using Protégé-Owl v. 3.3.1 [10].
Table 1.
User characteristics for data collection and management software
| User group | Description of trial-related responsibilities | Location | Education | Experience | Environment |
|---|---|---|---|---|---|
| Clinical trial investigator | Designs clinical trial; ultimately responsible for research. | Site | MD | Novice | Clinical setting |
| Site investigator | Person conducting a clinical investigation, usually at one of several clinical investigational sites. | Site | MD | Novice | Clinical setting |
| Study coordinator | Often a registered nurse, working under the direction of a site investigator to carry out the trial at an investigational site | Site | RN; BS; MS | Novice | Clinical setting |
| Research assistant | Assists in trial operations; e.g., phlebotomy, data abstraction, data recording, patient scheduling. | Site | AA; BS | Novice | Office |
| Clinical trial monitor | Oversees sites; reviews procedures and documentation to ensure that trial is conducted in accordance with protocol and applicable regulations | Site/data center | RN; BS | Novice | Clinical setting/office |
| Clinical data manager | Coordinates data collection and processing; designs CRFs and databases | Data center | BS; MS | Expert | Office |
| Clinical data assistant | Tracks forms, enters/cleans data, assists sites with data questions, executes user testing plans. | Data center | AA; BS | Intermediate | Office |
| Statistician | Trial statistical design and analysis | Data center | MS; PhD | Expert | Office |
| Statistical programmer | Creates analysis datasets; programs statistical analysis | Data center | BS; MS | Intermediate-Expert | Office |
| Software installer | Deploys and maintains software applications | Data center | AA; BS | Novice | roaming |
3.1.2 Functional analysis
Functions (activities and their associated objects) were identified for the CRDM domain and added to the work domain ontology. Terms and definitions from existing standards were used where available [11–14]. Where no formal definitions existed, domain expertise was used to define terms, assuring domain coverage. Fifty-five functions from the ontology were identified as critical to the domain. Software products were rated against this list using exhaustive and mutually exclusive categories by four domain expert raters (Table 2). Software was evaluated as initially purchased, without modification. In any instance where programming was required to add functionality, the function was rated as Not Supported. Indirectly Supported functions were those that could be accomplished with the software through the addition of manual steps or procedural controls.
Table 2.
Categories used for functional comparison
| Rating | Definition |
|---|---|
| Directly supported | Software has the functionality or automates the process. |
| Indirectly supported | Software does not have the functionality, but with addition of “work-around,” the function can be accomplished; i.e., with manual steps, procedural or managerial controls. |
| Not supported | Function cannot be accomplished using the software without application language programming or other customization. |
| Indeterminate | Rater is unfamiliar with the function, software, or is otherwise unsure if the function can be accomplished within the software. |
3.1.3 Representational analysis
Most applications employed in the CRDM domain support intensive data capture from key entry. Thus, representation at the form (page) level and field level are important for such applications. A typical page from an example clinical trial (Table 3) case report form (CRF) was selected for our analysis. Representation of data elements at both field and form level was assessed. The definition of data field (a specific area used for a particular class of data elements on a data medium or in a data storage device) was taken from the ISO/IEC 2382-4 standard; a form was defined for the purposes of this research as a page of paper (or its electronic equivalent) containing multiple data elements. Field-level comparisons included Stevens’s scales of measurement [15] and field structure, in which each field in the data capture user interface was categorized as supporting or not supporting the innate scale (nominal, ordinal, interval, or ratio) of the data element. In this way, Steven’s scales were used to assess the degree of data reduction (capturing or displaying data in a way that decreases the amount of information conveyed) between the represented data and the CRF, and between the CRF and the representations in the software applications. Data collection structure and format of fields in the applications were also compared.
Table 3.
Characteristics of example clinical trial used in analysis
| Characteristic | Metric |
|---|---|
| Number of patients | 105 enrolled; 100 evaluable |
| Number of investigational sites | 5 sites enrolling 1 patient/site/month |
| Number of visits | 4 |
| Volume of data collected | 100 pages/patient; 2000 variables/patient |
| Electronic data loads | Bi-monthly; 1 panel loaded; 80 records/patient |
| Data cleaning | 300 data cleaning rules; 3% of data discrepant |
| Clinical coding | 10 coded terms per patient; 80% auto-coding hit rate. |
Form-level comparisons included view orientation [16] and spatial proximity. Each form was classified using Zeng’s categories of source, time, or concept orientation; the capacity of the applications for rendering the representation were also assessed. Spatial proximity was measured as distance from the visual center (the average [x,y] coordinates of all fields displayed on the form). In addition, a spatial proximity map was created by measuring distance from each field on a typical form to every other field on the form. Semantic proximity was assessed by categorizing each field as an identity/synonym, belonging to the same question group, the same module, or the same page. Mapping was performed between spatial and semantic proximity to compare software applications.
3.1.4 Task analysis
The operationalization of UFuRT task analysis in the CRDM domain required identification of select activities from the functional analysis for more detailed evaluation. Six primary data management functions corresponding to Tan’s basic functions of health data management systems (Table 4) were chosen [17]. To operationalize the UFuRT methodology within our domain, the following tasks were used: (1) an example form was entered; (2) a discrepancy identification rule was carried out; (3) a data update was made; (4) a data file was loaded; (5) a term was coded; and (6) a data extract and transfer were performed in both software applications. Individual steps required to accomplish the function (tasks) were identified, labeled as internal or external, and counted to quantify the mental and physical steps needed to carry out each function. Thus, software applications could be evaluated based on total number of steps and number of mental versus physical steps to assess both the amount of time needed to complete tasks, as well as relative cognitive load on the user.
Table 4.
Six primary data management tasks
| Task | Definition |
|---|---|
| Enter data (key entry) | The process of putting data onto a machine-readable medium (ISO 2382-6, 1987). |
| Load data | 1) To put data in a database (ISO 2382-17, 1996); 2) To transfer data into storage device or working registers (ISO 2382-6, 1987). |
| Code data | 1) In clinical trials, the process of assigning data to categories for analysis (CDISC Glossary); 2) To code: to convert data by the use of a code in such a manner that reconversion to the original form is possible (ISO-2382-6, 1987). |
| Clean data | In clinical research, to identify discrepancies in data and attempt to resolve them either through deductive reasoning, situation-based guidelines, or verification with the source. |
| Store data | To maintain data in a way that allows changes and prevents adulteration while maintaining a link to the data values stored in each data element. Taken from: storage (device): A functional unit into which data can be placed, in which they can be retained, and from which they can be retrieved (ISO/IEC 2382-1: 1993), and storage organization: the arrangement of storage and of its access operations corresponding to a data structure and to its associations (ISO/IEC 2382-17, 1996). |
| Transfer data | To send data from one storage location to another. Syn. to move (ISO 2382-6, 1987). |
For our UFuRT operationalization, differences in numbers of steps and expert experience were used to estimate costs associated with each system. Our assumptions included a time of 1 minute for a user to read a data validation check and apply the logic to identify data discrepancies, and 5 minutes for a user to review a discrepancy, document it, and communicate it to the clinical investigational site. We estimated an additional 2 minutes per discrepancy to manually track the process, where applicable. We further assumed that a single-data-entry time of 4 min/page applied to both systems. This metric, low for double data entry and high for single data entry, includes time needed to select the file from storage, log into the system, enter data, and return the file to storage. The coding assumption for both systems was 5 minutes per manually coded term. Importantly, operationalization of UFuRT in this domain requires that information from the task analysis be used to inform the cost analysis. We accomplished this by a priori definition of operational metrics (described above) for the analyzed tasks and subsequent scaling based on step number. Keystroke-Level Modeling (KLM) or Goal, Operator, Method, Selection (GOMS) modeling [18,19] which take into account different times for different types of tasks, would further refine the cost analysis through a more direct coupling of the task analysis to the cost analysis.
3.2. Design objectives
We sought to demonstrate the domain-specific operationalization of UFuRT by comparing a general-purpose data collection tool (Microsoft Excel) with a commercially available CDMS (Clintrial). Although Web-based EDC is increasingly ubiquitous, we chose to use a paper-based CDMS because the work processes more closely resembled the data processing model employed by Excel users. Additionally, a comparison of Excel and Clintrial may help characterize the relative advantages and disadvantages of spreadsheets and CDMSs in a manner meaningful to investigators and research teams. Such comparisons within the CRDM domain require specification of an example research project for which data are to be collected and managed (Table 3).
Other applications, such as Microsoft Access (Redmon, WA), applications built “on top of” relational database management systems, and vended or open-source specialty applications that are also used for the management of clinical research data could have been used for this demonstration to provide a comparison of two similar systems. However, we sought to address a real and current problem within the domain; i.e., comparison of a ubiquitous general tool with a specialized clinical data management system. Thus, the applications that we selected for use in the demonstration differ widely in terms of user base and functionality. Excel and Clintrial lie at opposite ends of a spectrum with respect to domain specialization, process automation, cost, and support for the relational model and thus represent the breadth of systems presently used for managing clinical research data, thereby providing an informative demonstration of UFuRT for the CRDM domain. Understanding differences between products at opposite ends of such a spectrum may clarify similar questions surrounding other products in this domain.
3.3. System descriptions
The Microsoft® Excel 2003 service pack 2 spreadsheet program (Microsoft Corporation, Redmon, WA) and Clintrial™ version 4.4 (Phase Forward Inc., Waltham, MA) were evaluated. Excel is a robust general spreadsheet, rich in functionality and used across many industries to capture, store, and analyze data. It is easily obtained and costs a few hundred dollars, and can be installed on a desktop computer with a compatible operating system by a novice without assistance or other infrastructure. The software can be controlled and maintained locally at the user’s computer. Data are stored in individual files (with the application-specific extension .xls), which are created, named, and organized by the user.
The Clintrial system was developed specifically to manage clinical research data. Clintrial is touted as the market leader among CDMSs, with over 200 installations in the life sciences [20]. Clintrial is a client-server application that uses the Oracle relational database management system (RDBMS) for database transactions. Thus, application and data are separate, with data independence achieved through storage in the Oracle relational database. Clintrial supports multiple schemas wherein different sets of tables are created for each clinical trial. The system is neither simple nor quick to obtain, and requires RDBMS and network infrastructure to set up and maintain the application server and database. Products such as Clintrial, along with more recent Web-based EDC software, are mainstays of data management for regulated, industry-sponsored clinical trials, while spreadsheets are often used in small-scale, investigator-initiated clinical research.
4. Results
Because our primary focus was operationalization of the UFuRT in the CRDM domain as noted above, we present only high-level results of our demonstration, with the intent of exemplifying the type of information that future applications of this method in this domain should expect.
The work domain ontology developed from the UFuRT analysis contains 217 total classes and 16 relationships. The user analysis resulted in the identification and classification of ten roles or classes of users (Table 1). Fifty-five key functions were identified, defined, and rated for Clintrial and Excel. Inter-rater reliability was measured as average percentage agreement among four senior data managers; inter-rater reliabilities of 90.9% and 70.0% were obtained for Clintrial and Excel, respectively (Fig. 2). Clintrial directly supports 87% of key functions; Excel directly supports 18%. When indirectly supported functions (requiring additional manual steps), are included, Clintrial provides 91% of the functionality, while Excel provides 62%. Neither product supported optical scanning.
Fig 2.

Functional analysis.
The scale representation results provided in Table 5 show that the paper CRF tended to collect data at a lower scale than the inherent scale of the represented data element. Further, data reduction was not observed between the CRF and the Clintrial or Excel representations, as both applications had sufficient functionality to maintain the scale of the data as represented on the CRF. Field structure, however, differed between the products due to variations in available functionality. For example, when validation (drop-down lists) is used in Excel, the “type ahead” feature is not active and the user either selects from the drop-down menu with a mouse, or types the text string. In Clintrial, data in drop-down fields can be entered by keying the first letter of the choice, thereby minimizing keystrokes and other motion. There is significant optionality (lack of field structure) in Excel for data entry, including the option of entry as all text and entry with no field limits.
Table 5.
Data reduction in the data collection form design
| Represented | Representing (paper data collection form) | ||||
|---|---|---|---|---|---|
| Nominal | Ordinal | Interval | Ratio | Total | |
| Nominal (481) | 481 | 0 | 0 | 0 | 481 |
| Ordinal (21) | 0 | 21 | 0 | 0 | 21 |
| Interval (202) | 186 | 16 | 0 | 0 | 202 |
| Ratio (162) | 155 | 7 | 0 | 0 | 162 |
| Total (866) | 822 | 44 | 0 | 0 | 866 |
Clintrial data entry interface facilitated replication of all three form-level orientations (source, time, and concept), while the Excel data entry interface could not visually represent three orientations in the two-dimensional worksheet. Due to Excel’s row and column representation, the third orientation required additional worksheets, columns, or rows. For example, time was usually recorded as a record (row) identifier in Excel, whereas in Clintrial, data taken at different time points were represented as different patient visits in the navigation tree and, thus, on different data entry screens.
Excel also exhibited a lesser degree of spatial proximity than Clintrial (Table 6). For our demonstration CRF with 20 variables, users were obliged to transfer their hands from keyboard to mouse several times and visually scan for the correct column, slowing data entry and adding mental steps.
Table 6.
Distance from visual center of form
| Distance from visual center | Clintrial (paper) | Excel |
|---|---|---|
| Maximum (in) | 4.4 | 6.8 |
| Median (in) | 1.8 | 3.5 |
| Average (in) | 2.1 | 3.5 |
Semantic proximity is mapped to spatial proximity in Fig. 3. From this mapping, it can be seen that almost 9% of fields on the demonstration form are ≥ 8 inches apart in the Excel representation, clearly outside of the usual field of view (1–4 deg, or approximately 0.5–2.0 inches at a distance of 28 inches from the computer monitor). In the Clintrial representation, on the other hand, no two fields are as much as 8 inches apart, and the majority are 2–4 inches apart, a difference directly attributable to Clintrial’s form-based representation, as opposed to the table-based representation in Excel. Further, as the number of variables on a form increases, the spatial proximity decreases more rapidly in the table-based representation and semantic and spatial proximity are further decoupled. Thus, whereas spatial and semantic proximity correlate closely on the CRF and Clintrial representations, they do not do so in the Excel table-based view. The user must therefore compensate, mapping the form view of the CRF to the table view in Excel and increasing the amount of visual scanning, resulting in higher cognitive loads [21,22].
Fig. 3.
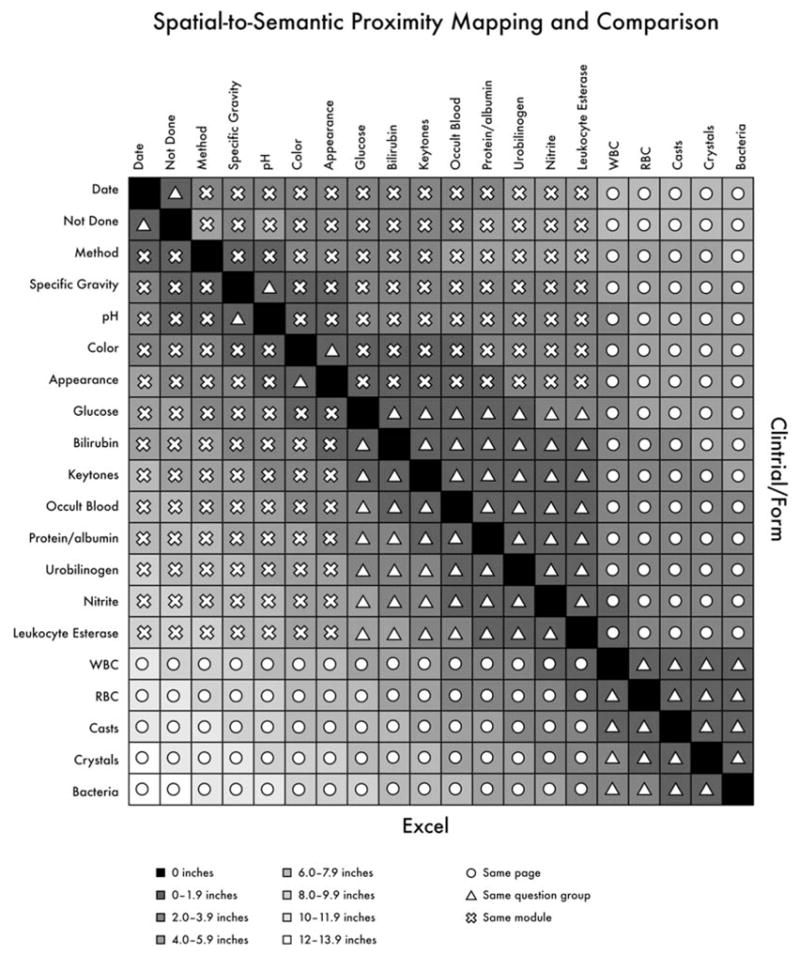
Mapping of spatial and semantic proximity.
The task analysis results displayed in Table 7 show the number of steps required to process data for the example clinical trial in each system. The total number of steps was higher in Excel, but also importantly, a greater percentage of Excel steps were internal: 364,042 (41%) versus 200,642 (26 %) for Clintrial. In addition, for forms with more than 10 fields, the table-based view of Excel forces either multiple keyboard-to-mouse hand movements (physical steps), or visual mapping from the data source to a more normalized spreadsheet structure (mental steps) resulting in a higher cognitive load on the user [21,22].
Table 7.
Task analysis
| Task | Steps/unit | Internal steps/unit | No. of units | Total steps |
|---|---|---|---|---|
| Excel | ||||
| Data entry | 68 | 19 | 10,000 | 680,000 |
| Data load | 14 | 5 | 6 | 84 |
| Screening | 1 | 1 | 8,000 | 8,000 |
| Interactive coding | 5 | 4 | 1,000 | 5,000 |
| Identify discrepancies | 4 | 4 | 30,000 | 120,000 |
| Review & send discepancies | 3 | 1 | 6,000 | 18,000 |
| Update stored data | 10 | 6 | 6,000 | 60,000 |
| Extract stored data | 8 | 2 | 6 | 48 |
| Total | – | – | – | 891,132 |
| Clintrial | ||||
| Data entry | 71 | 17 | 10,000 | 710,000 |
| Data load | 9 | 3 | 6 | 54 |
| Screening | 5 | 2 | 6 | 30 |
| Interactive coding | 6 | 3 | 200 | 1,200 |
| Identify discrepancies | 0 | 0 | 0 | 0 |
| Review & send discrepancies | 3 | 2 | 6,000 | 18,000 |
| Update stored data | 9 | 3 | 6,000 | 54,000 |
| Extract stored data | 7 | 2 | 6 | 42 |
| Total | – | – | – | 783,326 |
These findings, together with operational metrics derived from one author’s (M.N.) experience managing a large clinical trial data center, were used to model the cost of managing data for the example trial in both Clintrial and Excel. Because spatial proximity issues, a greater number of total steps, and a higher proportion of internal steps in Excel would yield slower entry times with that utility, we correspondingly adjusted our data entry metric to 4 minutes as the time required to data-enter a CRF page in Excel, versus 3.84 minutes in Clintrial. On the basis of these results we also added 2 minutes per discrepancy in Excel to account for manually applying the rule and tracking each discrepancy. Importantly, these task analysis results thus inform an associated cost analysis.
In addition to the data processing metrics described in the Methods section, time required for programming, user testing, and coordination of data processing were included to yield a more comprehensive cost analysis. Programming, including user testing for the database and data validation checks, was estimated at 1.5 hours per page for database set-up and 1.5 hours for programming each rule. We assumed 20 hours per month for managing data collection and an additional 10 hours per month for additional administrative tasks (daily back-ups; creation of status reports; reconciliation of manual tracking with data) needed for the Excel system. Our model assumed a 21-month enrollment period at a rate of 1 enrollment per month. A blended annual salary of $40,000 with a 22% overhead rate was used to account for the combination of data processor, programmer, and data manager rates (Table 8).
Table 8.
Components of cost analysis for example trial
| One study | Clintrial | Excel |
|---|---|---|
| Database set-up | 600 h | 20 h |
| Data entry | 973 h | 973 h |
| Data cleaning | 729 h | 1456 h |
| Coding | 17 h | 85 h |
| Data loading | 28 h | 56 h |
| Coordination | 580 h | 870 h |
| Total | 2927 h | 3460 h |
| Total cost | $68,660 | $81,419* |
licensing cost included
All of the data management costs here are variable; the particular cost drivers for each of the six categories of data management tasks, however, are different. Database set-up costs are determined by number of total and unique CRF pages as well as number of data validation checks programmed. Data entry costs are driven by the number of data fields to be entered, often assessed at the page level by assuming a standard number of fields per page (e.g., 20–25). Data cleaning costs are driven ultimately by the number of queries generated. After database set-up, coding costs are driven by the number of manually coded terms, while data import and export costs are driven by the number of data transfers.
Costs of large trials vary as a function of CRF size [23]. For example, if five pages of data are collected instead of a 100-page CRF (a difference of 80%), time needed for programming, data entry, and, often, cleaning and coding also decreases proportionately. Time needed for data coordination, however, does not decrease in proportion: for our example trial, 20%–30% of an individual’s time (30–45 hours per month) would be a typical allocation.
We modeled data management costs for the example trial over an increasing number of studies per year; licensing costs of Excel were included. The licensing cost of a CDMS was not, because such costs vary greatly. Presenting the analysis in this manner (Fig. 4) facilitates identification of the price point at which a CDMS becomes financially justifiable. For example, given a modest estimate of $100,000 in licensing fees, implementation, and administration, a specialized CDMS was not financially advantageous when fewer than 8–15 trials were conducted per year.
Fig. 4.

Cost analysis.
5. Discussion
It is evident that user roles in the CRDM domain are common across systems that are likely to be evaluated in a comparative nature. The characteristics of an individual clinical trial, however, may result in different use patterns. For example, depending on whether the trial is large, Web-based, or investigator-initiated, data may be entered at a central data center, at clinical investigational sites, or by the site investigator. Thus, the data collection scenario impacts user roles and system use. Our operationalization framework for the UFuRT methodology makes these different use patterns explicit through modifications of the responsibilities and other dimensions shown in Table 1.
Our classification scheme (directly supported versus indirectly supported) distinguished between task automation and manual steps, thereby illuminating areas where customization or use of additional software would be necessary. Also, the work domain ontology initiated here contributes to the further definition of the CRDM domain and is likewise applicable to other evaluations within this domain.
The representational analysis focused on the data capture functionality (input), as shown in Fig. 1. Although data input is the predominant transactional aspect with respect to usability, other applications in the CRDM domain may benefit from representational analysis in data display, extraction, or manipulation. The representational analysis combined with the task analysis was successful in identifying differences in user cognitive load. The impact of field and form structure on data quality was not evaluated in this work and remains an area for future research.
The task analysis revealed differences in the number of total and internal steps, an indicator not only of usability but also of data processing costs. Our cost model, based on the six main tasks plus database set-up and data coordination time, is applicable to other areas where the evaluators are able to obtain similar organizational metrics or feel that those presented here are acceptably representative. Because many investigators are unfamiliar with detail-level data collection and management tasks, they may not anticipate additional manual steps needed for indirectly supported but essential functions. Application of this evaluation framework renders these steps transparent and does so in an objective manner.
5.1 Depth and Differentiation Achieved through UFuRT
UFuRT differentiated different aspects of usability; e.g., cognitive load, distributed cognition, and number of task steps, and socio-technical aspects. For example, through the cost analysis, we demonstrated that start-up costs are significantly less with Excel in terms of training, infrastructure, and licensing. As evidenced by the number of manual steps required when using a general tool like Excel, the volume capacity of CDMSs is often necessary for large multicenter trials and may be a factor in choosing systems. Factors such as need for automation, type of research, available staff, and extent of desired local control tend to be specific to the organization. While selection of clinical research data management products is often based on functionality alone, organization-specific needs warrant the additional depth and insight afforded by systematic usability evaluation. CRDM software is a sizable investment for most organizations, often costing over $1 million, and the costs associated with application of a more systematic evaluation thereby pales in comparison.
5.2 Limitations
The demonstration portion of our study did not evaluate systems in the context of different types of research, or for more than one clinical trial. We used an example CRF that was deemed “typical;” use of an atypical form might yield different results. The functions we investigated were obtained from an analysis of clinical trials data management; results drawn from analyses of pre-clinical research, registries, or community research might differ from our findings. Due to the options available in Excel, the field counts would be different for different table structures; e.g., stacked (fewer columns, such as lab test name and value) versus one column per variable (lab test). We used a flat (de-normalized one row per patient or time point, one variable per column) structure, which in our experience is most often chosen by users in the clinical research data management domain. A more normalized data model would lead to different task counts. Steps were manually counted for the task analysis at the level of detail deemed illustrative; a task analysis that included more formal methods, such as GOMS, KLM, or keystroke capture might produce different counts.
6. Conclusions
In summary, the systematic UFuRT analysis was successfully operationalized and applied to answer a question of importance to the CRDM domain. Differences in functionality, representation, and number of steps required for tasks specific to the domain were characterized, showing Excel to be a more manual and resource-intensive solution for clinical research data collection and management. The application of this methodology in a comparative usability evaluation provides insight into the differences between the compared software applications, and the implications of those differences for potential users. Importantly, the UFuRT method facilitated discrimination of cost and task (number of steps) factors from related socio-technical factors, further illuminating the latter. Importantly, UFuRT can be operationalized with similar methodology in other domains.
Acknowledgments
This work was supported by the Clinical and Translational Science Awards (CTSA) to Duke University (1UL1 RR 024128) and to the University of Texas Health Science at Houston (1 UL1 RR 02414).
The authors wish to thank Curtis Campbell, Michelle Crowder, and Reza Rostami for providing function ratings for the inter-rater reliability assessment. The authors also wish to thank Anthony Doll for his work in the graphic design of Fig. 3, and Jonathan McCall for editorial assistance with this manuscript.
Footnotes
Publisher's Disclaimer: This is a PDF file of an unedited manuscript that has been accepted for publication. As a service to our customers we are providing this early version of the manuscript. The manuscript will undergo copyediting, typesetting, and review of the resulting proof before it is published in its final citable form. Please note that during the production process errors may be discovered which could affect the content, and all legal disclaimers that apply to the journal pertain.
References
- 1.Zhang J, Butler K. UFuRT: A Work-Centered Framework and Process for Design and Evaluation of Information Systems. HCI International Proceedings; 2007. [Google Scholar]
- 2.Butler K, Zhang J, Esposito C, Bahrami A, Hebron R, Kieras D. Work-centered design: A case study of a mixed initiative scheduler. Proceedings of CHI; 2007. [Google Scholar]
- 3.Zhang J, Patel VL, Johnson KA, Malin J, Smith JW. Designing human-centered distributed information systems. IEEE Intelligent Systems. 2002;17:42–47. [Google Scholar]
- 4.Schmier JK, Kane DW, Halpern MT. Practical applications of usability theory to electronic data collection systems for clinical trials. Contemp Clin Trials. 2005;26:376–385. doi: 10.1016/j.cct.2005.01.012. [DOI] [PubMed] [Google Scholar]
- 5.Constantine LL, Lockwood LAD. Software for Use: A Practical Guide to the Models and Methods of Usage-Centered Design Addison-Wesley Professional. 1999 [Google Scholar]
- 6.Litchfield J, Freeman J, Schou H, Elsley M, Fuller M, Chubb B. Is the future of clinical trials Internet-based? A cluster randomized trial. Clin Trials. 2005;2:72–79. doi: 10.1191/1740774505cn069oa. [DOI] [PubMed] [Google Scholar]
- 7.Weber B, Yarandi H, Rowe M, Weber J. A comparison study: paper-based versus web-based data collection and management. Appl Nurs Res. 2005;18:182–185. doi: 10.1016/j.apnr.2004.11.003. [DOI] [PubMed] [Google Scholar]
- 8.U.S. National Institutes of Health. [ (accessed March 21, 2008)];ClinicalTrials.gov Web site. ClinicalTrials.gov data element definitions (draft) 2008 February 5; Available at: http://prsinfo.clinicaltrials.gov.
- 9.National Library of Medicine Web site. [(accessed October 31, 2007)];Medical Subject Headings (MeSH) Available at: http://www.nlm.nih.gov/mesh/
- 10.Spear A. Ontology for the Twenty-First Century: An introduction with recommendations. Saarbrucken; Germany: 2006. [Google Scholar]
- 11.ISO 2382-1, Information Technology Vocabulary Part 1: Fundamental Terms, ISO/IEC 2382-1:1993.
- 12.ISO 2382-17, Information Technology Vocabulary Part 17: Databases, ISO/IEC 2382-1:1996.
- 13.ISO 11179-3, Information Technology Metadata Registries Part 3: Registry Metamodel and Basic Attributes, ISO/IEC 11179-3:2003.
- 14.Raymond S, Gawrylewski H, Ganter J, Gertel A. [ (accessed March 21, 2007)];CDISC Clinical Research Glossary. Applied Clinical Trials. 2006 December; Available at: http://www.cdisc.org/glossary/index.html.
- 15.Stevens SS. On the theory of scales of measurement. Science. 1946;103:677–680. doi: 10.1126/science.103.2684.677. [DOI] [PubMed] [Google Scholar]
- 16.Zeng Q, Cimino JJ, Zou KH. Providing concept-oriented views for clinical data using a knowledge-based system: an evaluation. J Am Med Inform Assoc. 2002;9:294–305. doi: 10.1197/jamia.M1008. [DOI] [PMC free article] [PubMed] [Google Scholar]
- 17.Tan J. Health management information systems: Methods and practical applications. 2. Gaithersburg, MD: Aspen Publications; 2001. [Google Scholar]
- 18.Kieras D. Using the Keystroke-Level Model to estimate execution times. 2001 [Google Scholar]
- 19.Kieras D. A Guide to GOMS Task Analysis. 1994 [Google Scholar]
- 20.PhaseForward, Inc. [ (accessed July 13, 2008)]; Web site. Available at: https://www.phaseforward.com/products/clinical/cdm/
- 21.Zhang J, Norman DA. Representations in distributed cognitive tasks. Cogn Sci. 1994;18:87–122. [Google Scholar]
- 22.Zhang J, Patel VL. Distributed cognition, representation, and affordance. Cognition and Pragmatics. 2006;14:333–341. [Google Scholar]
- 23.Eisenstein EL, Lemons PW, 2nd, Tardiff BE, Schulman KA, Jolly MK, Califf RM. Reducing the costs of phase III cardiovascular clinical trials. Am Heart J. 2005;149:482–488. doi: 10.1016/j.ahj.2004.04.049. [DOI] [PubMed] [Google Scholar]