

Abstract
Infection with mouse adenovirus type 1 (MAV-1) results in fatal acute encephalomyelitis in susceptible mouse strains via infection of brain endothelial cells. Wild-type (wt) MAV-1 causes less brain inflammation than an early region 3 (E3) null virus in C57BL/6 mice. A mouse brain microvascular endothelial cell line infected with wt MAV-1 had higher expression of mRNAs for the proinflammatory chemokines CCL2 and CCL5 than mock- and E3 null virus-infected cells. Primary mouse brain endothelial cells infected with wt virus had elevated levels of CCL2 compared to mock- or E3 null virus-infected cells. Infection of C57BL/6 mice with wt MAV-1 or the E3 null virus caused a dose-dependent breakdown of the blood-brain barrier, primarily due to direct effects of virus infection rather than inflammation. The tight junction proteins claudin-5 and occludin showed reduced surface expression on primary mouse brain endothelial cells following infection with either wt MAV-1 or the E3 null virus. mRNAs and protein for claudin-5, occludin, and zona occludens 2 were also reduced in infected cells. MAV-1 infection caused a loss of transendothelial electrical resistance in primary mouse brain endothelial cells that was not dependent on E3 or on MAV-1-induced CCL2 expression. Taken together, these results demonstrate that MAV-1 infection caused breakdown of the blood-brain barrier accompanied by decreased surface expression of tight junction proteins. Furthermore, while the MAV-1-induced pathogenesis and inflammation were dependent on E3, MAV-1-induced breakdown of the blood-brain barrier and alteration of endothelial cell function were not dependent on E3 or CCL2.
Adenoviruses are host restricted in their replication, and pathogenesis is best studied in the natural host. Human adenovirus infections are typically mild and self-limiting in immunocompetent hosts; however, disease can be much more severe in patients who are immunocompromised (86). Disseminated human adenovirus infections in transplant or other immunodeficient patients can result in encephalitis, and these infections have a mortality rate of up to 60% (18, 21, 22, 27, 63, 75). Mouse adenovirus type 1 (MAV-1) infection causes dose-dependent encephalitis in susceptible mouse strains through infection of endothelial cells (13, 32, 66). MAV-1 is similar to human adenovirus in genome and structure, and both viruses cause persistent infections, making MAV-1 a good model for adenovirus-based disease in the natural host. While signs of disease and lethality of MAV-1 infection are positively associated with the presence of inflammatory cells in the brain (10, 48), the precise manner in which MAV-1 infection causes inflammation and disease is not yet understood.
Integrity of the blood-brain barrier (BBB) is important for regulating the flow of nutrients from the blood to the brain and restricting access by toxins and other substances that are harmful to the central nervous system (CNS) (34, 53). The BBB also functions to restrict access of inflammatory cells to the CNS, protecting irreplaceable cells such as neurons from swelling and damage. The BBB is composed of microvascular endothelial cells, astrocytes, pericytes, neurons, and basement membrane, connected by a network of tight junctions, adherens junctions, and gap junctions.
Many diseases that affect the CNS also alter the function of the BBB (3, 42, 49), often through disruption of tight junctions (17, 42). Human immunodeficiency virus type 1 (HIV-1) encephalitis results in increased permeability of the BBB, and HIV-1 infection causes a reduction in expression of tight junction proteins (23). This altered tight junction protein expression is dependent on CCL2, a chemokine that itself causes a decrease in expression of tight junction proteins and loss of barrier properties in brain endothelial cells (65, 67, 68). Human T-lymphotropic virus 1 also alters tight junction protein expression and barrier properties of brain endothelial cells (1). West Nile virus infection in a mouse model causes breakdown of the BBB mediated by Toll-like receptor 3 and tumor necrosis factor alpha (TNF-α) signaling (77). Intracellular adhesion molecule 1 (ICAM1) and matrix metalloproteinase 9 (MMP-9) signaling have also recently been shown to contribute to BBB breakdown in West Nile virus infections (16, 76). Dengue virus reduces endothelial cell barrier properties in a CCL2-dependent manner (46). Treatment of human umbilical vein endothelial cells with supernatant from dengue virus-infected cells results in decreased expression of ZO-1, a tight junction protein important for vascular integrity. Infection with neurotropic mouse hepatitis strains that cause acute encephalitis results in neutrophil influx with increased MMP-9 activity that correlates with loss of tight junctions in the BBB (59, 87). Thus, human and mouse viruses can alter the BBB and tight junctions through a variety of mechanisms, none of which is fully understood.
We investigated how MAV-1 infection of mice results in fatal encephalitis. In the brain, MAV-1 infection is observed in endothelial cells (34, 41). Infection resulted in recruitment of inflammatory cells to the brain, both dependent on E3 (cytotoxic T lymphocytes) and independent of E3 (neutrophils). BBB integrity was compromised after infection with MAV-1, independent of E3. Although inflammation contributes to MAV-1 pathogenicity and correlates with E3 gene expression (11, 48), breakdown of the BBB was largely independent of the presence of inflammatory cells. Infection with either wild-type (wt) MAV-1 or the E3 null virus resulted in reduced expression and cell surface localization of tight junction proteins along with loss of barrier properties in primary mouse brain microvascular endothelial cells. Infection with the E3 null mutant did not induce CCL2 production, and anti-CCL2 antibody treatment of MAV-1-infected cells was unable to prevent MAV-1-induced loss of transendothelial electrical resistance (TEER). Together these data indicate that CCL2 production was not necessary for MAV-1-induced alteration of endothelial cell function.
MATERIALS AND METHODS
Cells and viruses.
Mouse brain microvascular endothelial cells (MBMECs) were originally obtained from Howard Fox, Scripps Research Institute, and were maintained in MBMEC growth medium (Cell Applications, Inc., San Diego). Isolation of primary mouse brain endothelial cells (pmBECs) is described below. wt MAV-1 comes from the original stock obtained from S. Larsen (7). pmE101 is the wt parental virus used to construct mutant virus pmE314; pmE314 has stop codons in all three reading frames encoding E3 sequences (10). pmE101 was used as the wt virus throughout this work as a control in all experiments using pmE314.
Mice and infections.
Male C57BL/6 mice were obtained from Charles River (C57BL6/NCr) or Jackson Laboratories (C57BL6/J). Perforin-deficient (pfp−/−) mice (C57BL/6-Prf1tm1Sdz/J) were obtained from Jackson Laboratories. Three- to 5-week-old mice were infected via intraperitoneal (i.p.) injection with 103 or 104 PFU of virus diluted in phosphate-buffered saline (PBS) in a total volume of 100 μl. Mock-infected mice were injected with conditioned medium diluted in PBS. Organs for histological studies were harvested from mice 8 days after infection and either snap frozen or fixed in 3.7% formaldehyde in PBS. Sections were stained with hematoxylin and eosin for histopathological analysis and observed under an Olympus BX60 upright fluorescence microscope using only white light. All animal experiments complied with relevant university and federal guidelines for humane use and care. Animals were housed in microisolator cages and provided with food and water ad libitum.
Preparation of cells and staining for flow cytometry.
C57BL6/NCr mice in groups of five were mock infected or infected with 103 PFU of wt MAV-1 or pmE314 for 8 days. Mice were euthanized and immediately perfused with 30 ml of PBS before organ collection. CNS cells were isolated by a method similar to that of Campanella et al. (9). Briefly, brains from each infection condition were pooled and homogenized in Dulbecco's modified Eagle medium (DMEM) with 10% heat-inactivated calf serum to create a single-cell suspension. A step gradient was used to isolate cells for staining. Cells were suspended in a 15-ml conical tube in 70% Percoll in DMEM in a final volume of 5 ml and then overlaid with 37% Percoll in PBS (4 ml) followed by 30% Percoll in DMEM (4 ml). After a 20-min spin at 1,500 × g, the cells at the 37:70% interphase were collected. Cells were treated with fluorescently labeled antibodies to CD8, CD4, CD19, CD45, CD69, Gr-1 (Ly6 G/C, which stains primarily neutrophils), or F4/80 (which stains primarily macrophages) (F4/80 was from Invitrogen, Carlsbad, CA; all other antibodies were from BD, San Jose, CA). Cells were analyzed using a FACSCanto (BD) and FlowJo software (Tree Star Inc, Ashland, OR).
Primary cell isolation.
pmBECs were isolated by a combination of methods described previously (64, 67). Briefly, cortexes from 30 to 60 3- to 4-week-old C57BL6/NCr mouse brains were isolated and cleaned of blood vessels. Tissue was minced, homogenized, and suspended in a solution of 18% dextran (USB, Cleveland, OH) with 50 mM HEPES and antibiotic/antimycotic. The dextran solution was spun at 12,000 × g for 10 min to remove myelin. Cell pellets were digested for 90 min in 1-mg/ml collagenase/dispase (Roche, Indianapolis, Indiana) made in Hanks' balanced salt solution (Gibco) at 37°C. After digestion, microvessels were isolated by positive selection using sheep anti-rat Dynabeads (Invitrogen) labeled with a rat anti-CD31 antibody (Southern Biotechnology). Dynabeads were labeled by overnight incubation at 4°C with 0.1 volume of antibody and then washed in Hanks' balanced salt solution. Microvessels from 30 mice were plated initially on a surface area of 28.5 cm2 on collagen IV-coated plates (BD) in DMEM (Gibco) containing 10% fetal bovine serum, 10% newborn calf serum, 0.1 mg/ml endothelial cell growth supplement (BD), 0.1 mg/ml heparin (Sigma), 2 mM glutamine, Pen/Strep (Gibco), antimycotic/antibiotic (Gibco), nonessential amino acids (Sigma), and 20 mM HEPES (Sigma). When confluent, cells were passaged one time 1:3 with trypsin-EDTA before use. These cells are designated pmBECs throughout this work.
pmBEC characterization.
To confirm their ability to take up DiI-labeled acetylated low-density lipoprotein, pmBECs were incubated for 2 hours at 37°C with the lipoprotein (Biomedical Technologies Inc.), rinsed with PBS, and visualized using an Olympus BX60 upright fluorescence microscope. J774 macrophages were used as a positive control with the same conditions. pmBECs were tested for CD31, ICAM, and VCAM expression levels by flow cytometry. Cells were trypsinized and incubated with anti-mouse CD16/CD32 monoclonal antibody (Fc Block; BD) prior to staining. Primary hamster anti-ICAM and rat anti-VCAM and anti-CD31 antibodies were from BD (San Jose, CA) and were detected with anti-hamster-fluorescein isothiocyanate (FITC) from Rockland (Gilbertsville, PA) and anti-rat-phycoerythrin (Sigma)-labeled secondary antibodies, respectively. Cells were analyzed with the FACSCanto as described above.
Growth curve/plaque assay.
pmBECs were grown on a 24-well plate coated with collagen IV and infected at a multiplicity of infection (MOI) of 5. Virus was allowed to adsorb for 1 h at 37°C before the addition of medium. At 1, 2, 3, 4, and 5 days postinfection, cells were scraped off the plate and collected along with supernatants. Input virus plus conditioned medium was used for the 0 days postinfection time point. After three rounds of freeze-thawing to release any intracellular virus, infectious virus was quantified by plaque assay on 3T6 cells (12).
Quantitation of MAV-1 by capture ELISA.
Brain homogenates were prepared as previously described (80) and assayed for MAV-1 by capture enzyme-linked immunosorbent assay (ELISA) (81). A total of 1.85 × 10⁶ PFU of a MAV-1 virus stock, PBS, and conditioned medium were included as positive and two negative controls, respectively, in each assay performed. The quantitation of virus particles by ELISA has been shown to correlate with infectious virus levels measured by plaque assay (80). There is a linear relationship between the log10 of the virus titer and the log10 of the ELISA optical density.
Sodium fluorescein injection and quantification.
Ten minutes before euthanasia, mice were injected i.p. with 100 μl of sterile 10% sodium fluorescein (Sigma) in PBS. Immediately after euthanasia, blood was collected, and then the mice were perfused with 30 ml of PBS. Brains were isolated and photographed against a black background under a UVP M-20 Transilluminator (UVP, Upland, CA) at 302 nm using the high-intensity (9,400-mW/cm2) setting. The brains were ∼4 in. below the UV source. Images were captured with an Olympus C4040 digital camera. Brains were then snap frozen until used for quantitation. To quantify sodium fluorescein in the brain, the method of Phares et al. (54) was used. Briefly, brain tissue was homogenized in 7.5% trichloroacetic acid (TCA), centrifuged, and then neutralized with 5 N NaOH. Fluorescence was measured with a microplate reader with excitation at 485 nm and emission at 530 nm, and the amount of fluorescein for each sample was determined by comparison to standards ranging from 0.125 μg/ml to 4 μg/ml. Brain values were normalized to serum dye concentrations for each mouse to allow comparisons among mice. The uptake ratio is the ratio of the amount of sodium fluorescein measured in the brain to the amount measured in serum. Serum was isolated from the blood, and serum dye levels were measured by mixing equal parts serum and 15% TCA, centrifuging, and mixing the supernatant with 1:1 7.5% TCA-5 N NaOH. Fluorescence was measured as described above.
Immunofluorescence.
pmBECs were grown on collagen IV-coated Lab-Tek chamber slides (Nalge Nunc, Rochester, NY). Cells were infected for 48 h at an MOI of 5 and then stained for tight junction protein expression. Cells were washed, fixed with 3.7% formaldehyde for 15 min at room temperature (RT), and then permeabilized with ice-cold methanol for 1 min. All remaining steps took place in a humid chamber. To block, cells were incubated for 1 h at RT with 1% bovine serum albumin in TBS-TX (25 mM Tris-HCl [pH 8.0], 150 mM NaCl, 0.1% Triton X-100). Monoclonal antibodies to zona occludens-2 (ZO-2) (BD no. 611560), occludin (Invitrogen no. 331500), or claudin-5 (Invitrogen no. 352500) were all used at a 1:50 dilution in 1% bovine serum albumin in TBS-TX for 1 h at RT. To stain for virus, the AKO-1-103 rabbit antibody to MAV-1 capsid (80) was used at a 1:5,000 dilution. After washing, cells were incubated for 1 h at RT with Alexa-Fluor 594-conjugated anti-mouse secondary antibody (Invitrogen) and anti-rabbit-FITC (Vector Labs) at 1:200 dilutions. Samples were mounted with coverslips using ProLong Gold antifade reagent with DAPI (4′,6′-diamidino-2-phenylindole) (Invitrogen) and visualized with an Olympus BX60 upright fluorescence microscope.
CCL2 ELISA.
pmBECs were mock infected or infected with wt MAV-1 or pmE314 at an MOI of 5. Supernatants were collected at 0, 6, 12, 24, 48, and 72 h after infection and assayed for CCL2 expression by ELISA by the University of Michigan Cellular Immunology Core Facility.
RT-qPCR.
RNA was isolated from cells using Tri Reagent (Molecular Research Center, Inc., Cincinnati, OH) according to the manufacturer's instructions. cDNA was synthesized from total pmBEC RNA using random hexamers and Moloney murine leukemia virus reverse transcriptase (RT) (Invitrogen). Quantitative PCR (qPCR) was performed on an Applied Biosystems 7300 real-time PCR machine (Foster City, CA). Primers used to amplify claudin-5 were Mm00727012_s1 and GAPDH (glyceraldehyde-3-phosphate dehydrogenase) 4352339E (Applied Biosystems) with fluorescent probe detection. SYBR green was used for detection of the other mRNAs by RT-qPCR: primers for ZO-2 were F455 (5′CCGAGGTTTTGAAGTGATTGAAG3′) and R528 (5′TGTGCCGACTCCTC TCACTGT3′); for occludin they were F1270 (5′AGCCTCGGTACAGCAGCAAT3′) and R1329 (5′CCTTCGTGGGAGCCCTTT3′); and for GAPDH they were GAPDHfwd (5′TGCACCACCAACTGCTTAG3′) and GAPDHrev (5′GGATGCAGGGATGATGTTC3′). Claudin-5 reactions were run in duplex with GAPDH primers as an internal control for normalization of the chemokine signal. Two microliters of cDNA was added to 25-μl reaction mixtures containing 12.5 μl of 2× TaqMan universal PCR mix (Applied Biosystems) and 1.25 μl each of 20× primer/probe for the claudin-5 and GAPDH. Separate reactions with GAPDH primers were prepared in parallel with ZO-2 or occludin primers for each sample. Two microliters of cDNA was added to 25-μl reaction mixtures containing iTaq SYBR green Supermix with ROX (Bio-Rad) with 1.5 μl of each primer. Melting curve analyses were performed for SYBR green reactions. All reactions were for 40 cycles of 15 s at 90°C and 60 s at 60°C. Target gene expression was calculated by normalization to GAPDH and expressed as fold change from control groups (mock infection) using the comparative threshold cycle method (8).
RPA.
Total RNA was isolated as described above and analyzed by RNase protection assay (RPA) as described previously (78). Chemokine RNA expression was measured using the mCK-5c riboprobe template (Pharmingen), and MAV-1 hexon RNA expression was measured with a custom probe set and normalized to L32 levels as described previously (24, 79). All reactions used [α-32P]UTP (Amersham) as the labeling nucleotide. Bands were detected by autoradiography and quantified using a Storm or Typhoon PhosphorImager and ImageQuant software (GE Healthcare).
Western blot analysis.
Cells were lysed in radioimmunoprecipitation buffer (10 mM Tris, 140 mM NaCl, 1% Triton, 1% Na deoxycholate, 0.1% sodium dodecyl sulfate [SDS], 1 μg/ml aprotinin, 50 mM NaF, and protease inhibitor cocktail [Sigma]) for 15 min at 4°C and centrifuged. Total protein concentrations in the supernatants were determined by the Bradford protein assay (Bio-Rad). Equal amounts of protein from each sample were separated on a 10% SDS-polyacrylamide gel and transferred to a Protran nitrocellulose membrane (ISC BioExpress, Kaysville, UT). Rabbit polyclonal antioccludin (Invitrogen no. 711500), mouse monoclonal anti-claudin-5 and mouse monoclonal anti-ZO-2 (both as described above) and rabbit polyclonal actin (Santa Cruz Biotechnology, Santa Cruz, CA; no. SC-1616-R) antibodies were used at a 1:200 dilution. The antibodies were detected with Amersham ECL Plus Western blotting detection reagent (Amersham/GE Healthcare, Pittsburgh, PA).
Measurement of TEER.
Approximately 1.7 × 10⁵ to 2.5 × 10⁵ pmBECs per well were grown on a 12-mm collagen IV-coated 12-well transwell plate (Corning, Corning, NY) with a 0.4-μm pore size. Cells were grown in the presence of 20% conditioned astrocyte medium (a kind gift from A. Andjelkovic) to promote tight junction formation. After 7 to 10 days of growth on the transwell plate, cells were mock infected or infected with either wt MAV-1 or pmE314 at an MOI of 5. TEER was measured with an Endohm-12 electrical resistance apparatus (World Precision Instruments Inc., Sarasota, FL) before infection and every 24 h following infection. Resistance of a blank transwell insert was measured as a background reading and subtracted from all experimental values. Recombinant CCL2 (Peprotech) was added as indicated to a final concentration of 100 nM. Neutralizing CCL2 antibody (43) or control naïve rabbit serum was added to cultures at a 1:50 dilution.
MTT assay.
To assess pmBEC viability, cells were treated with 3 mg/ml of 3-(4,5-dimethylthiazolyl-2-yl)-2,5-diphenyltetrazolium bromide (MTT) (Invitrogen). After 2 hours, the solution was aspirated and 0.05 N acetic acid in isopropanol was added to solubilize dye crystals. The optical density of a 1:1 mixture of dye and water was measured at 570 nm to determine cell viability. Sample values were normalized to values for mock-infected cells, which were set at 100%.
Statistical analysis.
Statistical analysis was carried out using Microsoft Excel v. 11.5.3 (Everett, WA), SPSS v.16 (Chicago, IL), and Graph Pad Prism (La Jolla, CA) software.
RESULTS
MAV-1-induced inflammation in the brain is reduced in the absence of E3.
To study how MAV-1 causes fatal encephalitis in susceptible mouse strains (32, 66), we infected C57BL/6 mice for 8 days, corresponding to a time of acute infection and maximum inflammation in the brain (48). A virus null for E3 expression, pmE314, causes low levels of inflammation in outbred mice despite replicating to titers similar to those of wt MAV-1 (10; L. Gralinski, unpublished data). To test whether this was also true in inbred mice, we infected C57BL6/NCr mice with 103 or 104 PFU of wt MAV-1 or pmE314. Hematoxylin- and eosin-stained brain sections showed the presence of inflammatory cells and significant perivascular edema in wt virus-infected mice (Fig. 1A). Previous studies have shown that MAV-1 infects endothelial cells that comprise the blood vessels of the brain (34, 41). Fewer inflammatory cells were seen surrounding the blood vessels of mice infected with pmE314 than in mice infected with wt virus. In all infected animals the endothelium in the brain was thickened compared to that in mock-infected animals. Virus titers in wt- and pmE314-infected inbred mouse brains were similar (data not shown; see Fig. 3A), despite the presence of higher numbers of inflammatory cells in wt virus-infected mice. These results were consistent with those seen previously in outbred mice (10).
FIG. 1.

Inflammation in the brains of mice infected with MAV-1. (A) Mice were infected with 103 or 104 PFU of the wt MAV-1 or pmE314 (E3−) virus or mock infected for 8 days. Brain sections were mounted on slides, stained with hematoxylin and eosin, and examined by microscopy. The 103-PFU dose sections were processed by formaldehyde fixation, while the 104-PFU dose sections were processed as frozen sections. This resulted in differences in the staining, so the two images shown for the 104-PFU dose were adjusted in Adobe Photoshop for their magenta hue/saturation as follows: −40 hue, −100 saturation, and + 96 lightness. (B) C57BL6/NCr mice were mock infected or infected with 103 PFU of wt MAV-1 or pmE314. At 8 days postinfection, brains were analyzed for the presence of inflammatory cells by flow cytometry with markers described in the text. Each group represents the number of cells per brain from analysis of five brains that were pooled for staining in one experiment and is representative of three experiments for the wt MAV-1 and mock samples and two experiments for the pmE314 samples. (C) MBMECs were infected at an MOI of 5 with wt MAV-1 or pmE314 as indicated for 48 h, and RNA was analyzed for chemokine expression by RPA using the mck-5c probe set (Pharmingen). Values are shown as percent expression relative to expression of RNA for the ribosomal protein L32. Brackets indicate a P value of ≤0.05 for one-way analysis of variance with Bonferroni correction for multiple comparison. The means and standard errors of transcript levels of triplicate infections are shown. The data are representative of three independent experiments. (D) pmBECs were infected with wt MAV-1 or pmE314 at an MOI of 5 or were mock infected. Supernatants were collected at the indicated time points and assayed in duplicate for CCL2 by ELISA. Results are representative of two experiments.
FIG. 3.

MAV-1-induced breakdown of the BBB is not dependent on inflammation. Before euthanasia, mice were injected with sodium fluorescein dye to measure the permeability of the BBB. Bars in panels A and B represent individual mice and are presented in the same order in each panel. Bars in panels C and D represent a different set of mice that are presented in the same order in each panel. (A and B) C57BL/6NCr mice were mock infected or infected with 103 PFU of wt or E3− virus, as indicated, for 8 days. (A) Viral load in the brain was assayed by capture ELISA with virus stock (v) used as a positive control. Each individual mouse was assayed in triplicate; error bars indicate the standard deviation of the mean for each mouse brain. OD 450, optical density at 450 nm. (B) Sodium fluorescein levels in the brain were quantitated relative to levels in the serum. Panels A and B are representative of two experiments. (C and D) C57BL/6J or perforin−/− mice were infected for 7 days with 104 PFU of wt MAV-1. (C) Viral load in the brain was measured in individual mice in triplicate by capture ELISA; error bars indicate the standard deviation of the mean for each mouse brain. MAV-1 viral stock (v) was assayed as a positive control. (D) Sodium fluorescein in the brain of each mouse was quantitated and normalized to the amount of dye present in the serum. Note that the y axis scale differs from that in panel B and Fig. 2C. Panels C and D are representative of three experiments.
To identify the inflammatory cells seen histologically in MAV-1-infected mouse brains, groups of C57BL/6 mice were mock infected or infected with wt MAV-1 or pmE314. Five brains were pooled from each group and analyzed by flow cytometry for the presence of inflammatory cells at 8 days postinfection. Total leukocytes, identified by CD45 staining, were significantly increased in the brains of mice infected with wt virus (Fig. 1B). Specifically, CD4- and CD8-positive T cells, B cells (CD19+), neutrophils (Gr-1+), and macrophages (F4/80+) were present at higher levels in the brains of mice infected with wt MAV-1 than in those of mock-infected mice. Mice infected with pmE314 showed an intermediate phenotype, with more CD45-positive cells than mock-infected mice but fewer than wt MAV-1-infected mice, consistent with the intermediate phenotype seen histologically in both outbred and inbred mice. Mice infected with pmE314 virus had fewer CD8+ T cells and B cells in their brains than mice infected with wt MAV-1 but equivalent numbers of CD4+ T cells, macrophages and neutrophils.
Chemokine and cytokine transcript levels were analyzed to determine the signals recruiting inflammatory cells to the brain. MBMECs, representative of the brain endothelial cells infected in vivo, were infected for 48 h, and RNA was collected for analysis by RPA. CCL1, CCL2, CCL5, and CXCL10 all showed significantly increased steady-state levels of mRNA expression in cells infected with wt MAV-1 compared to cells that were mock infected (Fig. 1C). These chemokines function to recruit macrophages (CCL1, CCL2, and CXCL10), B cells (CCL1), and T cells (CCL5 and CXCL10) (reviewed in references 14 and 51), and CXCL10 also promotes T-cell adhesion to endothelial cells (58). These same four chemokines were also the major ones upregulated in brains of mice infected intranasally by MAV-1 (78). MBMEC expression of CCL1, CXCL10, and CCL5 mRNAs was increased after infection with pmE314 compared to mock infection but was lower than in cells infected with wt MAV-1. CCL2 mRNA expression in pmE314-infected cells was equivalent to levels measured in mock-infected cells. Other chemokines measured in the RPA analysis, including CCL3, CCL4, and CCL11, had no change in expression after MAV-1 infection (data not shown). wt MAV-1 and E3 null virus infection resulted in similar recruitment of macrophages to the brain (Fig. 1B), although we saw lower levels of macrophage-recruiting chemokines in the E3 null mutant-infected endothelial cells (Fig. 1C). We suggest that the levels of CCL1, CCL2, and CXCL10 in E3 null mutant virus-infected mice were sufficient to recruit macrophages to levels like those in wt virus-infected mice and/or that other macrophage recruitment factors were involved. Minimal expression of mRNAs for nonchemotactic cytokines such as interleukin-6 (IL-6), TNF-α, or gamma interferon was seen following wt MAV-1 or pmE314 infection (data not shown). We further determined whether MAV-1 infection induced CCL2 production in primary cells. We infected pmBECs with wt MAV-1 or pmE314 at an MOI of 5 and assayed supernatants for the presence of CCL2 by ELISA. At 48 h postinfection pmBECs infected with wt MAV-1, but not pmE314, showed a large increase in CCL2 protein expression compared to mock-infected pmBECs (Fig. 1D), which correlated with the CCL2 mRNA levels seen in MBMECs (Fig. 1C).
MAV-1-induces breakdown of the BBB.
In addition to its ability to recruit monocytes to its site of expression, the chemokine CCL2 mediates disruption of the BBB. Addition of CCL2 to cultured brain endothelial cells causes a decrease in expression of tight junction proteins and a loss of the barrier properties necessary for function of the BBB (65, 68). Furthermore, intracerebral injection of CCL2 is sufficient to cause leakage of peripherally injected FITC-albumin into the brain, a measure of BBB breakdown (68). Because MAV-1 causes fatal encephalitis in susceptible mouse strains (32, 66) and we saw increased expression of CCL2 mRNA and protein in MAV-1-infected endothelial cells, we investigated the ability of MAV-1 to cause breakdown of the BBB in infected mice. C57BL6/NCr mice were infected i.p. with 103 or 104 PFU of wt MAV-1 or mock infected for 8 days. Mice were injected with 10% sodium fluorescein dye just prior to euthanasia. This dye is able to access and stain brain tissue only when the BBB is compromised (54). Infection with both doses of virus resulted in dye staining visible under UV light as well as high viral loads in the brain (Fig. 2A and B). Levels of sodium fluorescein in the brain were quantitated and found to be increased in mice infected with MAV-1, indicating that MAV-1 infection caused a breakdown of the BBB (Fig. 2C). Combining data from multiple experiments (13 infected mice and 9 mock-infected mice), we determined that the amount of sodium fluorescein staining in mouse brains correlated with the amount of virus measured in brain tissue for C57BL6/NCr mice infected with wt MAV-1 (data not shown). The Pearson correlation coefficient between sodium fluorescein levels and virus loads was 0.871, and this was statistically significant (P < 0.001). The data indicate that there may be a threshold level of virus necessary before sodium fluorescein penetrates the BBB.
FIG. 2.

MAV-1-induced breakdown of the BBB. C57BL6/NCr mice were infected with 103 or 104 PFU of MAV-1 for 8 days. At 10 minutes before euthanasia, mice were injected with sodium fluorescein dye to measure the permeability of the BBB. (A) Brains were removed from the animals and photographed with UV light as described in Materials and Methods. (B) Viral load in the brain was measured by capture ELISA, including a tissue with dye control (d) to ensure that sodium fluorescein did not interfere with virus detection in the ELISA. A positive control of virus stock (v) was included, and each individual mouse was assayed in triplicate; error bars indicate the standard deviation of the mean for each mouse brain. OD 450, optical density at 450 nm. (C) Levels of sodium fluorescein in the brain were quantified and are presented normalized to dye levels in serum. Bars in panels B and C are representative of individual mice and are presented in the same order as in panel A. Results shown are representative of three experiments.
MAV-1-induced breakdown of the BBB is not dependent on inflammation.
To determine whether MAV-1-induced breakdown of the BBB is mediated by the inflammation resulting from infection or due to direct effects of viral infection of brain endothelial cells, various infection models that lacked an inflammatory response were employed. The first model was to use the E3 null mutant virus, pmE314, because infection with pmE314 results in a lower level of inflammation in the brain than infection with wt MAV-1 (10) (Fig. 1). C57BL6/NCr mice were infected with 103 PFU of wt MAV-1 or pmE314 for 8 days and injected with sodium fluorescein. Viral loads were equivalent for wt- and pmE314-infected mice (Fig. 3A). All infected mice showed breakdown of the BBB, detected by an increase in brain sodium fluorescein levels compared to mock-infected mice (Fig. 3B). There were two mice that had low sodium fluorescein uptake ratios but measurable viral loads (Fig. 3A and B), consistent with a requirement for a threshold amount of virus to cause detectable sodium fluorescein uptake.
We used perforin-deficient (pfp−/−) mice as the second model; these mice do not have visible inflammation in the brain after MAV-1 infection (48). Furthermore, these knockout mice show no clinical signs of disease during acute MAV-1 infection, a phenotype that is associated with a lack of inflammatory cell response in the brain to MAV-1 infection. pfp−/− and C57BL6/J mice were infected with 104 PFU of wt MAV-1 for 7 days and injected with sodium fluorescein; viral load and dye were quantitated from the brain tissue. While only C57BL6/J mice showed signs of disease, pfp−/− and C57BL6/J mice showed similar viral loads in their brains (Fig. 3C). High levels of sodium fluorescein were measured in the brains of infected C57BL6/J and pfp−/− mice compared to mock-infected mice (Fig. 3D). Thus, BBB breakdown was equivalent in wt and pfp−/− mice despite the lack of inflammation in pfp−/− mice. T-cell-deficient mice (missing α/β and γ/δ T cells) also lack inflammation after MAV-1 infection (48), and infection of these mice resulted in the breakdown of the BBB, as measured by permeability to Evans blue dye (data not shown). Combined, the results with the E3 null virus, pfp−/− mice, and T-cell-deficient mice indicate that breakdown of the BBB after MAV-1 infection was not dependent on inflammatory cells. Furthermore, since mice infected with pmE314 had significant sodium fluorescein staining in the brain (Fig. 3B), MAV-1-induced breakdown of the BBB was not dependent on E3.
Infection of pmBECs with MAV-1.
To further investigate how MAV-1 infection might affect brain endothelial cells and disrupt the BBB, we used pmBECs to enable infection of brain endothelial cells in an isolated environment. Primary cells are preferable to established brain endothelial cell lines, such as bEnd.3 cells, because several functional features and characteristics of endothelial cell lines are unlike those of primary cells (62, 64). We used fluorescence microscopy to show that pmBECs passaged one time took up DiI-labeled acetylated low-density lipoprotein, an important functional characteristic of endothelial cells (data not shown) (73). Flow cytometric analysis was used to show that the pmBECs uniformly expressed high levels of CD31, ICAM, and VCAM, markers characteristic of endothelial cells (31), after one passage (data not shown). The cells used in our experiments were passed only once before use. To establish that pmBECs could be infected by MAV-1, we added wt virus at an MOI of 5 and analyzed virus yield at different times postinfection. MAV-1 productively replicated in pmBECs (Fig. 4), as demonstrated by the increase over input virus measured in infected cells at 2 to 5 days postinfection.
FIG. 4.

Infection of pmBECs with MAV-1. pmBECs were infected with wt MAV-1 at an MOI of 5. Cells and supernatants were harvested on the days indicated and assayed for infectious virus by plaque assay. Results are representative of two experiments.
Tight junction protein expression is altered by MAV-1 infection.
Tight junction formation is important for maintaining the function of the BBB (74), and virus-induced disruption of tight junctions is associated with breakdown of the BBB (17, 23, 59, 87). To determine whether infection with MAV-1 results in loss of tight junction formation, we infected pmBECs with MAV-1 and then immunofluorescently stained the cells to determine the location of their tight junction proteins. ZO-2 is an intracellular peripheral membrane protein that binds to transmembrane proteins of the tight junction such as occludin and the claudins, connecting them to the actin cytoskeleton (25, 45, 52, 83). Occludin and the claudins are transmembrane proteins with extracellular domains that allow them to homodimerize and form tight junctions between adjacent cells (17, 34, 35, 46, 50). Disruption of these proteins is associated with vascular leakiness and has been observed in HIV-1 encephalitis and in dengue infections (17, 46). ZO-2, occludin, and claudin-5 staining was localized to the periphery of mock-infected pmBECs, creating a cobblestone-like appearance (Fig. 5), consistent with the expected staining pattern (68). For ZO-2, this peripheral staining pattern was unchanged 48 h after infection with either wt MAV-1 or pmE314 (Fig. 5A), even in cells that showed significant staining for the MAV-1 capsid. Also, ZO-2 expression appeared to be increased in the nuclei of some infected cells compared to mock-infected cells. Occludin surface expression was also analyzed at 48 h postinfection with wt or pmE314 virus and was decreased at the periphery of cells (Fig. 5B). Some enrichment in nuclear occludin staining was observed in infected cells. Another tight junction protein, claudin-5, also showed decreased expression at the peripheral membrane in cells infected with either wt MAV-1 or pmE314 (Fig. 5C) compared to mock-infected cells. In contrast to the case for occludin and ZO-2, there was no apparent enrichment in nuclear claudin-5 staining (Fig. 5C). We note that an apparently uninfected cell showed cytoplasmic claudin-5 staining in the pmE314-infected panel, but we saw similar cells with claudin-5 staining in mock- and wt-infected cultures (data not shown); their significance is unknown. Combined, these results indicate that MAV-1 infection resulted in a loss of surface expression of some tight junction proteins; furthermore, this was not dependent on the presence of E3. These changes in tight junction protein staining were seen despite the presence of intact nuclei and the appearance of healthy cell monolayers up to 3 days postinfection (data not shown).
FIG. 5.

Tight junction protein localization after MAV-1 infection. pmBECs were mock infected or infected with wt MAV-1 or pmE314 at an MOI of 5 for 48 h, and tight junction proteins were visualized by immunofluorescence. (A) ZO-2 expression; (B) occludin expression; (C) claudin-5 expression. Images are all representative of at least three experiments each from separate primary cell preparations. Image magnifications were identical; the bar indicates 100 μm. DAPI staining image exposure times were identical. Virus capsid staining image exposure times were identical except that mock in panel A and E3− in panel B were exposed 1.2 times longer. Tight junction protein staining image exposure times were identical in panels B and C and were 0.15, 0.55, and 0.73 times as long in panel A for mock, wt, and E3−, respectively. Yellow arrows indicate borders of infected cells that have (A) or lack (B and C) tight junction protein staining.
We examined whether there were changes in steady-state levels of mRNAs for the tight junction proteins in infected pmBECs. Steady-state transcript levels were analyzed by RT-qPCR using RNA isolated from pmBECs at 48 h after infection and normalized to GAPDH expression (Fig. 6A). Steady-state ZO-2 mRNA levels in wt and E3 null mutant virus-infected pmBECs were reduced to ∼50% of levels in mock-infected cells. There were much greater reductions in occludin and claudin-5 mRNA levels, to 15 to 19% of those in mock-infected cells for occludin and 6 to 12% of those in mock-infected cells for claudin-5. For all three tight junction proteins, the differences between infected and mock-infected cells were statistically significant, but there was no significant difference between wt and E3 null mutant virus-infected cells.
FIG. 6.
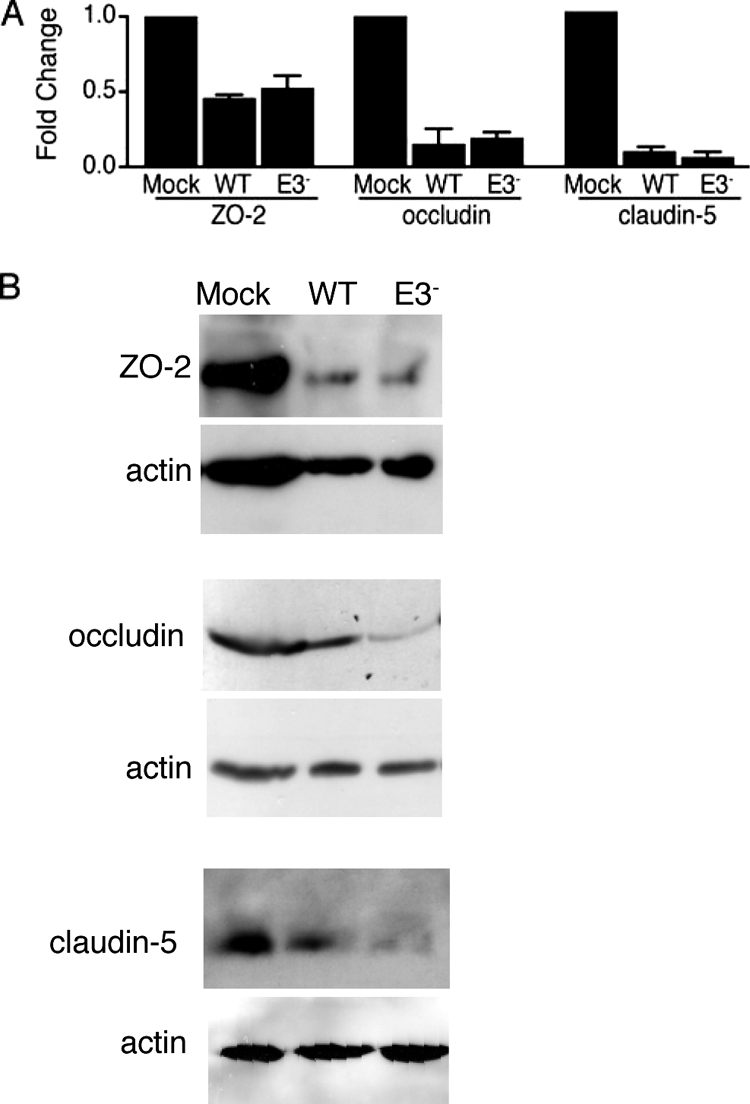
Tight junction protein mRNA and protein expression. (A) Steady-state mRNA levels for the indicated tight junction proteins at 48 h after mock infection or infection with wt MAV-1 or pmE314 (E3−) were determined by RT-qPCR. mRNA levels were normalized to GAPDH expression in each sample; absolute GAPDH levels were not significantly different among mock, wt, and E3 mutant virus-infected cells (data not shown). Values for the infected samples were normalized to those for the mock-infected sample, which was set to a relative expression of 1. Error bars indicate standard deviations of the means; the data are for three independent mRNA preparations obtained from two pmBEC preparations. Both wt and E3 values were statistically significantly different from mock infection values for ZO-2 (P < 0.03), occludin (P < 0.014), and claudin-5 (P < 0.0015). There were no statistically significant differences between wt and E3 for any tight junction transcripts. (B) pmBECs that were mock infected or infected with wt or E3 null mutant (E3−) virus at an MOI of 5 were lysed at 48 h postinfection. Equal amounts of protein (determined by Bradford assay) from the supernatant were separated on a 10% SDS-polyacrylamide gel, transferred to nitrocellulose, and probed with rabbit polyclonal antioccludin, mouse monoclonal anti-claudin-5, mouse monoclonal anti-ZO-2, and rabbit polyclonal actin antibodies at a 1:200 dilution. The antibodies were detected with Amersham ECL Plus Western blotting detection reagent. Each antibody detected only a single band on the Western blots. The results shown are representative of at least two experiments for each tight junction protein with independent pmBEC preparations.
We confirmed the reduced expression of tight junction proteins using Western blots. Whole-cell lysates of pmBECs were prepared and analyzed with antibodies to ZO-2, occludin, and claudin-5. Levels of all three tight junction proteins were lower in MAV-1-infected cells than in mock-infected cells (Fig. 6B). Although there were no statistically significant differences in mRNA levels between wt and E3 null mutant virus-infected cells (Fig. 6A), there was less of all three tight junction proteins in E3 null mutant virus-infected cells than in wt virus-infected cells (Fig. 6B). This suggests that there may be posttranscriptional differences in tight junction protein expression between the wt and the E3 null mutant.
Barrier properties in pmBECs after MAV-1 infection.
Because MAV-1 infection resulted in changes in tight junction protein expression at cell junctions, we examined whether infection decreased the barrier properties of brain endothelial cells. A monolayer of fully functioning brain endothelial cells should have high TEER (19, 28). pmBECs were grown on transwell plates so their electrical resistance could be measured. Cells were either mock infected or infected with wt MAV-1 or pmE314 at an MOI of 5. There was no drop in TEER after cells were mock infected (Fig. 7A). After 3 days of infection with either wt MAV-1 or pmE314, there was a dramatic decrease in TEER, to nearly background levels. Although pmE314-infected cells showed a slight lag in their TEER decrease compared to wt MAV-1-infected cells, all infected cells showed a substantial loss of resistance by 3 days postinfection.
FIG. 7.

Barrier properties in pmBECs after MAV-1 infection. (A) pmBECs were grown to confluence on 0.4-μm-pore-size transwell plates with 20% conditioned astrocyte medium added to both the upper and lower chambers to promote tight junction formation. Cells were infected with wt MAV-1 or pmE314 at an MOI of 5 or mock infected. Resistance was measured at 24-hour intervals. (B and C) Mitochondrial metabolic activity as a surrogate for cell viability was measured by MTT assay at 2 days postinfection (B) in a replicate experiment and at 3 days postinfection (C) on the same cells as in panel A. TEER results are representative of four experiments for panel A, three experiments for panel B, and two experiments for panel C. OD 570, optical density at 570 nm. (D and E) TEER was measured in cells infected with wt MAV-1 or pmE314. Recombinant CCL2 was added to mock-infected cells after 2 days (D) or 3 days (E), and 1 h later CCL2-neutralizing antibody (CCL2 Ab) or naïve rabbit serum (control) was added to all cells as indicated. Note that after treatment the x axis is on a different scale. Error bars indicate means and standard deviations when triplicate samples were available. All other samples were analyzed in duplicate in multiple experiments.
To determine whether the decrease in the barrier properties of pmBECs was due to death of the infected cells, cell metabolic activity was assessed by MTT assay at both 2 and 3 days postinfection, as a measure of viability. At 2 days postinfection, pmBECs infected with either wt MAV-1 or pmE314 had activity that was 50% of that of mock-infected cells (Fig. 7B), although only wt virus-infected cells had a decrease in TEER. At 3 days postinfection, MTT assay showed that infection with wt MAV-1 reduced pmBEC metabolic activity to 34% of that of mock-infected cells, while cells infected with pmE314 remained at 54% metabolic activity (Fig. 7C). Although cells infected with pmE314 showed the same MTT activity at 2 and 3 days postinfection, the TEER of these cells decreased to almost background levels by 3 days postinfection. Thus, although MAV-1 infection resulted in a drop in the metabolic activity of infected cells, this change cannot entirely account for the loss of TEER.
A second possible mechanism for the MAV-1 infection-induced decrease in barrier properties of pmBECs is that the decrease was mediated by the CCL2 expressed by wt virus-infected cells. To determine whether CCL2 contributes to the observed MAV-1-induced changes in TEER, cells were mock infected or infected with wt MAV-1 or pmE314, and a CCL2-neutralizing antibody was added to the samples at 2 or 3 days postinfection. Mock-infected cells had a high TEER that decreased after the addition of recombinant CCL2, as expected (Fig. 7D and E). Subsequent addition of a CCL2-neutralizing antibody to CCL2-treated, mock-infected samples restored their TEER to pretreatment levels. In contrast, addition of the neutralizing CCL2 antibody had little effect on the TEER of pmBECs infected for 2 or 3 days with either wt MAV-1 or pmE314 (Fig. 7D and E), suggesting that CCL2 was not responsible for the decrease in TEER caused by MAV-1 infection at these time points. It is important to note that the amount of CCL2-neutralizing antibody used was able to block the recombinant CCL2 added to mock-infected cells at a final concentration of 100 mM. This level was higher than the 6 to 9 ng/ml of CCL2 produced in wt MAV-1-infected pmBECs (Fig. 1D).
DISCUSSION
We demonstrate here that MAV-1 infection, in addition to causing fatal encephalitis in susceptible mouse strains, causes breakdown of the BBB. Characterization of the inflammatory response to MAV-1 infection in C57BL/6 mice showed increased numbers of T cells, B cells, neutrophils, and macrophages in infected mouse brains. MAV-1-induced inflammation in inbred mice was partially dependent on the presence of the E3 proteins, because infection with an E3 null virus gave an intermediate inflammatory phenotype. The function of the MAV-1 E3 proteins is unknown; however, many human adenovirus E3 proteins play a role in evasion of the host immune response (36). Previous experiments with MAV-1 showed that mice lacking CD8+ T cells do not develop acute signs of disease after infection (48). Cytotoxic CD8+ T lymphocytes were present in significantly lower numbers in the brains of animals infected with the E3 null virus, pmE314, than in the brains of animals infected with wt MAV-1, correlating with the reduced pathogenesis of the E3 null virus. Breakdown of the BBB occurred in animals deficient in T cells, indicating that CD8+ T cells are not necessary for this process.
Pathogenic viruses such as HIV-1, dengue virus, lymphocytic choriomeningitis virus, mouse hepatitis virus, and West Nile virus have been shown to cause breakdown of the BBB and/or disruption of endothelial junctions through a variety of means (2, 3, 46, 70, 77, 87). We found that MAV-1 infection caused breakdown of the BBB. The use of three infection models deficient in inflammation in the brain showed that MAV-1-induced breakdown of the BBB was largely independent of the presence of inflammatory cells, although we cannot rule out possible contributions of inflammatory cells to the process. Combined, these data indicate that MAV-1 infection directly causes breakdown of the BBB during acute infection; however, signs of disease and lethality of infection depend on inflammatory cells being recruited to the site of infection and crossing into the brain parenchyma (10, 48).
MAV-1 infects endothelial cells throughout the mouse, and the highest viral loads are found in the brain and spinal cord (13, 41). Thus, given that endothelial cells are the major structural component of the BBB (reviewed in reference 57), it is not surprising that MAV-1 infection can damage the BBB. MAV-1 infection of pmBECs caused a loss of barrier properties in the endothelial cells, concomitant with decreased claudin-5 and occludin protein staining at the cell surface. Loss of tight junction protein staining at the cell boundaries was observed 2 days after MAV-1 infection for occludin and claudin-5, correlating with lower levels of occludin and claudin-5 RNA transcripts than those seen in mock-infected cells. ZO-2 expression at the peripheral membrane appeared unaltered in MAV-1-infected pmBECs compared to mock-infected pmBECs, but we did observe a ∼50% decrease in ZO-2 mRNA steady-state levels and reduced total ZO-2 protein by Western blotting. To account for the difference between immunofluorescence results for ZO-2 compared to occludin and claudin-5 and for differences in protein levels between wt and E3 mutant virus-infected cells, we suggest that there are differences in posttranscriptional regulation. It is possible that the ZO-2 protein levels produced in infection are sufficient to give surface expression comparable to that in mock-infected cells. Unlike occludin and the claudin family members, ZO-2 is a peripheral membrane protein that binds to the cytoplasmic domains of tight junction integral membrane proteins and actin filaments (39). It is possible that these differences in normal localization and function of ZO-2, compared to those of occludin and claudin-5, are responsible for differences of their phenotypes in response to MAV-1 infection. Reduction of expression of some tight junction proteins but not others has been observed in response to infection by human T-lymphotropic virus (1). We observed an enrichment in nuclear staining of ZO-2 and occludin in infected cells; the significance of this is unknown. However, nuclear localization for ZO-2 and occludin has been reported (15, 30, 38, 71).
At 2 days after infection, pmBECs infected with wt MAV-1 had a substantial decrease in TEER, while those infected with pmE314 did not. This occurred although infection with either virus caused a 50% decrease in cell metabolic activity, measured as a surrogate for cell viability, compared to mock-infected cells. At 3 days postinfection, the cells infected with the E3 null mutant virus had a substantial drop in TEER but no change in metabolic activity compared to 2 days postinfection. Thus, loss of cell metabolic activity did not correlate directly with loss of barrier properties in infected pmBECs. However, it is possible that decreased pmBEC cell metabolic activity and viability may indirectly contribute to the decrease in TEER seen after MAV-1 infection, for example, by affecting the structural integrity of the cell. Human adenovirus infection and corresponding shutoff of host protein synthesis are associated with degradation of the cytokeratin network (84, 85).
Although some other viruses that cause CNS disease do not primarily infect endothelial cells (2, 16, 70), they still cause breakdown of the BBB by disrupting tight junction formation and altering adhesion molecule expression on brain endothelial cells. CCL2 expression in the CNS is often induced by virus infection, and CCL2 has been shown to be sufficient for disruption of tight junctions in endothelial cell culture and also for BBB breakdown in mice (65, 67, 68). HIV-1 and dengue virus mediate disruption of tight junctions through CCL2 signaling (23, 46). wt MAV-1 infection of pmBECs also stimulated CCL2 mRNA synthesis and secretion of CCL2. However, infection of pmBECs with the MAV-1 mutant pmE314 did not induce CCL2 production, although pmE314 infection did cause a loss of tight junction protein expression at cell junctions and did induce breakdown of the BBB in C57BL/6 mice. Furthermore, addition of CCL2-neutralizing antibody did not restore the TEER of MAV-1-infected pmBECs, although it restored TEER levels in uninfected pmBECs treated with larger amounts of recombinant CCL2 than were found in infected cells. Together these results suggest that MAV-1 infection causes a decrease in tight junction protein expression at cell borders and breakdown of the BBB in a CCL2-independent manner. However, it is possible that CCL2 may contribute to BBB disruption after wt MAV-1 infection, because CCL2 expression is induced during wt MAV-1 infection. Our data indicate that CCL2 expression is nonessential for loss of pmBEC barrier properties following MAV-1 infection at 2 and 3 days postinfection in vitro. We have not examined the role of CCL2 in BBB integrity during in vivo infections. However, MAV-1 infection of CCR2−/− mice did not result in higher viral loads in brain and spleen compared to infection of control BALB/c mice (6).
Cytokines other than CCL2 have also been shown to cause breakdown of the BBB. TNF-α signaling has been implicated in breakdown of the BBB and endothelial cell barrier function. Primary bovine brain microvessel endothelial cells treated with low concentrations of TNF-α show an increase in permeability as measured by dye migration across cell monolayers (47). West Nile virus induces breakdown of the BBB (77), and recent studies have shown that TNF-α is necessary for clearance of virus in the brain, a process that is dependent on T cells and macrophages and their ability to access CNS tissues (61). TNF-α also mediates BBB permeability during sepsis induced by Escherichia coli and Streptococcus pneumoniae infection (72). Other cytokines, including IL-1β and gamma interferon, have also been shown to decrease the barrier properties of brain endothelial cells (82). These cytokines have not yet been measured in MAV-1 infection of pmBECs and could contribute to MAV-1-induced breakdown of the BBB.
The cytokines TNF-α and IL-1β activate the endothelium of the CNS, resulting in specific upregulation of MMP-9 (33). MMP-9 can have deleterious effects in brain injury (5). These effects are mediated by proteolytic degradation of extracellular tight junction proteins of the BBB. MMP-9 expression, activity, and localization to blood vessels are increased in West Nile virus infections (76). We have not examined MMP-9 levels in MAV-1-infected pmBECs; it is possible that MMP-9 plays a role in the breakdown of the BBB in MAV-1 infection.
The mechanism by which MAV-1 infection alters tight junction protein surface expression is not yet known. Steady-state transcript levels for three tight junction proteins were reduced by MAV-1 infection with either wt or the E3 null mutant virus, and protein levels were reduced in whole-cell lysates. Numerous studies have examined expression of tight junction proteins and their function in maintaining the BBB or epithelial barriers (20, 44, 69). One important molecule controlling tight junction protein localization is Rho kinase. Rho kinase signaling is triggered in cells upon CCL2 binding, and this signal causes a decrease in cell surface expression of tight junction proteins after viral infections (29, 52, 83). However, Rho kinase is unlikely to be the primary determinant of MAV-1-induced alteration of tight junction protein expression, because infection with pmE314 caused breakdown of the BBB and loss of peripheral membrane localization of tight junction proteins despite failing to induce CCL2 in infected cells. It is possible that Rho kinase is involved in the MAV-1-induced decrease in peripheral membrane expression of tight junction proteins if MAV-1 infection causes a non-CCL2-dependent increase in Rho kinase signaling.
Other stimuli that alter tight junction protein function and localization include intracellular calcium levels, cyclic AMP levels, tight junction protein phosphorylation states, oxidative stress, and mitogen-activated protein kinase signaling (26, 29, 37, 40, 44, 56, 60, 83). A decrease in tight junction protein expression is observed after ERK1/2 activation by the HIV-1 Tat protein (4, 55); thus, this represents a precedent for virus-induced CCL2-independent disruption in tight junctions (55). It is possible that some of these non-CCL2 pathways are involved in regulation of tight junction protein expression after MAV-1 infection.
Encephalitis and breakdown of the BBB can be caused by a number of RNA and DNA viruses. Although the prevalence of encephalitis caused by adenoviruses is low, it is a particular problem in disseminated infections of immunocompromised patients (18, 21, 22, 27, 63). Further characterization of the mechanism by which viral and cellular gene products contribute to MAV-1-induced encephalitis will extend our knowledge of the basic biology of viral encephalitis.
Acknowledgments
We thank Irene Althaus, Jason Weinberg, and Sam Straight for technical assistance. We are grateful to Anuska Andjelkovic for advice and gifts of reagents. We are grateful to Mengxi Xiang for the generous donation of secondary antibodies and to Nick Lukacs for the donation of neutralizing anti-CCL2 antibody. We thank Mike Imperiale, Nick Lukacs, Mary O'Riordan, and Dave Miller for critical reviews of the manuscript. We thank Kate Eaton for helpful discussions.
This work was supported by NIH grant R01 AI023762 to K.R.S.; L.E.G. was supported by NIH grant T32 AI007528.
Footnotes
Published ahead of print on 1 July 2009.
REFERENCES
- 1.Afonso, P. V., S. Ozden, M. C. Cumont, D. Seilhean, L. Cartier, P. Rezaie, S. Mason, S. Lambert, M. Huerre, A. Gessain, P. O. Couraud, C. Pique, P. E. Ceccaldi, and I. A. Romero. 2008. Alteration of blood-brain barrier integrity by retroviral infection. PLoS Pathog. 4:e1000205. [DOI] [PMC free article] [PubMed] [Google Scholar]
- 2.Afonso, P. V., S. Ozden, M. C. Prevost, C. Schmitt, D. Seilhean, B. Weksler, P. O. Couraud, A. Gessain, I. A. Romero, and P. E. Ceccaldi. 2007. Human blood-brain barrier disruption by retroviral-infected lymphocytes: role of myosin light chain kinase in endothelial tight-junction disorganization. J. Immunol. 179:2576-2583. [DOI] [PubMed] [Google Scholar]
- 3.Andersen, I. H., O. Marker, and A. R. Thomsen. 1991. Breakdown of blood-brain barrier function in the murine lymphocytic choriomeningitis virus infection mediated by virus-specific CD8+ T cells. J. Neuroimmunol. 31:155-163. [DOI] [PubMed] [Google Scholar]
- 4.Andras, I. E., H. Pu, J. Tian, M. A. Deli, A. Nath, B. Hennig, and M. Toborek. 2005. Signaling mechanisms of HIV-1 Tat-induced alterations of claudin-5 expression in brain endothelial cells. J. Cereb. Blood Flow Metab. 25:1159-1170. [DOI] [PubMed] [Google Scholar]
- 5.Asahi, M., X. Wang, T. Mori, T. Sumii, J. C. Jung, M. A. Moskowitz, M. E. Fini, and E. H. Lo. 2001. Effects of matrix metalloproteinase-9 gene knock-out on the proteolysis of blood-brain barrier and white matter components after cerebral ischemia. J. Neurosci. 21:7724-7732. [DOI] [PMC free article] [PubMed] [Google Scholar]
- 6.Ashley, S. L., A. R. Welton, K. M. Harwood, N. Van Rooijen, and K. R. Spindler. 2009. Mouse adenovirus type 1 infection of macrophages. Virology 390:307-314. [DOI] [PMC free article] [PubMed] [Google Scholar]
- 7.Ball, A. O., C. W. Beard, P. Villegas, and K. R. Spindler. 1991. Early region 4 sequence and biological comparison of two isolates of mouse adenovirus type 1. Virology 180:257-265. [DOI] [PubMed] [Google Scholar]
- 8.Bookout, A. L., and D. J. Mangelsdorf. 2003. Quantitative real-time PCR protocol for analysis of nuclear receptor signaling pathways. Nucl. Recept. Signal. 1:e012. [DOI] [PMC free article] [PubMed] [Google Scholar]
- 9.Campanella, M., C. Sciorati, G. Tarozzo, and M. Beltramo. 2002. Flow cytometric analysis of inflammatory cells in ischemic rat brain. Stroke 33:586-592. [DOI] [PubMed] [Google Scholar]
- 10.Cauthen, A. N., C. C. Brown, and K. R. Spindler. 1999. In vitro and in vivo characterization of a mouse adenovirus type 1 early region 3 mutant. J. Virol. 73:8640-8646. [DOI] [PMC free article] [PubMed] [Google Scholar]
- 11.Cauthen, A. N., and K. R. Spindler. 1999. Novel expression of mouse adenovirus type 1 early region 3 gp11K at late times after infection. Virology 259:119-128. [DOI] [PubMed] [Google Scholar]
- 12.Cauthen, A. N., A. R. Welton, and K. R. Spindler. 2007. Construction of mouse adenovirus type 1 mutants. Methods Mol. Med. 130:41-59. [DOI] [PubMed] [Google Scholar]
- 13.Charles, P. C., J. D. Guida, C. F. Brosnan, and M. S. Horwitz. 1998. Mouse adenovirus type-1 replication is restricted to vascular endothelium in the CNS of susceptible strains of mice. Virology 245:216-228. [DOI] [PubMed] [Google Scholar]
- 14.Charo, I. F., and M. B. Taubman. 2004. Chemokines in the pathogenesis of vascular disease. Circ. Res. 95:858-866. [DOI] [PubMed] [Google Scholar]
- 15.Collins, N. T., P. M. Cummins, O. C. Colgan, G. Ferguson, Y. A. Birney, R. P. Murphy, G. Meade, and P. A. Cahill. 2006. Cyclic strain-mediated regulation of vascular endothelial occludin and ZO-1: influence on intercellular tight junction assembly and function. Arterioscler. Thromb. Vasc. Biol. 26:62-68. [DOI] [PubMed] [Google Scholar]
- 16.Dai, J., P. Wang, F. Bai, T. Town, and E. Fikrig. 2008. ICAM-1 participates in the entry of West Nile virus into the central nervous system. J. Virol. 82:4164-4168. [DOI] [PMC free article] [PubMed] [Google Scholar]
- 17.Dallasta, L. M., L. A. Pisarov, J. E. Esplen, J. V. Werley, A. V. Moses, J. A. Nelson, and C. L. Achim. 1999. Blood-brain barrier tight junction disruption in human immunodeficiency virus-1 encephalitis. Am. J. Pathol. 155:1915-1927. [DOI] [PMC free article] [PubMed] [Google Scholar]
- 18.Davis, D., P. J. Henslee, and W. R. Markesbery. 1988. Fatal adenovirus meningoencephalitis in a bone marrow transplant patient. Ann. Neurol. 23:385-389. [DOI] [PubMed] [Google Scholar]
- 19.de Vries, H. E., M. C. Blom-Roosemalen, M. van Oosten, A. G. de Boer, T. J. van Berkel, D. D. Breimer, and J. Kuiper. 1996. The influence of cytokines on the integrity of the blood-brain barrier in vitro. J. Neuroimmunol. 64:37-43. [DOI] [PubMed] [Google Scholar]
- 20.Dobrogowska, D. H., and A. W. Vorbrodt. 2004. Immunogold localization of tight junctional proteins in normal and osmotically-affected rat blood-brain barrier. J. Mol. Histol. 35:529-539. [DOI] [PubMed] [Google Scholar]
- 21.Dubberke, E. R., B. Tu, D. J. Rivet, G. A. Storch, A. Apisarnthanarak, R. E. Schmidt, S. Weiss, and L. B. Polish. 2006. Acute meningoencephalitis caused by adenovirus serotype 26. J. Neurovirol. 12:235-240. [DOI] [PubMed] [Google Scholar]
- 22.Echavarria, M. 2008. Adenoviruses in immunocompromised hosts. Clin. Microbiol. Rev. 21:704-715. [DOI] [PMC free article] [PubMed] [Google Scholar]
- 23.Eugenin, E. A., K. Osiecki, L. Lopez, H. Goldstein, T. M. Calderon, and J. W. Berman. 2006. CCL2/monocyte chemoattractant protein-1 mediates enhanced transmigration of human immunodeficiency virus (HIV)-infected leukocytes across the blood-brain barrier: a potential mechanism of HIV-CNS invasion and neuroAIDS. J. Neurosci. 26:1098-1106. [DOI] [PMC free article] [PubMed] [Google Scholar]
- 24.Fang, L., and K. R. Spindler. 2005. E1A-CR3 interaction-dependent and -independent functions of mSur2 in viral replication of early region 1A mutants of mouse adenovirus type 1. J. Virol. 79:3267-3276. [DOI] [PMC free article] [PubMed] [Google Scholar]
- 25.Fanning, A. S., B. J. Jameson, L. A. Jesaitis, and J. M. Anderson. 1998. The tight junction protein ZO-1 establishes a link between the transmembrane protein occludin and the actin cytoskeleton. J. Biol. Chem. 273:29745-29753. [DOI] [PubMed] [Google Scholar]
- 26.Fischer, S., M. Wiesnet, D. Renz, and W. Schaper. 2005. H2O2 induces paracellular permeability of porcine brain-derived microvascular endothelial cells by activation of the p44/42 MAP kinase pathway. Eur. J. Cell Biol. 84:687-697. [DOI] [PubMed] [Google Scholar]
- 27.Gabrielson, M. O., C. Joseph, and G. D. Hsiung. 1966. Encephalitis associated with adenovirus type 7 occurring in a family outbreak. J. Pediat. 68:142-144. [DOI] [PubMed] [Google Scholar]
- 28.Gaillard, P. J., L. H. Voorwinden, J. L. Nielsen, A. Ivanov, R. Atsumi, H. Engman, C. Ringbom, A. G. de Boer, and D. D. Breimer. 2001. Establishment and functional characterization of an in vitro model of the blood-brain barrier, comprising a co-culture of brain capillary endothelial cells and astrocytes. Eur. J. Pharm. Sci. 12:215-222. [DOI] [PubMed] [Google Scholar]
- 29.Gonzalez-Mariscal, L., R. Tapia, and D. Chamorro. 2008. Crosstalk of tight junction components with signaling pathways. Biochim. Biophys. Acta 1778:729-756. [DOI] [PubMed] [Google Scholar]
- 30.Gottardi, C. J., M. Arpin, A. S. Fanning, and D. Louvard. 1996. The junction-associated protein, zonula occludens-1, localizes to the nucleus before the maturation and during the remodeling of cell-cell contacts. Proc. Natl. Acad. Sci. USA 93:10779-10784. [DOI] [PMC free article] [PubMed] [Google Scholar]
- 31.Grabner, R., U. Till, and R. Heller. 2000. Flow cytometric determination of E-selectin, vascular cell adhesion molecule-1, and intercellular cell adhesion molecule-1 in formaldehyde-fixed endothelial cell monolayers. Cytometry 40:238-244. [DOI] [PubMed] [Google Scholar]
- 32.Guida, J. D., G. Fejer, L.-A. Pirofski, C. F. Brosnan, and M. S. Horwitz. 1995. Mouse adenovirus type 1 causes a fatal hemorrhagic encephalomyelitis in adult C57BL/6 but not BALB/c mice. J. Virol. 69:7674-7681. [DOI] [PMC free article] [PubMed] [Google Scholar]
- 33.Harkness, K. A., P. Adamson, J. D. Sussman, G. A. Davies-Jones, J. Greenwood, and M. N. Woodroofe. 2000. Dexamethasone regulation of matrix metalloproteinase expression in CNS vascular endothelium. Brain 123:698-709. [DOI] [PubMed] [Google Scholar]
- 34.Hawkins, B. T., and T. P. Davis. 2005. The blood-brain barrier/neurovascular unit in health and disease. Pharmacol. Rev. 57:173-185. [DOI] [PubMed] [Google Scholar]
- 35.Hirase, T., J. M. Staddon, M. Saitou, Y. Ando-Akatsuka, M. Itoh, M. Furuse, K. Fujimoto, S. Tsukita, and L. L. Rubin. 1997. Occludin as a possible determinant of tight junction permeability in endothelial cells. J. Cell Sci. 110:1603-1613. [DOI] [PubMed] [Google Scholar]
- 36.Horwitz, M. S. 2001. Adenovirus immunoregulatory genes and their cellular targets. Virology 279:1-8. [DOI] [PubMed] [Google Scholar]
- 37.Ishizaki, T., H. Chiba, T. Kojima, M. Fujibe, T. Soma, H. Miyajima, K. Nagasawa, I. Wada, and N. Sawada. 2003. Cyclic AMP induces phosphorylation of claudin-5 immunoprecipitates and expression of claudin-5 gene in blood-brain-barrier endothelial cells via protein kinase A-dependent and -independent pathways. Exp. Cell Res. 290:275-288. [DOI] [PubMed] [Google Scholar]
- 38.Islas, S., J. Vega, L. Ponce, and L. Gonzalez-Mariscal. 2002. Nuclear localization of the tight junction protein ZO-2 in epithelial cells. Exp. Cell. Res. 274:138-148. [DOI] [PubMed] [Google Scholar]
- 39.Itoh, M., K. Morita, and S. Tsukita. 1999. Characterization of ZO-2 as a MAGUK family member associated with tight as well as adherens junctions with a binding affinity to occludin and α catenin. J. Biol. Chem. 274:5981-5986. [DOI] [PubMed] [Google Scholar]
- 40.Jou, T. S., E. E. Schneeberger, and W. J. Nelson. 1998. Structural and functional regulation of tight junctions by RhoA and Rac1 small GTPases. J. Cell Biol. 142:101-115. [DOI] [PMC free article] [PubMed] [Google Scholar]
- 41.Kajon, A. E., C. C. Brown, and K. R. Spindler. 1998. Distribution of mouse adenovirus type 1 in intraperitoneally and intranasally infected adult outbred mice. J. Virol. 72:1219-1223. [DOI] [PMC free article] [PubMed] [Google Scholar]
- 42.Kanmogne, G. D., C. Primeaux, and P. Grammas. 2005. HIV-1 gp120 proteins alter tight junction protein expression and brain endothelial cell permeability: implications for the pathogenesis of HIV-associated dementia. J. Neuropathol. Exp. Neurol. 64:498-505. [DOI] [PubMed] [Google Scholar]
- 43.Karpus, W. J., K. J. Kennedy, B. T. Fife, J. L. Bennett, M. C. Dal Canto, S. L. Kunkel, and N. W. Lukacs. 2006. Anti-CCL2 treatment inhibits Theiler's murine encephalomyelitis virus-induced demyelinating disease. J. Neurovirol. 12:251-261. [DOI] [PMC free article] [PubMed] [Google Scholar]
- 44.Krizbai, I. A., and M. A. Deli. 2003. Signalling pathways regulating the tight junction permeability in the blood-brain barrier. Cell. Mol. Biol. 49:23-31. [PubMed] [Google Scholar]
- 45.Lai, C. H., K. H. Kuo, and J. M. Leo. 2005. Critical role of actin in modulating BBB permeability. Brain Res. Brain Res. Rev. 50:7-13. [DOI] [PubMed] [Google Scholar]
- 46.Lee, Y. R., M. T. Liu, H. Y. Lei, C. C. Liu, J. M. Wu, Y. C. Tung, Y. S. Lin, T. M. Yeh, S. H. Chen, and H. S. Liu. 2006. MCP-1, a highly expressed chemokine in dengue haemorrhagic fever/dengue shock syndrome patients, may cause permeability change, possibly through reduced tight junctions of vascular endothelium cells. J. Gen. Virol. 87:3623-3630. [DOI] [PubMed] [Google Scholar]
- 47.Mark, K. S., and D. W. Miller. 1999. Increased permeability of primary cultured brain microvessel endothelial cell monolayers following TNF-alpha exposure. Life Sci. 64:1941-1953. [DOI] [PubMed] [Google Scholar]
- 48.Moore, M. L., C. C. Brown, and K. R. Spindler. 2003. T cells cause acute immunopathology and are required for long-term survival in mouse adenovirus type 1-induced encephalomyelitis. J. Virol. 77:10060-10070. [DOI] [PMC free article] [PubMed] [Google Scholar]
- 49.Morgan, L., B. Shah, L. E. Rivers, L. Barden, A. J. Groom, R. Chung, D. Higazi, H. Desmond, T. Smith, and J. M. Staddon. 2007. Inflammation and dephosphorylation of the tight junction protein occludin in an experimental model of multiple sclerosis. Neuroscience 147:664-673. [DOI] [PubMed] [Google Scholar]
- 50.Morita, K., M. Furuse, K. Fujimoto, and S. Tsukita. 1999. Claudin multigene family encoding four-transmembrane domain protein components of tight junction strands. Proc. Natl. Acad. Sci. USA 96:511-516. [DOI] [PMC free article] [PubMed] [Google Scholar]
- 51.Ono, S. J., T. Nakamura, D. Miyazaki, M. Ohbayashi, M. Dawson, and M. Toda. 2003. Chemokines: roles in leukocyte development, trafficking, and effector function. J. Allergy Clin. Immunol. 111:1185-1199. [DOI] [PubMed] [Google Scholar]
- 52.Persidsky, Y., D. Heilman, J. Haorah, M. Zelivyanskaya, R. Persidsky, G. A. Weber, H. Shimokawa, K. Kaibuchi, and T. Ikezu. 2006. Rho-mediated regulation of tight junctions during monocyte migration across the blood-brain barrier in HIV-1 encephalitis (HIVE). Blood 107:4770-4780. [DOI] [PMC free article] [PubMed] [Google Scholar]
- 53.Persidsky, Y., S. H. Ramirez, J. Haorah, and G. D. Kanmogne. 2006. Blood-brain barrier: structural components and function under physiologic and pathologic conditions. J. Neuroimmune Pharmacol. 1:223-236. [DOI] [PubMed] [Google Scholar]
- 54.Phares, T. W., R. B. Kean, T. Mikheeva, and D. C. Hooper. 2006. Regional differences in blood-brain barrier permeability changes and inflammation in the apathogenic clearance of virus from the central nervous system. J. Immunol. 176:7666-7675. [DOI] [PubMed] [Google Scholar]
- 55.Pu, H., J. Tian, I. E. Andras, K. Hayashi, G. Flora, B. Hennig, and M. Toborek. 2005. HIV-1 Tat protein-induced alterations of ZO-1 expression are mediated by redox-regulated ERK 1/2 activation. J. Cereb. Blood Flow Metab. 25:1325-1335. [DOI] [PubMed] [Google Scholar]
- 56.Raub, T. J. 1996. Signal transduction and glial cell modulation of cultured brain microvessel endothelial cell tight junctions. Am. J. Physiol. 271:C495-C503. [DOI] [PubMed] [Google Scholar]
- 57.Rubin, L. L., and J. M. Staddon. 1999. The cell biology of the blood-brain barrier. Annu. Rev. Neurosci. 22:11-28. [DOI] [PubMed] [Google Scholar]
- 58.Sauty, A., M. Dziejman, R. A. Taha, A. S. Iarossi, K. Neote, E. A. Garcia-Zepeda, Q. Hamid, and A. D. Luster. 1999. The T cell-specific CXC chemokines IP-10, Mig, and I-TAC are expressed by activated human bronchial epithelial cells. J. Immunol. 162:3549-3558. [PubMed] [Google Scholar]
- 59.Schaumburg, C. S., K. S. Held, and T. E. Lane. 2008. Mouse hepatitis virus infection of the CNS: a model for defense, disease, and repair. Front. Biosci. 13:4393-4406. [DOI] [PMC free article] [PubMed] [Google Scholar]
- 60.Seth, A., P. Sheth, B. C. Elias, and R. Rao. 2007. Protein phosphatases 2A and 1 interact with occludin and negatively regulate the assembly of tight junctions in the CACO-2 cell monolayer. J. Biol. Chem. 282:11487-11498. [DOI] [PubMed] [Google Scholar]
- 61.Shrestha, B., B. Zhang, W. E. Purtha, R. S. Klein, and M. S. Diamond. 2008. Tumor necrosis factor alpha protects against lethal West Nile virus infection by promoting trafficking of mononuclear leukocytes into the central nervous system. J. Virol. 82:8956-8964. [DOI] [PMC free article] [PubMed] [Google Scholar]
- 62.Sikorski, E. E., R. Hallmann, E. L. Berg, and E. C. Butcher. 1993. The Peyer's patch high endothelial receptor for lymphocytes, the mucosal vascular addressin, is induced on a murine endothelial cell line by tumor necrosis factor-alpha and IL-1. J. Immunol. 151:5239-5250. [PubMed] [Google Scholar]
- 63.Similä, S., R. Jouppila, A. Salmi, and R. Pohjonen. 1970. Encephalomeningitis in children associated with an adenovirus type 7 epidemic. Acta Paediatr. Scand. 59:310-316. [DOI] [PubMed] [Google Scholar]
- 64.Song, L., and J. S. Pachter. 2003. Culture of murine brain microvascular endothelial cells that maintain expression and cytoskeletal association of tight junction-associated proteins. In Vitro Cell. Dev. Biol. Anim. 39:313-320. [DOI] [PubMed] [Google Scholar]
- 65.Song, L., and J. S. Pachter. 2004. Monocyte chemoattractant protein-1 alters expression of tight junction-associated proteins in brain microvascular endothelial cells. Microvasc. Res. 67:78-89. [DOI] [PubMed] [Google Scholar]
- 66.Spindler, K. R., L. Fang, M. L. Moore, C. C. Brown, G. N. Hirsch, and A. K. Kajon. 2001. SJL/J. mice are highly susceptible to infection by mouse adenovirus type 1. J. Virol. 75:12039-12046. [DOI] [PMC free article] [PubMed] [Google Scholar]
- 67.Stamatovic, S. M., R. F. Keep, S. L. Kunkel, and A. V. Andjelkovic. 2003. Potential role of MCP-1 in endothelial cell tight junction ‘opening’ signaling via Rho and Rho kinase. J. Cell Sci. 116:4615-4628. [DOI] [PubMed] [Google Scholar]
- 68.Stamatovic, S. M., P. Shakui, R. F. Keep, B. B. Moore, S. L. Kunkel, N. Van Rooijen, and A. V. Andjelkovic. 2005. Monocyte chemoattractant protein-1 regulation of blood-brain barrier permeability. J. Cereb. Blood Flow Metab. 25:593-606. [DOI] [PubMed] [Google Scholar]
- 69.Stevenson, B. R., J. M. Anderson, I. D. Braun, and M. S. Mooseker. 1989. Phosphorylation of the tight-junction protein ZO-1 in two strains of Madin-Darby canine kidney cells which differ in transepithelial resistance. Biochem. J. 263:597-599. [DOI] [PMC free article] [PubMed] [Google Scholar]
- 70.Toborek, M., Y. W. Lee, G. Flora, H. Pu, I. E. Andras, E. Wylegala, B. Hennig, and A. Nath. 2005. Mechanisms of the blood-brain barrier disruption in HIV-1 infection. Cell. Mol. Neurobiol. 25:181-199. [DOI] [PMC free article] [PubMed] [Google Scholar]
- 71.Traweger, A., R. Fuchs, I. A. Krizbai, T. M. Weiger, H. C. Bauer, and H. Bauer. 2003. The tight junction protein ZO-2 localizes to the nucleus and interacts with the heterogeneous nuclear ribonucleoprotein scaffold attachment factor-B. J. Biol. Chem. 278:2692-2700. [DOI] [PubMed] [Google Scholar]
- 72.Tsao, N., H. P. Hsu, C. M. Wu, C. C. Liu, and H. Y. Lei. 2001. Tumour necrosis factor-alpha causes an increase in blood-brain barrier permeability during sepsis. J. Med. Microbiol. 50:812-821. [DOI] [PubMed] [Google Scholar]
- 73.van Hinsbergh, V. W., L. Havekes, J. J. Emeis, E. van Corven, and M. Scheffer. 1983. Low density lipoprotein metabolism by endothelial cells from human umbilical cord arteries and veins. Arteriosclerosis 3:547-559. [DOI] [PubMed] [Google Scholar]
- 74.Vorbrodt, A. W., and D. H. Dobrogowska. 2004. Molecular anatomy of interendothelial junctions in human blood-brain barrier microvessels. Folia Histochem. Cytobiol. 42:67-75. [PubMed] [Google Scholar]
- 75.Walls, T., A. G. Shankar, and D. Shingadia. 2003. Adenovirus: an increasingly important pathogen in paediatric bone marrow transplant patients. Lancet Infect. Dis. 3:79-86. [DOI] [PubMed] [Google Scholar]
- 76.Wang, P., J. Dai, F. Bai, K. F. Kong, S. J. Wong, R. R. Montgomery, J. A. Madri, and E. Fikrig. 2008. Matrix metalloproteinase 9 facilitates West Nile virus entry into the brain. J. Virol. 82:8978-8985. [DOI] [PMC free article] [PubMed] [Google Scholar]
- 77.Wang, T., T. Town, L. Alexopoulou, J. F. Anderson, E. Fikrig, and R. A. Flavell. 2004. Toll-like receptor 3 mediates West Nile virus entry into the brain causing lethal encephalitis. Nat. Med. 10:1366-1373. [DOI] [PubMed] [Google Scholar]
- 78.Weinberg, J. B., D. R. Jensen, L. E. Gralinski, A. R. Lake, G. S. Stempfle, and K. R. Spindler. 2007. Contributions of E1A to mouse adenovirus type 1 pathogenesis following intranasal inoculation. Virology 357:54-67. [DOI] [PMC free article] [PubMed] [Google Scholar]
- 79.Weinberg, J. B., G. S. Stempfle, J. E. Wilkinson, J. G. Younger, and K. R. Spindler. 2005. Acute respiratory infection with mouse adenovirus type 1. Virology 340:245-254. [DOI] [PMC free article] [PubMed] [Google Scholar]
- 80.Welton, A. R., E. J. Chesler, C. Sturkie, A. U. Jackson, G. N. Hirsch, and K. R. Spindler. 2005. Identification of quantitative trait loci for susceptibility to mouse adenovirus type 1. J. Virol. 79:11517-11522. [DOI] [PMC free article] [PubMed] [Google Scholar]
- 81.Welton, A. R., and K. R. Spindler. 2007. Capture ELISA quantitation of mouse adenovirus type 1 in infected organs. Methods Mol. Biol. 130:215-221. [DOI] [PubMed] [Google Scholar]
- 82.Wong, D., K. Dorovini-Zis, and S. R. Vincent. 2004. Cytokines, nitric oxide, and cGMP modulate the permeability of an in vitro model of the human blood-brain barrier. Exp. Neurol. 190:446-455. [DOI] [PubMed] [Google Scholar]
- 83.Yamamoto, M., S. H. Ramirez, S. Sato, T. Kiyota, R. L. Cerny, K. Kaibuchi, Y. Persidsky, and T. Ikezu. 2008. Phosphorylation of claudin-5 and occludin by rho kinase in brain endothelial cells. Am. J. Pathol. 172:521-533. [DOI] [PMC free article] [PubMed] [Google Scholar]
- 84.Zhang, Y., D. Feigenblum, and R. J. Schneider. 1994. A late adenovirus factor induces eIF-4E dephosphorylation and inhibition of cell protein synthesis. J. Virol. 68:7040-7050. [DOI] [PMC free article] [PubMed] [Google Scholar]
- 85.Zhang, Y., and R. J. Schneider. 1994. Adenovirus inhibition of cell translation facilitates release of virus particles and enhances degradation of the cytokeratin network. J. Virol. 68:2544-2555. [DOI] [PMC free article] [PubMed] [Google Scholar]
- 86.Zheng, X., X. Lu, D. D. Erdman, E. J. Anderson, J. A. Guzman-Cottrill, M. Kletzel, and B. Z. Katz. 2008. Identification of adenvoiruses in specimens from high-risk pediatric stem cell transplant recipients and controls. J. Clin. Microbiol. 46:317-320. [DOI] [PMC free article] [PubMed] [Google Scholar]
- 87.Zhou, J., S. A. Stohlman, D. R. Hinton, and N. W. Marten. 2003. Neutrophils promote mononuclear cell infiltration during viral-induced encephalitis. J. Immunol. 170:3331-3336. [DOI] [PubMed] [Google Scholar]