Abstract
A number of emerging molecules and pathways have been implicated in mediating the T-cell exhaustion characteristic of chronic viral infection. Not all dysfunctional T cells express PD-1, nor are they all rescued by blockade of the PD-1/PD-1 ligand pathway. In this study, we characterize the expression of T-cell immunoglobulin and mucin domain-containing protein 3 (Tim-3) in chronic hepatitis C infection. For the first time, we found that Tim-3 expression is increased on CD4+ and CD8+ T cells in chronic hepatitis C virus (HCV) infection. The proportion of dually PD-1/Tim-3-expressing cells is greatest in liver-resident T cells, significantly more so in HCV-specific than in cytomegalovirus-specific cytotoxic T lymphocytes. Tim-3 expression correlates with a dysfunctional and senescent phenotype (CD127low CD57high), a central rather than effector memory profile (CD45RAnegative CCR7high), and reduced Th1/Tc1 cytokine production. We also demonstrate the ability to enhance T-cell proliferation and gamma interferon production in response to HCV-specific antigens by blocking the Tim-3-Tim-3 ligand interaction. These findings have implications for the development of novel immunotherapeutic approaches to this common viral infection.
Hepatitis C virus (HCV) is a major causative agent of chronic hepatitis, affecting approximately 200 million people throughout the world; the majority of individuals exposed to HCV become persistently infected (19). A broad array of functional impairments of virus-specific T cells from early to chronic stages of infection, including exhaustion (decreased antiviral cytokine production, cytotoxicity, and proliferative capacity) (8, 24) and arrested stages of differentiation (1, 13), is supported by considerable evidence. Recently, upregulation of programmed death 1 (PD-1) and downmodulation of CD127 (interleukin-7 [IL-7] receptor) have been linked to functional exhaustion of T cells in chronic HCV infection (5-7, 15, 21, 22). However, not all exhausted T cells express these phenotypic changes, and blockade of the PD-1/PD-L1 signaling pathway does not always reconstitute Th1/Tc1 cytokine production (4, 5), indicating that other molecules may contribute to the exhaustion typically associated with chronic viral infections (9). One such molecule is Tim-3 (T-cell immunoglobulin and mucin domain-containing molecule 3), a membrane protein initially identified on terminally differentiated Th1 but not Th2 cells in mice (9). A recent analysis of human immunodeficiency virus (HIV) infection demonstrates that Tim-3 is upregulated on both CD4+ and CD8+ T cells from patients with chronic infection relative to uninfected individuals and that virus-specific cells expressing high levels of Tim-3 secrete less IFN-γ than do Tim-3-negative cells (10). In light of these findings, for the first time, this study assessed the expression of Tim-3 in chronic HCV infection. We found a higher frequency of Tim3-expressing CD4+ and CD8+ T cells in chronic HCV infection, with the highest on HCV-specific cytotoxic T lymphocytes (CTLs). Tim-3 expression correlates with a dysfunctional phenotype and reduced Th1/Tc1 cytokine production but not viral load. We also demonstrated the ability to enhance T-cell proliferation in response to HCV-specific antigens by blocking the Tim-3-Tim-3 ligand interaction. These findings have implications for the development of novel immunotherapeutic approaches to this common disease.
MATERIALS AND METHODS
Study population.
The study protocol was approved by the Institutional Review Boards at the University of Colorado Health Sciences Center, Denver; the Oregon Health Sciences University, Portland; and the Alaska Area Native Health Services, Anchorage. All patients gave written consent for this study. The study population recruited comprised three groups of subjects. Group 1 comprised chronically HCV-infected patients from whom peripheral blood mononuclear cells (PBMCs) were available (n = 27), including 5 persons from the University of Colorado Health Sciences Center, Denver, and Oregon Health Sciences University, Portland, cohorts and 22 Alaska Native American Indian persons who been identified from a long-term HCV outcome study of the Alaska Native Tribal Health Consortium Liver Disease and Hepatitis Program. Group 2 comprised chronically HCV-infected patients with end stage liver disease from whom intrahepatic lymphocytes were derived (n = 15), and group 3 comprised normal healthy subjects (n = 10) negative for HCV and HIV. Groups 2 and 3 consisted of patients from the Denver and Portland cohorts. The mean age of the chronically infected HCV patients was 50 (range, 21 to 71) years, which was higher than the mean age of the uninfected control group (34 [range, 21 to 54] years). Forty percent of the controls and 68% of the HCV-infected patients were male. The majority of the chronic HCV infection patients had genotype 1 infection (88%).
Sample preparation and storage.
PBMCs were isolated from whole blood by Ficoll (Amersham Biosciences, Piscataway, NJ) density gradient centrifugation or cellular preparation tubes (Becton Dickinson [BD], Franklin Lakes, NJ; anticoagulant, sodium citrate). PBMCs were viably frozen in 80% fetal bovine serum (BioWhittaker, Walkersville, MD), 10% dimethyl sulfoxide (DMSO), and 10% RPMI 1640 medium (Life Technologies, Grand Island, NY) in liquid nitrogen for subsequent analyses. Hepatic mononuclear cells (HMNCs) were isolated from explanted liver tissue at the time of liver transplantation for HCV-related liver disease. Tissue samples were dissected into 1-mm3 pieces and added to complete RPMI 1640 medium and 0.05% collagenase type IV (312 U/mg), and the mixture was incubated at 37°C for 60 min. The supernatant was removed, and cell pellets were diluted in complete RPMI 1640 medium and centrifuged at 125 × g for 10 min. HMNCs were viably frozen in 80% fetal bovine serum (as described above) for subsequent analyses. Plasma preparation tubes (PPT tubes; BD Biosciences, San Jose, CA) were used to isolate plasma from whole blood, which was frozen and later thawed for viral load and genotype testing. HCV genotyping (line probe assay) and viral load determination (IU/ml) was performed by the Siemens Clinical Laboratory (Berkeley, CA).
Antibodies for analysis of cell surface antigen expression-fluorescence-activated cell sorter analysis.
Multiparameter flow cytometry was performed using a BD FACSCanto II instrument (BD Biosciences, San Jose, CA) compensated with single fluorochromes and analyzed using FACSDiva software (BD Biosciences). We obtained fluorochrome-labeled monoclonal antibodies (MAb) specific for CD3-APCH7/Pacific Blue, CD4-fluorescein isothiocyanate/allophycocyanin (APC), CD8-peridinin chlorophyll protein, CD45RA-APC, CCR7-PECy7, and PD1-fluorescein isothiocyanate from BD Biosciences and anti-CD57-AF647 from eBiosciences (San Diego, CA). Anti-Tim-3-phycoerythrin (clone 344823) and anti-CD127-APC antibodies were supplied by R&D Systems (Minneapolis, MN). Cryopreserved PBMCs or HMNCs (1 × 10⁶ to 2 × 10⁶) were stained for cell surface antigen expression at 4°C in the dark for 30 min, washed twice in 2 ml phosphate-buffered saline containing 1% bovine serum albumin and 0.01% sodium azide (fluorescence-activated cell sorter wash), and subsequently fixed in 200 μl of stabilizing fixative (BD). Isotype-matched control antibodies and fluorescence minus one (FMO) control stains were used to determine background levels of staining.
Intracellular cytokine assay.
PBMCs from six subjects, three uninfected controls and three chronic HCV infection patients, were stimulated for 6 h with plate-bound anti-CD3 (5 μg/ml) and soluble anti-CD28 (3 μg/ml) antibodies in the presence of brefeldin A (Sigma-Aldrich, St. Louis, MO) to inhibit cytokine secretion. Cell surface staining was carried out for CD3, CD4, CD8, and Tim-3, followed by intracellular staining for tumor necrosis factor alpha (TNF-α), gamma interferon (IFN-γ), and IL-2. Intracellular cytokine staining was carried out using Caltag solutions A and B (Fix and Perm solutions) according to the manufacturer's instructions (Caltag, Burlingame, CA). Anti-IL-2-APC and anti-TNF-α-PECy7 antibodies were supplied by BD Biosciences, and anti-IFN-γ-Pacific Blue antibody was obtained from BioLegend (San Diego, CA). Isotype-matched control antibodies and FMO control stains were used to determine background levels of staining.
HLA typing.
Screening for HLA A2 and status was performed by flow cytometry using an anti-A2 antibody (BD Biosciences) according to the manufacturer's instructions. Appropriate isotype-matched control antibody stains were included.
Analysis of antigen-specific CD8+ T-cell responses.
Patients expressing the appropriate HLA class I allele (A2) were assessed for antigen-specific responses to HCV by pentamer staining. APC-labeled Pro5 pentamers were purchased from ProImmune (Springfield, VA). The pentamers used were HLA A2-restricted HCV1406-1415 (peptide sequence, KLVALGINAV) and HLA A2-restricted HCV1073-1081 (peptide sequence, CINGVCWTV). PBMCs were stained in conjunction with the antibodies detailed above by following the manufacturer's instructions. A2-restricted cytomegalovirus (CMV) pp65 was used as a non-HCV control. For flow cytometric analysis of antigen-specific cells, a minimum of 1 × 10⁵ CD8+ events were acquired for each pentamer stain.
Proliferation and blocking assays.
PBMCs from patients with known anti-HCV reactivity (n = 4) were incubated with carboxyfluroescein diacetate succinimidyl ester (CFSE; 10 μmol/liter; Molecular Probes, Eugene, OR) for 10 min at 37°C for use in proliferation assays. CFSE-labeled PBMCs (10 × 106/ml) were incubated at 37°C in 5% CO2 for 7 days in the presence of HCV-specific peptide pools (10 μg/ml). Five nanograms of IL-2 was added at days 0, 2, 4, and 6. The peptide pools used for each individual patient had previously been shown to elicit IFN-γ responses from both CD4+ and CD8+ T cells in an enzyme-linked immunospot (ELISPOT) assay. The HCV peptide pools used were as follows: for patient 1, p7, NS5B5, and NS5B4; for patient 2, E1B and NS2A; for patient 3, core, E1A, E1B, and NS5B5; for patient 4, NS37H, NS4A, and NS5B6 (see reference 20 for details of peptide pool composition). Blocking antibody against Tim-3 (clone 1G5, from Vijay Kuchroo) or immunoglobulin G (IgG) isotype control antibody was added to the cultures at a concentration of 10 μg/ml. Binding assays demonstrate that the 1G5 antibody binds the Tim-3 IgV domain; evidence that this antibody is antagonistic comes from in vitro studies suggesting that this antibody blocks a negative signal leading to enhanced production of cytokines, specifically, IFN-γ (Vijay Kuchroo, unpublished data). DMSO negative controls were included for each subject. Cells were harvested and stained with anti-CD3, anti-CD8, and anti-CD4 antibodies. Loss of CFSE (mean fluorescence intensity) in CD8+/CD4+ T cells was analyzed by flow cytometry. Supernatants from these cultures were stored at −80°C for subsequent analysis of cytokine production by Luminex technology. For two patients demonstrating pentamer responses (A2 HCV-1073), a similar proliferation assay was carried out with the pentamer-specific peptide.
Luminex assay for cytokine production in culture supernatants.
Samples were transferred to MultiScreen filter plates (Millipore, Billerica, MA) and assayed by Beadlyte technology (Upstate, Charlottesville, VA) in conjunction with a Luminex100 IS system (Luminex Corp., Austin, TX) to determine the quantities of IFN-γ, TNF-α, and IL-10 within these samples. Duplicate samples and standards were processed according to Multiple Cytokine Detection Protocol B (Upstate), opting for overnight incubation with Beadmates from Upstate's Human Multi-Cytokine Flex kit. Beadlyte Standards were mixed and serially diluted 1:2 in tissue culture medium for the maximum detection range. Results were analyzed by using five-parameter logistic curves (fluorescence intensity versus pg/ml) generated by Luminex100 IS software (version 2.3).
Statistical analyses.
Results are expressed as mean (range). A two-tailed unpaired t test was used to compare differences between patient groups. Paired t tests were used to compare differences between Tim-3-positive and -negative T-cell populations. The Spearman test was used for correlation analysis. A P value of less than 0.05 was considered significant. The JMP 6.0 (SAS Institute, Inc., Cary, NC) statistical analysis package and Prizm 4.03 (GraphPad Software, San Diego, CA) were used.
RESULTS
Tim-3 expression is upregulated on CD4+ and CD8+ T cells in chronic HCV infection.
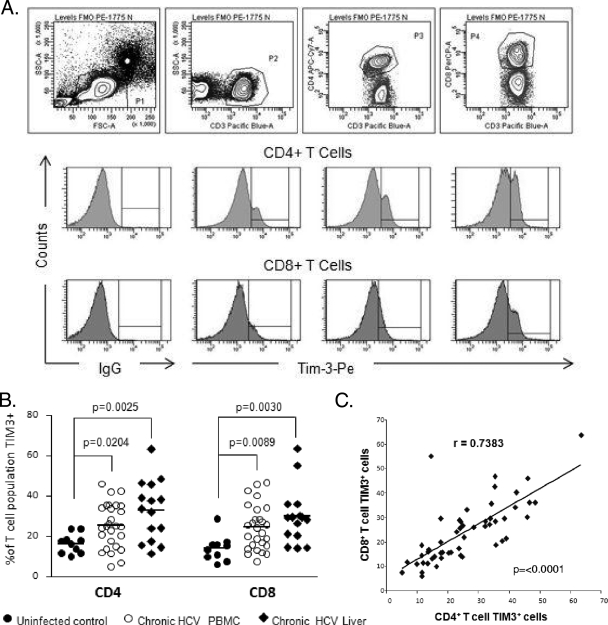
Table 1 shows the demographic characteristics of the study groups. We examined the expression of Tim-3 by flow cytometry on PBMCs from 42 patients with persistent hepatitis C viremia (including 15 with intrahepatic lymphocytes) and 10 normal controls. As shown in Fig. 1B, chronic HCV infection is associated with elevated frequencies of Tim-3-expressing CD4+ and CD8+ T cells relative to those of uninfected subjects. This was noted on the bulk populations both in the peripheral blood and within the intrahepatic compartment. Moreover, there was a strong direct correlation between the expression of Tim-3 on CD4+ cells and that on CD8+ T cells (Fig. 1C).
TABLE 1.
Demographic features of study group
| Group | No. of subjects | Mean age (yr) (range) | % of males | % Genotype 1 | HCV RNA (IU/ml) |
|---|---|---|---|---|---|
| Uninfected controls | 10 | 34 (21-54) | 60 | NAa | NA |
| Chronic HCV infection (peripheral) | 27 | 51 (21-71) | 48 | 100 | 1.2 × 10⁶ |
| Chronic HCV infection (liver) | 15 | 50 (38-59) | 93 | 67 | 0.8 × 10⁶ |
NA, not applicable.
FIG. 1.
Tim-3 expression is increased on CD4+ and CD8+ T cells in chronic HCV infection. (A) PBMCs from HCV-infected (n = 27) and uninfected (n = 10) subjects, as well as HMNCs from chronic HCV infection patients (n = 15) were stained with antibodies against CD3, CD4, CD8, and Tim-3. The top panel shows the gating strategy for identifying CD4+ and CD8+ T-cell subsets. The middle and lower panels consist of representative flow cytometric histograms measuring Tim-3 expression on gated CD4+ and CD8+ T cells, respectively. Interval gates to determine the percentage of the T-cell subset expressing Tim-3 are set relative to the appropriate FMO control. (B) The frequency of Tim-3-expressing CD4+ and CD8+ T cells is increased in chronically HCV-infected subjects and highest in liver-derived T-cell subsets. Each symbol represents an individual patient, and the horizontal lines demonstrate the mean. (C) There is a direct positive correlation between the proportion of CD4+ and CD8+ T cells expressing Tim-3. Tim-3 expression on either CD4+ or CD8+ T cells did not correlate with the viral load (data not shown).
Tim-3 expression is upregulated on HCV-specific CTLs relative to CMV-specific CTLs and total CD8+ T cells.
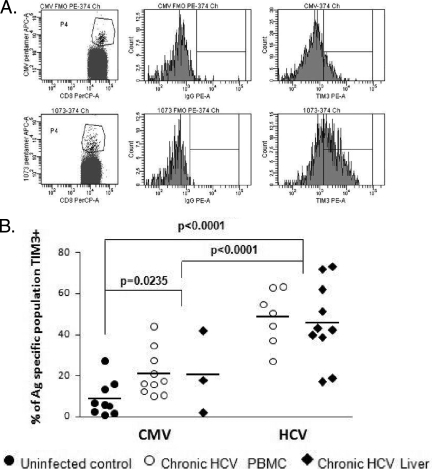
Staining with major histocompatibility complex class I pentamers incorporating either HCV or CMV epitopes revealed that HCV-specific CTLs (both in the peripheral blood and in the intrahepatic compartment) contained statistically significantly higher levels of Tim-3-expressing cells than CMV-specific CTLs (Fig. 2). The frequency of Tim-3-expressing HCV-specific CTLs was also statistically significantly higher than for bulk CD8+ T cells (P < 0.0001, Fig. 1B and C). Thus, in keeping with our previously reported study (6) of PD-1, CTLs in a persistently viremic infection (HCV) demonstrate a more exhausted phenotype than those in a latent infection (CMV).
FIG. 2.
Tim-3 expression is increased on HCV-specific T cells. (A) Individuals who were shown to be positive for HLA A2 were screened for anti-CMV and anti-HCV responses using a panel of pentamers (as described in Materials and Methods) and assayed for Tim-3 expression. The plots shown are from one chronically HCV-infected subject who demonstrated positivity for anti-CMV, as well as anti-HCV responses. The top panel shows the anti-CMV T cells and expression of Tim-3 on this population relative to the FMO control. The bottom panel shows a higher frequency of Tim-3-positive HCV-specific T cells. (B) HCV-specific T cells in the liver and the periphery demonstrate a significantly higher frequency of Tim-3-positive cells than CMV-specific T cells. Remarkably, a higher proportion of CMV-specific T cells from chronic HCV infection patients express Tim-3 than anti-CMV T cells in uninfected controls. Each symbol represents an individual patient, and the horizontal lines demonstrate the mean.
Frequency of dually Tim-3/PD-1-expressing T lymphocytes varies according to HCV infection status and compartment.
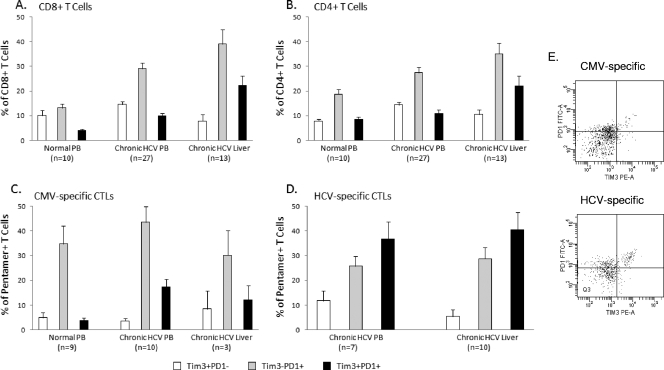
As we and others have shown PD-1 to be a marker of T-cell exhaustion in HCV infection (6, 15), we determined whether Tim-3 expression identifies the same or a distinct population of T cells. Costaining of PD-1 and Tim-3 was determined by flow cytometry for total CD4+ and CD8+ T cells and virus-specific CTLs. As shown in Fig. 3, a minority of bulk CD8+ T cells (∼4%) expressed both Tim-3 and PD-1 among normal healthy subjects, and the proportion was statistically significantly higher in patients with chronic HCV infection and highest within the intrahepatic compartment (22.33%). A statistically significantly higher percentage of total CD4+ T cells expressed both PD-1 and Tim-3 within the intrahepatic compartment of chronically infected patients than in the peripheral blood of chronically infected patients and normal subjects. Notably, the majority of virus-specific CTLs express PD-1, either alone or in association with Tim-3. Among HCV-specific, pentamer-positive CTLs, the proportion of Tim-3/PD1 doubly positive cells is increased (relative to the total number of CD8+ T cells); moreover, the proportion of doubly positive HCV-specific CTLs is significantly higher than that of CMV-specific and total CD8+ T cells in chronic infection (P = 0.0127) (Fig. 3C and D).
FIG. 3.
Coexpression of PD-1 on Tim-3-positive T cells in chronic HCV infection. Coexpression of PD1 on Tim-3-positive bulk and antigen-specific T-cell populations was examined. Mean values are shown expressed as a percentage of the indicated population. (A) Total CD8+ T cells that coexpress Tim-3 and PD1 are rare in uninfected control blood. A significant increase is seen in the doubly positive population in peripheral CD8+ T cells in chronic HCV infection (P = 0.0074), which is further increased in the liver compartment (P = 0.0007). (B) A similar pattern is seen for CD4+ T cells with respect to the liver compartment (P = 0.0135); however, peripheral populations do not differ significantly from uninfected controls. (C) CMV-specific and (D) HCV-specific populations are shown (percentage of pentamer-positive cells). In the periphery, in chronic HCV infection, the proportion of Tim-3/PD1 doubly positive cells is increased on all antigen-specific CTLs independently of specificity; however, the proportion of doubly positive HCV-specific CTLs is significantly higher than CMV-specific and total CD8+ T cells in chronic infection (P = 0.0127). Within the liver compartment, an increase in the level of HCV-specific doubly positive cells compared to that in the peripheral blood was not observed. Error bars represent the standard error of the mean. (E) Representative flow plots of PD-1 and Tim-3 staining on antigen-specific cells from peripheral blood.
Phenotypic and functional status of Tim-3-positive T-cell populations.
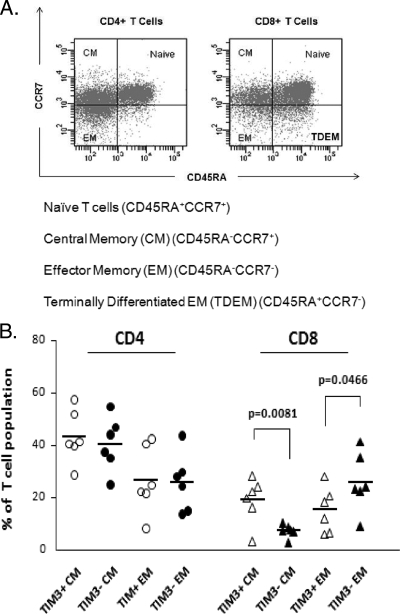
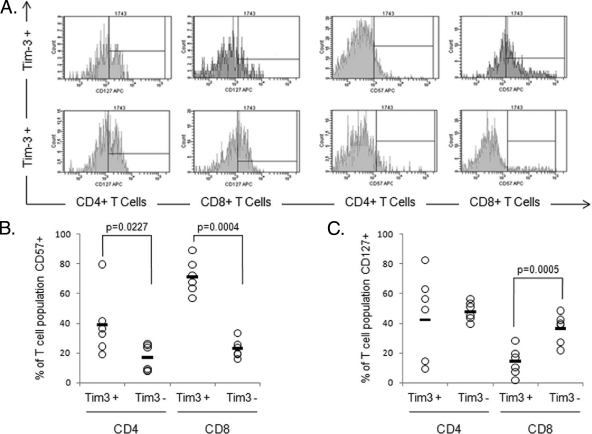
The phenotypic profile of Tim-3high and Tim-3low cells was assessed by using a panel of markers, including CCR7 and CD45RA, to assign T cells into naïve, central memory, and effector memory subsets (Fig. 3A) (17, 18). By convention, T cells coexpressing CD45RA and CCR7 are defined as naïve; the relative proportions of this subset were not related to Tim-3 expression. The proportions of CD4+ T cells with these differentiation patterns did not vary according to Tim-3 expression. However, among the CD8+ T cells, Tim-3 expression was associated with a significantly higher proportion of central memory cells (P = 0.008) and a lower proportion of effector memory cells (P < 0.05) (Fig. 4). No significant differences were seen for naïve or terminally differentiated effector memory T cells. Furthermore, the levels of the senescence marker CD57 were greater on Tim-3high CD4+ and CD8+ T cells than on their Tim-3low counterparts. CD127 is a marker of effector CTLs more likely to survive and differentiate into protective memory T cells (5). CD127 expression has previously been shown to decrease as cells move from the naïve to the terminal differentiated stage, and we have previously demonstrated that loss of CD127 leads to viral persistence in HCV (5). In the present study, we found that for CD8+ T cells, Tim-3positive populations had statistically significantly lower expression of CD127 (Fig. 5). Our data demonstrate in humans that Tim-3 expression is associated with immunophenotypic markers of memory differentiation and senescence of T cells.
FIG. 4.
Tim-3positive CD8+ T-cell populations contain more central and less effector memory cells than their Tim-3negative counterparts. (A) Naïve, central memory (CM), and effector memory (EM) T-cell subsets can be defined by the pattern of expression of CD45RA and CCR7 as shown. In the CD8+ T-cell population, cells positive for CD4RA and not expressing CCR7 are thought to be terminally differentiated effector memory (TDEM) cells derived from the effector memory cell population which re-express this antigen. (B) CD4+ and CD8+ T cells were subdivided on the basis of positivity and negativity for Tim-3 expression. Tim-3-positive and Tim-3-negative CD4+/CD8+ T cells were analyzed for the expression of CD45RA and CCR7 to determine the relative maturation stages of these populations. A higher proportion of the Tim-3-positive CD8+ T cells demonstrated a central memory (CM) phenotype, while fewer demonstrated an effector memory phenotype than their Tim-3-negative counterparts. No difference was demonstrated for the TDEM population (data not shown). Each symbol represents an individual patient, and the horizontal lines demonstrate the mean. No differences in maturation phenotype were observed for the CD4+ T-cell subsets. Data points are shown for central and effector memory populations only.
FIG. 5.
Tim-3 expression identifies T cells with a dysfunctional phenotype. (A) CD4+ and CD8+ T cells were subdivided on the basis of positivity and negativity for Tim-3 expression. Tim-3-positive and Tim-3-negative CD4+/CD8+ T cells were analyzed for the coexpression of CD57 and CD127. PBMCs from six subjects were assayed, three uninfected controls and three chronic HCV infection patients. The representative flow cytometric histograms show expression of these cell surface antigens on CD4 and CD8+ T-cell subsets defined by Tim-3 expression. Interval gates to determine the percentage of the T-cell subset expressing Tim-3 are set relative to the appropriate FMO control. The phenotype of Tim-3+ T-cell subsets is consistent with a more exhausted phenotype. (B) The senescence marker CD57 is preferentially expressed on the Tim-3-positive subset of both CD4+ and CD8+ T cells. In particular for Tim-3+ CD8+ cells, there appears to be a shift in the entire population, suggesting that the entire population may be positive for CD57, albeit at a level below detection compared to isotype controls. (C) Decreased expression of the IL-7 receptor (CD127), a putative marker for functional T cells, was also demonstrated for Tim-3+ CD8+ T cells. Each symbol represents an individual patient, and the horizontal lines represent the mean.
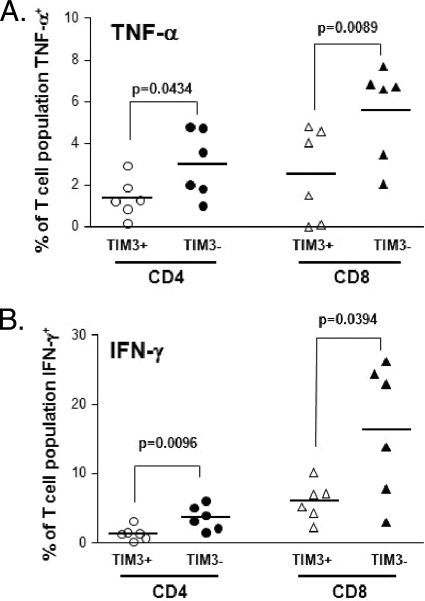
Next, we stimulated PBMCs from healthy and HCV-infected subjects with plate-bound CD3 and soluble CD28 as a nonmaximal stimulus of T cells (instead of phorbol myristate acetate/ionomycin, which can cause prominent alterations of cell morphology [2] and membrane expression of CD4). As shown in Fig. 6, TNF-α and IFN-γ production was decreased among both CD4+ and CD8+ T cells that expressed Tim-3 compared to that in Tim-3-negative T cells. Although the same pattern was observed with IL-2 production, the sample size was too small to achieve statistical significance. Taken together, our data indicate that Tim-3 identifies a subset of noneffector T cells with impaired production of Th1/Tc1 cytokines (10).
FIG. 6.
Tim-3+ T cells produce less Th1/Tc1 cytokines. PBMCs from six subjects, three uninfected controls and three chronic HCV infection patients, were stimulated for 6 h with plate-bound anti-CD3 (5 μg/ml) and soluble anti-CD28 (3 μg/ml) antibodies in the presence of brefeldin A to inhibit cytokine secretion. Cell surface staining was carried out for CD3, CD4, CD8, and Tim-3, followed by intracellular staining for TNF-α, IFN-γ, and IL-2. Flow cytometric analysis was used to determine the proportions of the Tim-3-positive and -negative subsets of CD4+ and CD8+ T cells producing cytokines after brief stimulation. (A) Tim-3-positive CD4+ and CD8+ T-cell subsets produce less TNF-α than their Tim-3-negative counterparts. (B) A similar pattern is seen for IFN-γ production.
Reversal of HCV-specific T-cell exhaustion by blocking the Tim-3-Tim-3 ligand pathway.
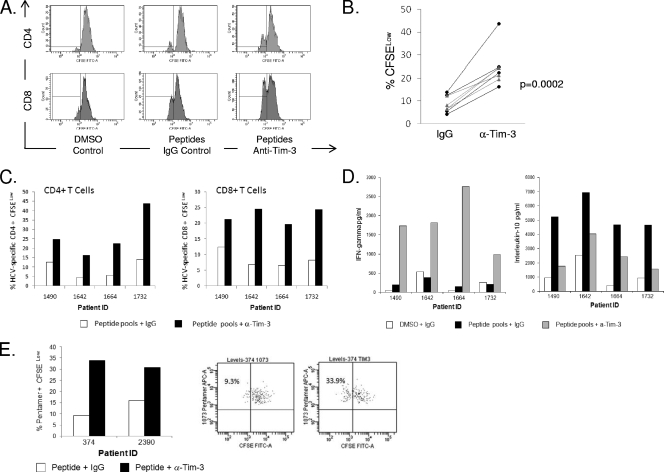
To further define the relationship between Tim-3 expression and T-cell dysfunction, we explored whether blocking with an anti-Tim-3 MAb (clone 1G5) would enhance proliferation of or cytokine production by HCV-specific CD4+ and CD8+ T cells. PBMCs from patients with chronic HCV infection were stimulated with peptide pools shown to elicit IFN-γ ELISPOTs as described previously (20). Cells were cultured with the DMSO control alone and cognate peptides in the presence of 10 μg/ml MAb 1G5 or control IgG. We used CFSE to monitor the proliferation of HCV-specific T cells after 7 days. As shown in Fig. 7, in chronic HCV infection, addition of the blocking antibody augmented the number of proliferating (CFSElow) HCV-specific T cells in all of the experiments (Fig. 7B). The differences in proliferation comparing the effect of anti-Tim-3 antibody to control IgG in the presence of antigen-specific stimulation are highly significant, as demonstrated in Fig. 7C. We also demonstrate in these same cultures increased IFN-γ and decreased IL-10 levels in the presence of the anti-Tim-3 antibody (Fig. 7D). Enhanced proliferation of pentamer-positive CTLs was also evident (Fig. 7E).
FIG. 7.
Blocking Tim-3 enhances HCV-specific proliferative responses for both CD4+ and CD8+ T cells. Four chronic HCV infection patients were chosen on the basis of their previously demonstrated ability to produce IFN-γ in response to HCV-specific peptide pools as assessed by ELISPOT assays (both CD4+ and CD8+ T cells). PBMCs were CFSE stained and cultured for 7 days with DMSO or appropriate HCV-specific peptide pools, and the effect of 10 μg/ml of IgG isotype control was compared to the effect of 10 μg/ml of anti-Tim-3 MAb (clone 1G5). A decrease in CFSE (% CFSELow cells) is indicative of proliferated cells. The HCV peptide pools used were as follows: for patient 1, p7, NS5B5, and NS5B4; for patient 2, E1B and NS2A; for patient 3, core (A and B), E1A, E1B, and NS5B5; for patient 4, NS37H, NS4A, and NS5B6 (the composition of the peptide pools is described fully in reference 20). (A) Representative flow plots of CFSE staining are shown for one individual patient, although cells do not appear to have undergone multiple rounds of proliferation. (B) The combined data from all four patients tested comparing the effect of anti-Tim-3 to that of the IgG control in the presence of antigen-specific stimulation is shown. The black dotted lines (with circles) represent CD4+ T cells, and the grey solid lines represent CD8+ T cells. (C) Proliferative responses are shown minus the DMSO control for four individual patients. (D) Supernatants from the proliferation assay were tested for levels of IFN-γ and IL-10. As shown, culture in the presence of the anti-Tim-3 antibody induced IFN-γ. A concomitant decrease in IL-10 was observed. (E) The high level of proliferated cells detected in the assays using peptide pools suggests that there may also be proliferation of non-antigen-specific cells in this assay, although the staining suggests that the cells have not undergone multiple rounds of division; therefore, we took a more conventional approach and tested the ability of the blocking antibody to induce proliferation of pentamer-positive cells.
DISCUSSION
As shown in a number of murine and human models, chronic viral infections are characterized by accumulation of functionally impaired T cells (1). Although the expression of PD-1 has been associated with T-cell exhaustion in HIV, HCV, and lymphocytic choriomeningitis virus (12, 14), not all exhausted T cells express PD-1, supporting the concept that other inhibitory molecules are likely involved. The Tim family of genes, comprising eight members in mice and three members in humans, are located in regions associated with autoimmune and allergic diseases (9, 23). Tim molecules are expressed on T cells, monocytes, and antigen-presenting cells, including macrophages and dendritic cells (9). Tim-3 was initially found to be expressed on Th1 but not Th2 cells in mice (23), and reduction of Tim-3 expression in T cells using small interfering RNA or blocking antibodies was shown to increase secretion of the antiviral cytokine IFN-γ. Recently, Jones and colleagues confirmed the inhibitory role of Tim-3 in human T cells by characterizing patients with HIV infection (10).
The present study was designed to address a potential role for Tim-3 expression in chronic HCV infection for the first time. We analyzed both peripheral and intrahepatic compartments in patients with persistent viremia, demonstrating that the Tim-3 frequency is increased for total CD4+ and CD8+ T cells in viremic patients compared to that of normal, non-HCV-infected controls. The Tim-3 frequency was highest for HCV-specific CTLs, statistically significantly greater than on CMV-specific CTLs. These data mirror those published recently comparing HIV and CMV responses (10). Additionally, we found that a significantly higher percentage of total CD4+ and CD8+ T cells and HCV-specific CTLs within the hepatic compartment coexpressed Tim-3 and PD-1, consistent with the hypothesis that the liver is enriched for T cells that are functionally exhausted. The Tim-3 ligand galectin-9 is particularly abundant within the liver, although it is widely distributed in various tissues (23, 25). Prior studies have demonstrated that the Tim-3/galectin-9 pathway negatively regulates secretion of Tc1/Th1 cytokine secretion, and in the present analysis, we found that TNF-α and IFN-γ production was decreased among both CD4+ and CD8+ T cells that expressed Tim-3 relative to that in their Tim-3 negative counterparts after short-term stimulation. Although the Tim-3/galactin-9 pathway would be expected to contribute to failure to contain hepatic viral infections, this interaction is likely also important in limiting T-cell-mediated immunopathology (11). It is generally accepted that HCV-specific CD4+ T-helper cell responses, critically important for priming and maintaining HCV-specific CTL effector responses and progressively lost as HCV-related disease advances (16), are not restored by combination antiviral therapy (3). Our data indicate that Tim-3 blockade can restore proliferation of both CD4+ and CD8+ T cells; importantly, this Tim-3 blocking antibody, 1G5, was not shown to either induce or protect against cell death of T cells (V. Kuchroo, in press). Moreover, 7-day cultures revealed increased IFN-γ and decreased IL-10 secretion, suggesting that blockade collectively results in an enhanced antiviral profile, opening up exciting strategies for novel immunotherapy. An important distinction between PD-1 and Tim-3 has been made in the literature: whereas PD-1 blockade expands all activated T cells, Tim-3 blockade would only expand effector T cells (9), and the effect of single or simultaneous blockade of these negative pathways should be considered in order to improve the efficacy of currently available antiviral agents against this common disease.
Acknowledgments
This study was supported by a U19 HCV Center Grant to H.R.R. and grant RO1 AI 066209 to D.R.G.
Footnotes
Published ahead of print on 8 July 2009.
REFERENCES
- 1.Appay, V., P. R. Dunbar, M. Callan, P. Klenerman, G. M. A. Gillespie, L. Papagno, G. S. Ogg, A. King, F. Lechner, C. A. Spina, S. Little, D. V. Havlir, D. D. Richman, N. Gruener, G. Pape, A. Waters, P. Easterbrook, M. Salio, V. Cerundolo, A. J., McMichael, and S. L. Rowland-Jones. 2002. Memory CD8+ T cells vary in differentiation phenotype in different persistent virus infections. Nat. Med. 8:379-385. [DOI] [PubMed] [Google Scholar]
- 2.Baran, J., D. Kowalczyk, M. Ozóg, and M. Zembala. 2001. Three-color flow cytometry detection of intracellular cytokines in peripheral blood mononuclear cells: comparative analysis of phorbol myristate acetate-ionomycin and phytohemagglutinin stimulation. Clin. Diagn. Lab. Immunol. 8:303-313. [DOI] [PMC free article] [PubMed] [Google Scholar]
- 3.Burton, J. R., Jr., J. Klarquist, K. Im, S. Smyk-Pearson, L. Golden-Mason, N. Castelblanco, N. Terrault, H. R. Rosen, and the Virahep-C Study Group. 2008. Prospective analysis of effector and regulatory CD4+ T cells in chronic HCV patients undergoing combination antiviral therapy. J. Hepatol. 49:329-338. [DOI] [PubMed] [Google Scholar]
- 4.D'Souza, M., A. P. Fontenot, D. G. Mack, C. Lozupone, S. Dillon, A. Meditz, C. C. Wilson, E. Connick, and B. E. Palmer. 2007. Programmed death 1 expression on HIV-specific CD4+ T cells is driven by viral replication and associated with T cell dysfunction. J. Immunol. 179:1979-1987. [DOI] [PubMed] [Google Scholar]
- 5.Golden-Mason, L., J. R. Burton, Jr., N. Castelblanco, J. Klarquist, S. Benlloch, C. Wang, and H. R. Rosen. 2006. Loss of IL-7 receptor alpha-chain (CD127) expression in acute HCV infection associated with viral persistence. Hepatology 44:1098-1109. [DOI] [PubMed] [Google Scholar]
- 6.Golden-Mason, L., B. Palmer, J. Klarquist, J. A. Mengshol, N. Castelblanco, and H. R. Rosen. 2007. Upregulation of PD-1 Expression on circulating and intrahepatic HCV-specific CD8+ T cells associated with reversible immune dysfunction. J. Virol. 81:9249-9258. [DOI] [PMC free article] [PubMed] [Google Scholar]
- 7.Golden-Mason, L., J. Klarquist, A. S. Wahed, and H. R. Rosen. 2008. Cutting edge: programmed death-1 expression is increased on immunocytes in chronic hepatitis C virus and predicts failure of response to antiviral therapy: race-dependent differences. J. Immunol. 180:3637-3641. [DOI] [PubMed] [Google Scholar]
- 8.Gruener, N. H., F. Lechner, M. C. Jung, H. Diepolder, T. Gerlach, G. Lauer, B. Walker, J. Sullivan, R. Phillips, G. R. Pape, and P. Klenerman. 2001. Sustained dysfunction of antiviral CD8+ T lymphocytes after infection with hepatitis C virus. J. Virol. 75:5550-5558. [DOI] [PMC free article] [PubMed] [Google Scholar]
- 9.Hafler, D. A., and V. Kuchroo. 2008. TIMs: central regulators of immune responses. J. Exp. Med. 205:2699-2701. [DOI] [PMC free article] [PubMed] [Google Scholar]
- 10.Jones, R. B., L. C. Ndhlovu, J. D. Barbour, P. M. Sheth, A. R. Jha, B. R. Long, J. C. Wong, M. Satkunarajah, M. Schweneker, J. M. Chapman, G. Gyenes, B. Vali, M. D. Hyrcza, F. Y. Yue, C. Kovacs, A. Sassi, M. Loutfy, R. Halpenny, D. Persad, G. Spott, F. M. Hecht, T. W. Chun, J. M. McCune, R. Kaul, J. M. Rini, D. F. Nixon, and M. A. Ostrowski. 2008. Tim-3 expression defines a novel population of dysfunctional T cells with highly elevated frequencies in progressive HIV-1 infection. J. Exp. Med. 205:2763-2779. [DOI] [PMC free article] [PubMed] [Google Scholar]
- 11.Ju, Y., N. Hou, X. N. Zhang, D. Zhao, Y. Liu, J. J. Wang, F. Luan, W. Shi, F. L. Zhu, W. S. Sun, L. N. Zhang, C. J. Gao, L. F. Gao, X. H. Liang, and C. H. Ma. 2009. Blockade of Tim-3 pathway ameliorates interferon-gamma production from hepatic CD8+ T cells in a mouse model of hepatitis B virus infection. Cell. Mol. Immunol. 6:35-43. [DOI] [PMC free article] [PubMed] [Google Scholar]
- 12.Keir, M. E., L. M. Francisco, and A. H. Sharpe. 2007. PD-1 and its ligands in T-cell immunity. Curr. Opin. Immunol. 19:309-314. [DOI] [PubMed] [Google Scholar]
- 13.Lucas, M., A. L. Vargas-Cuero, G. M. Lauer, E. Barnes, C. B. Willberg, N. Semmo, B. D. Walker, R. Phillips, and P. Klenerman. 2004. Pervasive influence of hepatitis C virus on the phenotype of antiviral CD8+ T cells. J. Immunol. 172:1744-1753. [DOI] [PubMed] [Google Scholar]
- 14.Martinic, M. M., and M. G. von Herrath. 2008. Novel strategies to eliminate persistent viral infections. Trends Immunol. 29:116-124. [DOI] [PubMed] [Google Scholar]
- 15.Radziewicz, H., C. C. Ibegbu, M. L. Fernandez, K. A. Workowski, K. Obideen, M. Wehbi, H. L. Hanson, J. P. Steinberg, D. Masopust, E. J. Wherry, J. D. Altman, B. T. Rouse, G. J. Freeman, R. Ahmed, and A. Grakoui. 2007. Liver infiltrating lymphocytes in chronic human HCV infection display an exhausted phenotype with high PD-1 and low CD127 expression. J. Virol. 81:2545-2553. [DOI] [PMC free article] [PubMed] [Google Scholar]
- 16.Rosen, H. R., C. Miner, A. W. Sasaki, D. M. Lewinsohn, A. J. Conrad, A. Bakke, H. G. Bouwer, and D. J. Hinrichs. 2002. Frequencies of HCV-specific effector CD4+ T cells by flow cytometry: correlation with clinical disease stages. Hepatology 35:190-198. [DOI] [PubMed] [Google Scholar]
- 17.Sallusto, F., D. Lenig, R. Förster, M. Lipp, and A. Lanzavecchia. 1999. Two subsets of memory T lymphocytes with distinct homing potentials and effector functions. Nature 401:708-712. [DOI] [PubMed] [Google Scholar]
- 18.Sallusto, F., and A. Lanzavecchia. 2000. Understanding dendritic cell and T-lymphocyte traffic through the analysis of chemokine receptor expression. Immunol. Rev. 177:134-140. [DOI] [PubMed] [Google Scholar]
- 19.Shepard, C. W., L. Finelli, and M. J. Alter. 2005. Global epidemiology of hepatitis C virus infection. Lancet Infect. Dis. 5:558-567. [DOI] [PubMed] [Google Scholar]
- 20.Smyk-Pearson, S., I. A. Tester, D. Lezotte, A. W. Sasaki, D. M. Lewinsohn, and H. R. Rosen. 2006. Differential antigenic hierarchy associated with spontaneous recovery from hepatitis C virus infection: implications for vaccine design. J. Infect. Dis. 194:454-463. [DOI] [PubMed] [Google Scholar]
- 21.Streeck, H., Z. L. Brumme, M. Anastario, K. W. Cohen, J. S. Jolin, A. Meier, C. J. Brumme, E. S. Rosenberg, G. Alter, T. M. Allen, B. D. Walker, and M. Altfeld. 2008. Antigen load and viral sequence diversification determine the functional profile of −1-specific CD8+ T cells. PLoS Med. 5:e100. [DOI] [PMC free article] [PubMed] [Google Scholar]
- 22.Urbani, S., B. Amadei, D. Tola, M. Massari, S. Schivazappa, G. Missale, and C. Ferrari. 2006. PD-1 expression in acute hepatitis C virus (HCV) infection is associated with HCV-specific CD8 exhaustion. J. Virol. 80:11398-11403. [DOI] [PMC free article] [PubMed] [Google Scholar]
- 23.Wada, J., and Y. S. Kanwar. 1997. Identification and characterization of galectin-9, a novel beta-galactoside-binding mammalian lectin. J. Biol. Chem. 272:6078-6086. [DOI] [PubMed] [Google Scholar]
- 24.Wedemeyer, H., X. S. He, M. Nascimbeni, A. R. Davis, H. B. Greenberg, J. H. Hoofnagle, T. J. Liang, H. Alter, and B. Rehermann. 2002. Impaired effector function of hepatitis C virus-specific CD8+ T cells in chronic hepatitis C virus infection. J. Immunol. 1 69:3447-3458. [DOI] [PubMed] [Google Scholar]
- 25.Zhu, C., A. C. Anderson, A. Schubart, H. Xiong, J. Imitola, S. J. Khoury, X. X. Zheng, T. B. Strom, and V. K. Kuchroo. 2005. The Tim-3 ligand gelectin-9 negatively regulates T helper type 1 immunity. Nat. Immunol. 6:1245-1252. [DOI] [PubMed] [Google Scholar]


