Abstract
With the development of various models of pulmonary disease, there is tremendous interest in quantitative regional assessment of pulmonary function. While ventilation imaging has been addressed to a certain extent, perfusion imaging for small animals has not kept pace. In humans and large animals, perfusion can be assessed using dynamic contrast enhanced (DCE) magnetic resonance imaging with a single bolus injection of a Gd-based contrast agent. But, the method developed for the clinic cannot be translated directly to image the rodent due to the combined requirements of higher spatial and temporal resolution. This work describes a novel image acquisition technique staggered over multiple repeatable bolus injections of contrast agent using an automated micro-injector, synchronized with image acquisition to achieve dynamic first-pass contrast enhancement in the rat lung. This allows dynamic first-pass imaging that can be used to quantify pulmonary perfusion. Further, improvements are made in the spatial and temporal resolution by combining the multiple injection acquisition method with Interleaved Radial Imaging and “Sliding window-keyhole” reconstruction (IRIS). The results demonstrate a simultaneous increase in spatial resolution (<200 µm) and temporal resolution (<200 ms) over previous methods, with a limited loss in signal-to-noise-ratio.
Keywords: pulmonary, quantitative perfusion, rodents, radial keyhole
1. INTRODUCTION
Gas exchange between the airspaces and the blood is one of the core functions of the lungs. Matched ventilation and perfusion is essential for effective gas exchange (1). Ventilation/perfusion mismatch occurs during most respiratory diseases, such as chronic obstructive pulmonary disease (COPD), asthma, pulmonary embolism (PE), and pulmonary arterial hypertension (PAH). With a large number of genetic rodent models of pulmonary diseases now available for diseases such as asthma (2), COPD (3), pulmonary hypertension (4), pneumonia (5), and pulmonary fibrosis (6), there is a need to develop robust techniques for quantitative regional assessment of pulmonary function in small animals (7).
A number of imaging techniques have been developed over the years to study regional lung function. Pulmonary ventilation/perfusion (V/Q) imaging in humans is traditionally performed using a pair of nuclear scans that use inhaled and injected radioisotopes to assess lung function (8). While this technique has been demonstrated in animals, it is limited by poor spatial and temporal resolution and also requires the administration of radioactive materials.
The use of MR for lung imaging has been previously limited, due to extremely low proton density and susceptibility-related signal loss. With the development of intrinsic, as well as extrinsic contrast agent techniques, MRI is emerging as a choice for high-resolution functional imaging in the lung. While MRI is being developed as an alternative in the clinics using hyperpolarized 3He (9,10) or paramagnetic 15O (11) for ventilation, and dynamic contrast enhanced (DCE) MRI for perfusion; the technological barriers in developing these methods for small animal imaging have been significant.
Most MRI pulmonary imaging methods in the rodent have been developed to demonstrate ventilation (12,13); however, methods for perfusion imaging have remained elusive. Quantitative perfusion imaging in the lungs has been demonstrated in humans, canine, and porcine models (14–16) by capturing the wash-in and wash-out of a single bolus of contrast agent. Most studies on imaging pulmonary perfusion in small animals (17,18) provide a static image of the deposition of contrast agent after a slow infusion process for qualitative assessment of perfusion. The main challenges for quantitative perfusion in the rodent are the high spatial and temporal resolution required. The mass of the rat is ∼300 times less than a human, and its cardiac and respiratory rates are ∼5 times faster than humans, which leads to very high demands on spatial and temporal resolutions.
Undersampled projection reconstruction (PR) has been suggested for rapid imaging (19,20) in MR angiography to perform high-temporal resolution acquisition. However, this leads to lower signal-to-noise-ratio (SNR), and lower spatial resolution images with the introduction of significant artifacts due to undersampling.
Over the years, the field of dynamic imaging with MRI has been developed to acquire high spatial and high temporal resolution images. This can be achieved by exploiting the significant correlations in k-space and time exhibited by dynamic images. A class of approaches that exploit these correlations in time include methods such as “keyhole” (21,22) and other view-sharing techniques, such as time resolved imaging of contrast kinetics (TRICKS) (23), and continuous update with random encoding (CURE) (24). The effects of varying contrast in DCE-MRI are generally of a diffuse nature and are well suited to the keyhole technique (25). This work develops a technique with an underlying principle similar to keyhole.
The main idea proposed in this work is to stagger the acquisition over multiple injections to adequately sample the k-space. We describe a two-prong approach to image dynamic first-pass perfusion in small animals. First, we developed a dedicated small animal power injector that can deliver a controlled amount of contrast agent in a repeatable manner synchronous to the scanning sequence. Second, we developed an image acquisition and reconstruction technique that can exploit the correlations in dynamic images to improve the SNR, as well as spatial and temporal resolution. This is accomplished by using Interleaved Radial Imaging combined with a “Sliding window-keyhole” reconstruction, which we call IRIS for brevity.
Radial acquisition (RA) is perfectly suited to small animal pulmonary imaging because RA is robust in the presence of motion; RA permits short echo times (< 1 ms), which makes it very appealing for the lung where T2* is short; and finally RA is well suited to the keyhole methods since the center of Fourier space is sampled at every view. The use of radial encoded samples of Fourier space with methods that trade off spatial and temporal resolution has been suggested previously (26–31). However, this work combines radial encoding with multiple contrast injections to encode minimum unique data, making quantitative pulmonary perfusion imaging feasible in small animals.
2. METHODS
2.1 Animal Preparation and Surgery
All animal procedures were approved by the Duke Institutional Animal Care and Use Committee. Two sets of experiments (6 rats each) were carried out using two different imaging sequences, by placing catheters (3 French) in the right jugular vein of female Fischer 344 rats (Charles River Lab, MA) weighing 192–224 g. The animals were perorally intubated, and mechanically ventilated at 60 breaths per minute with a tidal volume of 2.0–2.2 ml. Anesthesia was maintained with 0.05 ml injections of Nembutal every 45 minutes. Body temperature was measured with a rectal thermistor and was maintained with a feedback-controlled heat source. Pediatric electrodes were taped on the footpads for ECG. All physiologic signals were continuously collected (Coulbourn Instruments, Allentown, PA) and displayed on a computer using LabVIEW software (National Instruments, Austin, TX). These signals were also used to control the triggering of the imaging sequences. At the conclusion of the studies, the animals were euthanized with an overdose of anesthesia.
2.2 Injector design for multiple injections
Total image acquisition time per injection was fixed at 6.4 seconds with a temporal resolution ≤400 ms, based on prior work using digital subtraction angiography (32). With sequences used in clinic and a single injection of contrast agent, it is extremely difficult to get both the high spatial and temporal resolution required for small animals. The overall approach was to employ multiple, highly reproducible injections of Magnevist® (Gd-DTPA, Berlex Inc., Montville NJ), each with a very small volume of contrast. This was accompanied by k-space sampling patterns designed so that for each injection, the temporal resolution was high and when data were combined across multiple injections, the spatial resolution was also high. The use of multiple injections is dependent on the accuracy of triggering during the cardio-respiratory cycle and the reproducibility of the injection. These requirements led to the development of an automatic power injector that is triggered using physiological signals synchronous to the scan sequence.
The injector was an adaptation of a similar injector for micro-digital subtraction angiography (32). The injector consists of a reservoir, a solenoid controlled by the trigger, and the tubing from the solenoid into the animal. A N2 tank is connected to the reservoir with a fixed pressure that is always “on.” A trigger generated by the physiological monitoring system triggers the injector by opening the solenoid and initiating the scan simultaneously. The operating characteristics of the injector depend on the viscosity of the fluid contained in the reservoir, the length of the tubing, the inner diameter of the tubing, the pressure in the N2 tank, and time for which the solenoid is “on.” Since we know the volume of injection, the viscosity of the contrast agent (2.9 CP at 37 ºC), and the length of the tubing, the other parameters of the injector were determined based on those constraints. PE-205 tubing was selected with an internal diameter of 1.57 mm. The injector was calibrated for the two different pressures of N2 and the amount of time that the solenoid was “on” (Table 1). Twelve repeated measurements of volume were made for each setting of pressure and “on” time, estimating the volume repeatability of the injection.
Table 1.
Injector volumes measured at pressure of 7/10 psi for 50/100 ms
| 7 psi of N2 | 10 psi of N2 | |
|---|---|---|
| 50 ms | 21.6 +/− 3.5 µl | 31.0 +/− 3.1 µl |
| 100 ms | 32.7 +/− 3.4 µl | 48.3 +/− 1.8 µl |
2.3 Perfusion Imaging Sequence with Multiple Injections
All data were acquired on a 2.0 T horizontal Oxford magnet interfaced to a GE EXCITE console running version 12M4 (GE Healthcare, Milwaukee, WI). The console has been modified to operate at 85 MHz using an up/down converter with a mixer to generate sum and difference frequencies for both transmit and receive. Two different birdcage coils were used—a 7 cm diameter x 7 cm length and a 7 cm diameter x 5.5 cm length.
DCE-MRI was performed at end-expiration with the first ECG R wave detected after suspension of ventilation, which triggered the power injector and data acquisition. Data acquisition was carried out by two different methods for different sets (N=6) of rats; 1) Dynamic Radial Acquisition (Dynamic RA), and 2) Interleaved Radial Imaging with “Sliding window-keyhole” (IRIS).
2.3.1 Dynamic RA
Acquisition
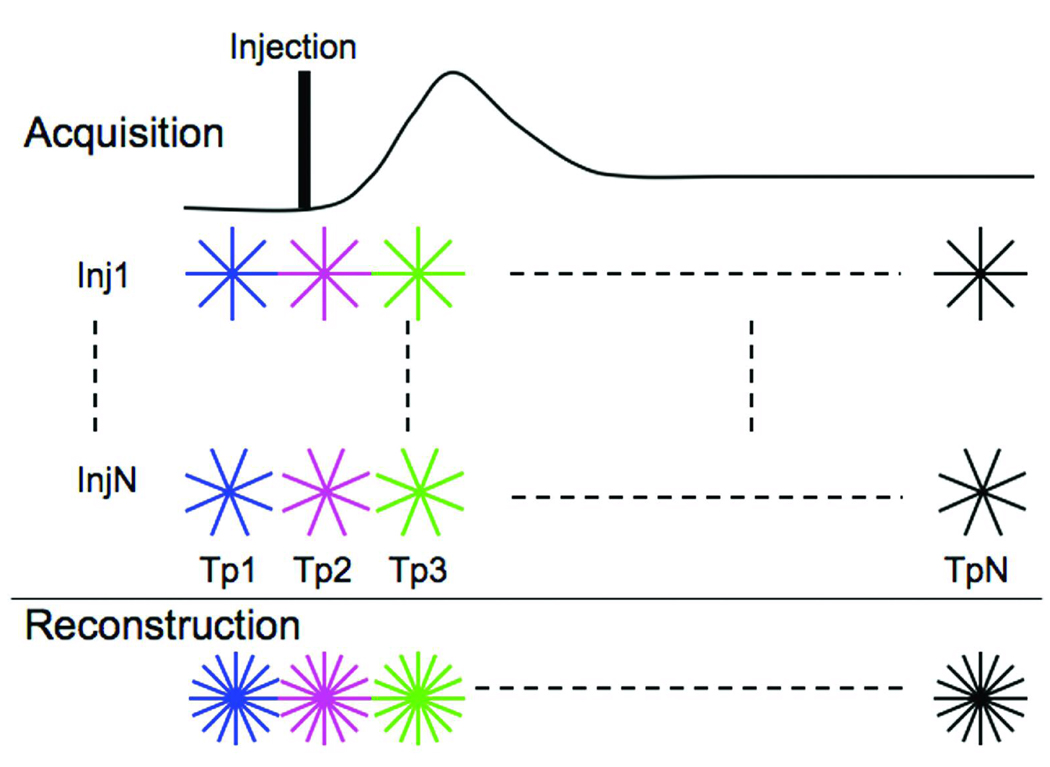
An example of the acquisition strategy is shown in Fig. 1, where data was acquired over multiple injections. A 2D radial acquisition sequence with short TE/TR (0.7/4.0 ms), and a flip angle of 40° was used with the FOV of 50 mm and slice thickness of 3 mm. With the total sampling time fixed at 6.4 seconds for each injection, and TR of 4 ms, one can acquire 1600 radial views per injection. In our experiment, we acquired data with a sequence using 2 injections. For each injection the 1600 views were apportioned into 16 distinct, contiguous sets of 100 views each, each set 400 ms long. A second injection was made allowing acquisition of an additional 100 views for each of the time-points, with these additional views interleaved with those from the first injection (a total of 200 views per time-point). The location and the view ordering for the lines of k-space for each individual time-point were the same. A similar sequence where the 1600 views from a single injection were apportioned into 64 contiguous sets was used to demonstrate that increasing the number of injections could be a way to increase temporal resolution (in this case), or spatial resolution.
Fig 1.
Dynamic RA acquisition and reconstruction scheme for DCE-MRI. Data are acquired over multiple injections (Inj1-InjN). During each injection, the same lines of k-space are acquired across multiple time-points (Tp1-TpN). The missing views for each time-point are acquired during the remaining injections. Reconstruction can be carried out by combining data (shown in last row) from the N injections and using a standard regridding algorithm.
Reconstruction
Each time-point was reconstructed independently from the others by regridding the data onto a 642 grid. Image reconstruction was carried out by re-sampling onto a Cartesian array using a standard gridding algorithm (33). Density compensation (34) was performed because the k-space is non-uniformly sampled from the center out.
2.3.2 IRIS
Acquisition
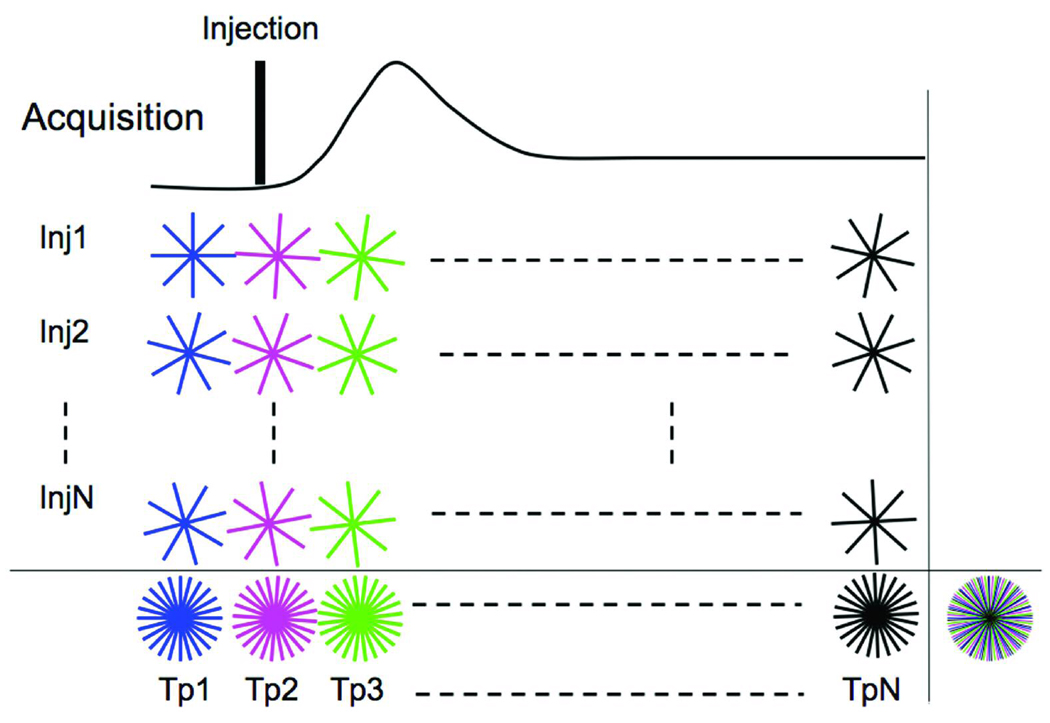
The imaging was carried out at 62.5 kHz bandwidth, with a flip angle of 40°, TE/TR = 0.7/4 ms, FOV = 50 mm, and a slice thickness of 3 mm. Figure 2 shows the acquisition view ordering over multiple time-points (Tp1-TpN) and multiple injections (Inj1-InjN). The acquisition for a single injection (Inj1) was carried out in an interleaved pattern. The interleaved pattern was created by adding a small angle (Δϕ) to the start angle of the earlier time-point given by
| [1] |
where views is the total number of k-space lines acquired during the complete acquisition. The acquisition for the next injection started with an angular offset (Δθ).
| [2] |
where, #Tp is the total number of time-points into which the total acquisition was divided. This ensured that when the k-space lines acquired over the multiple injections were combined, as shown in last row of Figure 2, k-space for each time-point was uniformly sampled. This reduces the severity of the undersampling artifact (31). Each view acquired was unique. For our experiments, #Tp was fixed at 16 and total number of injections was fixed at 4.
Fig 2.
IRIS acquisition scheme for DCE-MRI. Data is acquired over multiple injections (Inj1-InjN). The sequence differs from that in Figure 1, since the trajectories for each time-point for a given injection are no longer identical. Instead, each set of radial lines is rotated by a small increment (Δϕ) with respect to the trajectories of the previous time-point. Last row shows the k-space sampling pattern created when information from multiple injections is combined. Time-compressed k-space sampling distribution created by combining all k-space lines acquired throughout the acquisition over multiple injections and multiple time-points is shown the extreme right bottom. The different colored lines indicate the different time-points. Each radial line acquired throughout the acquisition is unique.
Different colors represent the way the data was binned for time-resolved sampling. Note that even though the acquisition was staggered over multiple injections, the recombined k-space distribution is still continuous in time and can be used with techniques such as sliding window (35). Even if the k-space lines from last row of Figure 2 were combined, the result would be a uniformly distributed sampling pattern, as shown on the extreme right bottom corner of Figure 2. This sampling provides a higher SNR compared to each individual undersampled time-point and would be equivalent to an average in the temporal dimension. This forms the high-resolution reference k-space that is used in the process of “keyhole,” eliminating the need to acquire a reference scan before or after the contrast injection to substitute the missing views during the undersampled acquisition. The primary advantage of radial imaging is that each line of k-space acquires the center lower frequency along with the peripheral higher frequency.
Reconstruction
The data can be reconstructed as an undersampled radial dataset as shown in the last row of Figure 2. This reconstruction yields images with low SNR and high temporal resolution that suffer from the streaking artifacts caused by the undersampling (19). However, since the time-resolved datasets are collected in an interleaved manner, one can perform reconstruction techniques suggested in (26,29). We have extended the method described in (26) by adding the component of “sliding window” to further improve the temporal resolution. The method combines the k-space cores or keyholes with the time-compressed k-space that forms the reference.
For a dynamic contrast enhanced study, the choice of the radius of the core is a crucial parameter to determine the true dynamic nature of the information because the true dynamic information is captured only in the core while the peripheral k-space is time averaged. The smaller the radius of the core, the greater is the temporal averaging. The number of uniformly distributed radial lines determines the radius of the core required to satisfy Nyquist’s criterion. Since the sampling of the k-space starts at the center in our case, Nyquist’s criterion is satisfied when Nr = πN, where N is the grid size on which we wish to reconstruct the image and Nr is the number of radial views. Since the dynamic information is updated by using a smaller number of views the diameter (D) of the core is determined by,
| [3] |
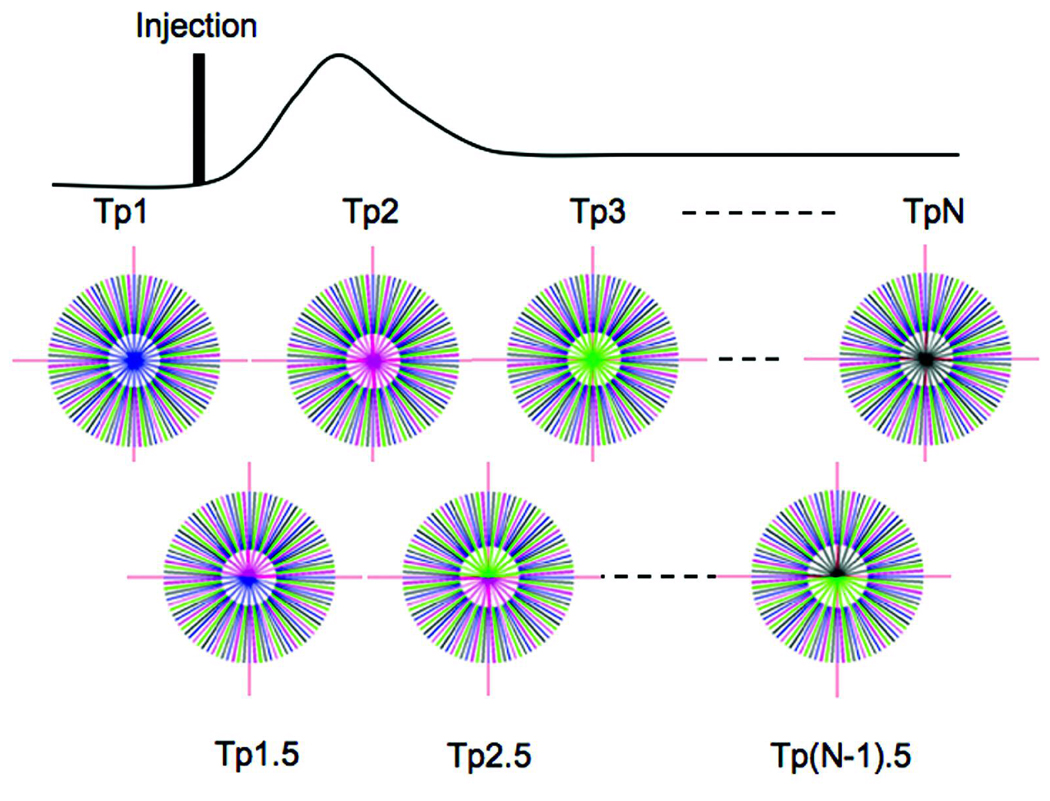
As shown in Figure 3, the technique presented here updates the central core of the k-space at time-point Tp1-TpN from the undersampled k-spaces shown in last row of Figure 2. Combining the later half of the earlier time-point and the earlier half of the next time-point creates the intermediate time-points Tp1.5, Tp 2.5, and so on. The number of rays used to create the core is constant at each time-point; however for these intermediate time-points, the distribution of those rays is not perfectly uniform. This uniformity is slightly disturbed by the small offset Δϕ; however, it does not lead to any significant increase in artifacts.
Fig 3.
IRIS reconstruction updates the core of the time-compressed k-space. Tp1-TpN are the number of time-points that are dynamically created. In this example, the time resolution is improved by a factor of 2. The first row shows the core with a single color (keyhole), while the second row shows the core with colors from the two closest time-points (sliding window).
In the example shown in Figure 3, intermediate time-points were created by using half the rays from the previous time-point and half from the next time-point; however, one can easily extend this to create intermediate time-points by updating and reconstructing at every single ray acquired at the end of each TR (repetition time). Image reconstruction was carried out by regridding the data onto a 2562 array. Sampling density compensation was performed to compensate for the non-uniformity of the k-space data caused by the IRIS reconstruction.
2.4 Quantitative Analysis
Quantitative perfusion metrics can be calculated by fitting Gamma variate curves (36,37) to the time-concentration curves generated by DCE-MRI using a nonlinear least-squares fit by adjusting α and β in Equation 4. The contrast agent concentration, C(t), at time, t, is expressed as
| [4] |
where, Cp is the peak concentration, TA is the time of appearance of the contrast agent, and α and β are the fitting parameters for the gamma variate function. From the fitted curve, quantitative metrics, such as the mean transit time (MTT), can be derived using:
| [5] |
3. RESULTS
3.1 Dynamic RA
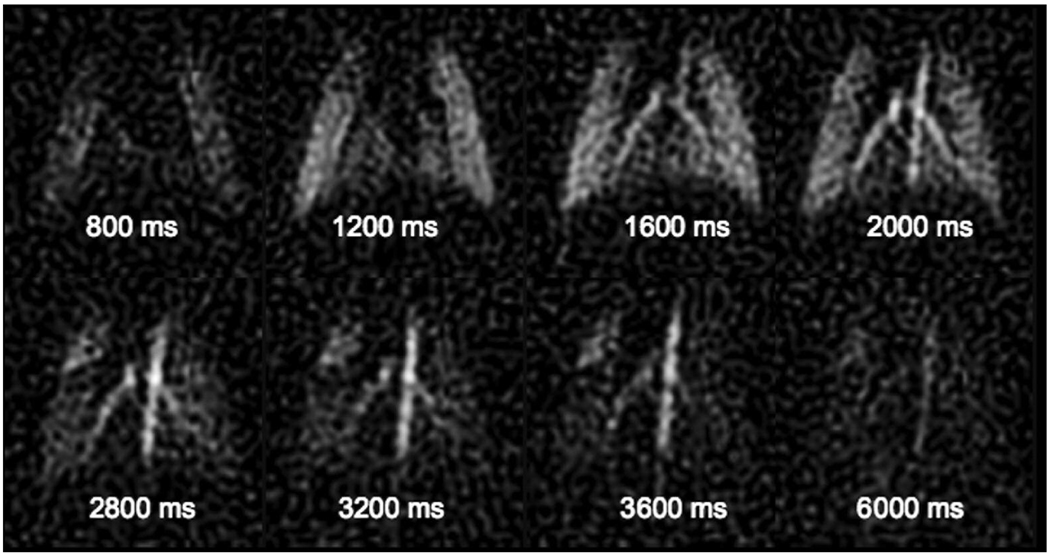
The DCE images were acquired in two runs—pre-contrast acquisition followed immediately by post-contrast acquisition. The pre-contrast images were subtracted from the post-contrast images. This is important where the signal behavior varies from view-to-view especially in the initial stages of contrast evolution when the magnetization is achieving a steady state. Figure 4 shows 8 dynamic contrast enhanced images from a series of 16 images at a temporal resolution of 400 ms, and spatial resolution of 780 µm using 2 injections separated by 15 seconds.
Fig 4.
Dynamic contrast enhanced MRI images acquired using dynamic RA (8 from a series of 16) in a rat showing the wash-in/wash-out behavior of the contrast agent at a spatial resolution of ∼780 µm and a temporal resolution of 400 ms using two 20 µl injections of Gd-DTPA.
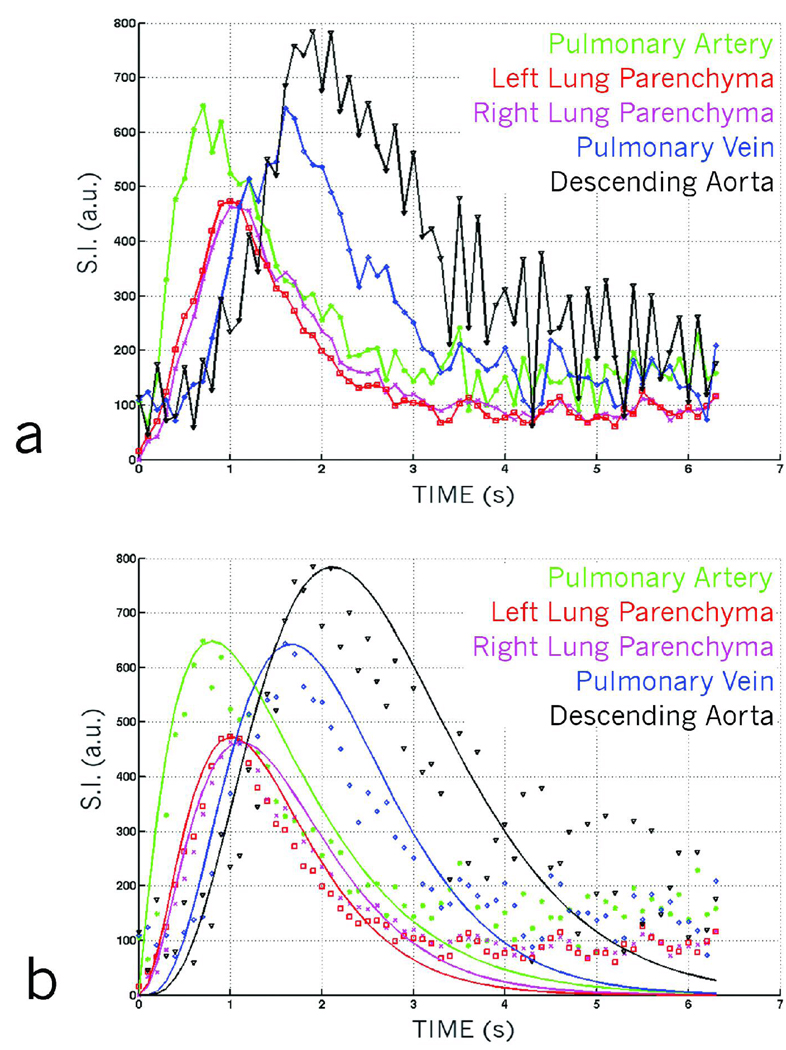
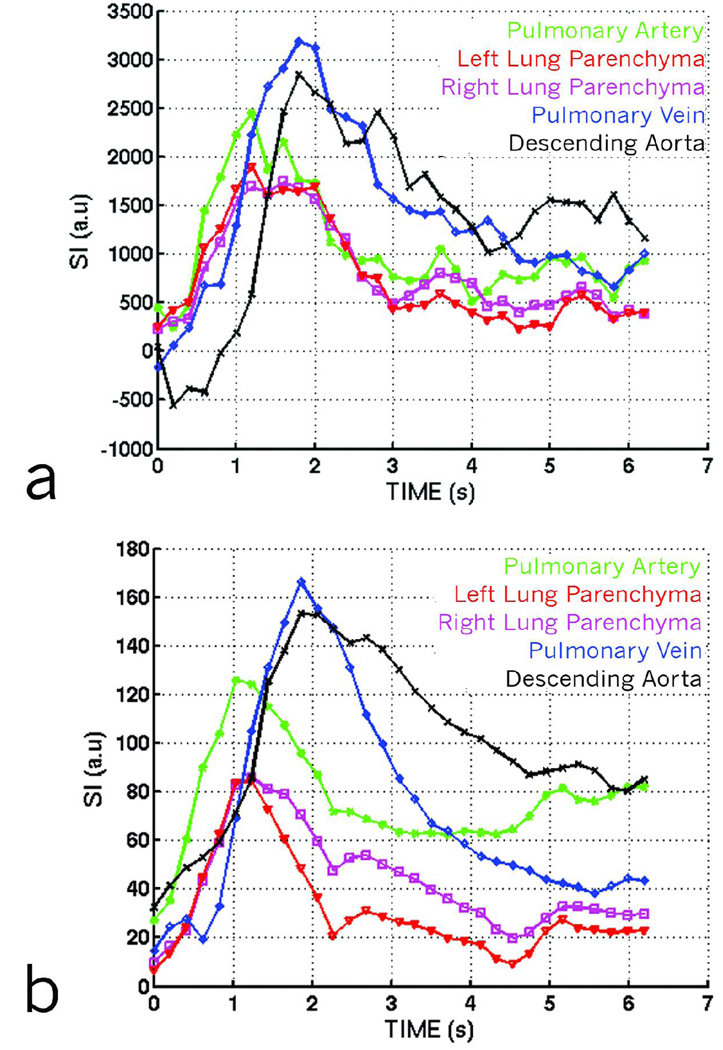
One can increase the number of injections to either improve spatial or temporal resolution. To demonstrate this, we performed a separate experiment in which 8 consecutive 20 µl injections of Gd-DTPA were used to acquire a DCE dataset at a temporal resolution of 100 ms. Dynamic first-pass curves for the dataset are shown in Figure 5a. The first-pass curves were generated by placing regions of interest (ROIs) in the path of the cardio-pulmonary circulation starting from the pulmonary artery, and proceeding in the direction of blood flow to the left and right lung parenchyma, the pulmonary vein, and the descending aorta. The curves show the different time-density characteristics of blood flow in different parts of the lung. The data were fit to a gamma variate function (Figure 5b) to extract quantitative blood flow / perfusion parameters, such as the time of appearance (TA), and the Mean Transit Time (MTT).
Fig 5.
(a) Dynamic first-pass curves created from a dynamic RA dataset using 8 injections to improve temporal resolution. First-pass curves are created by selecting regions of interest over various parts of the cardio-pulmonary circuit. The curves show subtle variations in different regions such as the pulmonary artery, the parenchyma, the pulmonary veins and the descending aorta. (b) Dynamic first-pass curves shown in 5a, fitted with gamma variate curves providing quantitative information about pulmonary perfusion.
3.2 IRIS — Simulation
We compared the ability of IRIS to track the wash-in/wash-out curve to that of the undersampled PR. A contrast bolus simulation was performed using a 2D Shepp-Logan phantom by modulating the intensity of the left ellipse over time with the following standard equation previously described in (26),
| [6] |
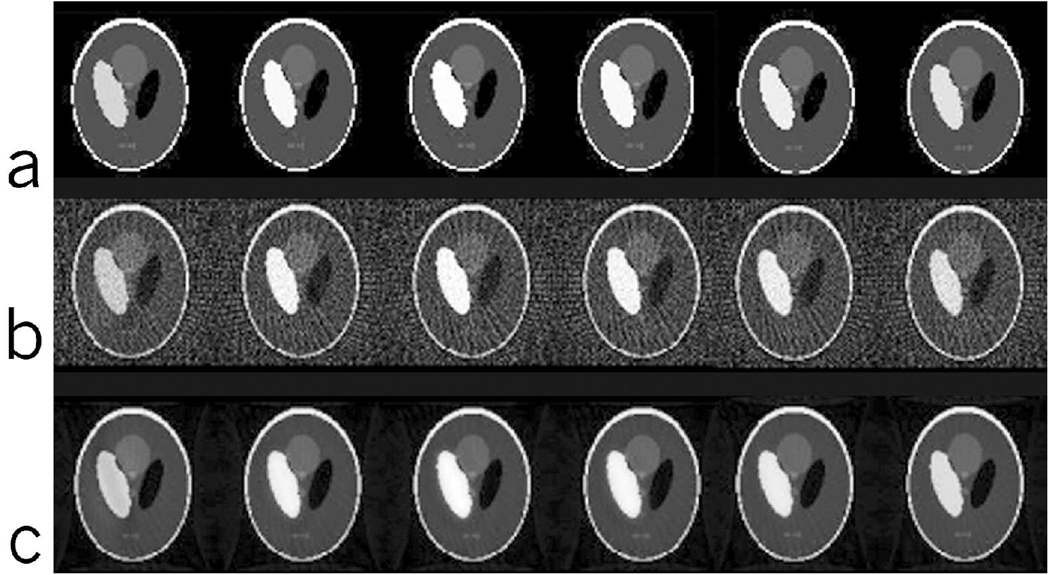
where, j is the time index of the k-space line acquired and N is the total number of k-space lines in the series. To most closely represent the signal evolution, variations were assumed to occur from one radial sample to another, but not during the sampling of each view. Data were reconstructed using the interleaved undersampled PR trajectories and the IRIS reconstruction technique as explained in the previous section. The data were simulated for a 128 × 128 image with a total 500 views (k-space lines), resulting in 500 images, of which 6 time-points are shown in Figure 6a. A single line of k-space was acquired from each of the 500 images with their distribution as explained in Figure 2 with 50 views for each image resulting in 10 images (of which only 6 are shown here) spread over the time of acquisition.
Fig 6.
(a) Dynamic Shepp-Logan simulation data at 6 uniformly spaced time-points out of the 500 views showing the modulation of the left ellipse by the wash-in/wash-out curve. (b) Dynamic Shepp-Logan reconstructed at 6 time-points using undersampled PR. Note the undersampling artifacts that are spread all over the image affecting all the regions. (c) Dynamic Shepp-Logan reconstructed at 6 time-points using IRIS. Note the reduction in artifacts as compared to the undersampled PR reconstruction using the same data shown in (b).
The results of reconstruction using the undersampled PR (Fig 6b) and IRIS (Fig 6c) show a clear reduction in the artifacts for IRIS reconstruction. The reduction of artifacts leads to an improvement in the overall SNR of the images. Although, we have not added any noise in the simulation, SNR is used as a metric because it is difficult to isolate artifact from noise in radial imaging and hence, suppression of artifacts does improve the SNR. The behavior of the time-intensity curves is similar in both the cases of reconstruction, while improving the SNR by a factor of 8 in the case of IRIS. We observed a minor drop in the overall signal at the peak of the curve and a minor signal rise at lower levels due to signal-averaging effects at higher frequencies.
3.3 IRIS — In Vivo
In vivo studies were performed in a second group of rats (N=6) to demonstrate the utility of combining multiple injections with IRIS. The performance was also compared to undersampled PR. The IRIS sampling pattern described in the method section using 4 injections each of 20 µl Gd-DTPA was carried out. Each injection was separated from the others by 15 seconds. 1600 radial samples, were acquired during each injection leading to 6400 radial views for the complete dataset. The 6400 views were binned into 16 equal time-points resulting in an acquisition temporal resolution of 400 ms, and spatial undersampling by a factor of 2.
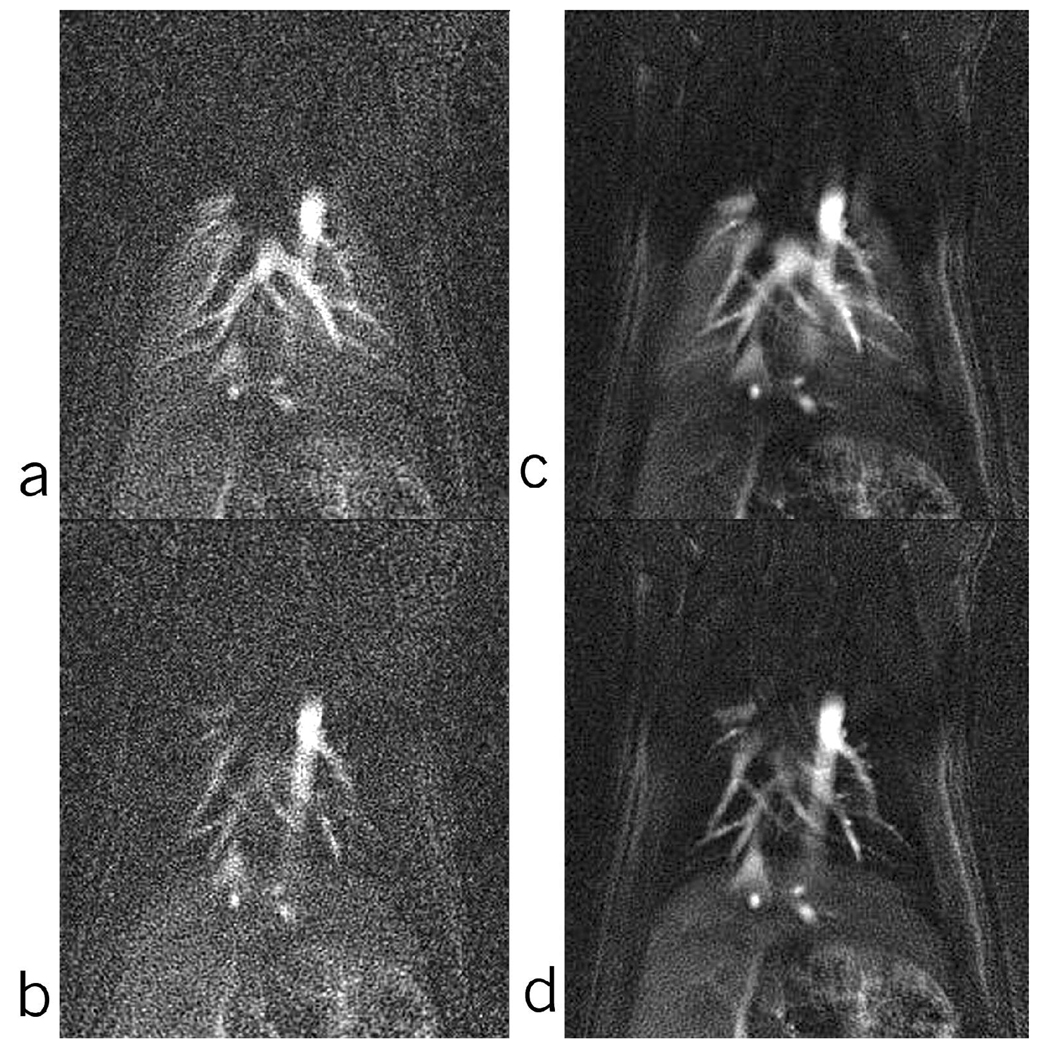
Undersampled PR reconstruction and IRIS reconstruction were carried out on the same dataset. The undersampled PR reconstruction was performed for 16 time-points, while the IRIS reconstruction was performed for 16 + 15 (intermediate) time-points at a temporal resolution of 200 ms. Comparative time-points from the two reconstructed sets at peak concentration and at end of wash-out in the lung parenchyma are shown in Figure 7. This figure shows an improvement of 2 in SNR in the lung parenchyma, while maintaining the temporal behavior and still improving the temporal resolution by a factor of 2.
Fig 7.
Comparison of similar time-points of the undersampled PR (a, b) (series of 16) and IRIS (c, d) (series of 31). Points (a) and (c) are at the peak of contrast bolus and points (b) and (d) are at the end of wash-out part of the curve.
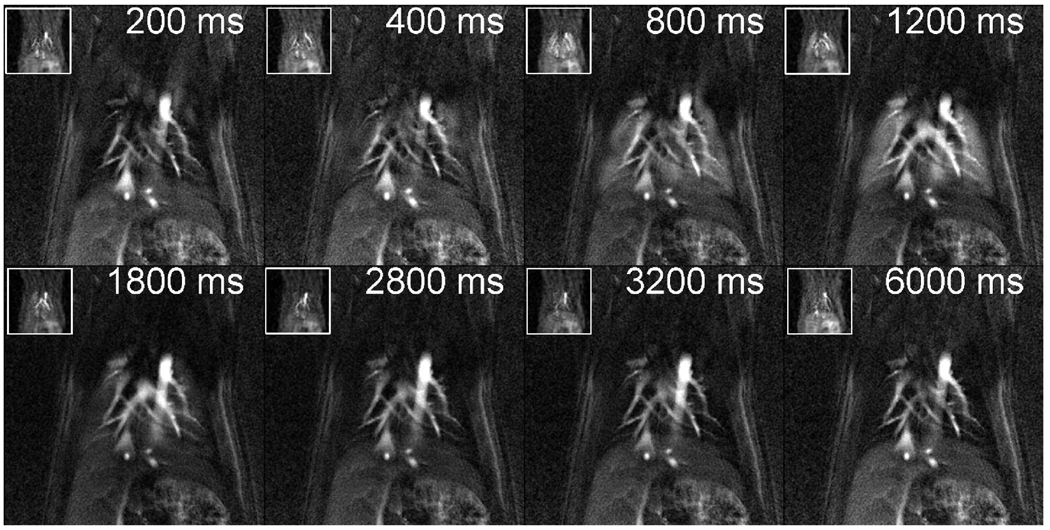
Images from the same animal were also acquired using the dynamic RA technique and compared with IRIS. To keep the same amount of undersampling, data were acquired using two 20 µl injections of Gd-DTPA with the TE/TR = 0.7/4 ms, BW = 62.5 kHz, flip angle 36°, FOV = 50 mm, slice thickness = 3mm, reconstructed at 642 grid resulting in a spatial resolution of ∼780 µm. 3200 radial views were acquired during the 2 injections and divided into 32 time-points resulting in a temporal resolution of 200 ms and an undersampling factor of 2 to be comparable to the IRIS reconstructed dataset. Figure 8 shows the 8 time-points from a series of 32 images acquired using the dynamic RA technique (inset) and the IRIS technique. The temporal resolution is nominally the same for both the dynamic RA and the IRIS data (200 ms). But the spatial resolution for the IRIS data is 16X greater and the SNR in the lung parenchyma (12.5 vs 8.0) for dynamic RA and IRIS respectively is only 1.56X less.
Fig 8.
Post-contrast injection scan in a rat lung, scanned using dynamic RA (inset) and IRIS in a rat lung. The dynamic RA images are acquired using two 20 µl injections of Gd-DTPA and reconstructed at a spatial resolution of ∼780 µm and a temporal resolution of 200 ms. IRIS images are reconstructed at a spatial resolution of ∼195 µm and a temporal resolution of 200 ms using four 20 µl injections of Gd-DTPA. The improvement in the spatial and the temporal resolution is achieved primarily by IRIS reconstruction. Only 8 images from a series of 31 are shown.
Dynamic first-pass curves are generated by placing regions of interest (ROIs) in the path of the cardio-pulmonary circulation, as listed in Figure 9a for the dynamic RA method and Figure 9b for the IRIS method for the same animal. The temporal characteristics of the time-intensity curves for healthy rats imaged using IRIS is similar to that imaged using the lower resolution dynamic RA method. Analysis performed on these 6 rats produced results (shown in Table 3) comparable to that shown in Table 2 on the same set of rats using dynamic RA method. The results show an increasing trend for the TA and the MTT, starting from the pulmonary artery all the way to the descending aorta, as expected in the cardio-pulmonary circuit.
Fig 9.
(a) Dynamic first-pass curves, scanned using dynamic RA, created by selecting regions of interest over various parts of the cardio-pulmonary circuit. (b) Dynamic first-pass curves, scanned for the same animal using IRIS, created by selecting regions of interest over various parts of the cardio-pulmonary circuit. The curves are comparable as far as their times to peak are concerned. The variability is attributed to the difficulty in selecting regions for the dynamic RA dataset due to its very coarse resolution.
Table 3.
Parameters extracted from rodent (N=6) lungs using IRIS. PA- pulmonary artery, LL - left lung, RL - right lung, PV - pulmonary vein, DA - descending aorta
| Time of Appearance (sec) | Mean Transit Time (sec) | |
|---|---|---|
| PA | 1.11 +/− 0.16 | 2.09 +/− 0.30 |
| LL | 1.17 +/− 0.12 | 1.74 +/− 0.15 |
| RL | 1.17 +/− 0.26 | 1.73 +/− 0.30 |
| PV | 1.74 +/− 0.22 | 2.39 +/− 0.21 |
| DA | 2.30 +/− 0.33 | 3.19 +/− 0.24 |
Table 2.
Parameters extracted from rodent (N=6) lungs using Dynamic RA. PA- pulmonary artery, LL - left lung, RL - right lung, PV - pulmonary vein, DA - descending aorta
| Time of Appearance (sec) | Mean Transit Time (sec) | |
|---|---|---|
| PA | 1.20 +/− 0.26 | 1.87 +/− 0.23 |
| LL | 1.27 +/− 0.27 | 2.02 +/− 0.26 |
| RL | 1.32 +/− 0.34 | 2.19 +/− 0.44 |
| PV | 1.82 +/− 0.14 | 2.50 +/− 0.38 |
| DA | 2.39 +/− 0.33 | 3.10 +/− 0.57 |
4. DISCUSSION
Obtaining quantitative perfusion in the rodent lungs is dependent on the ability to acquire images of contrast bolus through the cardiopulmonary circuit. As presented in this work, this in turn would depend on the ability to perform injections in a repeatable manner. This was made possible by the micro-injector that can deliver volumes down to ∼20 µl in 50 ms at every trigger, as shown in Table 1. Spatial or temporal resolution can be improved based on the number of injections. The time delay between two consecutive injections is ∼15 seconds and it is safe to assume that the bolus from the previous injection is completely disintegrated before the arrival of the next bolus as the rat heart beats ∼75 times during this period. Although one can safely combine multiple injections, there is an increase in the total load of Gd-DTPA with increasing number of injections. With the increasing dose of contrast agent, the signal intensity may become nonlinear (38), which can lead to unreliable perfusion estimates. Hence, the spatial and temporal resolutions need to be improved in ways other than increasing the number of contrast agent injections.
Figure 4 indicates that dynamic RA can yield low-resolution images that can be useful to perform quantitative analysis for lung perfusion. The advantage in improving the temporal resolution of the images is apparent in the graph shown in Figure 5a. The higher the temporal resolution of the scanning technique, the better are the chances of picking up subtle variations in the timings of contrast agent arrival time as these differences in rodents are as low as 600 ms (TA between pulmonary artery and pulmonary vein as shown by Figure 5a. The acquisition sequence is not cardiac-gated. Pulsatile signal variation can be seen from the curve for descending aorta. The advantage of not gating the sequence for every cardiac beat is the possibility of achieving much higher temporal resolution. However, this limits the selection of the imaging plane just behind the heart. For the lung perfusion where one wants to study the blood flow through the cardio-pulmonary circuit, this is not a limiting factor as most of the blood vessels that are involved in the circuit lie in this plane.
Results indicate that IRIS, by exploiting the redundancy in dynamic data, can improve the spatial and temporal resolution without increasing the amount of contrast agent. The concept of data redundancy has been explored before for radial imaging (26,29), however, the combination of multiple injections and a different view-ordering for the acquisition as shown in Figure 2, makes the imaging of pulmonary perfusion in rats feasible.
Simulations were carried out primarily to understand the improvement in the SNR by limiting the streaking artifact caused in the process of undersampling. As is clearly visible in Figure 6b, the artifacts caused by undersampling lead to the reduction in SNR (by 8X). By reconstructing the images using IRIS, one can suppress the artifacts and thereby improve the SNR. In vivo studies using the IRIS show significant improvement in the spatial and temporal resolution. This reconstruction method also suppresses artifacts caused by undersampling, while maintaining the temporal dynamics of the contrast agent. Figure 7 shows these characteristics clearly when compared to the undersampled PR reconstructed images at peak of the contrast dynamics in the lung parenchyma and also at end circulation.
Figure 8 shows the comparative images from in vivo dynamic RA and IRIS. The contrast dynamics are maintained, while significantly improving the resolution with very limited loss of SNR. To acquire data at a spatial resolution of ∼195 µm (2562) and temporal resolution of 200 ms using dynamic RA, would require 16 injections of Gd-DTPA as compared to the 4 injections required by IRIS. The values of time of appearance and mean transit time shown in Table 3 match well with a correlation value of 0.99 and 0.91 respectively, to the values shown in Table 2 for the same cohort of healthy rats using dynamic RA. The variability observed between the dynamic RA and IRIS methods for quantitative results on the same set of rats is attributed to the difficulty in selectingf small regions in the low resolution dynamic RA images. These circulation times lie within the range of values reported for isolated rat lungs (39).
The studies performed so far indicate that most contrast information is contained in the lower frequencies. However, this assumption might not be true in certain conditions where a better technique that models the dynamic system could provide a better solution. Other techniques that model the contrast uptake are being currently investigated. Efficient reconstruction techniques and dedicated parallel acquisition setup for reduced data encoding can be used to further reduce the total number of injections and better describe the perfusion process.
Care must be taken to limit the amount of contrast agent that is being given to the animal per scan. Ideally a series of small injections that limit the total dose to 0.2 mmol/kg would be desirable. We assume an average weight for rats of 200 g, and the concentration of Gd-DTPA in Magnevist® is 0.5 mmol/ml. With a dose of 0.05 mmol/kg, the volume of contrast agent required would be 20 µl. If we use 4 such injections, the total dose of Gd-DTPA given to the animal would be 0.2 mmol/kg. This is equivalent to 0.66% of the blood volume (40).
One of the main problems associated with using MRI for the estimation of perfusion is that, unlike other techniques where signal enhancement is directly proportional to the amount of contrast agent injected, in MRI the effect of the contrast agent is to change the relaxation times T1 and T2. There is a linear dependence of the change in relaxation times to the concentration of contrast agents in a certain range. The linearity of the Gd-DTPA under our operating conditions for various concentrations was tested. A phantom was designed with multiple tubes with varying concentration (0 mM to 4 mM) of contrast agent concentration mixed with saline and to plot relaxivity (1/T1) versus the contrast agent concentration. A linear relationship between 1/T1 and contrast agent concentration was observed for concentrations from 0 mM to 4 mM. The dose used in our studies was 0.2 mM.
5. CONCLUSION
Quantitative pulmonary perfusion imaging in small animals is feasible with multiple repeatable contrast injections. Higher spatial and higher temporal resolution can be achieved by using an efficient k-space acquisition and reconstruction technique such as IRIS presented in this work. The temporal dynamics of a single pass transit following cardiac inflow through the pulmonary system have been effectively demonstrated in live rats using IRIS. The technique developed in this work for pulmonary function imaging has been limited to healthy rats. Studies have commenced to validate the method in a number of altered physiologic states.
Acknowledgements
Work was performed at the Duke Center for In Vivo Microscopy, an NIH/NCRR National Biomedical Technology Resource Center (P41 RR005959) with additional support from NCI (R24 CA092656). The authors would also like to thank Dr. Laurence W. Hedlund and Mr. Ming De Lin for helpful discussions on pulmonary physiology and the micro-injector design.
List of Symbols
- 3He
Superscript (3) Uppercase “H”, lowercase “ee”
- 15O
Superscript (15) Uppercase “Oh”
- T2*
Uppercase “Tee”, subscript (2), superscript (Star)
- N2
Uppercase “N”, subscript (2)
- ºC
degrees, Uppercase C
- Δϕ
Greek upper case delta of “phi”
- Δθ
Greek upper case delta of “theta”
- Nr
Italic Uppercase “N”, Italic subscript lowercase “r”
- π
Lowercase “Pi”
- C(t)
Uppercase Italic “C”, Italic Lowercase “tee” inside brackets
- Cp
Uppercase Italic “C”, Italic subscript lowercase “pee”
- α
Greek “alpha”
- β
Greek “Beta”
- µm
Lowercase Greek “mu”,lowercase “m”
- µl
Lowercase Greek “mu”, lowercase “ell”
- µs
Lowercase Greek “mu”, lowercase “s”
- ms
Lowercase “m”, lowercase “s”
- 40°
Angle degress (example – 40 degrees)
- 2562
Number, superscript (2) (example –256 superscript (2))
- mM
Lowercase m, Uppercase M
REFERENCES
- 1.West JB. Respiratory physiology -the essentials- In: Coryell PA, editor. 5th ed. Baltimore: Williams & Wilkins; 1995. p. 193. [Google Scholar]
- 2.Pauluhn J. Brown Norway rat asthma model of diphenylmethane 4,4’-diisocyanate. Inhal Toxicol. 2005;17(13):729–739. doi: 10.1080/08958370500224631. [DOI] [PubMed] [Google Scholar]
- 3.Birrell MA, Wong S, Hele DJ, McCluskie K, Hardaker E, Belvisi MG. Steroid-resistant inflammation in a rat model of chronic obstructive pulmonary disease is associated with a lack of nuclear factor-kappaB pathway activation. Am J Respir Crit Care Med. 2005;172(1):74–84. doi: 10.1164/rccm.200409-1257OC. [DOI] [PubMed] [Google Scholar]
- 4.Geraci MW, Gao B, C SD, Moore MD, Westcott JY, Fagan KA, Alger LA, Tuder RM, Voelkel NF. Pulmonary prostacyclin synthase overexpression in transgenic mice protects against development of hypoxic pulmonary hypertension. J Clin Invest. 1999;103(11):1509–1515. doi: 10.1172/JCI5911. [DOI] [PMC free article] [PubMed] [Google Scholar]
- 5.Yaghi A, Bradbury JA, Zeldin DC, Mehta S, Bend JR, McCormack DG. Pulmonary cytochrome P-450 2J4 is reduced in rat model of acute Pseudomonas pneumonia. Am J Physiol Lung Cell Mol Phsiol. 2003;285(5):L1099–L1105. doi: 10.1152/ajplung.00039.2003. [DOI] [PubMed] [Google Scholar]
- 6.Chung WH, Bennett BM, Racz WJ, Brien JF, Massey TE. Induction of c-jun and TGF-beta 1 in Fischer 344 rats during amiodarone-induced pulmonary fibrosis. Am J Physiol Lung Cell Mol Phsiol. 2001;281(5):L1180–L1188. doi: 10.1152/ajplung.2001.281.5.L1180. [DOI] [PubMed] [Google Scholar]
- 7.Schuster DP, Kovacs A, Garbow J, Piwnica-Worms D. Recent advances in imaging the lungs of intact small animals. Am J Respir Cell Mol Biol. 2004;30:129–138. doi: 10.1165/rcmb.2003-0213TR. [DOI] [PubMed] [Google Scholar]
- 8.Balogh L, Andoncs G, Thuroczy J, Nemeth T, Lang J, Bodoi K, Janoki GA. Veterinary nuclear medicine. Scintigraphical examinations - a review. ACTA VET BRNO. 1999;68:231–239. [Google Scholar]
- 9.Ebert M, GroBmann T, Heil W, Otten WE, Surkau R, Leduc M, Bachert P, Knopp MV, Schad LR. Nuclear magnetic resonance imaging on humans using hyperpolarized 3He. Lancet. 1996;347:1297–1299. doi: 10.1016/s0140-6736(96)90940-x. [DOI] [PubMed] [Google Scholar]
- 10.MacFall JR, Charles HC, Black RD, Middleton H, Swartz JC, Saam B, Driehuys B, Erickson CJ, Happer W, Cates GD, Johnson GA, Ravin CE. Human lung air spaces: potential for MR imaging with hyperpolarized He-3. Radiology. 1996;200:553–558. doi: 10.1148/radiology.200.2.8685356. [DOI] [PubMed] [Google Scholar]
- 11.Mai VM, Liu B, Polzin JA, Li W, Kurucay S, Bankier AA, Knight-Scott J, Madhav P, Edelman R, Chen Q. Ventilation-perfusion ratio of signal intensity in human lung using oxygen-enhanced and arterial spin labeling techniques. Magnetic Resonance in Medicine. 2002;48:341–350. doi: 10.1002/mrm.10230. [DOI] [PubMed] [Google Scholar]
- 12.Black RD, Middleton H, Cates GD, Cofer GP, Driehuys B, Happer W, Hedlund LW, Johnson GA, Shattuck MD, Swartz J. In-vivo He-3 MR images of guinea pig lungs. Radiology. 1996;199:867–870. doi: 10.1148/radiology.199.3.8638019. [DOI] [PubMed] [Google Scholar]
- 13.Johnson GA, Cofer GP, Hedlund LW, Maronpot RR, Suddarth SA. Registered 1H and 3He magnetic resonance microscopy of the lung. Magnetic Resonance in Medicine. 2001;45:365–370. doi: 10.1002/1522-2594(200103)45:3<365::aid-mrm1047>3.0.co;2-0. [DOI] [PubMed] [Google Scholar]
- 14.Hatabu H, Tadamura E, Levin DL, Chen Q, Li W, Kim D, Prasad PV, Edelman R. Quantitative assessment of pulmonary perfusion with dynamic contrast-enhanced MRI. Magnetic Resonance in Medicine. 1999;42:1033–1038. doi: 10.1002/(sici)1522-2594(199912)42:6<1033::aid-mrm7>3.0.co;2-7. [DOI] [PubMed] [Google Scholar]
- 15.Ogasawara N, Suga K, Karino Y, Matsunaga N. Perfusion characteristics of radiation-injured lung on Gd-DTPA-enhanced dynamic magnetic resonance imaging. Investigative Radiology. 2002;37(8):448–457. doi: 10.1097/00004424-200208000-00006. [DOI] [PubMed] [Google Scholar]
- 16.Zheng J, Leawoods JC, Nolte M, Yablonskiy DA, Woodard PK, Laub G, Gropler RJ, Conradi MS. Combined MR proton lung perfusion/angiography and helium ventilation: potential for detecting pulmonary emboli and ventilation defects. Magnetic Resonance in Medicine. 2002;47:433–438. doi: 10.1002/mrm.10091. [DOI] [PMC free article] [PubMed] [Google Scholar]
- 17.Berthezene Y, Vexler V, Clement O, Muhler A, Moseley ME, Brasch RC. Contrast-enhanced MR imaging of the lung: assessments of ventilation and perfusion. Radiology. 1992;183:667–672. doi: 10.1148/radiology.183.3.1584916. [DOI] [PubMed] [Google Scholar]
- 18.Cremillieux Y, Berthezene Y, Humblot H, Viallon M, Canet E, Bourgeois M, Albert T, Heil W, Briguet A. A combined 1H perfusion/3He ventilation NMR study in rat lungs. Magnetic Resonance in Medicine. 1999;41:645–648. doi: 10.1002/(sici)1522-2594(199904)41:4<645::aid-mrm1>3.0.co;2-v. [DOI] [PubMed] [Google Scholar]
- 19.Peters DC, Korosec FR, Grist TM, Block WF, Holden JE, Vigen KK, Mistretta CA. Undersampled projection reconstruction applied to MR angiography. Magnetic Resonance in Medicine. 2000;43:91–101. doi: 10.1002/(sici)1522-2594(200001)43:1<91::aid-mrm11>3.0.co;2-4. [DOI] [PubMed] [Google Scholar]
- 20.Vigen KK, Peters DC, Grist TM, Block WF, Mistretta CA. Undersampled projection-reconstruction imaging for time resolved contrast-enhanced imaging. Magnetic Resonance in Medicine. 2000;43:170–176. doi: 10.1002/(sici)1522-2594(200002)43:2<170::aid-mrm2>3.0.co;2-p. [DOI] [PubMed] [Google Scholar]
- 21.Jones RA, Haraldseth O, Muller TB, Rinck PA, Oksendal AN. K-space substitution: a novel dynamic imaging technique. Magnetic Resonance in Medicine. 1993;29(6):830–834. doi: 10.1002/mrm.1910290618. [DOI] [PubMed] [Google Scholar]
- 22.van Vaals JJ, Brummer ME, Dixon WT, Tuithof HH, Engels H, Nelson RC, Gerety BM, Chezmar JL, den Boer JA. “Keyhole” method for accelerating imaging of contrast agent uptake. J Magnetic Resonance Imaging. 1993;3(4):671–675. doi: 10.1002/jmri.1880030419. [DOI] [PubMed] [Google Scholar]
- 23.Korosec FR, Frayne R, Grist TM, Mistretta CA. Time-resolved contrast enhanced 3D MR angiography. Magnetic Resonance in Medicine. 1996;36:345–351. doi: 10.1002/mrm.1910360304. [DOI] [PubMed] [Google Scholar]
- 24.Parrish T, Hu X. Continuous update with random encoding (CURE): a new strategy for dynamic imaging. Magnetic Resonance in Medicine. 1995;33:326–336. doi: 10.1002/mrm.1910330307. [DOI] [PubMed] [Google Scholar]
- 25.Oesterle C, Strohschein R, Kohler M, Schnell M, Hennig J. Benefits and pitfalls of keyhole imaging, especially in first-pass perfusion studies. J Magnetic Resonance Imaging. 2000;11:312–323. doi: 10.1002/(sici)1522-2586(200003)11:3<312::aid-jmri10>3.0.co;2-k. [DOI] [PubMed] [Google Scholar]
- 26.Lethmate R, Ratiney H, Wajer FT, Cremillieux Y, van Ormondt D, Graveron-Demilly D. Dynamic magnetic resonance imaging with radial scanning: a post-acquisition keyhole approach. MAGMA. 2003;16:21–28. doi: 10.1007/s10334-003-0003-y. [DOI] [PubMed] [Google Scholar]
- 27.Rasche V, de Boer RW, Holz D, Proksa R. Continuous radial data acquisition for dynamic MRI. Magnetic Resonance in Medicine. 1995;34:754–761. doi: 10.1002/mrm.1910340515. [DOI] [PubMed] [Google Scholar]
- 28.Song HK, Dougherty L. k-Space weighted image contrast (KWIC) for contrast manipulation in projection reconstruction MRI. Magnetic Resonance in Medicine. 2000;44:825–832. doi: 10.1002/1522-2594(200012)44:6<825::aid-mrm2>3.0.co;2-d. [DOI] [PubMed] [Google Scholar]
- 29.Song HK, Dougherty L. Dynamic MRI with projection reconstruction and KWIC processing for simultaneous high spatial and temporal resolution. Magnetic Resonance in Medicine. 2004;52:815–824. doi: 10.1002/mrm.20237. [DOI] [PubMed] [Google Scholar]
- 30.Song HK, Dougherty L, Schnall MD. Simultaneous acquisition of multiple resolution images for dynamic contrast enhanced imaging of the breast. Magnetic Resonance in Medicine. 2001;46:503–509. doi: 10.1002/mrm.1220. [DOI] [PubMed] [Google Scholar]
- 31.Shankaranarayanan A, Wendt M, Aschoff AJ, Lewin JS, Duerk JL. Radial keyhole sequences for low field projection reconstruction interventional MRI. J Magnetic Resonance Imaging. 2001;13:142–151. doi: 10.1002/1522-2586(200101)13:1<142::aid-jmri1022>3.0.co;2-g. [DOI] [PubMed] [Google Scholar]
- 32.Lin M, Badea CT, Johnson GA. Orlando, FL: Academy of Molecular Imaging; 2005. Functional Cardio-Pulmonary Imaging of the Rodent using micro Radiography. [Google Scholar]
- 33.O’Sullivan JD. A fast sinc function gridding algorithm for Fourier inversion in computer tomography. IEEE Trans Med Imag. 1985;4:200–207. doi: 10.1109/TMI.1985.4307723. [DOI] [PubMed] [Google Scholar]
- 34.Pipe JG, Menon P. Sampling density compensation in MRI:rational and an iterative numerical solution. Magnetic Resonance in Medicine. 1999;41:179–186. doi: 10.1002/(sici)1522-2594(199901)41:1<179::aid-mrm25>3.0.co;2-v. [DOI] [PubMed] [Google Scholar]
- 35.Riederer SJ, Tasciyan T, Farzaneh F, Lee JN, Wright RC, Herfkens RJ. MR fluoroscopy: technical feasibility. Magnetic Resonance in Medicine. 1988;8:1–15. doi: 10.1002/mrm.1910080102. [DOI] [PubMed] [Google Scholar]
- 36.Davenport R. The derivation of the gamma-variate relationship for tracer dilution curves. J Nucl Med. 1983;24(10):945–948. [PubMed] [Google Scholar]
- 37.Thompson HKJ, Starmer C, Frank Whalen, Robert E, McIntosh, Henry D. Indicator transit time considered as a gamma variate. Circ Res. 1964;14:502–515. doi: 10.1161/01.res.14.6.502. [DOI] [PubMed] [Google Scholar]
- 38.Morkenborg J, Pedersen M, Jensen FT, Stodkilde-Jorgensen H, Djurhuus JC, Frokiaer J. Quantitative assessment of Gd-DTPA contrast agent from signal enhancement: an in-vitro study. Magnetic Resonance Imaging. 2003;21:637–643. doi: 10.1016/s0730-725x(03)00096-1. [DOI] [PubMed] [Google Scholar]
- 39.Presson RG, Jr, Todoran TM, De Witt BJ, McMurtry IF, Wagner WW., Jr Capillary recruitment and transit time in the rat lung. J Applied Physiology. 1997;83:543–549. doi: 10.1152/jappl.1997.83.2.543. [DOI] [PubMed] [Google Scholar]
- 40.Lee HB, Blaufox MD. Blood volume in the rat. J Nucl Med. 1985;26(1):72–76. [PubMed] [Google Scholar]


