

Abstract
An effective method was developed for isolation and analysis of bovine heart Complex I subunits. The method utilizes C18 reversed-phase HPLC and a water:acetonitrile gradient containing 0.1% trifluoroacetic acid. Employing this system, 36 of the 45 Complex I subunits elute in 28 distinct chromatographic peaks. Nine subunits do not elute including B14.7, MLRQ and the seven mitochondrial-encoded subunits. The method, with UV detection, is suitable for either analytical (< 50 µg protein) or preparative (>250 µg protein) applications. Subunit(s) eluting in each chromatographic peak were initially determined by MALDI-TOF/MS with subsequent positive identification by reversed-phase HPLC-ESI/MS/MS analysis of tryptic digests. In the latter case, subunits were identified with a 99% probability using Scaffold analysis software combined with a X! Tandem protein search engine. The RP-HPLC subunit analysis method represents a major improvement over previous separation methods with respect to resolution, simplicity and ease of application.
Keywords: NADH dehydrogenase, Subunit Analysis, Mitochondrial Electron Transport Complexes, Liquid Chromatography, MALDI/TOF, ESI/MS/MS
INTRODUCTION
NADH-dehydrogenase ubiquinol-oxidoreductase (Complex I; E.C. 1.6.5.3) is the largest, most complex, and least understood multi-subunit enzyme of the electron transport chain system of bacteria and mitochondria. The enzyme catalyzes electron transfer from NADH to ubiquinone and couples this to the translocation of protons across the inner mitochondrial membrane [1,2]. The mammalian enzyme is composed of 45 non-identical subunits [3], a non-covalently bound flavin mononucleotide (FMN), and eight iron-sulfur clusters, with a combined molecular mass of ~980 kDa [1,4]. Seven subunits are encoded by mitochondrial DNA and the remaining subunits are nuclearly-encoded [5,6].
Subunit analysis of Complex I is difficult by conventional methodologies because of its high degree of complexity. Two approaches have been used to resolve the subunits: 1) two-dimensional resolution of subunits by isoelectric focusing combined with SDS-PAGE (high and low pH isoelectric focusing is required to resolve all subunits [7]); and 2) fractionation of the enzyme into three major sub-complexes (Iα, Iβ and Iγ) followed by RP-HPLC and mass spectrometry [8]. In each case, subunit identifications have been based upon either N-terminal amino acid sequencing of the purified subunits, or mass spectrometry analysis of tryptic peptides [8,9,10]. However, each experimental approach involves several procedures and provides only a qualitative assessment of the subunit content.
Interest in the individual subunits of Complex I has recently increased because chemical modification of individual subunits has been linked to important biological processes. Examples include: 1) pathological states initiated by reactive oxygen species (ROS), e.g., Parkinson’s disease [11], cardiac ischemia and reperfusion injury [12], and Alzheimer’s disease [13]; and 2) phosphorylation sites implicated in regulation of Complex I function [14,15,16,17,18,19]. As studies focus on individual Complex I subunits, an analytical method for their separation and analysis is required. Our laboratory previously developed RP-HPLC methods for resolving all but the most hydrophobic, mitochondrially-encoded subunits of bovine heart cytochrome c oxidase [[20,21] and cytochrome bc1 22]. Combined with mass spectrometry analysis of the resolved subunits, we have used this methodology to detect and quantify ROS-induced damage at selective sites within cytochrome c oxidase [23,24]. Although the subunit content of the two complexes is much less complicated than Complex I, the polarity, hydrophobicity, and mass range are similar, suggesting that subunit analysis of Complex I by RP-HPLC is feasible.
MATERIALS AND METHODS
Materials
Reagents and their sources were as follows: dodecyl maltoside (Anatrace, Inc); bicinchoninic acid (BCA)1 assay reagents (Pierce Biotechnology); phenylmethanesulphonylfluoride (USB Corporation); nicotinamide adenine dinucleotide (NADH) and ubiquinone-1 (Sigma-Aldrich Co); sequencing grade bovine pancreatic trypsin (Promega Corp.). Ultracell YM-10, regenerated cellulose centrifugal filters (10,000 MWCO), were purchased from Millipore; the C18 High Performance RP-HPLC column (300 Å, 4.6 mm × 250 mm, 10 µm) from Vydac; and the High Performance Q-Sepharose column (24.5 × 0.9 cm) from Amersham Biosciences. All other chemicals were of analytical grade.
Isolation of Complex I from bovine heart
Complex I was isolated from bovine heart mitochondria according to the procedure of Sazanov et al. [8] with minor modifications. Mitochondrial membranes were suspended to a final protein concentration of 12 mg/mL (determined by the Biuret method), in 20 mM TrisCl buffer, pH 7.4, containing 1 mM EDTA, 10% v/v glycerol, 300 µM PMSF, and 9.5 mg/mL dodecyl maltoside. The suspension was placed on ice and stirred for 30 min. followed by centrifugation for 30 min. at 30000 × g. The resulting supernatant, containing dodecyl maltoside-solubilized proteins, was applied to a High Performance Q-Sepharose column (24.5 × 0.9 cm) that had been equilibrated with 20 mM TrisCl buffer, pH 7.4, containing 1 mM EDTA, 10% ethylene glycol, and 2 mM dodecyl maltoside, at a flow rate of 0.5 mL/min. Bound proteins were eluted from the column in the same buffer at 0.5 mL/min. as follows: 1) linear gradient from 0 to 250 mM NaCl in 40 min.; 2) isocratic elution with buffer containing 250 mM NaCl for 140 min.; 3) elution of Complex I with a linear gradient from 250 to 350 mM NaCl in 80 min. Eluant containing the enzyme was collected and the protein concentrated by ultracentrifugation in a Beckman 50Ti rotor, at 165,480 × g, at 4 °C. The resulting pellets, containing Complex I, were resuspended in 20 mM TrisCl buffer, pH 7.4, containing 1 mM EDTA, 10% ethylene glycol, 2 mM dodecyl maltoside, and 125 mM NaCl, and re-chromatographed on the Q-Sepharose High Performance column using the same gradient elution conditions. Once again, Complex I was concentrated by ultracentrifugation, and the pellets were re-solubilized in 20 mM TrisCl buffer, pH 7.4, containing 1 mM EDTA, 10% ethylene glycol, 2 mM dodecyl maltoside, and 350 mM NaCl. The protein concentration was determined by BCA assay using bovine serum albumin as a standard. The enzyme was stored in 0.5 mg aliquots at −80 °C.
Molecular activity assay
The NADH:ubiquinone oxido-reductase activity of Complex I was determined spectrophotometrically by following the oxidation of NADH at 340 nm, using ε340 = 6.22 mM−1 cm−1 [25]. The reaction was initiated by adding 12 µM NADH to 3.6 nM Complex I (solubilized in 50 mM Tris-acetate buffer, pH 7.8, containing 2 mM dodecyl maltoside and 100 µM ubiquinone-1. The NADH:ubiquinone1 activity of purified Complex I was 9–11 (mol NADH ) (mol Complex I)−1 (sec.)−1.
Resolution of subunits by RP-HPLC
Isolated Complex I (250 µg in 160 µL) was dialyzed against 50 mM Tris-acetate buffer (pH 7.8, containing 350 mM NaCl and 0.2 mM dodecyl maltoside) to remove ethylene glycol, and trifluoroacetic acid (TFA) was added to a final concentration of 0.1%. After 5 min. at RT in 0.1% TFA, the sample was applied at 1.0 mL/min to a C18 RP-HPLC column (300 Å, 4.6 mm × 250 mm, 10 µm). The HPLC system (Waters), controlled by a Waters System Interface Module using Millennium32 software (Version 3.20, ©1999 Waters Corporation), consisted of two 501 HPLC pumps, a manual injector with a 2 mL loop, a Vydac C18 High Performance guard column, the Vydac C18 column, and a Waters photodiode array detector. The mobile phases consisted of water containing 0.1% TFA (solvent A), and acetonitrile containing 0.1% TFA (solvent B). The following gradient was applied at a flow rate of 1.0 mL/min.: linear gradient from 0% to 25% B in 5 min.; linear gradient from 25% to 30% B in 5 min.; linear gradient from 30% to 55% B in 95 min.; isocratic elution with 55% B for 5 min.; linear gradient from 55% to 100% B in 36 min.; isocratic elution with 100% B for 5 min.; linear gradient from 100% to 100% A in 6 min.; isocratic elution with 100% buffer A for 30 min. to re-equilibrate column for the next injection. Elution of the protein was monitored at 214 nm, and elution fractions were collected at 1 min. intervals.
MALDI/TOF-MS of RP-HPLC-purified subunits
Each 1 mL RP-HPLC fraction was made 0.8 mM in dodecyl maltoside, reduced to ~50 µL by vacuum centrifugation at 65 °C (Speed Vac) and 1 µL of the concentrated sample was spotted on the MALDI target plate. After partial drying, 1 µL of a saturated solution of sinapinic acid in 50% acetonitrile containing 0.1 % TFA was added to the applied Complex I and dried at RT under a gentle stream of air. MALDI/TOF mass spectra for each fraction were acquired on an Applied Biosystems Voyager-DE STR in reflectron mode, by averaging the results of 100 laser shots. Mass assignments were made by the “close external calibration” method, using insulin, thioredoxin, apomyoglobin, and enolase as references. Noise reduction and smoothing algorithms were applied to each spectrum.
HPLC-ESI-MS/MS analysis of tryptic-digests of RP-HPLC fractions
Each 1 mL sample was concentrated to ~50 µL by vacuum centrifugation at 65 °C, adjusted to ~200 µL with 50 mM NH4HCO3 containing 80% acetonitrile, and digested with trypsin (0.5 µg) at 37 °C for 4 h. The resulting digests were completely dried by vacuum centrifugation, dissolved in 10–15 µL of 0.1% TFA, and 5 µL analyzed by capillary HPLC-electrospray ionization tandem mass spectrometry (HPLC-ESI-MS/MS). Spectra were acquired on a Thermo Fisher LTQ linear ion trap mass spectrometer fitted with a New Objective PicoView 550 nanospray interface. On-line HPLC separation of the peptides was accomplished with an Eksigent nanoLC micro HPLC: column, PicoFrit™ (New Objective; 75 µm i.d.) packed to 10 cm with C18 adsorbent (Vydac; 218MS 5 µm, 300 Å). The mobile phase consisted of: 0.5% acetic acid containing 0.005% TFA (solvent A); and 90% acetonitrile containing 0.5% acetic acid and 0.005% TFA (solvent B). The elution gradient was from 2% to 42% B in 30 min., at a flow rate of 0.4 µL/min. The mass spectrometer settings were: ESI voltage, 2.9 kV; isolation window for MS/MS, 3; relative collision energy, 35%. A survey scan of the peptides mass spectra with intensities above a set threshold was used to select the seven most intense ions, of which collision-induced dissociation (CID) spectra were collected.
Interpretation of tandem MS data
Experimental mass values obtained by tandem mass spectrometry of the tryptic peptides were searched, by means of Mascot (Matrix Science), against mass values calculated for predicted peptides and peptide fragments using sequence data in the Swiss-Prot database. The resulting matches were cross-correlated with X! Tandem, and probabilities of protein and peptide identification were assessed by Scaffold. This software has the capability to combine results from different engine searches, and thus increase the number of identified peptide sequences and, therefore, the probability of a correct identification. Scaffold™ further evaluated the tandem MS data by combining the Mascot search results with those produced by the X! Tandem search engine (The Global Proteome Machine Organization), which is part of the Scaffold™ software package. Oxidation of tryptophan, histidine and methionine were considered as possible variable modifications for all searches.
RESULTS
Separation of Complex I subunits by RP-HPLC
The subunits of Complex I were separated by reversed-phase HPLC using water:acetonitrile gradient elution after denaturing the dodecyl maltoside-solubilized enzyme with 0.1% TFA. Initially, a two-step linear gradient from 33% to 55% acetonitrile over 50 min., followed by isocratic elution at 55% for 5 min. and then a linear gradient from 55% to 100% acetonitrile for 18 min. was utilized. This elution gradient separated the subunits into 26 chromatographic peaks. Subunit resolution by this gradient system was incomplete, and only 15 subunits could be identified by MS analysis, all nuclearly-encoded. Modification of the gradient greatly improved the resolution. Decreasing the rate of the gradient between 33% and 55% produced 28 well-resolved peaks, permitting identification of 21 additional subunits by MS analysis. With these modifications, 36 of the 45 Complex I subunits eluted in 28 well-resolved chromatographic peaks (Figure 1 and Table 1).
Figure 1.
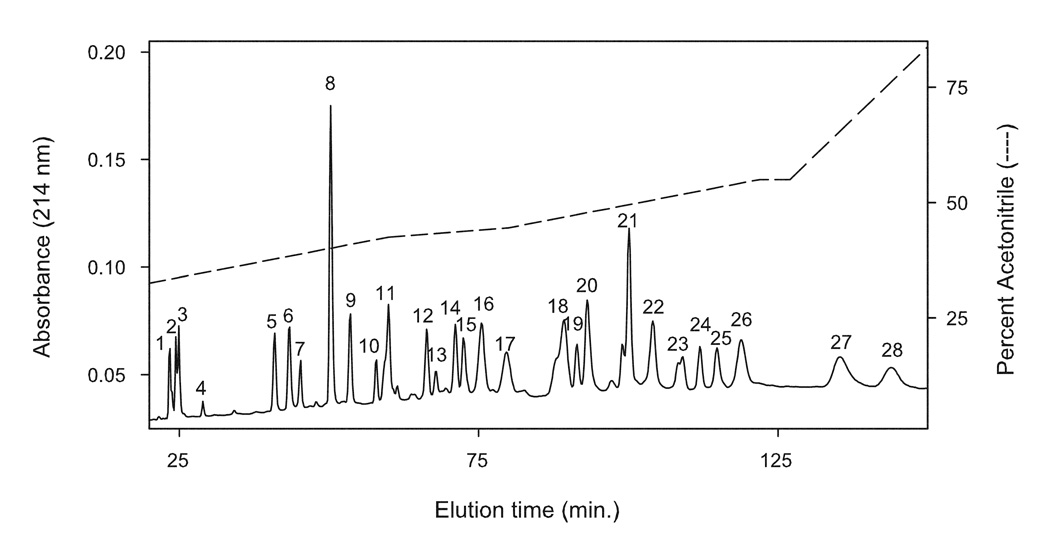
RP-HPLC elution profile of bovine heart Complex I. Complex I (250 µg) was incubated in 0.1% TFA for 5 min. at RT, and injected onto a C-18 Vydac column (300 Å, 4.6 mm × 250 mm, 10 µm). Subunits were eluted using a complex gradient made from solvent A (H2O containing 0.1% TFA) and solvent B (CH3CN containing 0.1% TFA). Elution gradient (dashed line) consisted of: 1) linear gradient from 0% to 30% B in 10 min.; 2) linear gradient from 30% to 42.5% B in 50 min.; 3) linear gradient from 42.5% to 44.5% B in 20 min.; 4) linear gradient from 44.5% to 55% B in 42 min.;5) isocratic elution with 55% B for 5 min.; 6) linear gradient from 55% to 100% B in 36 min.; 7) isocratic elution with 100% B for 5 min.; 8) linear gradient from 100% B to 100% A in 6 min.; and 9) isocratic elution with 100% buffer A for 30 min. to re-equilibrate column for next injection. Elution conditions were 1.0 mL/min. with detection at 214 nm.
Table 1.
Identification and Assignment of Complex I Subunits Isolated by RP-HPLC
| Scaffold Analysis of HPLC-ESI/MS/MS | ||||||
|---|---|---|---|---|---|---|
| Elution Peak No. | Subunit | MW (kDa) | Identified by MALDI/TOF | No. Peptides Identified by ESI/MS/MS | Percent Sequence Coveragec | |
| Mascot search | Mascot & X!Tandem | |||||
| 1 | 13 kDa-A | 10.5 | + | 42 | 72 | 45 |
| 2 | 9 kDa | 8.4 | + | 53 | 132 | 63 |
| 3 | 15 kDa | 12.5 | + | 95 | 153 | 63 |
| 4 | B14.5a | 12.6 | 55 | 133 | 81 | |
| 5 | B14.5a | 12.6 | 52 | 131 | 81 | |
| 6 | 18 kDa | 15.3 | 134 | 222 | 56 | |
| 7 | B8 | 11 | 21 | 34 | 63 | |
| 8 | PGIV(19 kDa) | 20 | + | 14 | 22 | 33 |
| 8 | B22 | 21.7 | + | 8 | 17 | 31 |
| 9 | B14 | 15 | + | 107 | 146 | 94 |
| 10 | MNLL | 7 | 32 | 38 | 65 | |
| 10 | B18 | 16.5 | 33 | 55 | 52 | |
| 11 | B15 | 15.1 | 36 | 46 | 56 | |
| 12 | B17.2 | 17.1 | + | 59 | 97 | 86 |
| 14 | MWFE | 8.1 | -- | 4 | 24 | |
| 14 | 24 kDa | 23.8 | + | 119 | 178 | 53 |
| 15 | 13 kDa-B | 13.2 | 57 | 80 | 91 | |
| 15 | 42 kDa | 36.7 | 1 | 4 | 4 | |
| 16 | KFYI | 5.8 | + | -- | 11 | 37 |
| 16 | TYKY (23 kDa) | 20.2 | 56 | 105 | 59 | |
| 16 | AGGG | 8.5 | + | 24 | 51 | 75 |
| 17 | PDSW | 20.8 | 10 | 25 | 53 | |
| 18 | PSST (20 kDa) | 20.1 | 5 | 17 | 20 | |
| 18 | B12 | 11.1 | + | 8 | 12 | 37 |
| 18 | B17 | 15.4 | + | 62 | 12 | 28 |
| 19 | B16.6 | 16.6 | 11 | 23 | 44 | |
| 20 | 30 kDa | 26.4 | + | 37 | 87 | 69 |
| 21 | 39 kDa | 39.1 | 69 | -- | 55 | |
| 21 | SDAP | 10.7 | 2 | 4 | 15 | |
| 22 | SDAP | 10.7 | 0 | 4 | 15 | |
| 22 | 75 kDa | 77 | 31 | 63 | 42 | |
| 22 | ASHI | 18.7 | 5 | 36 | 30 | |
| 23 | B14.5b | 14.1 | + | 50 | 84 | 70 |
| 24 | B9 | 9.3 | + | 9 | 19 | 58 |
| 25 | ESSS | 14.5 | 55 | 65 | 41 | |
| 26 | 51 kDa | 48.5 | 80 | 163 | 44 | |
| 27 | 49 kDa | 49.2 | 49 | 71 | 30 | |
| 28 | SGDH | 16.7 | 4 | 22 | 33 | |
MS analysis of RP-HPLC-resolved subunits
RP-HPLC resolved subunits were identified by either MALDI-TOF/MS and/or HPLC-ESI-MS/MS analysis of peptides produced by in-solution tryptic digestion. Subunits eluting in 15 of the peaks were directly identified by MALDI-TOF/MS, while subunits in all 28 peaks were positively identified by RP-HPLC ESI-MS/MS analysis of peptides (Table 1). Representative MALDI/TOF mass spectra are shown in Figure 2. Subunits 9 kDa, 15 kDa, and B14.5b were each positively identified by MALDI-TOF mass spectra peaks corresponding to protein eluting in RP-HPLC peak 2 (Fig. 2, panel A), peak 3 (Fig. 2, panel B), and peak 23 (Fig. 2, panel C), respectively. Each spectrum provides clear evidence that discrete subunits are contained in each chromatographic elution peak. MALDI/TOF analysis of protein eluting in RP-HPLC peak 16 (Fig. 2, panel D) is an example of co-elution of subunits. In this case, the chromatographic elution peak contains two subunits, subunits KFYI and AGGG.
Figure 2.
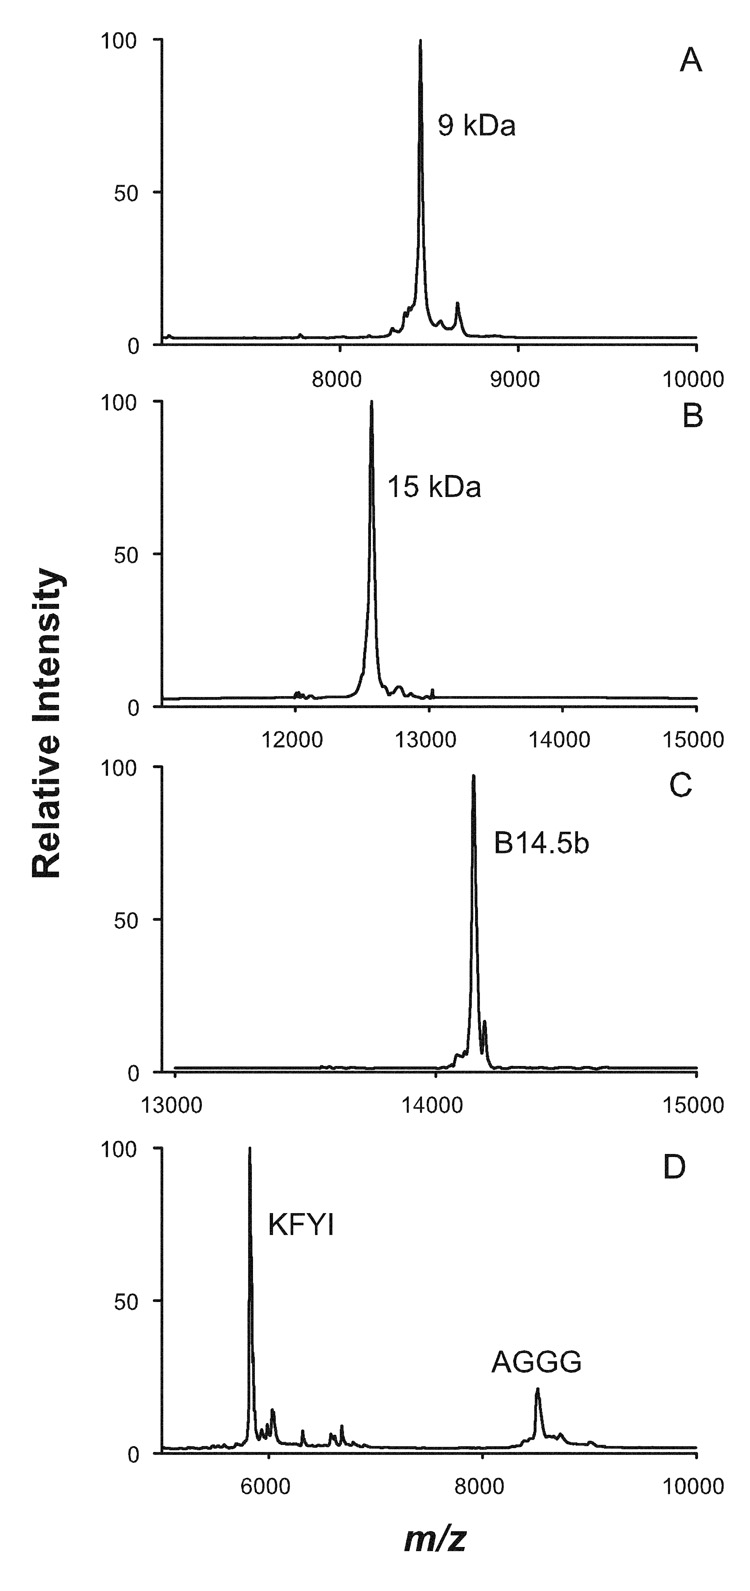
Representative MALDI-TOF mass spectra of Complex I subunits that had been isolated by RP-HPLC. Many HPLC elution peaks contain a single subunit, e.g., Panel A: elution peak 2 contains only subunit 9 kDa, m/z = 8452.63; Panel B: HPLC elution peak 3 contains only subunit 15 kDa, m/z = 12571.13; and Panel C: elution peak 23 contains only subunit B14.5b, m/z = 14147 m/z. Some of the other elution peaks contain more than one subunit, e.g., Panel D: HPLC elution peak 16 contains subunit KFYI, m/z = 5824 and subunit AGGG, m/z = 8516. It should be noted that some subunit names, e.g., 9 kDa and 15 kDa, do not accurately reflect the true mass of either subunits.
MALDI/TOF analysis of proteins eluting in other chromatographic peaks was inconclusive. For that reason, the subunit content of each elution peak was also determined by HPLC-ESI-MS/MS analysis of peptides produced by in-solution tryptic digestion. Thirty-four subunits were identified by searching tandem mass spectral data obtained for the tryptic peptides against the Swiss-Prot database by means of Mascot (Table 1). Over one half of the analyzed subunits had greater than 50% sequence coverage. The highest degree of sequence coverage was for subunits B14, 13 kDa-B and B17.2 (94%, 91% and 86%, respectively); the lowest for subunits MWFE, PSST, SDAP and 42 kDa (24%, 20%, 15%, 4%, respectively). The 34 subunits that could be identified included those that had been identified by MALDI-TOF/MS (except subunit KFYI), together with 19 additional subunits. Each protein was accurately identified with a ≥ 99% probability score, based on Scaffold analysis.
The tandem mass spectrometry data were also analyzed using a cross-correlation of the Mascot results with X! Tandem. This analysis matched a higher number of spectra per subunit, allowing the identification of two additional subunits, KFYI and MWFE (Table 1). In total, 36 subunits were positively identified within the 28 RP-HPLC peaks. Nineteen RP-HPLC peaks contained a single Complex I subunit, five contained two subunits, and three contained three subunits.
Nine subunits did not elute from the HPLC column. Subunits B14.7, MLRQ and all seven mitochondrial-encoded subunits were not detected in the RP-HPLC fractions. All of these subunits, except for MLRQ, are quite hydrophobic, as indicated by their positive GRAVY score (a measure of protein hydrophobicity [26]), e.g., subunit ND1 has a GRAVY score of 0.798; ND2, 0.785; ND3, 0.863; ND4, 0.826; ND5, 0.637; ND6, 1.031; ND4L, 1.259; B14.7, 0.245 [27]. It is likely that either these highly hydrophobic subunits are insoluble in the 0.1% TFA/water loading solution, or they bind irreversibly to the C18 reversed-phase column and can not be eluted.
Several subunits belonging to other mitochondrial inner membrane complexes were detected as eluting from the RP-HPLC column, confirming earlier reports that the isolated enzyme usually contains small amounts of contaminating subunits [27,28,29]. In agreement with these earlier reports, several CcO subunits (subunits VIb, VIc, Va, VIIa and IV), together with small amounts of the dihydrolipoyllysine-residue succinyltransferase (a component of the 2-oxoglutarate dehydrogenase complex), and the alpha and beta chains of ATP synthase were also detected in the elution peaks.
Surprisingly, subunits B14.5a and SDAP each eluted at two separate times. Subunit B14.5a was detected in both elution peaks 4 and 5, while SDAP eluted in peaks 21 and 22, suggesting possible partial post-translational modification or oxidative damage within each of these subunits. HPLC-ESI-MS/MS analysis of the tryptic peptides produced from each elution peak confirmed that partial oxidation of subunits had occurred. Subunit B14.5a eluting earlier contained oxidized Trp13 and Trp103 while B14.5a eluting later contained only oxidized Trp13. Similarly, SDAP containing oxidized His103 eluted earlier than its non-oxidized counterpart did. In each case, the more oxidized, more polar subunit eluted earlier than the less oxidized, less polar subunit.
DISCUSSION
A reversed-phase HPLC system was successfully developed for resolving and analyzing all but the most hydrophobic subunits of Complex I. This is the first time that the Complex I subunits have been resolved and purified by a one-step procedure. Reversed-phase HPLC combined with mass spectrometry has a distinct advantage over previous analytical procedures, e.g. one-dimensional SDS-PAGE, or two-dimensional isoelectric focusing/SDS-PAGE, in that it is ideally suited for the detection of chemically modified subunits and/or amino acids.
Complex I dissociates into its component subunits upon incubation in dilute aqueous trifluoroacetic acid. The resulting mixture, when applied to a large pore, C18 RP-HPLC column and eluted with an acetonitrile gradient, produces 28 well-resolved elution peaks, that contain 36 of the 45 subunits. Most elution peaks contain a single subunit although five elution peaks contain two subunits and three others contain three different subunits. Of the nine subunits that do not elute from RP-HPLC, all, except for MLRQ, are quite hydrophobic. The inability to analyze hydrophobic subunits by RP-HPLC is similar to that observed for bovine heart cytochrome c oxidase and bovine heart cytochrome bc1 [22,21]. In each case, the large hydrophobic, mitochondrially-encoded subunits do not elute from the column because they are either not soluble in the aqueous 1–2% TFA loading solvent, or they bind irreversibly to the reversed-phase column. It is not surprising that similar difficulties are encountered during subunit analysis of Complex I.
In addition to the Complex I subunits, the elution peaks also contain small amounts of other mitochondrial electron transport complexes, suggesting that our preparations of Complex I have not been purified to 100 percent homogeneity. This result is not unprecedented, but is consistent with Complex I preparations isolated by other groups [27,28,29]. All have found co-isolation of small amounts of other mitochondrial inner membrane complexes. In fact, it has been suggested that the harsh conditions required for removal of these contaminating proteins is usually sufficient to compromise the integrity of Complex I [28]. The most abundant contaminants in our isolated Complex I are five CcO subunits (VIb, VIc, Va, VIIa, and IV), the dihydrolipoyllysine-residue succinyltransferase component of 2-oxoglutarate dehydrogenase and the alpha and beta subunits of ATP synthase.
Our analytical approach has an advantage in that RP-HPLC combined with ESI-MS/MS analysis of tryptic peptides is ideally suited for detection of chemically modified subunits and, in fact, the exact site(s) of modification. The extent of subunit loss or modification can usually be quantified by RP-HPLC to an accuracy of ± 5% based upon the elution yield of a particular subunit [21]. Combined with ESI/MS/MS analysis of proteolytically generated peptides, the exact site of chemical modification can be determined. Previously, we have used this approach to map “hot spots” for oxidative damage in bovine heart cytochrome c oxidase [24,30,31], and we fully expect that a similar approach can map similar “hot spots” within Complex I.
Mapping chemically modified sites within Complex I is particularly important since this enzyme is believed to be one of the major sources of ROS, making it a major target for ROS-initiated oxidative damage. The present study, in fact, demonstrates its ability to resolve and detect partially oxidized Complex I subunits. Subunits B14.5a and SDAP each eluted as two well resolved peaks that differed only in their extent of tryptophan oxidation (refer to Table 1). As expected, the subunit with the highest degree of tryptophan oxidation eluted prior to the less modified subunit due to its increased polarity. We, therefore, predict that our analytical procedure will be useful for the detection of other sites within Complex I that are sensitive to oxidative stress, or chemically modified as part of metabolic regulation.
Acknowledgements
We thank Tiffany McDonald-Marsh and Linda Sowdal for their technical assistance in this project.
Footnotes
Publisher's Disclaimer: This is a PDF file of an unedited manuscript that has been accepted for publication. As a service to our customers we are providing this early version of the manuscript. The manuscript will undergo copyediting, typesetting, and review of the resulting proof before it is published in its final citable form. Please note that during the production process errors may be discovered which could affect the content, and all legal disclaimers that apply to the journal pertain.
This work was supported by grants from the National Institutes of Health (GMS 24795), The Robert A. Welch Foundation (AQ1481), and The University of Texas Health Science Center, San Antonio (VPN 125644).
Abbreviations: Reversed-phase high performance liquid chromatograph (RP-HPLC); bicinchoninic acid (BCA); trifluoroacetic acid (TFA); reactive oxygen species (ROS)
Subunit nomenclature for Complex I is that described by Finel et al. [9].
REFERENCES
- 1.Wikström M. Two protons are pumped from the mitochondrial matrix per electron transferred between NADH and ubiquinone. FEBS Lett. 1984;169:300–304. doi: 10.1016/0014-5793(84)80338-5. [DOI] [PubMed] [Google Scholar]
- 2.Walker JE. The NADH-ubiquinone oxidoreductase (complex I) of respiratory chains. Q. Rev. Biophys. 1992;25:253–324. doi: 10.1017/s003358350000425x. [DOI] [PubMed] [Google Scholar]
- 3.Carroll J, Fearnley IM, Skehel JM, Shannon RJ, Hirst J, Walker JE. Bovine Complex I is a complex of 45 different subunits. J. Biol. Chem. 2006;281:32724–32727. doi: 10.1074/jbc.M607135200. [DOI] [PubMed] [Google Scholar]
- 4.Hirst J, Carroll J, Fearnley IM, Shannon RJ, Walker JE. The nuclear encoded subunits of complex I from bovine heart mitochondria. Biochim. Biophys. Acta. 2003;1604:135–150. doi: 10.1016/s0005-2728(03)00059-8. [DOI] [PubMed] [Google Scholar]
- 5.Chomyn A, Mariottini P, Cleeter MWJ, Ragan CI, Matsuno-Yagi A, Hatefi Y, Doolittle RF, Attardi G. Six unidentified reading frames of human mitochondrial DNA encode components of the respiratory chain NADH dehydrogenase. Nature. 1985;314:592–597. doi: 10.1038/314592a0. [DOI] [PubMed] [Google Scholar]
- 6.Chomyn A, Cleeter MWJ, Ragan CI, Riley M, Doolittle RF, Attardi G. URF6, last unidentified reading frame of human mtDNA, codes for an NADH dehydrogenase subunit. Science. 1986;234:614–618. doi: 10.1126/science.3764430. [DOI] [PubMed] [Google Scholar]
- 7.Murray J, Zhang B, Taylor SW, Oglesbee Fahy E, Marusich MF, Ghosh SS, Capaldi RA. The subunit composition of the human NADH dehydrogenase obtained by rapid one-step immunopurification. J. Biol. Chem. 2003;278:13619–13622. doi: 10.1074/jbc.C300064200. [DOI] [PubMed] [Google Scholar]
- 8.Sazanov LA, Peak-Chen SY, Fearnley IM, Walker JE. Resolution of the membrane domain of bovine complex I into subcomplexes: implications for the structural organization of the enzyme. Biochemistry. 2000;39:7229–7235. doi: 10.1021/bi000335t. [DOI] [PubMed] [Google Scholar]
- 9.Finel M, Skehel JM, Albracht SPJ, Fearnley IM, Walker JE. Resolution of NADH:ubiquinone oxidoreductase from bovine heart mitochondria into two subcomplexes, one of which contains the redox centers of the enzyme. Biochemistry. 1992;31:11425–11434. doi: 10.1021/bi00161a022. [DOI] [PubMed] [Google Scholar]
- 10.Carroll J, Shannon RJ, Fearnley IM, Walker JE, Hirst J. Definition of the nuclear encoded protein composition of bovine heart mitochondrial Complex I. J. Biol. Chem. 2002;277:50311–50317. doi: 10.1074/jbc.M209166200. [DOI] [PubMed] [Google Scholar]
- 11.Jenner P, Schapira AHV, Marsden CD. New insights into the cause of Parkinson’s disease. Neurology. 1992;42:2241–2250. doi: 10.1212/wnl.42.12.2241. [DOI] [PubMed] [Google Scholar]
- 12.Tompkins AJ, Burwell LS, Digerness SB, Zaragoza C, Holman WL, Brookes PS. Mitochondrial dysfunction in cardiac ischemia-reperfusion injury: ROS from complex I, without inhibition. Biochim. Biophys. Acta. 2006;1762:223–231. doi: 10.1016/j.bbadis.2005.10.001. [DOI] [PubMed] [Google Scholar]
- 13.Kim SH, Vlkolinsky R, Cairns N, Fountoulakis M, Lubec G. The reduction of NADH Ubiquinone oxidoreductase 24- and 75-kDa subunits in brains of patients with Down syndrome and Alzheimer’s disease. Life Sciences. 2001;68:2741–2750. doi: 10.1016/s0024-3205(01)01074-8. [DOI] [PubMed] [Google Scholar]
- 14.Pocsfalvi G, Cuccurullo M, Schlosser G, Scacco S, Papa S, Malorni A. Phosphorylation of B14.5a subunit from bovine heart complex I identified by titanium dioxide selective enrichment and shotgun proteomics. Molec. Cell. Proteomics. 2007;6:231–237. doi: 10.1074/mcp.M600268-MCP200. [DOI] [PubMed] [Google Scholar]
- 15.Schilling B, Aggeler R, Schulenberg B, Murray J, Row RH, Capaldi RA, Gibson BW. Mass spectrometric identification of a novel phosphorylation site in subunit NDUFA10 of bovine mitochondrial Complex I. FEBS Lett. 2005;579:2485–2490. doi: 10.1016/j.febslet.2005.03.061. [DOI] [PubMed] [Google Scholar]
- 16.Chen R, Fearnley IM, Peak-Chew SY, Walker JE. The phosphorylation of subunits of complex I from bovine heart mitochondria. J. Biol. Chem. 2004;279:26036–26045. doi: 10.1074/jbc.M402710200. [DOI] [PubMed] [Google Scholar]
- 17.Pasdois P, Deveaud C, Voisin P, Bouchaud V, Rigoulet M, Beauvait B. Contribution of the phosphorylable complex I in the growth phase-dependent respiration of C6 glioma cells in vitro. J. Bioenerg. Biomembr. 2003;35:439–450. doi: 10.1023/a:1027391831382. [DOI] [PubMed] [Google Scholar]
- 18.Papa S, Scacco S, Sardenelli AM, Vergari F, Papa F, Budde S, van den Heuvel L, Smeitink J. Mutation in the NDUFS4 gene of complex I abolishes cAMP-dependent activation of the complex in a child with fatal neurological syndrome. FEBS Lett. 2001;489:259–262. doi: 10.1016/s0014-5793(00)02334-6. [DOI] [PubMed] [Google Scholar]
- 19.Scacco S, Vergari R, Scarpulla RC, Technikova-Dobrova Z, Sardenelli A, Lambo R, Lorusso V, Papa S. cAMP-dependent phosphorylation of the nuclear encoded 18-kDa (IP) subunit of respiratory complex I and activation of the complex in serum starved mouse fibroblast cultures. J. Biol. Chem. 2000;275:17578–17582. doi: 10.1074/jbc.M001174200. [DOI] [PubMed] [Google Scholar]
- 20.Robinson NC, Dale MP, Talbert LH. Subunit analysis of bovine cytochrome c oxidase by reverse phase high performance liquid chromatography. Arch. Biochem. Biophys. 1990;281:239–244. doi: 10.1016/0003-9861(90)90438-5. [DOI] [PubMed] [Google Scholar]
- 21.Liu YC, Sowdal LH, Robinson NC. Separation and quantitation of cytochrome c oxidase subunits by Mono-Q fast protein liquid chromatography and C18 reverse-phase high-performance liquid chromatography. Arch. Biochem. Biophys. 1995;324:135–142. doi: 10.1006/abbi.1995.9917. [DOI] [PubMed] [Google Scholar]
- 22.Musatov A, Robinson NC. Subunit analysis of bovine cytochrome bc1 by reverse-phase HPLC and determination of the subunit molecular masses by electrospray ionization mass spectrometry. Biochemistry. 1994;33:10561–10567. doi: 10.1021/bi00201a001. [DOI] [PubMed] [Google Scholar]
- 23.Musatov Carroll, CA, Liu Y-C, Henderson GI, Weintraub ST, Robinson NC. Identification of Bovine Heart Cytochrome c Oxidase Subunits Modified by the Lipid Peroxidation Product 4-Hydroxy-2-nonenal. Biochemistry. 2002;41:8212–8220. doi: 10.1021/bi025896u. [DOI] [PubMed] [Google Scholar]
- 24.Musatov A, Hebert E, Carroll CA, Weintraub ST, Robinson NC. Specific modification of two tryptophans within the nuclear-encoded subunits of bovine cytochrome c oxidase by hydrogen peroxide. Biochemistry. 2004;43:1003–1009. doi: 10.1021/bi0358925. [DOI] [PubMed] [Google Scholar]
- 25.Hatefi Y. Preparation and properties of NADH:Ubiquinone Oxidoreductase (Complex I), EC 1.6.5.3. Methods Enzymol. 1978;53:11–14. doi: 10.1016/s0076-6879(78)53006-1. [DOI] [PubMed] [Google Scholar]
- 26.Kyte J, Doolittle R. A simple method for displaying the hydropathic character of a protein. J. Mol. Biol. 1982;157:105–132. doi: 10.1016/0022-2836(82)90515-0. [DOI] [PubMed] [Google Scholar]
- 27.Pocsfalvi G, Cuccurullo M, Schlosser G, Cacace G, Siciliano RA, Mazzeo MF, Scacco S, Cocco T, Gnoni A, Malorni A, Papa S. Shotgun proteomics for the characterization of subunit composition of mitochondrial Complex I. Biochim. Biophys. Acta. 2006;1757:1438–1450. doi: 10.1016/j.bbabio.2006.05.037. [DOI] [PubMed] [Google Scholar]
- 28.Carroll J, Fearnley IM, Shannon RJ, Hirst J, Walker JE. Analysis of the subunit composition of complex I from bovine heart mitochondria. Mol. Cell. Proteomics. 2003;2:117–126. doi: 10.1074/mcp.M300014-MCP200. [DOI] [PubMed] [Google Scholar]
- 29.Fandiño AS, Rais I, Vollmer M, Elgass H, Schägger H, Karas M. LC-nanospray-MS/MS analysis of hydrophobic proteins from membrane protein complexes isolated by blue-native electrophoresis. J. Mass Spectrom. 2005;40:1223–1231. doi: 10.1002/jms.903. [DOI] [PubMed] [Google Scholar]
- 30.Musatov A. Contribution of peroxidized cardiolipin to inactivation of bovine heart cytochrome c oxidase. Free Radic. Biol. Med. 2006;41:238–246. doi: 10.1016/j.freeradbiomed.2006.03.018. [DOI] [PubMed] [Google Scholar]
- 31.Lemma-Gray P, Weintraub ST, Carroll CA, Musatov A, Robinson NC. Tryptophan 334 oxidation in bovine cytochrome c oxidase subunit I involves free radical migration. FEBS Letters. 2007;581:437–442. doi: 10.1016/j.febslet.2006.12.054. [DOI] [PMC free article] [PubMed] [Google Scholar]