

Abstract
We recognize, understand, and interact with objects through both vision and touch. Conceivably, these two sensory systems encode object shape in similar ways, which could facilitate cross-modal communication. To test this idea, we studied single neurons in macaque monkey intermediate visual (area V4) and somatosensory (area SII) cortex, using matched shape stimuli. We found similar patterns of shape sensitivity characterized by tuning for curvature direction. These parallel tuning patterns imply analogous shape coding mechanisms in intermediate visual and somatosensory cortex.
Keywords: macaque, neural code, somatosensory cortex, visual cortex
Our remarkable capacity for perceiving and manipulating objects depends on extensive information processing in visual and somatosensory cortex. In both systems, the original input patterns are isomorphic (point-for-point) images distributed across two-dimensional receptor sheets. These input representations contain object information, but that information is not in a useful form, because it is distributed in a complex fashion across thousands of channels, in a way that changes continuously depending on the spatial relationship between receptor sheet and object. In this complex, variable form, object information cannot be stored in memory, transmitted efficiently to multiple brain regions, or decoded quickly and easily enough to support perception and influence behavior. Thus, input patterns must be extensively transformed into a neural code that is compact, explicit (easy to decode), and stable enough to support object perception and object memory.
Here, we tested the hypothesis that visual and somatosensory systems have analogous mechanisms for coding object shape. These two sensory modalities interact closely in object perception (1–8), and analogous neural codes would clearly facilitate information sharing. We studied intermediate stages in the macaque visual (area V4) and somatosensory (area SII) cortical pathways for processing object information (9–11). We reasoned that intermediate-level neural codes are sufficiently distinct yet experimentally tractable. We used matched visual and tactile stimuli designed to span a range of object contour fragments that might typically occupy V4 or SII receptive fields (which are on the order of several degrees of visual angle and several finger pads, respectively). We recorded the responses of individual V4 neurons to contour stimuli flashed on a computer screen and individual SII neurons to embossed contour stimuli indented into a distal finger pad.
Results
We analyzed 127 V4 neurons and 210 SII neurons with stimulus responses significantly (P < 0.05) above baseline. For many neurons in both area V4 and area SII, the dominant response characteristic was relatively narrow tuning for direction of curvature (the derivative of orientation with respect to distance along the contour) (Fig. 1). The first V4 example neuron (Fig. 1A) was tuned for sharp and broad curvature fragments projecting in a direction range from 0° to 45° (right to upper right). The SII example neuron (Fig. 1B; see also Fig. S1) was tuned for curvature fragments projecting in a direction range from 270° to 315° (downward to lower right). We modeled tuning for curvature direction with von Mises functions (Fig. 1 A and B, marginal plots). (These functions do not capture tuning for other stimulus characteristics such as curvature acuteness, as in Fig. 1A; see Fig. S2). Tuning was significant (randomization test, P < 0.05; see Materials and Methods) for 86 of 127 V4 neurons (Fig. 1C, filled circles) and 37 of 210 SII neurons (Fig. 1D, filled circles). The number of tuned neurons in both areas was highly significant (randomization test, P < 0.001). Significant tuning for curvature direction was less common in SII (χ2 = 85.7, P < 0.0001), but this was mainly due to the much greater response variability of SII neurons. For neurons with similar response consistency (F-ratio), tuning strength was comparable in SII (Fig. S3). Thus, the percentage of tuned SII neurons was higher (33%, 26 of 80) when the analysis pool was limited to neurons with significant response modulation across stimuli, based on a two-way ANOVA (stimulus shape × stimulus direction, main or interaction effects, P < 0.05). Applying the same response modulation threshold in V4 yielded 83 of 103 or 81% tuned neurons. Even within these limited analysis pools, responses were much less variable in V4 (see Fig. S3) and thus more likely to produce significant results in the curvature direction tuning analysis. Below, we discuss how greater variability of SII responses may reflect differences in stimulus size relative to receptor spacing. The distribution of tuning widths was comparable in the two areas (Fig. 1 C and D). The average value of κ, which is inversely related to tuning width, was 9.7 in V4 and 14.5 in SII. This difference was marginally significant (two-sample Kolmogorov–Smirnov test, P = 0.02), so tuning widths in SII were slightly narrower. Both the V4 and SII neural samples spanned the range of curvature directions evenly (Rayleigh test, P = 0.41 for V4, P = 0.40 for SII; Fig. 1 E and F, and Fig. S4).
Fig. 1.

Tuning for curvature direction in visual and somatosensory cortex. (A) Example neuron from macaque visual area V4. Contour fragment stimuli (shown here as white icons) were flashed in the cell's receptive field while the monkey performed a fixation task (see Materials and Methods). Background gray-level indicates average response to each stimulus (see scale bar). Marginal plot at right averages responses across rows of stimuli projecting in the same direction (open circles). The fitted von Mises function (blue curve) explained a substantial fraction of total response variance (r2 = 0.64). (B) Example neuron from macaque somatosensory area SII. Embossed tactile stimuli were indented into the distal finger pad of a monkey performing a distraction task (see Materials and Methods). The fitted von Mises function (green curve) explained a substantial fraction of total response variance (r2 = 0.60). (C) Distribution of curvature direction tuning in area V4. Neurons with (filled circles) and without (open circles) significant tuning (randomization test, P < 0.05; see Materials and Methods) are plotted with respect to variance explained (vertical axis) and selectivity (κ) for von Mises function fits. Larger values of κ signify sharper tuning. The example V4 neurons from Fig. 1 (blue) and Fig. 2 (red) were significantly tuned. Marginal histograms show numbers of tuned (filled) and untuned (open) neurons. (D) Distribution of curvature direction tuning in area SII. Conventions as in panel C. The example SII neurons from Fig. 1 (green) and Fig. 2 (yellow) were significantly tuned. (E and F) Example curvature direction tuning functions from 20 V4 (E) and 20 SII (F) neurons. Baseline-subtracted fitted von Mises functions are shown for each neuron.
To supplement this hypothesis-driven analysis, we used a more agnostic principal components analysis (PCA) to visualize salient response patterns in the data. We aligned responses across neurons so that tuning patterns differing only in orientation could emerge (see Materials and Methods). We used Monte Carlo simulations of neural populations to verify the performance of this analysis. For a simulated population of neurons with random responses, the first principal component (PC1) has no discernible structure (Fig. 2A). For a simulated population of neurons tuned for orientation, as in primary sensory cortex (12–15), PC1 captures a distinct pattern of four alternating response peaks (Fig. 2B) comprising stimuli with a common component orientation (in this case, slightly clockwise from horizontal). This tuning pattern was observed for some neurons in the V4/SII data set (see Fig. S5). For a simulated population of neurons tuned for curvature direction, PC1 captures a row of contour fragments projecting in the same direction (Fig. 2C). This is the pattern that emerged in PC1 from analysis of the observed V4 and SII data (Fig. 2D). Example neurons from V4 (Fig. 2E) and SII (Fig. 2F) with large projections onto PC1 (i.e., high variance explained) exhibited the expected tuning for curvature direction. PC1 explained 38% of the response variance in the V4 population and 27% of the response variance in the SII population (Fig. 3). No other component explained more than 7% in either population.
Fig. 2.

PCA of contour fragment response patterns. (A) PC1 for a simulated neural population (see Materials and Methods) with random response patterns. (B) PC1 for a simulated neural population with tuning for orientation. (C) PC1 for a simulated neural population with tuning for curvature direction. (D) PC1 for the observed response patterns in the V4 and SII data sets. (E) Example V4 neuron with a large projection onto PC1. (F) Example SII neuron with a large projection onto PC1.
Fig. 3.

Response variance explained by principal components. (A) Normalized eigenvalues (fraction of response variance explained) for the first 10 PCs in the combined V4/SII PCA (see Materials and Methods). Individual eigenvalues (histogram) and cumulative variance explained (curve) are shown. PC1 accounted for 31% of the total response variance in the combined V4/SII data set. The first 10 PCs accounted for 61% of total variance. (B) Fraction of V4 response variance explained by the first 10 PCs from the combined V4/SII PCA. (C) Fraction of SII response variance explained by the first 10 PCs from the combined V4/SII PCA.
Discussion
We found that neurons at intermediate levels in both visual and somatosensory cortex (areas V4 and SII) are clearly tuned for the direction in which curved contour fragments point. This unique tuning characteristic is computationally difficult to achieve based on lower-level signals for edge orientation (16). It is not predicted by standard models of shape representation (17, 18), and it does not appear to emerge spontaneously from machine learning algorithms for object identification (19). The presence of this highly specific response pattern in two very different sensory systems must reflect some degree of similarity between their shape coding mechanisms. Parallel coding mechanisms could explain previous observations of similar confusion patterns in visual and tactile shape recognition (20–22).
Analogous shape coding mechanisms in vision and touch might reflect the multisensory nature of perception. We recognize objects sometimes by sight alone (e.g., when they are distant) and sometimes by touch alone (e.g., in the dark). Parallel coding schemes would facilitate consistent recognition across these different conditions by enabling efficient cross-modal transfer of object information. Frequently, objects are seen and touched simultaneously, and the brain forms a supramodal representation based on interactions between the two sensory systems (23–25). Under some conditions, tactile stimuli can evoke orientation-tuned responses in area V4 (7, 8). An analogous coding format would optimize integration of visual and tactile information into a single, coherent object percept.
Alternatively, analogous shape coding mechanisms might reflect convergent evolution in response to similar information processing challenges. In both vision and touch, curvature tuning could serve as an important intermediate step in the transformation toward compact, explicit representation of object shape (10). At earlier processing stages, in primary sensory cortex, neural receptive fields encompass small contour fragments that are typically smooth (due to the structure of natural objects). Smooth contour fragments can be compactly represented in terms of orientation, and extraction of local orientation is the major transformation of shape information in both primary visual (12, 13) and primary somatosensory cortex (14, 15, 26). At intermediate processing stages like V4 and SII, neural receptive fields encompass larger contour fragments that exhibit gradual and abrupt changes in orientation. Compact representation of these larger fragments therefore requires explicit representation of orientation change, i.e., curvature tuning. Contour curvature is a highly informative aspect of natural object structure (27, 28) to which we are exquisitely sensitive (29–33). Numerous studies have demonstrated clear tuning for two- and three-dimensional contour/surface curvature in higher-level visual cortex (34–43). Explicit coding of contour fragment curvature is not specifically predicted by components-based shape processing theories (17, 18) but could serve as a basis function set for components-based coding, in that complete object boundaries can be represented in terms of their component curvature elements (38). Components-based representation is compact and also high-capacity, since large numbers of objects can be encoded as different combinations of a limited set of shape elements (10).
Significant tuning for curvature direction was less frequent in SII. That might partly reflect other neural functionalities in SII (44–46), which would tend to depress the percentage of shape-tuned neurons. However, our analyses suggested that the difference is largely due to much higher response variability in SII compared to V4. The most obvious explanation for the response variability difference is stimulus size relative to receptor spacing. Given an approximate finger pad size of 1 cm2, our tactile stimuli would have subtended about 10 Merkel receptor spacings in one dimension (47). In contrast, in the middle range of V4 eccentricities we studied (about 4° of visual angle), the portion of our stimuli in the receptive field would have subtended approximately 150 receptor spacings (based on an approximate cone density of 40,000/mm2 at this eccentricity) (48). Thus, the tactile stimuli were effectively more than an order of magnitude smaller than the visual stimuli. Moreover, while the visual stimuli extended across and beyond the entire V4 receptive field, the tactile stimuli occupied just one distal finger pad within SII receptive fields that typically spanned multiple fingers. For most SII neurons, the stimulated finger pad was optimized for strongest responses, but this was not always true during multielectrode recording. These pronounced stimulus differences could be expected to produce noisier responses and weaker tuning in SII. The rationale behind our tactile stimulus design was that the distal finger pad presents a continuous surface with the highest receptor density in the hand. The weaker response modulation we observed in SII, however, argues that future experiments should employ larger, more discriminable stimuli covering multiple digits. We predict that such experiments would reveal stronger and more prevalent tuning for contour shape in SII. Further experiments are also needed to compare visual and tactile sensitivity to other shape parameters such as convexity/concavity (34, 39) and to compare more advanced shape processing at higher levels (35–37).
Materials and Methods
V4 Experiments.
Behavioral and neurophysiological methods.
We recorded extracellular action potentials from well-isolated V4 cells in the lower parafoveal representation on the surface of the prelunate gyrus and adjoining banks of the lunate and superior temporal sulci in three awake rhesus monkeys (Macaca mulatta) trained to maintain fixation within a 0.5°-radius window. All animal procedures were approved by the Johns Hopkins animal care and use committee and conformed to National Institutes of Health and U.S. Department of Agriculture guidelines. Further details can be found in Pasupathy and Connor (1999), where these V4 data were initially reported (34).
Visual stimuli.
The visual stimulus set comprised six contour fragment shapes: 45°, 90°, and 135° angles, which represent the limit of curvature acuteness, and curved B-spline approximations to these angles. These six shapes were presented at eight orientations (45° intervals). Stimulus size was scaled according to average V4 receptive field (RF) size at the cell's eccentricity. Stimuli were rendered in the cell's optimal color against a gray background. Stimulus luminance was constant within the RF and faded gradually into the background outside the RF. During each behavioral trial, a sequence of five randomly chosen stimuli were flashed for 500 ms each, separated by 250-ms intervals with only the background present. The entire stimulus set was presented five times. Further details can be found in Pasupathy and Connor (1999) (34).
SII Experiments.
Behavioral and neurophysiological methods.
We recorded extracellular action potentials from well-isolated SII cells in the cutaneous hand representation of the superior bank of the lateral sulcus in two awake rhesus monkeys (different from those used in the V4 experiments). The animals were trained to sit in a primate chair with their hands restrained while tactile stimuli were indented normal to the skin surface of the distal pad of digit 2, 3, or 4. One animal (94 cells) sat passively and was given liquid rewards at random intervals; the other animal (116 cells) was rewarded for maintaining visual fixation within a 5°-radius window. All animal procedures were approved by the Johns Hopkins animal care and use committee and conformed to National Institutes of Health and U.S. Department of Agriculture guidelines. Recording chambers (19-mm diameter) were positioned over the animals' lateral sulci according to Horsley-Clarke coordinates (anterior 6; lateral 28). We located the lateral sulcus based on the neural responses encountered as the electrodes passed through the gray and white matter. Neurons recorded medial to the sulcus showed tactile and visual responses, while neurons recorded lateral to the sulcus responded to auditory stimulation. We located the cutaneous hand region of SII by following the lateral sulcus to more anterior regions of the recording chamber. These neural recording techniques have been detailed previously (49).
Tactile stimuli.
The tactile stimulus set comprised six contour fragments matched to stimuli used in the visual studies: three angles (45°, 90°, and 135°) and three circular arcs (with 7.5-, 5-, and 1-mm curvature radii). Each stimulus was presented at eight orientations (45° intervals). The tactile curve stimuli differed slightly in shape from the corresponding visual stimuli, but not in any way that would affect the conclusions in this report. We machined each stimulus onto the surface of a 20-mm square plastic block (Ultem; General Electric), removing background material to leave a 0.5-mm-wide contour at a relief height of 5 mm. The stimuli were positioned such that angle vertices and arc midpoints fell at the center of the square block. The contours extended to the block boundaries to ensure that they extended past the finger pad contact area. The stimulator was a servo-controlled linear motor (Baldor Electric Company) mounted onto a magnetic forcer, translating across a downward-facing horizontal plane on a frictionless air cushion (Aerotech). A small rotary stepper motor (Arsape) attached to the bottom of the linear motor provided stimulus rotation. A pneumatic “gripper” motor (Pisco USA) attached to the bottom of the rotary motor was used to retrieve stimuli under computer control from a cassette containing all of the stimulus blocks. Complete descriptions of stimulus fabrication and of the tactile stimulator are available in the SI Text.
Before the experiment, we mapped the multidigit RF of the SII neuron with oriented bars indented into the distal finger pads. Stimuli were indented 1.3 mm beyond the point of initial skin contact. Each stimulus was presented for 500 ms, separated by an interstimulus interval ranging from 0.5 to 2.5 s, depending on stimulus repositioning time. To minimize adaptation differences due to variable intervals, two additional stimulus indentations followed each of the longer retrieval intervals, and these additional stimuli were not included in the analysis. To minimize experiment duration, each stimulus block was presented at all eight directions, randomly ordered without replacement, before another stimulus was retrieved. All stimuli were tested in this way, in random order without replacement, and the entire procedure was repeated five times. The shape of the tactile stimulus was not visible to the animal.
Data Analysis.
For each stimulus, the response rate was calculated by summing spikes over the 500-ms presentation period and averaging across five repetitions. Our basic criterion for inclusion in analyses was significant stimulus response above baseline (one-tailed, unpaired t-test, P < 0.05). Baseline responses were calculated from blank trials, interspersed throughout the experiment, in which no stimulus was presented.
Curvature Direction Selectivity.
The curvature direction for each stimulus was defined by a normal vector projecting outwards from the center point on the convex side. This corresponds to the direction in which angles and curves are typically described as pointing toward. For each cell, we determined the response rate to each stimulus, Rs, at eight directions θi by summing spikes over the 500-ms presentation period, and averaging across five repetitions. We fitted the responses with a model based on a von Mises function (circular normal function), a gain term, and a baseline term, using a nonlinear least-squares algorithm (lsqnonlin, Matlab; Mathworks).
We also characterized strength and significance of direction tuning by quantifying the strength of direction tuning for each cell with a mean vector index:
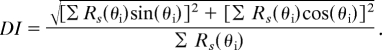 |
Values of DI range from 0 (uniform response to all directions) to 1 (non-zero response to only one direction). We determined the statistical significance of DI for each cell by randomizing its responses across the 48 stimuli 1,000 times and recalculating DI each time to obtain a distribution of values expected by chance. A separate randomization distribution was calculated for each cell. We defined tuning to be significant when the original DI value exceeded 95% of the values in the randomized distribution. We also used randomization to test whether the numbers of significantly tuned V4 and SII neurons were greater than expected by chance. To do so, in each population (V4 or SII) we randomized responses across stimuli within neurons. For each neuron, we tested whether the DI of the randomized responses exceeded its previously determined significance threshold, and we counted the number of neurons that exceeded significance. This procedure was repeated 50,000 times to generate a distribution of numbers of tuned neurons expected by chance. For both V4 and SII, the observed number of significantly tuned neurons was larger than any point in the randomization distribution. Given the number of iterations (50,000), this reflects a significance level of 0.001 (50).
Principal Components Analysis.
We used PCA to identify underlying patterns of shape feature selectivity that account for large fractions of response variance. The responses of each cell were first normalized by its maximum response. We then applied a row-shifting algorithm to optimally align similar response patterns. Each row of six stimuli (e.g., Fig. 1A) is identical apart from orientation, so shifting responses across rows can align response patterns that differ only in orientation. All stimuli were presented at eight orientations, so the set of row-shifted response patterns is defined as Rs(θi) = Rs(θi + T · π/4) for T = [0:7]. Given that the observed tuning patterns spanned the orientation domain, this is the only way to produce clear, explanatory principal components (PCs).
We sought to shift each cell's tuning pattern so as to achieve maximum alignment across the population. We first computed correlations between all possible pairs of shifted response patterns. The pair with the highest correlation was assigned to the first cluster. Each shifted response pattern pair was then considered in order of descending correlation. If the next pair comprised one member in the first cluster and one new member, the new member was added to the first cluster, with the appropriate shift applied. If instead the next pair comprised two new members, they were assigned to a new cluster. Finally, if the next pair comprised members of different clusters, the two clusters were aligned by shifting all of the cells in one of the clusters to align the between-cluster pair, while preserving within-cluster alignments. This process was repeated until all cells were included in a single cluster that maximized pairwise correlations between response patterns.
Given that Vj is the shifted response pattern for the jth cell, we constructed the covariance matrix, C, across the combined populations of V4 and SII cells:
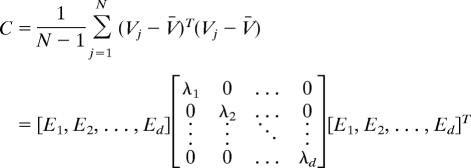 |
where V̄ is the mean response template averaged across the entire population of N cells, and d is the total number of dimensions of the stimulus space (48 stimuli). The data matrix represents the response templates as a cloud of points in the 48D stimulus space. The directions and lengths of the major axes of this point cloud can be obtained by an eigenvalue/eigenvector decomposition of C. The first PC is the eigenvector that explains the largest possible amount of response variance (i.e., has the largest eigenvalue). The first PC in the combined V4/SII analysis explained 38% of V4 response variance and 27% of SII response variance (Fig. 3). Similar results were obtained with PCA on the individual populations: The first V4 PC explained 37% of total V4 response variance, and the first SII PC explained 27% of total SII response variance.
We calculated the fraction of response variance explained by the higher order PCs. If Vj is the response template for the jth cell, the total variance in the population is:
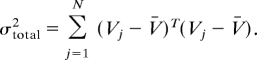 |
The variance captured by P principal components (E1 to Ep) was computed as:
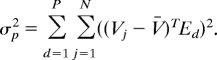 |
Thus, the fraction of variance explained by P principal components is the ratio σp2/σtotal2.
Simulated Neural Populations.
We simulated neural populations with specific tuning properties to test the performance of the row-shifting algorithm and to generate expected PCs for comparison to the observed data. We simulated three populations, each with a range of response patterns from completely random to: (i) flat, i.e., untuned; (ii) orientation-tuned; or (iii) curvature direction-tuned. Each simulated population comprised 337 cells, the combined number of cells in the V4 and SII data sets. In each simulation, the noise-free responses (v̆j) for the jth cell were given by: v̆j = β·(α·r⇑1 + (1 − α)·r⇑2), where α and β are randomly determined constants, r⇑1 is a column vector of 48 random values, and r⇑2 is a column vector of 48 values set by the specified tuning property in the population (flat, orientation, or curvature direction). The value of α, which was uniformly distributed between 0 and 1, determined how close the response pattern was to random (α = 1) or perfectly tuned (α = 0). The final simulated response pattern was V̆j = ⌊v̆j + ε⌋+, where ε is a noise term drawn from a zero-mean Gaussian distribution with variance equal to mean response rate. This response pattern was rectified at 0 spikes/s.
The selectivity of the simulated populations thus depended on vector r⇑2. For the flat or untuned population, r⇑2 was a column vector of ones, so that the neuron responded uniformly across all stimuli if α = 0. To simulate tuning for orientation, we first characterized each stimulus in terms of its component orientations. Each stimulus was divided into five equally spaced contour segments and then defined by a vector s⇑d comprising the normal orientations at the midpoints of the five contour segments. The cell's orientation tuning was defined by a von Mises function with μj and κj (mean and concentration) drawn from uniform distributions spanning [0, 2π] and [0, 30], respectively. The simulated cell's tuned response to the dth stimulus was determined by mapping that stimulus' component orientation vector s⇑d to the [0, 2π] range and finding the component with the largest von Mises function value: r2(d) = max(fj(s⇑d;μj,kj)).
To simulate tuning for curvature direction, each stimulus was defined by a scalar, sd, corresponding to the direction of a normal vector pointing away from the convex side of the stimulus at its midpoint. Curvature direction tuning for each simulated cell was defined by a von Mises function with μj and κj drawn from uniform distributions spanning [0, 2π] and [0, 30], respectively. The simulated cell's tuned response to the dth stimulus was determined by the von Mises function value at the stimulus' curvature direction sd : r2(d) = fj(sd;μj,kj).
Supplementary Material
Acknowledgments.
We thank B. Nash, B. Quinlan, C. Moses, S. Patterson, H. Dong, and Z. Lai for technical support and Amy Bastian, Kelly Barnes, Sung Soo Kim, Sliman Bensmaia, and Pramodsingh Thakur for comments and suggestions. This work was supported by grants from the U.S. National Institutes of Health (to J.M.Y., C.E.C., and S.S.H.).
Footnotes
The authors declare no conflict of interest.
This article is a PNAS Direct Submission.
This article contains supporting information online at www.pnas.org/cgi/content/full/0904186106/DCSupplemental.
References
- 1.Zangaladze A, Epstein CM, Grafton ST, Sathian K. Involvement of visual cortex in tactile discrimination of orientation. Nature. 1999;401:587–590. doi: 10.1038/44139. [DOI] [PubMed] [Google Scholar]
- 2.Amedi A, Malach R, Hendler T, Peled S, Zohary E. Visuo-haptic object-related activation in the ventral visual pathway. Nat Neurosci. 2001;4:324–330. doi: 10.1038/85201. [DOI] [PubMed] [Google Scholar]
- 3.Pietrini P, et al. Beyond sensory images: Object-based representation in the human ventral pathway. Proc Natl Acad Sci USA. 2004;101:5658–5663. doi: 10.1073/pnas.0400707101. [DOI] [PMC free article] [PubMed] [Google Scholar]
- 4.Merabet L, et al. Feeling by sight or seeing by touch? Neuron. 2004;42:173–179. doi: 10.1016/s0896-6273(04)00147-3. [DOI] [PubMed] [Google Scholar]
- 5.Kitada R, et al. Multisensory activation of the intraparietal area when classifying grating orientation: A functional magnetic resonance imaging study. J Neurosci. 2006;26:7491–7501. doi: 10.1523/JNEUROSCI.0822-06.2006. [DOI] [PMC free article] [PubMed] [Google Scholar]
- 6.Peltier S, et al. Activity and effective connectivity of parietal and occipital cortical regions during haptic shape perception. Neuropsychologia. 2007;45:476–483. doi: 10.1016/j.neuropsychologia.2006.03.003. [DOI] [PubMed] [Google Scholar]
- 7.Haenny PE, Maunsell JH, Schiller PH. State dependent activity in monkey visual cortex II. Retinal and extraretinal factors in V4. Exp Brain Res. 1988;69:245–259. doi: 10.1007/BF00247570. [DOI] [PubMed] [Google Scholar]
- 8.Maunsell JH, Sclar G, Nealey TA, DePriest DD. Extra retinal representations in area V4 in the macaque monkey. Vis Neurosci. 1991;7:561–573. doi: 10.1017/s095252380001035x. [DOI] [PubMed] [Google Scholar]
- 9.Felleman DJ, Van Essen DC. Distributed hierarchical processing in the primate cerebral cortex. Cereb Cortex. 1991;1:1–47. doi: 10.1093/cercor/1.1.1-a. [DOI] [PubMed] [Google Scholar]
- 10.Connor CE, Brincat SL, Pasupathy A. Transformation of shape information in the ventral pathway. Curr Opin Neurobiol. 2007;17:140–147. doi: 10.1016/j.conb.2007.03.002. [DOI] [PubMed] [Google Scholar]
- 11.Hsiao S. Central mechanisms of tactile shape perception. Curr Opin Neurobiol. 2008;18:418–424. doi: 10.1016/j.conb.2008.09.001. [DOI] [PubMed] [Google Scholar]
- 12.Hubel DH, Wiesel TN. Receptive fields, binocular interaction and functional architecture in the cat's visual cortex. J Physiol. 1962;160:106–154. doi: 10.1113/jphysiol.1962.sp006837. [DOI] [PMC free article] [PubMed] [Google Scholar]
- 13.Hubel DH, Wiesel TN. Receptive fields and functional architecture of monkey striate cortex. J Physiol. 1968;195:215–243. doi: 10.1113/jphysiol.1968.sp008455. [DOI] [PMC free article] [PubMed] [Google Scholar]
- 14.Pubols LM, LeRoy RF. Orientation detectors in the primary somatosensory neocortex of the raccoon. Brain Res. 1977;129:61–74. doi: 10.1016/0006-8993(77)90970-2. [DOI] [PubMed] [Google Scholar]
- 15.Bensmaia SJ, Denchev PV, Dammann JF, III, Craig JC, Hsiao SS. The representation of stimulus orientation in the early stages of somatosensory processing. J Neurosci. 2008;28:776–786. doi: 10.1523/JNEUROSCI.4162-07.2008. [DOI] [PMC free article] [PubMed] [Google Scholar]
- 16.Cadieu C, et al. A model of V4 shape selectivity and invariance. J Neurophysiol. 2007;98:1733–1750. doi: 10.1152/jn.01265.2006. [DOI] [PubMed] [Google Scholar]
- 17.Biederman I. Recognition-by-components: A theory of human image understanding. Psychol Rev. 1987;94:115–117. doi: 10.1037/0033-295X.94.2.115. [DOI] [PubMed] [Google Scholar]
- 18.Marr D, Nishihara HK. Representation and recognition of the spatial organization of three-dimensional shapes. Proc R Soc Lond B Biol Sci. 1978;200:269–294. doi: 10.1098/rspb.1978.0020. [DOI] [PubMed] [Google Scholar]
- 19.Vaziri SL, Pasupathy A, Brincat SL, Connor CE. In: Object Categorization: Computer and Human Vision Perspectives. Dickinson SJ, Leonardis A, Schiele B, Tarr MJ, editors. Cambridge, UK: Cambridge University Press; 2009. [Google Scholar]
- 20.Loomis JM. Analysis of tactile and visual confusion matrices. Percept Psychophys. 1982;31:41–52. doi: 10.3758/bf03206199. [DOI] [PubMed] [Google Scholar]
- 21.Phillips JR, Johnson KO, Browne HM. A comparison of visual and two modes of tactual letter resolution. Percept Psychophys. 1983;34:243–249. doi: 10.3758/bf03202952. [DOI] [PubMed] [Google Scholar]
- 22.Brusco MJ. On the concordance among empirical confusion matrices for visual and tactual letter recognition. Percept Psychophys. 2004;66:392–397. doi: 10.3758/bf03194887. [DOI] [PubMed] [Google Scholar]
- 23.Amedi A, von Kriegstein K, van Atteveldt NM, Beauchamp MS, Naumer MJ. Functional imaging of human crossmodal identification and object recognition. Exp Brain Res. 2005;166:559–571. doi: 10.1007/s00221-005-2396-5. [DOI] [PubMed] [Google Scholar]
- 24.Jeannerod M, Arbib MA, Rizzolatti G, Sakata H. Grasping objects: The cortical mechanisms of visuomotor transformation. Trends Neurosci. 1995;18:314–320. [PubMed] [Google Scholar]
- 25.Culham JC, Valyear KF. Human parietal cortex in action. Curr Opin Neurobiol. 2006;16:205–212. doi: 10.1016/j.conb.2006.03.005. [DOI] [PubMed] [Google Scholar]
- 26.Hsiao SS, Lane JW, Fitzgerald P. Representation of orientation in the somatosensory system. Behavioural Brain Res. 2002;135:93–103. doi: 10.1016/s0166-4328(02)00160-2. [DOI] [PubMed] [Google Scholar]
- 27.Treisman A, Gormican S. Feature analysis in early vision: Evidence from search asymmetries. Psychol Rev. 1988;95:15–48. doi: 10.1037/0033-295x.95.1.15. [DOI] [PubMed] [Google Scholar]
- 28.Wolfe JM, Yee A, Friedman-Hill SR. Curvature is a basic feature for visual search tasks. Perception. 1992;21:465–480. doi: 10.1068/p210465. [DOI] [PubMed] [Google Scholar]
- 29.Wilson HR, Wilkinson F, Asaad W. Concentric orientation summation in human form vision. Vision Res. 1997;37:2325–2330. doi: 10.1016/s0042-6989(97)00104-1. [DOI] [PubMed] [Google Scholar]
- 30.Habak C, Wilkinson F, Zakher B, Wilson HR. Curvature population coding for complex shapes in human vision. Vision Res. 2004;44:2815–2823. doi: 10.1016/j.visres.2004.06.019. [DOI] [PubMed] [Google Scholar]
- 31.Ben-Shahar O. Visual saliency and texture segregation without feature gradient. Proc Natl Acad Sci USA. 2006;103:15704–15709. doi: 10.1073/pnas.0604410103. [DOI] [PMC free article] [PubMed] [Google Scholar]
- 32.Lakatos S, Marks LE. Haptic underestimation of angular extent. Perception. 1998;27:737–754. doi: 10.1068/p270737. [DOI] [PubMed] [Google Scholar]
- 33.Wheat HE, Goodwin AW. Tactile discrimination of edge shape: Limits on spatial resolution imposed by parameters of the peripheral neural population. J Neurosci. 2001;21:7751–7763. doi: 10.1523/JNEUROSCI.21-19-07751.2001. [DOI] [PMC free article] [PubMed] [Google Scholar]
- 34.Pasupathy A, Connor CE. Responses to contour features in macaque area V4. J Neurophysiol. 1999;82:2490–2502. doi: 10.1152/jn.1999.82.5.2490. [DOI] [PubMed] [Google Scholar]
- 35.Yamane Y, Carlson ET, Bowman KC, Wang Z, Connor CE. A neural code for three-dimensional object shape in macaque inferotemporal cortex. Nat Neurosci. 2008;11:1352–1360. doi: 10.1038/nn.2202. [DOI] [PMC free article] [PubMed] [Google Scholar]
- 36.Brincat SL, Connor CE. Dynamic shape synthesis in posterior inferotemporal cortex. Neuron. 2006;49:17–24. doi: 10.1016/j.neuron.2005.11.026. [DOI] [PubMed] [Google Scholar]
- 37.Brincat SL, Connor CE. Underlying principles of visual shape selectivity in posterior inferotemporal cortex. Nat Neurosci. 2004;7:880–886. doi: 10.1038/nn1278. [DOI] [PubMed] [Google Scholar]
- 38.Pasupathy A, Connor CE. Population coding of shape in area V4. Nat Neurosci. 2002;5:1332–1338. doi: 10.1038/nn972. [DOI] [PubMed] [Google Scholar]
- 39.Pasupathy A, Connor CE. Shape representation in area V4: Position-specific tuning for boundary conformation. J Neurophysiol. 2001;86:2505–2519. doi: 10.1152/jn.2001.86.5.2505. [DOI] [PubMed] [Google Scholar]
- 40.Gallant JL, Connor CE, Rakshit S, Lewis JW, Van Essen DC. Neural responses to polar, hyperbolic, and Cartesian gratings in area V4 of the macaque monkey. J Neurophysiol. 1996;76:2718–2739. doi: 10.1152/jn.1996.76.4.2718. [DOI] [PubMed] [Google Scholar]
- 41.Anzai A, Peng X, Van Essen DC. Neurons in monkey visual area V2 encode combinations of orientations. Nat Neurosci. 2007;10:1313–1321. doi: 10.1038/nn1975. [DOI] [PubMed] [Google Scholar]
- 42.Hegde J, Van Essen DC. A comparative study of shape representation in macaque visual areas v2 and v4. Cereb Cortex. 2007;17:1100–1116. doi: 10.1093/cercor/bhl020. [DOI] [PubMed] [Google Scholar]
- 43.Ito M, Komatsu H. Representation of angles embedded within contour stimuli in area V2 of macaque monkeys. J Neurosci. 2004;24:3313–3324. doi: 10.1523/JNEUROSCI.4364-03.2004. [DOI] [PMC free article] [PubMed] [Google Scholar]
- 44.Murray EA, Mishkin M. Relative contributions of SII and area 5 to tactile discrimination in monkeys. Behavioural Brain Res. 1984;11:67–85. doi: 10.1016/0166-4328(84)90009-3. [DOI] [PubMed] [Google Scholar]
- 45.Romo R, Hernandez A, Zainos A, Lemus L, Brody CD. Neuronal correlates of decision-making in secondary somatosensory cortex. Nat Neurosci. 2002;5:1217–1225. doi: 10.1038/nn950. [DOI] [PubMed] [Google Scholar]
- 46.Pruett JR, Sinclair RJ, Burton H. Response patterns in second somatosensory cortex (SII) of awake monkeys to passively applied tactile gratings. J Neurophysiol. 2000;84:780–797. doi: 10.1152/jn.2000.84.2.780. [DOI] [PubMed] [Google Scholar]
- 47.Johansson RS, Vallbo èB. Tactile sensibility in the human hand: Relative and absolute densities of four types of mechanoreceptive units in glabrous skin. J Physiol. 1979;286:283–300. doi: 10.1113/jphysiol.1979.sp012619. [DOI] [PMC free article] [PubMed] [Google Scholar]
- 48.Packer O, Hendrickson AE, Curcio CA. Photoreceptor topography of the retina in the adult pigtail macaque (Macaca nemestrina) J Comp Neurol. 1989;288:165–183. doi: 10.1002/cne.902880113. [DOI] [PubMed] [Google Scholar]
- 49.Fitzgerald PJ, Lane JW, Thakur PH, Hsiao SS. Receptive field properties of the macaque second somatosensory cortex: Evidence for multiple functional representations. J Neurosci. 2004;24:11193–11204. doi: 10.1523/JNEUROSCI.3481-04.2004. [DOI] [PMC free article] [PubMed] [Google Scholar]
- 50.Manly BFJ. Randomization, Bootstrap and Monte Carlo Methods in Biology. London, UK: Chapman and Hall; 1997. [Google Scholar]
Associated Data
This section collects any data citations, data availability statements, or supplementary materials included in this article.