Abstract
Objective
To test in vivo whether spectral domain optical coherence tomography (SDOCT) provides adequate resolution for reproducible measurement of photoreceptor (PR) layer at the margins of geographic atrophy (GA), and if it delineates the relationship between PR layer and retinal pigment epithelium (RPE) at the margins of GA.
Design
Prospective consecutive case series.
Participants
Patients with GA secondary to non-neovascular age-related macular degeneration (AMD) identified during routine follow-up at Duke Eye Center between 1/3/06 to 6/3/07 and who consented to participate in this study.
Methods
Spectral domain optical coherence tomography (SDOCT) was used to image eyes. Multiple B-scans from each eye were saved and independently graded by 2 graders and the following locations were marked: 1) site where PR thickness began to decline below its baseline, 2) site where PR layer disappeared, and 3) site of the GA margin. These data were processed to calculate the locations of PR losses relative to GA margins and were categorized as A) bridging across GA margins, B) entirely within GA margins, or C) entirely outside GA margins.
Main outcome measures
Location of PR loss (bridging across GA margins, entirely within GA margins, or entirely outside GA margins) was calculated. Distances from the GA margin were measured for beginning and ending of PR loss. Interobserver agreement was determined for categories of PR loss as well as locations of PR loss relative to the GA margin.
Results
500 unique scans were analyzed. PR loss occurred most frequently bridging across the GA margin (65% scans), second most frequently entirely inside the GA margin (29% scans), and least frequently entirely outside the GA margin (6% scans). PR loss started an average of 61μm [standard deviation (SD) ± 235 μm] outside the GA margin, ended an average of 311 μm (SD ± 273 μm) inside the GA margin, and spanned an average of 372 μm (SD ± 179 μm).
Conclusion
SDOCT provides adequate resolution for quantifying PR loss relative to GA margins in non-neovascular AMD with GA. It may also serve as a means of tracking disease progression in future interventional trials.
Keywords: Geographic atrophy, in vivo imaging, spectral domain OCT
Introduction
Age-related macular degeneration (AMD) manifests in two forms: non-neovascular or dry AMD and neovascular AMD. Geographic atrophy (GA) represents the end stages of the dry type of AMD, and its potentially poor visual consequences are similar to the late stages of the wet type. The prevalence of GA and neovascular AMD are similar. Approximately 1.2 million individuals manifest neovascular AMD in at least one eye, but approximately 973,000 individuals exhibit geographic atrophy in at least one eye.1 These prevalence rates are likely to double by the age 2030. Research into understanding progression as well as treatment is limited by a weak understanding of the mechanisms involved in GA.
Pathophysiology of GA
With the dry type, patients begin with a few drusen and develop greater accumulations of these lipid-rich deposits under the retinal pigment epithelium (RPE) before progressing to the more severe form of the disease, geographic atrophy. The pathophysiologic mechanisms underlying risk, onset and progression of GA are unclear. Recently, there has been compelling evidence that uncontrolled regulation of the alternative pathway of complement activation plays a key role in the pathogenesis of AMD and GA. The Y402H polymorphism of the complement factor H gene on chromosome 1 significantly increases the risk of developing GA.2,3 Another common polymorphism in the LOC387715 locus on chromosome 10 is also related to risk of GA. Both of these polymorphisms are significantly associated with risk even after controlling for use of antioxidant vitamins, smoking, and increased body mass index.4
The primary target cell in geographic atrophy is not certain (e.g., photoreceptors, RPE, choriocapillaris). However, most histopathological studies suggest that RPE cell loss is the initial event, with ensuing photoreceptor cell death and choriocapillaris atrophy.5–8 Different mechanisms of RPE death have been proposed. Paradigms for disease onset include oxidative stress 9, 10, inflammation11, alterations in flow 12 and lipid assembly.13 Build-up of lipofuscin is another proposed paradigm in which the RPE cells lose their ability to phagocytose and die. Lipofuscin granules accumulate with age and by 70 years of age, may occupy 20–33% of the cytoplasmic space in the RPE and may interfere with normal cellular mechanisms.14 Once cell death occurs, cellular products are then phagocytosed by neighboring RPE cells. Nearby cells migrate and increase in surface area in attempts to maintain integrity of blood-retinal barrier. This results in thinned, hypopigmented cells adjacent to focal hyperpigmentation. Eventually, these cells can no longer stretch to fill the gap and atrophy results.15
There is, however, some evidence that suggests that the photoreceptors (PR) may play a key role in GA onset and progression.16–18 GA progression is best studied in the junctional zone at the margin of intact and dead RPE. By examining the relationships of the photoreceptors-RPE complex in vivo, some of these pathologic changes may be quantified. We have used in vivo imaging with spectral domain optical coherence tomography (SDOCT) in attempts to further clarify the sequence of degeneration in GA.
Imaging of GA
Until the advent of optical coherence tomography (OCT) imaging, classifying the AMD phenotype has been limited to en face evaluation with imaging such as color photos and fundus autofluorescence.19–22 Clinical OCT units are reasonable in identifying retinal thickness in eyes with a normal PR-RPE interface; however, current time-domain clinical OCT imaging is limited when attempting to image focal disease changes at the PR-RPE interface. In particular, limitations in resolution, limitations in areas of the macula that are sampled, artifactual deformation of retinal layers resulting from patient movement, lack of contrast between adjacent tissues, limited signal from deeper structures at this interface, and artifact induced by image processing for scan alignment all hinder detection of pathology.
To our knowledge no study has been performed using an SDOCT system to assess photoreceptor loss relative to GA margins in non-neovascular AMD. SDOCT is the logical choice for this study as it provides superior resolution and image quality of photoreceptor changes compared to standard time domain OCT. The enhanced superluminescent diode allows for improved axial resolution, and with 40x faster data acquisition, there is less motion artifact. Compared with time domain OCT, SDOCT provides for improved light source bandwidth and signal processing, improved density of optical sampling, and improved characterization of PR-RPE interface and intraretinal structures.
The purpose of this study is to determine if SDOCT can be used to characterize PR loss relative to GA margins. If PR loss is the initiating event in GA, then SDOCT images should in theory show PR loss preceding RPE loss with PR loss occurring entirely outside GA margins. In contrast, if RPE loss is the initiating event in GA, then SDOCT images should show RPE loss preceding PR loss and in this case may show PR loss entirely within the GA margin.
Materials and Methods
Data Source
Consecutive cases from the clinic population were evaluated at the Duke Eye Center by two vitreoretinal faculty (CT,SB). Patients were invited for inclusion in the study if they had non-neovascular AMD with GA in one or both eyes. Patients with other macular pathology were excluded from the study. Data was recorded from 1/3/06 to 6/3/07. This study was approved by the Duke University Medical Center Institutional Review Board and is Health Insurance Portability and Accountability Act (HIPAA) compliant. Informed consent was acquired from each study subject.
14 eyes from 10 patients were scanned. One patient (one eye) was excluded because of poor image quality. For patients with both eyes meeting enrollment criteria, the eye with the better image quality on summed voxel projection (SVP) was chosen. Nine eyes from 9 patients were included in the final analysis.
SDOCT System
The SDOCT system used for the study is an investigational device developed by Dr. Joseph Izatt (Bioptigen Inc., Research Triangle Park, NC). The system uses a superluminescent diode (SLD) light source developed by Superlum Diodes, Ltd. (Moscow, Russia) with a center wavelength of 840 nm and a bandwidth of 49 nm. The power delivered to each eye is 500 +/− 50 μW and is well below the ANSI safety exposure limit of 700 μW over 8 hours. Axial resolution of the system is 4.5 μm, transverse resolution is diffraction limited to approximately 15 μm, and scan velocity is 20,000 A-scans per second.
Image Acquisition
Each eye was scanned with the SDOCT system to generate a series of 100 horizontal B-scans. This “stack” of B-scans is composed of 1000 A-scans per B-scan in a raster pattern taken in 0.75 seconds. The scanned area was centered on the fovea and was either 10 mm × 10mm, or 12mm × 10 mm. All measurements were translated from pixels to microns for comparison. Bioptigen software (v1.4; Bioptigen Inc., Research Triangle Park, NC) was used for scanning and image acquisition. The stacks of 100 horizontal cross sections were imported into Image J (freeware Java version; National Institutues of Health; Bethesda, MD) for analysis. B-scans were registered using a registration program (Stackreg plugin, Biomedical Imaging Group, Swiss Federal Institute of Technology, Lausanne) for Image J. A summed voxel projection (SVP) was created by collapsing the stack of 100 B-scans on a 10x10 mm area on the depth axis.23
Grading Technique
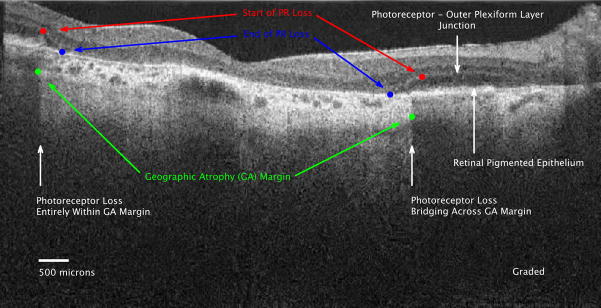
The series of 100 B-scans for each eye was evaluated by two of four graders independently. Each grader was masked to the other grader. B-scans with poor resolution of retinal layers were excluded. The following features were marked and recorded: (see Figures 1 and 2):
Figure 1.
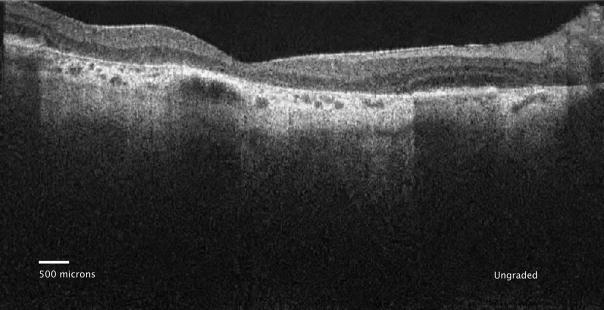
Figure 1a: Ungraded spectral domain optical coherence tomography (SDOCT) image of geographic atrophy (GA) with declining overlying photoreceptor (PR) layer associated with the left and right GA margins.
Figure 1b: Graded SD OCT image of GA margin and declining PR layer at the margin. The PR nuclear layer is the hyporeflective (darker) layer between the hyperreflective outer plexiform layer and the retinal pigment epithelium (RPE) (between the white arrows). In the normal eye, the photoreceptor inner segment to outer segment junction is visible as a separate hyperreflective band above the RPE. In this eye, that band is not clearly seen. This is the same image as Figure 1A, but graded features include: 1) Start of PR loss (RED dots), 2) GA margins (GREEN dots), 3) End of PR loss (BLUE dots). The PR layer progressively thins starting at the red dot at each border of the GA until absent at the blue dot. The PR loss is categorized as entirely inside the GA margin on the left, and as bridging across the GA margin on the right. The PR layer is absent between the blue dots, thus the outer plexiform layer is located over Bruch’s membrane. The SDOCT signal is particularly bright in the choroid and extends deeper into the choroid between the green dots where there is no RPE pigment to shadow.
Figure 2.
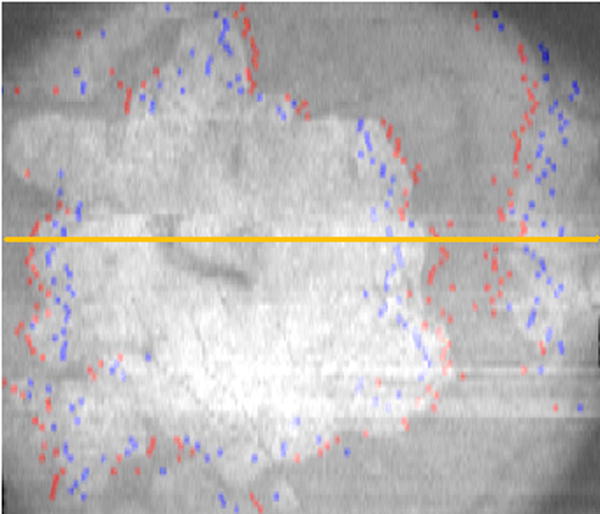
The stack of marked spectral domain optical coherence tomography (SDOCT) scans are summed (averaged) along the z-axis to produce the summed voxel projection (SVP). The multiple sites of markings correspond to the start (RED dots) and end (BLUE dots) of photoreceptor (PR) loss, with the majority of the sites of start of PR loss outside the area of geographic atrophy (GA). The area of absent pigmentation from the retinal pigment epithelium (RPE), i.e. GA, (which corresponds to the area of increased choroidal signal between the green dots in figure 1b) appears white on the SVP. This maps out the area of GA as imaged on SDOCT.
Start of PR loss: The hyperreflective outer plexiform layer (OPL) was considered the inner-most extent of the photoreceptor layer, and the start of OPL decline towards Bruch’s membrane was considered the start of photoreceptor loss. This point was marked with a red dot. The horizontal location (position on x-axis) of this point was also recorded.
GA margin: The GA margin was defined as an abrupt transition from a hyporeflective to hyperreflective area in the choriocapillaris below Bruch’s membrane on B-scan. This point suggests a transition from intact to absent pigmentation of RPE. The GA margin was marked with a green dot and the horizontal position (position on x-axis) of this point was also recorded.
End of PR loss: This was considered the point where all photoreceptor nuclei, inner, and outer segments were lost. This point was marked with a blue dot. The horizontal location (position on x-axis) of this point was recorded.
Graders were instructed not to mark features that were unclear. Only the most nasal and most temporal margins of distinct geographic atrophy were considered for analysis. Central lesions within GA were not included because these lesions may have an attenuated PR layer from surrounding GA. Only B-scans with reliable markings of all three components (start of PR loss, GA margin, and end of PR loss) were included in the final analysis. All B-scans and data points were then reviewed to ensure accuracy.
Statistical Methods
Determination of the category of PR loss (bridging across GA margins, entirely within GA margins, or entirely outside GA margins) and horizontal distances from the start and end of PR losses to the GA margin were determined. Frequency of these categories of PR loss was calculated. Also, frequency of scans where start of PR loss was inside, outside or at the GA margin, and frequency of scans where end of PR loss was inside, outside, or at GA margin were analyzed. Interobserver agreement was calculated with kappa statistic for qualitative variables and intraclass correlation for quantitative variables.
To create a single assessment of each eye for the descriptive analysis, a “combined grader” composite of unique B-scans from both graders was created in SAS. The first instance of a unique B-scan marked by either grader was used for frequency statistics. Agreement was determined using calculations from both graders. Calculations were performed using SAS (version 8.1, SAS Institute, Cary, NC).
Results
Patient Characteristics
Seven of 9 patients were female, and ages ranged from 57 to 80 years old. All had geographic atrophy secondary to non-neovascular AMD, and had no evidence of other macular disease. Of the 9 eyes included in the analysis, 6 were phakic and 3 were pseudophakic.
Descriptive and Frequency Analysis
Category of PR loss (bridging across GA margins, entirely within GA margins, or entirely outside GA margins)
We analyzed 500 scans across unique sites of margins of GA. In 325 of these scans (65%) PR loss occurred bridging across the GA margin. Less frequently but also commonly, in 147 scans (29%) PR loss occurred entirely inside GA margins. In only 28 scans (6%), PR loss occurred entirely outside GA margins. This is demonstrated in Table 1. Interestingly, in 5 of the 9 eyes studied, all 3 types of PR loss occurred concurrently on different B-scans. Using GA size measurements obtained from digital autofluorescence images, there was no relationship between size (mm2) of geographic atrophy and type of PR loss. This assessment is limited by small sample size.
Table 1.
Categories of Photoreceptor Loss: Frequency and Percent in Each Category
| Patient | Geographic Atrophy Area (mm2) | Eye | Total | PR Loss Entirely Inside GA Margin N(%) | PR Loss Entirely Outside GA Margin N(%) | PR Loss Bridging Across GA Margin N(%) |
|---|---|---|---|---|---|---|
| 1 | 0.02 | OS | 3 | 0 (0) | 0 (0) | 3 (100) |
| 2 | 1.20 | OD | 20 | 0 (0) | 2 (10) | 18 (90) |
| 3 | 2.00 | OD | 49 | 6 (12) | 9 (18) | 34 (69) |
| 4 | 5.10 | OD | 50 | 11 (22) | 0 (0) | 39 (78) |
| 5 | 10.30 | OD | 38 | 3 (8) | 0 (0) | 35 (92) |
| 6 | 14.36 | OD | 53 | 28 (53) | 1 (2) | 24 (45) |
| 7 | 25.60 | OD | 176 | 60 (34) | 5 (3) | 111 (63) |
| 8 | 26.10 | OS | 87 | 33 (38) | 10 (11) | 44 (51) |
| 9 | 35.90 | OD | 24 | 6 (25) | 1 (4) | 17 (71) |
| Total | 500 | 147 (29) | 28 (6) | 325 (65) |
Categories of photoreceptor (PR) loss relative to geographic atrophy (GA) area and GA margin. PR loss occurred entirely inside, entirely outside, or bridging across the GA margin. The most frequent category of PR loss was bridging across the GA margin. Patients ordered by increasing GA area. OD = right eye; OS = left eye.
Horizontal distances
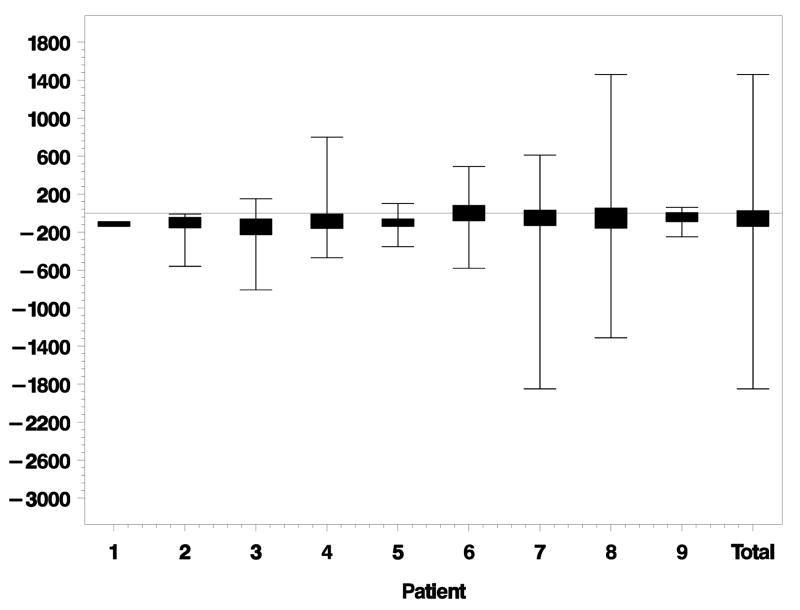
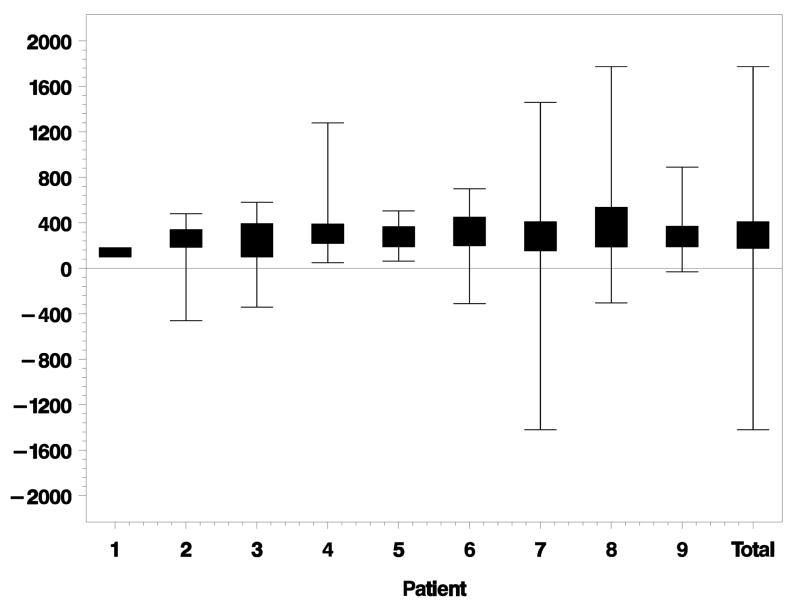
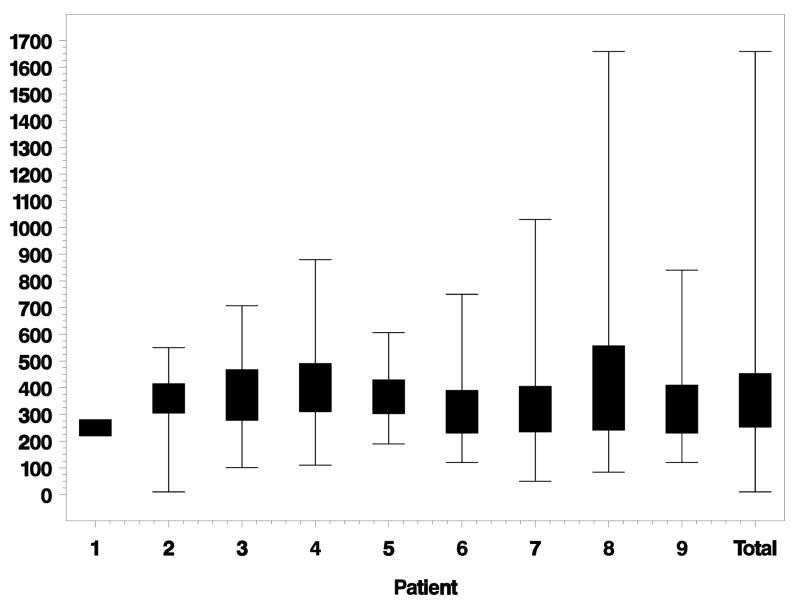
PR loss started an average of 61 μm [standard deviation (SD) ± 235 μm] outside of the GA margin. Figure 3 depicts lateral distances between the beginning of PR loss and GA margin for each eye individually. PR loss ended an average of 311 μm (SD ± 273 μm) inside the GA margin. Figure 4 depicts the lateral distances between ending of PR loss and GA margin for each eye. Total lateral distances between beginning and ending of PR loss for each eye is shown in Figure 5. The average distance between beginning and ending of PR loss for all eyes was 372 μm (SD ± 179 μm).
Figure 3.
Lateral distance (microns) from beginning of photoreceptor (PR) loss to geographic atrophy (GA) margin for each eye individually. Negative distances are outside the GA margin. Positive distances are inside the GA margin. Eyes ordered by increasing GA size. Total is the combined data of all eyes together.
Figure 4.
Lateral distance (microns) from ending of photoreceptor (PR) loss to geographic atrophy (GA) margin for each eye individually. Negative distances are outside the GA margin. Positive distances are inside the GA margin. Eyes ordered by increasing GA size. Total is the combined data of all eyes together.
Figure 5.
Lateral distance (microns) from beginning of photoreceptor (PR) loss to ending of PR loss for each eye individually. Eyes ordered by increasing geographic atrophy (GA) size. Total is the combined data of all eyes together.
Interobserver Agreement
The interobserver agreement study included 199 scan sites that were scored by 2 graders. Table 2 shows agreement on type of PR loss between observer 1 and 2. Observers agreed on the category of PR loss (bridging, inside, outside) only 59% of the time (kappa statistic 0.23). This poor agreement on the category of PR loss led to a further analysis of agreement on the beginning of PR loss and on the ending of PR loss separately and their relationships to the GA margin.
Table 2.
Interobserver Agreement (Percent and Kappa Statistic) on Category of Photoreceptor Loss
| Observer 2 | |||||
|---|---|---|---|---|---|
| Inside | Outside | Bridging | Total | ||
| Observer 1 | Inside | 42 | 1 | 21 | 64 |
| Outside | 4 | 1 | 2 | 7 | |
| Bridging | 51 | 2 | 75 | 128 | |
| Total | 97 | 4 | 98 | 199 | |
| Total Pairs | Total Agreement | Percent Agreement |
|---|---|---|
| 199 | 118 | 59.3 |
| Statistic | Value | Standard Error | 95% Confidence Limits | 95% Confidence Limits |
|---|---|---|---|---|
| Kappa | 0.2258 | 0.0616 | 0.1051 | 0.3466 |
Photoreceptor (PR) loss categories were inside, outside, or bridging across the geographic atrophy (GA) margin.
Frequency of agreement on category of PR loss was largely dependent on agreement of the beginning of PR loss as opposed to ending of PR loss for the following reasons: first, the beginning of PR loss was very close to the GA margin (Figure 3), and second, interobserver agreement on location of beginning of PR loss was only 59% (Table 3). The ending of PR loss was much further from the GA margin and therefore less likely to influence PR loss categories, as demonstrated in Figure 4. This is evidenced by the high interobserver agreement on the end of PR loss relative to the GA margin (inside, at, or outside the GA margin), which was 95% (Table 4).
Table 3.
Interobserver Agreement on Location of Beginning of Photoreceptor Loss
| Observer 2 | |||||
|---|---|---|---|---|---|
| Negative: Outside GA Margin | Zero: At GA Margin | Positive: Inside GA Margin | Total | ||
| Observer 1 | Negative: Outside GA Margin | 74 | 3 | 51 | 128 |
| Zero: At GA Margin | 2 | 1 | 4 | 7 | |
| Positive: Inside GA Margin | 20 | 2 | 42 | 64 | |
| Total | 96 | 6 | 97 | 199 | |
| Total Pairs | Total Agreement | Percent Agreement |
|---|---|---|
| 199 | 117 | 58.8 |
Photoreceptor (PR) loss began outside the geographic atrophy (GA) margin (negative distance), at the GA margin (zero distance), or inside the GA margin (positive distance).
Table 4.
Interobserver Agreement on Ending of Photoreceptor Loss
| Observer 2 | |||||
|---|---|---|---|---|---|
| Negative: Outside GA Margin | Zero: At GA Margin | Positive: Inside GA Margin | Total | ||
| Observer 1 | Negative: Outside GA Margin | 1 | 0 | 6 | 7 |
| Zero: At GA Margin | 0 | 0 | 2 | 2 | |
| Positive: Inside GA Margin | 3 | 0 | 187 | 190 | |
| Total | 4 | 0 | 195 | 199 | |
| Total Pairs | Total Agreement | Percent Agreement |
|---|---|---|
| 199 | 188 | 94.5 |
Photoreceptor (PR) loss ended outside the geographic atrophy (GA) margin (negative distance), at the GA margin (zero distance), or inside the GA margin (positive distance).
Interobserver agreement for quantitative characteristics of PR loss relative to GA margins was performed using intraclass correlation. Intraclass correlation for agreement on horizontal distance between the beginning of PR loss and the GA margin was 0.26 (Table 5). Intraclass correlation for agreement on horizontal distance between the ending of PR loss and the GA margin was 0.36 (Table 6). These calculations were performed in pixels to remove the effect of scaling to microns. These relatively low intraclass correlations suggest poor agreement on quantitative measurements between beginning of PR loss, ending of PR loss, and GA margins.
Table 5.
Agreement (Intraclass Correlation) on Distance Between the Beginning of Photoreceptor (PR) Loss and the Geographic Atrophy (GA) Margin
| Assessment | Intraclass Correlation | Lower Confidence Limit | Upper Confidence Limit |
|---|---|---|---|
| Beginning of PR loss to GA Margin (pixels) | 0.26 | 0 | 0.75 |
Table 6.
Agreement (Intraclass Correlation) on Distance Between the Ending of Photoreceptor (PR) Loss and the Geographic Atrophy (GA) Margin
| Assessment | Intraclass Correlation | Lower Confidence Limit | Upper Confidence Limit |
|---|---|---|---|
| Ending of PR loss to GA Margin (pixels) | 0.36 | 0 | 0.79 |
Discussion
Summary of Analysis
To the best of our knowledge, this is the first study of GA margins using high-resolution cross sectional images acquired with the SDOCT. Most PR loss occurred while bridging across the GA margin (65% of graded scans). Although SDOCT is useful in delineating morphologic relationships, it does not provide information regarding cellular function or intercellular signaling. Thus, this morphologic finding does not isolate the initiating event in GA as either PR loss or RPE loss. This finding does, however, emphasize the intimate relationship between PR loss and RPE loss in geographic atrophy.
In the setting of GA, RPE loss may occur first with PR loss occurring quickly thereafter. This would tend towards PR loss occurring primarily within the GA margins. This model would support past histopathological studies which suggest that RPE cell loss is the initiating event, with ensuing photoreceptor cell death and choriocapillaris atrophy.5–8 While 29% of the scans demonstrated this pattern, this does not explain why PR loss commonly extends outside the margin as well. We theorize that PR loss likely continues beyond these GA borders of intact RPE to where the RPE is dysfunctional. This would lead to the bridging type of PR loss that we noted most frequently.
If PR loss is the initiating event with ensuing RPE loss, the appearance of PR loss bridging across GA the margin may reflect the leading edge of PR loss. RPE loss may follow loss of PR and scans might demonstrate a declining PR layer persisting within the GA margin. If this were the case however, one would expect a higher frequency of PR loss completely outside the GA margin. This pattern was noted least frequently in our study, with only 6% of scans demonstrating this pattern.
Interestingly, all three types of PR loss frequently occurred within the same eye and may represent different stages of atrophy or progression rates in different areas of the same GA lesion. There was no apparent relationship between types of PR loss and the size of geographic atrophy.
PR loss started an average of 61 μm (SD ± 235 μm) outside the GA margin. On the SDOCT B-scans themselves, this corresponded to 5 or 6 pixels for 12 or 10 mm scans respectively. This was a relatively short distance to measure. As shown in Figure 3, the average location of the beginning of PR loss for each eye was very close to the GA margin, with distributions ranging both inside and outside the GA margin.
PR loss ended an average of 311 μm (SD ± 273 μm) inside the GA margin. On the SDOCT B-scans themselves, this corresponded to 25 or 31 pixels for 12 or 10 mm scans respectively. As shown in Figure 4, the average ending of PR loss for each eye was further from the GA margin than the average beginning of PR loss; however, a few scans still had negative values indicating a location outside the GA margin.
Interobserver Agreement
The relatively low interobserver agreement (59%) on the beginning of PR loss (inside, at, or outside the GA margin) may be explained by the difficulty of pinpointing this site along a gradually sloping curve as well as by the proximity of the beginning of PR loss relative to the GA margin (61 μm). This difficulty in marking is reflected by poor agreement (intraclass correlation 0.26).
In contrast, the high interobserver agreement (95%) on the ending of PR loss (inside, at, or outside GA margin) may be explained by the easier task of identifying an intersection of two hyperreflective lines (the OPL and Bruch’s membrane) usually well within the GA margin (311 μm on average). However the precise ending of PR loss can, at times, be unclear because of cellular debris surrounding its location. This may also be seen in histopathologic studies of GA.5, 24 On SDOCT B-scans, this cellular debris can be seen as a widening of the hyperreflectivity at the ending of the PR layer. This increase in hyperreflectivity may make grading more difficult. This is reflected in the low intraclass correlation (0.36) for agreement on the exact location of ending of PR loss.
Interobserver agreement on category of PR loss (inside, outside, bridging) is dependent on the location of both the beginning and ending of PR loss. As such, the low interobserver agreement on type of PR loss was influenced by the poor agreement on where PR loss began, and not the high agreement on where PR loss ended. Interobserver agreement for category of PR loss (59.3%) very closely reflected the agreement on beginning of PR loss (58.8%).
SDOCT Comparison with Other Methods of Imaging
SDOCT can provide imaging of intra-retinal layers in ways that approach that of histopathologic studies without postmortem or tissue processing artifact. In the setting of GA, SDOCT provides unique cross sectional information compared with en face views provided by fundus photography, fluorescein angiography, and fundus autofluorescence. Margins of GA are easily identified by summed voxel projection on SDOCT, and B-scan cross sections provide another method of tracking GA. SDOCT also provides for better resolution, faster image acquisition, and decreased light exposure compared with time domain OCT.
SDOCT Limitations and Areas for Improvement
Limitations with our current SDOCT system include lateral resolution of 10–15 μm and low contrast in pixel intensities among the retinal structures studied. This likely also contributed to the low interobserver agreement in this study. Different methods of image capture, summation, and image processing may improve the resolution, reliability, and reproducibility of retinal layer measurements by the SDOCT system.
Future Directions
This study demonstrates that SDOCT is another method of assessing GA. B-scans of PR losses relative to GA margins can be graded for qualitative and quantitative analysis. To our knowledge, this is the first study of the PR-RPE interface in GA using SDOCT.
As this study was performed in eyes with known GA, it was not designed to detect early GA. However, SDOCT may provide another means of identifying changes at earlier stages of GA, tracking disease progression within the PR and RPE, and monitoring cell survival around GA margins in response to therapy.
Acknowledgments
Competing Interests and Funding: Authors with financial interests or relationships to disclose are listed after the references. This work has been supported by NIH R21EY017393, NIH Small Business Investigational Grant Subcontract from Bioptigen Inc., NC Biotechnology Center Collaborative Funding Grant #2007-CFG-8005, and NEI 1K23 EY018895-01.
The authors wish to thank Sina Farsiu, PhD, for providing denoised images for this publication.
Footnotes
Presented in part at: American Academy of Ophthalmology Annual Meeting, November 2007, New Orleans, Louisiana.
Publisher's Disclaimer: This is a PDF file of an unedited manuscript that has been accepted for publication. As a service to our customers we are providing this early version of the manuscript. The manuscript will undergo copyediting, typesetting, and review of the resulting proof before it is published in its final citable form. Please note that during the production process errors may be discovered which could affect the content, and all legal disclaimers that apply to the journal pertain.
References
- 1.Eye Diseases Prevalence Research Group. Prevalence of age-related macular degeneration in the United States. Arch Ophthalmol. 2004;122:564–72. doi: 10.1001/archopht.122.4.564. [DOI] [PubMed] [Google Scholar]
- 2.Postel EA, Agarwal A, Caldwell J, et al. Complement factor H increases risk for atrophic age-related macular degeneration. Ophthalmology. 2006;113:1504–7. doi: 10.1016/j.ophtha.2006.02.049. [DOI] [PubMed] [Google Scholar]
- 3.Sepp T, Khan JC, Thurlby DA, et al. Complement factor H variant Y402H is a major risk determinant for geographic atrophy and choroidal neovascularization in smokers and nonsmokers. Invest Ophthalmol Vis Sci. 2006;47:536–40. doi: 10.1167/iovs.05-1143. [DOI] [PubMed] [Google Scholar]
- 4.Seddon JM, Francis PJ, George S, et al. Association of CFH Y402H and LOC387715 A69S with progression of age-related macular degeneration. JAMA. 2007;297:1793–800. doi: 10.1001/jama.297.16.1793. [DOI] [PubMed] [Google Scholar]
- 5.Dunaief JL, Dentchev T, Ying GS, Milam AH. The role of apoptosis in age-related macular degeneration. Arch Ophthalmol. 2002;120:1435–42. doi: 10.1001/archopht.120.11.1435. [DOI] [PubMed] [Google Scholar]
- 6.Hageman GS, Luthert PJ, Victor Chong NH, et al. An integrated hypothesis that considers drusen as biomarkers of immune-mediated processes at the RPE-Bruch’s membrane interface in aging and age-related macular degeneration. Prog Retin Eye Res. 2001;20:705–32. doi: 10.1016/s1350-9462(01)00010-6. [DOI] [PubMed] [Google Scholar]
- 7.Lutty G, Grunwald J, Majji AB, et al. Changes in choriocapillaris and retinal pigment epithelium in age-related macular degeneration. [Accessed February 26, 2009];Mol Vis. [serial online] 1999;5:35. Available at: http://www.molvis.org/molvis/v5/a35/ [PubMed]
- 8.McLeod DS, Taomoto M, Otsuji T, et al. Quantifying changes in RPE and choroidal vasculature in eyes with age-related macular degeneration. Invest Ophthalmol Vis Sci. 2002;43:1986–93. [PubMed] [Google Scholar]
- 9.Espinosa-Heidmann DG, Suner IJ, Catanuto P, et al. Cigarette smoke-related oxidants and the development of sub-RPE deposits in an experimental animal model of dry AMD. Invest Ophthalmol Vis Sci. 2006;47:729–37. doi: 10.1167/iovs.05-0719. [DOI] [PubMed] [Google Scholar]
- 10.Beatty S, Koh H, Phil M, et al. The role of oxidative stress in the pathogenesis of age-related macular degeneration. Surv Ophthalmol. 2000;45:115–34. doi: 10.1016/s0039-6257(00)00140-5. [DOI] [PubMed] [Google Scholar]
- 11.Anderson DH, Mullins RF, Hageman GS, Johnson LV. A role for local inflammation in the formation of drusen in the aging eye. Am J Ophthalmol. 2002;134:411–31. doi: 10.1016/s0002-9394(02)01624-0. [DOI] [PubMed] [Google Scholar]
- 12.Moore DJ, Hussain AA, Marshall J. Age-related variation in the hydraulic conductivity of Bruch’s membrane. Invest Ophthalmol Vis Sci. 1995;36:1290–7. [PubMed] [Google Scholar]
- 13.Malek G, Li CM, Guidry C, et al. Apolipoprotein B in cholesterol-containing drusen and basal deposits of human eyes with age-related maculopathy. Am J Pathol. 2003;162:413–25. doi: 10.1016/S0002-9440(10)63836-9. [DOI] [PMC free article] [PubMed] [Google Scholar]
- 14.Feeney-Burns L, Hilderbrand ES, Eldridge S. Aging human RPE: morphometric analysis of macular, equatorial, and peripheral cells. Invest Ophthalmol Vis Sci. 1984;25:195–200. [PubMed] [Google Scholar]
- 15.Sarks JP, Sarks SH, Killingsworth MC. Evolution of geographic atrophy of the retinal pigment epithelium. Eye. 1988;2:552–77. doi: 10.1038/eye.1988.106. [DOI] [PubMed] [Google Scholar]
- 16.Cahill MT, Mruthyunjaya P, Bowes Rickman C, Toth CA. Recurrence of retinal pigment epithelial changes after macular translocation with 360 degrees peripheral retinectomy for geographic atrophy. Arch Ophthalmol. 2005;123:935–8. doi: 10.1001/archopht.123.7.935. [DOI] [PubMed] [Google Scholar]
- 17.Curcio CA, Medeiros NE, Millican CL. Photoreceptor loss in age-related macular degeneration. Invest Ophthalmol Vis Sci. 1996;37:1236–49. [PubMed] [Google Scholar]
- 18.Johnson PT, Brown MN, Pulliam BC, et al. Synaptic pathology, altered gene expression, and degeneration in photoreceptors impacted by drusen. Invest Ophthalmol Vis Sci. 2005;46:4788–95. doi: 10.1167/iovs.05-0767. [DOI] [PubMed] [Google Scholar]
- 19.Age-Related Eye Disease Study Research Group. The Age-Related Eye Disease Study system for classifying age-related macular degeneration from stereoscopic color fundus photographs: the Age-Related Eye Disease Study report number 6. Am J Ophthalmol. 2001;132:668–81. doi: 10.1016/s0002-9394(01)01218-1. [DOI] [PubMed] [Google Scholar]
- 20.Sunness JS, Bressler NM, Tian Y, et al. Measuring geographic atrophy in advanced age-related macular degeneration. Invest Ophthalmol Vis Sci. 1999;40:1761–9. [PubMed] [Google Scholar]
- 21.Sunness JS, Margalit E, Srikumaran D, et al. The long-term natural history of geographic atrophy from age-related macular degeneration: enlargement of atrophy and implications for interventional clinical trials. Ophthalmology. 2007;114:271–7. doi: 10.1016/j.ophtha.2006.09.016. [DOI] [PMC free article] [PubMed] [Google Scholar]
- 22.Holz FG, Bellman C, Staudt S, et al. Fundus autofluorescence and development of geographic atrophy in age-related macular degeneration. Invest Ophthalmol Vis Sci. 2001;42:1051–6. [PubMed] [Google Scholar]
- 23.Stopa M, Bower BA, Davies E, et al. Correlation of pathologic features in spectral domain optical coherence tomography with conventional retinal studies. Retina. 2008;28:298–308. doi: 10.1097/IAE.0b013e3181567798. [DOI] [PubMed] [Google Scholar]
- 24.Green WR, Key SN., III Senile macular degeneration: a histopathologic study. 1977. Retina. 2005;25(suppl):180–250. discussion 250–4. [PubMed] [Google Scholar]


