

Abstract
Carbohydrate antigen arrays (glycan arrays) have been recently developed for the high-throughput analysis of carbohydrate macromolecule interactions. When profiling serum, information about experimental variability, inter-individual biological variability, and intra-individual temporal variability is critical. In this report, we describe the characterization of a carbohydrate antigen array and assay for profiling human serum. Through optimization of assay conditions and development of a normalization strategy, we obtain highly reproducible results with a within-experiment coefficient of variation (CV) of 10.8% and an overall CV (across multiple batches of slides and days) of 28.5%. We also report antibody profiles for 48 human subjects and evaluate for the first time the effects of age, race, sex, geographic location, and blood type on antibody profiles for a large set of carbohydrate antigens. We found significant dependence on age and blood type of antibody levels for a variety of carbohydrates. Finally, we conducted a longitudinal study with a separate group of 7 serum donors to evaluate the variation in anti-carbohydrate antibody levels within an individual over a period ranging from 3 to 13 weeks and found that, for nearly all antigens on our array, antibody levels are generally stable over this period. The results presented here provide the most comprehensive evaluation of experimental and biological variation reported to date for a glycan array and have significant implications for studies involving human serum profiling.
Keywords: Glycan array, carbohydrate antigens, serum antibodies, microarray, variability, normalization
Introduction
Serum antibodies are an important class of biomarkers. In clinical medicine, specific antibodies are commonly monitored for the diagnosis of diseases such as HIV, malaria, and autoimmune diseases. Antibodies are also an important element of an immune response and are routinely used to evaluate responses to vaccines, clinical procedures, and other treatments. In basic and preclinical research, serum antibody profiling can facilitate the discovery of new antigens and guide vaccine design. A variety of high-throughput approaches, including SEREX,1 phage display,2, 3 and peptide/protein arrays,4, 5 have been developed to identify disease specific antibodies to protein and peptide antigens from the repertoire of antibodies present in serum. Carbohydrates are an equally important, though largely underappreciated, class of antigens. Antibodies to carbohydrates play a direct role in many clinical areas including blood transfusions, organ transplants, and responses to vaccines. Antibodies to carbohydrates also have tremendous potential as diagnostic and prognostic markers (for some recent examples see 6-9). Traditional methods used to study carbohydrate-protein interactions, however, can be slow and/or require large amounts of material. For this reason, most studies have been restricted to a small number of carbohydrate antigens that are readily available in large quantities.
Recently, carbohydrate arrays (also referred to as glycan arrays) have emerged as powerful tools for evaluating binding of lectins, monoclonal antibodies, whole cells, viruses, and serum antibodies to carbohydrates.10-13 Carbohydrate arrays are analogous to protein and DNA arrays but contain many different glycans immobilized on a solid support in a spatially defined arrangement. The microarray format permits analysis of many potential binding interactions while using only minimal amounts of material. In recent years, carbohydrate arrays have seen applications in comparative human serum profiling.14-20 These studies use carbohydrate arrays to screen for differences in the serum antibody profiles between groups of individuals or within individuals who have undergone some treatment or exposure.
Three key issues for the successful application of carbohydrate microarray technology to serum profiling can be identified. First, it is essential to determine the technical/experimental variability of the assay. Without this information, one cannot determine whether observed changes or differences are real or artifactual. Microarray profiling is highly susceptible to experimental variability, and this issue is especially important for carbohydrate microarrays since they are a newer technology with limited validation. Most of the reports on glycan array reproducibility have focused on purified lectins or monoclonal antibodies and their binding to a small subset of array components. Human serum, however, contains a complex mixture of proteins, small molecules, and non-carbohydrate antibodies, which all contribute to variability and noise. For this reason, it is critical to assess variability with the target sample, human serum. To date, only one report regarding reproducibility with serum has been published for a carbohydrate array.21 In the study, the authors reported variability of signals for one component, Rha-α, using a single pooled serum sample of 10 individuals. Coefficient of variation (CV) values of 7-8% and 21-22% were reported for spot-to-spot and inter-slide measurements, respectively. It is not clear that reproducibility measurements for one component are applicable to other array components. Moreover, variability is typically highest between batches of array slides. No information was reported regarding batch-to-batch variability. Since variability may also depend on the serum sample, ideally one should test multiple serum samples and examine variability for as many array components as possible. Therefore, more comprehensive and systematic studies on bias, reproducibility, and the relationship between variability and carbohydrate structure for assays with serum are needed.
The second key issue is understanding biological variability. Information regarding the natural range and distribution of antibodies within a group of subjects is crucial for identifying disease related antibodies/profiles as biomarkers and for selecting appropriate control groups. Assessment is usually carried out by conducting pilot studies on sample groups, often comprised of healthy donors. For human serum profiling, many factors such as differences in lifestyle, exposure to pathogens, genetics, health, race, sex, age, and blood type could contribute to biological variability. Several research groups have conducted pilot studies involving evaluating human serum from healthy individuals on a carbohydrate array.15, 16, 21-24 However, the published studies have involved a limited number of serum samples, a limited number of carbohydrate antigens, or both. Furthermore, little or no information was provided regarding the donors. For example, 10 human serum samples were evaluated on a carbohydrate array of about 200 carbohydrates.22 The authors found antibody levels were “remarkably consistent among samples from 10 individuals”; however, it was not clear if a larger, more diverse set of serum samples would show similar consistency. Other studies have made use of pooled samples in evaluating anti-carbohydrate antibody levels in human serum.23, 25 Although convenient, pooling can obscure actual biological variance within the group. For example, individuals typically have high or low levels of antibodies to blood group A or B oligosaccharides depending on their blood type. A pooled sample, however, has an intermediate level of antibodies for both blood group antigens.
Finally, it is important to measure variations in the antibody levels in a healthy individual that occur over time and determine whether any differences observed are carbohydrate dependent. This is especially relevant when studying changes in an individual resulting from exposure to a pathogen, development of a disease, or response to treatment or immunization. One study aimed at this objective has been published. Dotan and coworkers23 report a longitudinal study showing anti-carbohydrate antibody profiles for 3 carbohydrate antigens in 7 individuals. With this small set of antigens, it is difficult to gain a broad view of temporal fluctuations. Furthermore, little or no information was reported regarding reproducibility, bias, and normalization in the context of assaying human serum.
We have previously described the development of a carbohydrate microarray in our laboratory.26-32 The array used for this study contained 128 different components including 98 structurally defined synthetic carbohydrates [as bovine serum albumin (BSA)/human serum albumin (HSA) conjugates], 24 natural glycoproteins, and 6 controls (see Table S1 in Supporting information for a detailed list). Herein, we describe a systematic evaluation of experimental variability for our carbohydrate antigen microarray and design and implement an optimized assay, normalization method, and data processing protocol for obtaining reproducible measurements when conducting human serum profiling. We evaluate serum samples from a set of 48 healthy donors against all 122 antigens on the carbohydrate array. Associations between serum antibody levels and serum donor characteristics such as race, sex, blood type, age, and geographical location are evaluated. We also evaluate intra-individual variability of anti-carbohydrate antibody levels for 122 carbohydrate antigens in 7 healthy adults over periods ranging from 3 to 13 weeks, which allowed us to ascertain whether antibody levels are subject to temporal variations within this time frame.
Materials and Methods
Serum samples
Sera used for the longitudinal study were obtained from 7 healthy adult male donors through the Research Donor Program at the National Institutes of Health Clinical Center, Department of Transfusion Medicine. For other experiments, sera were purchased from Valley Biomedical Products and Services (Winchester, VA) and were accompanied by a certification that all samples were tested by an FDA-approved test and found to be negative for HBsAG, HIV 1/2, HIV-1 AG, or HIV-1 NAT, HCV, and Syphilis. The 48 samples for the healthy group profiling consist of 27 female and 21 male between the ages of 20 and 50, representing 2 geographical locations (Florida and Tennessee), 3 races (African-American, Caucasian, and Hispanic), and 4 primary blood types (A, B, AB, and O). Donor characteristics are described in Supplementary Table S2. All samples were stored at −20°C until use.
Carbohydrate microarray fabrictation and binding assay
Carbohydrate microarrays were fabricated as reported previously26 and in supporting information. Each of the 128 components was printed in duplicate in a 20 × 13 grid of 110 μm diameter spots. 16 complete arrays were printed on each slide. Printed slides were stored at −20°C until use. Printed slides were assembled on 16-well slide holders (Grace Bio-Labs, Bend, OR) and blocked with 3% BSA (w/v) in PBS overnight at 4°C, then washed 6 times with PBST0.05 [PBS with 0.05% (v/v) Tween 20 (Sigma-Aldrich, St. Louis, MO)]. Serum samples were diluted 1:50 in 3% BSA in PBST0.05. 100 μL of each serum dilution was added to arrays and allowed to incubate with gentle shaking at 100 rpm for 4 h at 37°C. Each sample was analyzed on duplicate slides within the same experiment. A reference sample (an unrelated healthy human serum sample) was also analyzed in one of the 16 wells on each slide (Supplementary Figure S1). After washing with PBST0.05, bound antibodies were detected by incubating with Cy3-conjugated goat anti-human IgA + IgG + IgM (H+L) (Jackson ImmunoResearch, West Grove, PA) in 3% HSA (w/v)/1% BSA (w/v) in PBS (2 μg/mL) at 37°C. After 2 h, slides were washed with PBST0.05, removed from holders, immersed in wash buffer for 5 min then centrifuged at 453g for 5 min.
Image processing and data analysis
Slides were scanned at 10 μm resolution with a Genepix 4000B microarray scanner (Molecular Devices Corporation, Union City, CA). Image analysis was carried out with Genepix Pro 6.0 analysis software (Molecular Devices Corporation). Spots were defined as circular features with a maximum diameter of 100 μm. Features were allowed to be resized as far as 70 μm as needed. Local background subtraction (median background) was performed. Initial data processing was performed with Microsoft Excel. The background-subtracted median pixel intensity feature was used for all analyses. Intensities above 50,000 were corrected using the algorithm of Lyng et al.33 (see supporting information for details).
For each component in each well, the average of duplicate spots was calculated to obtain a value for the well (array). The value was then normalized to the reference sample as described in the next section.
Data processing and median reference normalization
All data analyses described involving normalization, calculation of mean, standard deviation (SD), coefficient of variation (CV, defined as SD divided by mean expressed as a percent), or testing of associations of signal intensities with subject covariates were performed using the publicly available statistical programming language R (http://CRAN.R-project.org/, version 2.5.1). Plots were created using graphic routines in R or the scientific graphing and analysis software Origin 7.5 (OriginLab, Northampton, MA).
Starting with the averages of the duplicate spots for each carbohydrate in each array, the data were processed using the following steps. First, measurements that were flagged as unreliable by the image processing software were treated as “missing” in all data analyses, and then any intensity less than 150 was truncated (set) to 150, including those from the reference sample, to minimize the impact of the noisy measurements at the very low end of the intensity range. A scaling factor was computed for each slide based on the median of the reference sample (array) on that slide according to the formula: scaling factor = medianslide reference sample/10000. For the reference sample array, division of all intensities by this factor converts the median for that array to 10000. The individual intensities from the other 15 samples (arrays) on the same slide were then normalized by dividing by this same scaling factor. A log transformation (base 2) was applied to remove the basic trend of variance increasing with mean, but this could not completely remove the increased variance at the lowest intensities. Because each sample aliquot was split and run on duplicate slides within the same experimental batch, a single set of values was obtained by averaging the normalized log-transformed signals across these duplicates. The majority of analyses presented use the data normalized and log-transformed as just described. However, when reporting CVs, the calculations were performed on the untransformed normalized data in order to facilitate comparison with previous studies. Moreover, because the CV is calculated as the SD divided by the mean, it had a similar effect as the log transformation in creating a variability measure that was roughly constant across most of the intensity range.
Characterization of within-experiment variability
To assess within-experiment technical variability, 4 aliquots of one serum sample were made. Each aliquot was diluted 1:50 and 100 μL each were added to duplicate slides as described above. Each aliquot was considered to be independent of all others for data analyses. For each carbohydrate, the mean signal, SD, and CV across the 4 aliquots were calculated. Averages across all carbohydrates on the array were also calculated for each of these quantities. To calculate an average SD, the averaging was over the variances and then square root was applied to the resulting average variance.
Characterization of overall variability
To assess overall variability, measuring the combined effect of within- and between-experimental batch variability on the precision of the assay, we used 5 different serum samples. The samples were evaluated on slides from 3 different print batches in experiments conducted on 3 different days, respectively. Each serum sample was diluted 1:50 and 100 μL each were added to duplicate slides as described above. The evaluation of 5 different samples enabled us to determine whether overall variability is sample-dependent. For each carbohydrate, the mean signal, SD, and CV across the 3 different experiments were calculated for each sample. Separately for each of the 5 samples and also combining over all five samples, averages across all carbohydrates were calculated for each of these quantities. SD and CV were calculated as above.
Dilution study
Three different serum samples were each profiled at 1:50, 1:200, and 1:800 as described above. Signals below 150 where set to “missing” and not included in these dilution analyses. For each carbohydrate, the log signal was plotted as a function of the log dilution ratio and the slope of the regression line was determined, where a slope of 1 corresponds to a model in which signal response is proportional to concentration.
Characterization of biological variability in a group of 48 healthy individuals
Sera from 48 healthy donors were used in this portion of the study. Samples were evaluated on the carbohydrate microarray and the data was processed as described above. Hierarchical clustering was performed to separately cluster both carbohydrates and samples using the hclust function within the R statistical package, specifying average linkage and Euclidean distance metric. The clustering was performed both with and without median centering the data within each carbohydrate. For clustering samples, median centering of the carbohydrates has no effect if the distance metric being used to cluster samples is Euclidean distance (see supporting information). To test for associations between subject-specific covariates and signal intensity, the R functions lm (age) and aov (race, sex, geographic location, and blood type) were used to perform linear regression and analysis of variance, respectively.
Characterization of within-individual variability
Sera used in this portion of the study were collected from 7 healthy volunteers over periods ranging from 3 to 13 weeks. For 2 of the donors (Donors 1 and 7) samples were collected 3 times, while for the remaining 5 donors (Donors 2-6) samples were collected twice. Matched samples from the same donor were evaluated together in one experiment to preclude variability arising from different slide batches and runs. Samples were profiled and data was processed as described above. Having previously quantified the within-experiment (aliquot-to-aliquot) variance, we next identified differences that are greater than the baseline within-experiment variability. The following statistical argument was applied. If one looks at the difference between measurements from any two aliquots taken from one individual collected at the same time and run on slides in the same experimental batch, the variance of the difference should be 2×Varaliquot, assuming independence of aliquots. Therefore, the standard deviation of a between-aliquot difference should be when SDaliquot = 0.210 (average standard deviation across all carbohydrates as calculated above). Our rule was to flag between-aliquot differences as significantly larger than expected from typical aliquot-to-aliquot variation if those differences were bigger in absolute value than 3.29×0.297 = 0.977. The justification for this rule is that if we assume the differences can be treated as approximately normally distributed, then using the multiplier 3.29 (upper 99.9th percentile of the standard normal distribution) implies that, on average, no more than 1 or 2 false positive flags will occur among a maximum 1342=11×122 possible comparisons.
Results and Discussion
Evaluation and optimization of the carbohydrate microarray assay for human serum profiling
The first goal of this study was to develop and validate a high-throughput carbohydrate array assay for profiling serum antibodies in humans. Since carbohydrate arrays are a relatively new technology, sufficient guidelines have not emerged about how to address issues of reproducibility when using arrays for profiling human serum. Although carbohydrate microarray technology evolved from DNA microarray technology, the design of experiments can differ significantly and many statistical models used in processing genome-derived data and interpreting results from DNA microarray experiments are not applicable to carbohydrate microarrays. In this study, we have demonstrated one approach to characterizing a carbohydrate array and evaluating performance of a binding assay for serum profiling.
We have previously reported the development of a carbohydrate microarray and its use for profiling monoclonal antibodies and lectins 26-32. The version of the array used in this study contained 128 components. Each microscope-sized slide has 16 complete arrays, enabling simultaneous evaluation of up to 16 samples on a single microscope-size slide. Each array component was printed in duplicate in each well using a robotic microarrayer. For serum antibody profiling, we opted to analyze samples at a single concentration in order to maximize throughput. While a single concentration does not cover all antibodies in serum, a dilution of 1:50 was found empirically to best enable us to minimize the background signal and maximize the number of carbohydrates that give signal without saturating spots. Since antibody binding can be dependent on temperature, samples were assayed at 37°C to match the body temperature of humans. To increase reproducibility, we assayed each sample in duplicate wells (arrays) and then used the average values. In the following sections, we describe the systematic assessment of variability as well as the overall reproducibility with human serum. We also present results of a longitudinal study comprising 7 donors and biological variability in a group of 48 healthy individuals. It is important to note that antibody signals being measured are due to binding of free, non-complexed antibodies present in serum.
Normalization
The ability to accurately compare data across experiments is essential to microarray studies, but to be able to do this reliably, one must account for systematic variations among data sets. For example, the use of different scanners or replacement of scanner parts, subtle differences in production of slide batches, and gradual reduction of reagent activity over time can all lead to variability. To date, no methods have been published for normalizing carbohydrate microarray data to account for these factors. To improve the precision of our assay, we chose a normalization approach that involves running a reference sample in one of the 16 wells on every slide (Figure S1 in Supporting information). The signals for the reference sample are then used to calibrate or scale all the data on that slide (for details, see Materials and Methods). The reference serum sample provides information about slide quality, scanner settings, secondary reagent activity, and other systematic experimental factors that may result in signal variation across experiments. The reference sample also helps to monitor the precision of the assay and detect unusual variability in measurements.
Within-experiment variability
If a serum sample from an individual is divided into separate aliquots and then assayed on duplicate slides from the same batch and in the same experiment, we expect some variation for each aliquot. We defined this variability as the within-experiment (aliquot-to-aliquot) variance. This form of variability is relevant for the interpretation of results from small-scale studies where the assay results being compared are typically derived from a single experiment using slides from the same print batch (e.g. pre- vs post-immune sera). In these types of studies, it is important to distinguish between within-experiment technical variability and real biological differences. Four aliquots of one serum sample were used for this experiment. Each aliquot was diluted separately into the incubation buffer and evaluated on the carbohydrate array. The mean signal and standard deviation on the log-transformed (base 2) scale, and the CV (untransformed scale) over the 4 aliquots were then calculated for each carbohydrate. The SD was approximately linearly associated with the mean prior to log transformation (not shown), but this dependence was largely removed when data were log-transformed or the variability was represented as CV (Figure 1, panels a and b). The within-experiment CVs varied from 0% to 69.6%, with interquartile range 5.5% to 11.9%, median 8.1%, and average 10.79%. For comparison with the Schwarz study,21 which reports a within-experiment CV for Rha-α of 7%, the within-experiment CV for Rha-α in our assay was 2.6%.
Figure 1.
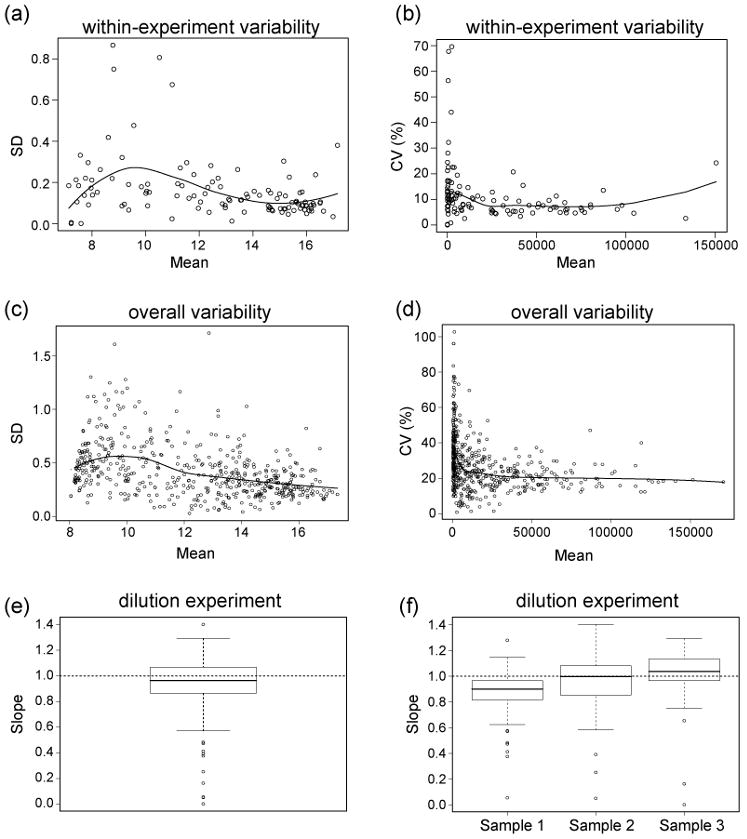
Characterization and validation of the carbohydrate array. Within-experiment (aliquot-to-aliquot) variability plots showing (a) standard deviation as a function of mean fluorescence signal across 4 aliquots of the same sample for normalized log-transformed (base 2) data and (b) CV as a function of mean fluorescence signal for the same 4 aliquots for normalized untransformed data. Overall variability plots showing (c) standard deviation as a function of mean fluorescence signal combined over 5 different samples for normalized log-transformed (base 2) data and (d) CV as a function of mean fluorescence signal for the same 5 samples for normalized untransformed data. Box plots showing (e) distribution of the slopes from dilution experiment combined over 3 samples and distribution of carbohydrate-specific slopes from dilution experiment separately by sample (f).
Overall variability
Studies focused on biomarker/antigen discovery or vaccine design will often require evaluation of large numbers of samples over many batches of slides and many different days. In these situations, it is important to know the degree of technical error when one combines several different sources of variation. We have called this form of technical error the overall variability. To measure overall variability, we evaluated serum samples on slides from 3 different print batches in experiments conducted on different days. One operator conducted the experiments and one set of reagents was used for all experiments. Since the overall variability could potentially be different for different serum samples, we evaluated 5 different human serum samples to simultaneously assess sample-dependence. We found that the overall variability was similar for the five different samples. Averaging over carbohydrates, the overall CV (untransformed scale) for the five samples ranged from 25.3% to 32.0%, with an average of 28.5%. Figure 1 (panel c and d) shows, for the 5 serum samples together, the relationship between overall standard deviation (log-transformed scale) and CV (untransformed scale), respectively, and mean signal across the 3 experiments. Two factors appear to contribute most to variability. First, there was a noticeable increase in variability at the very low end of the signal intensity range. Specifically, a larger proportion of signals below 1000 had higher than average CV (untransformed scale). Second, there was higher variability between different print batches of slides, presumably due to variations in the physical process of printing arrays.
Signal-to-concentration relationship
To characterize the relationship between antibody concentration and signal, serum samples from 3 healthy donors were evaluated at dilutions of 1:50, 1:200, and 1:800. The use of 3 different samples, rather than a single sample, would allow us to determine if the signal-to-concentration relationship is sample dependent. Each sample was analyzed on duplicate slides in one experiment. For each carbohydrate and serum sample, the log signal was plotted as a function of the log dilution ratio and the slope of the regression line was determined, where a slope of 1 corresponds to a model in which signal response is perfectly proportional to concentration. Next, the slopes were combined in the form of box plots (see figure 1e and f). In our hands, we observed that the median slopes for the linear regression lines were close to 1, as desired, for the carbohydrates with measurable signal (Figure 1, panel e). There was modest variation in the median slope across the three different samples (Figure 1, panel f), but this may be due to random variation. It should be noted that the individual slopes are highly variable since they are determined from at most 3 dilutions; however, the box plots illustrate the general trends.
Anti-carbohydrate antibody profiles of a group of healthy adults
The second goal of this study was to evaluate inter-individual biological variation of serum antibodies in healthy individuals. In addition to providing basic information on the antibody repertoire, this information is useful for choosing appropriate individuals for biomarker discovery and validation studies. Rather than taking random samples from the population, we chose samples from 48 individuals that would give balanced representation in five covariate categories: age, race, sex, geographic location, and blood type (Tables S3 to S7 in Supporting information). This collection would better enable us to determine the effects of these covariates on biological variability.
The distribution of antibodies for each array component is shown in Figure 2. In general, individuals had high antibody levels to many different carbohydrate antigens. The carbohydrate antigens with the highest levels of antibodies and narrowest distribution (most consistent level of antibodies) across all individuals were Rha-α, Rha-β, and Forssman disaccharide, each of which had a median signal of about 17 on the log-transformed (base 2) scale. In contrast to the report by Blixt et al.22, we observed a high degree of variability between individuals. The reason for this difference is not known but could be due to a larger number of subjects or the fact that subjects were intentionally selected with more diverse covariates. It should also be noted that every component on the array was bound by serum antibodies in at least one person, verifying that all components are accessible using our print and assay conditions.
Figure 2.
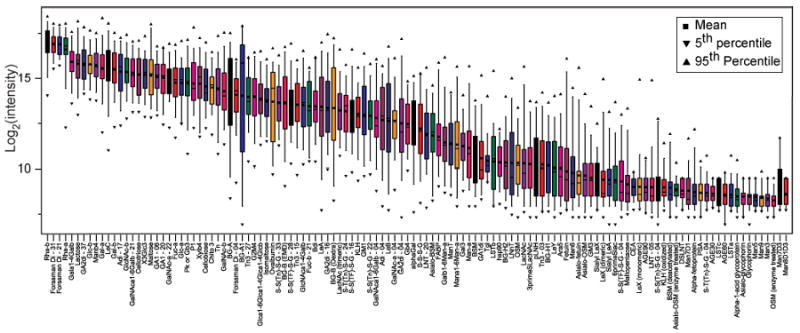
Microarray data from 48 healthy human donors for antibodies to 122 carbohydrate antigens. Box plots of the distribution of log-transformed (base 2) normalized signals.
Associations between each of the covariates and the anti-carbohydrate antibody levels were also evaluated. Using a p-value cut-off of 0.01 when testing the association between a given covariate and carbohydrate, we would expect about 1 or 2 carbohydrates to show significant associations by chance when testing 122 carbohydrates. For geographic location, sex, and race there were only 1, 2, and 4 carbohydrates reaching significance at level 0.01, respectively, none of which are significantly greater than the number expected by chance. In contrast, there were 17 carbohydrates significant at level 0.01 for blood type, and 21 significant at level 0.01 for age (Tables S6 and S7, and Figure S2 in Supporting information).
Differences in antibody levels based on blood type were detected as one might anticipate. The largest differences were observed for the BG-A1 pentasaccharide (p<0.0001) for which very clear distinctions were noted between individuals expected to have anti-A antibodies (blood types O and B) and those expected to have little or no anti-A antibodies (blood types A and AB) (Figure 3). Antibody levels to the BG-A and BG-B trisaccharides correlated with blood type (p<0.0001 for each), but the mean differences between blood types were not as large. Smaller mean differences were observed between the blood types for the A and B disaccharides lacking a fucose residue (Adi and Bdi). The association with Adi was significant, while for Bdi it was nearly significant at our p<0.01 threshold. Some of the other carbohydrates with statistically significant associations with blood type (p<0.01) include Forssman disaccharide (GalNAcα1-3GalNAcβ), single Tn, clustered Tn, and GalNAc-α, all of which present the terminal GalNAc-α residue similar to BG-A; and Gal-α, which is a terminal residue of the BG-B oligosaccharide. Although there may be distinct subgroups of antibodies to these carbohydrates, the structural similarities to the blood group antigens may also result in some overlapping reactivity of the anti-blood group antibodies and, consequently, contribute to association with blood type.
Figure 3.
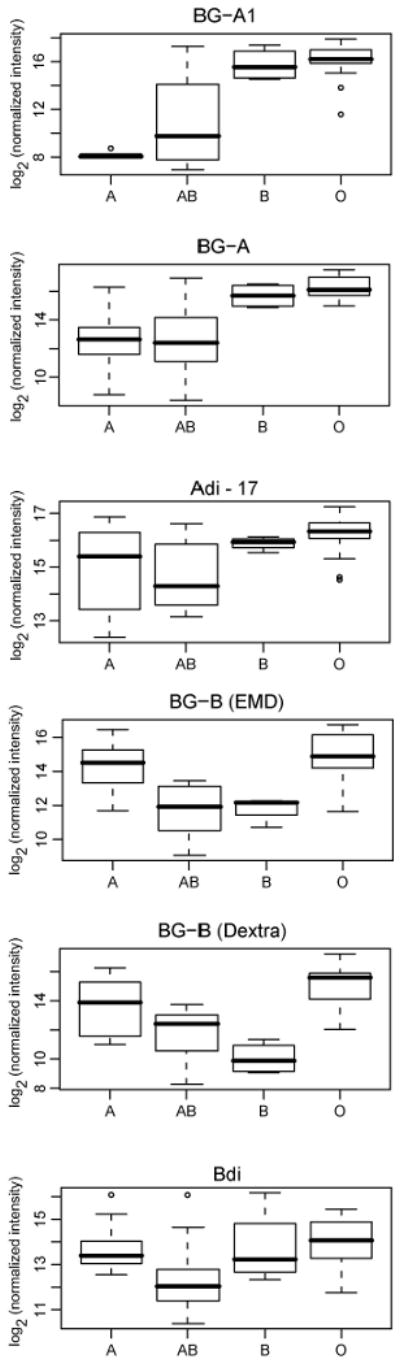
Blood type covariate association for blood groups A and B and related disaccharides. Box plots showing distribution of normalized log-transformed (base 2) signals for the blood group determinants and the related disaccharides, Adi and Bdi, by blood type.
Variations based on age were also observed. Previous studies have reported that although total immunoglobulin (Ig) concentrations increase with age, different trends exist among the Ig isotypes.34-36 A gradual decrease in serum IgM with age has been reported, while for IgG, an age-related increase has been observed. Much less is known about the subset of antibodies that target carbohydrate antigens. A few studies have characterized the dependence of levels of isohemagluttinins and α-Gal on age and sex.37-39 We confirm previous findings that serum antibodies to α-Gal decrease with age (p<0.01), but also observed a significant decrease (p<0.01) in antibody levels for 20 other carbohydrate antigens. In addition to these carbohydrates, we also observed a notable trend toward a decrease in antibody levels for almost all carbohydrates on the array. This result indicates that age can be a critical factor to take into consideration when evaluating anti-carbohydrate antibody levels and when comparing an individual's antibody profile to that of a reference or control group.
To look at variation across samples and carbohydrates, the data were clustered by hierarchical clustering using average linkage method and Euclidean distance metric, with and without median centering by carbohydrate. The heatmaps of the data allow evaluation of the relative signal from each individual (Figure 4 and Figure S3 in supporting information). The majority of conjugates having the Tn determinant (α-linked GalNAc to serine or threonine) in various forms clustered together. The exceptions were the three Tn-containing glycoconjugates at 3 or 4-sugars per BSA, which were located farther from this cluster. Other conjugates with terminal GalNAc residues, such as Adi, GA2di, GalNAcα1-6Galβ, and GalNAc-α clustered with the Tn glycoconjugates. Other groups of carbohydrates, such as the TF conjugates, LeX, Forssman disaccharide, and rhamnose clustered adjacent to each other. Clustering of the serum samples was less pronounced (see figure S3A+B in supporting information).
Figure 4.
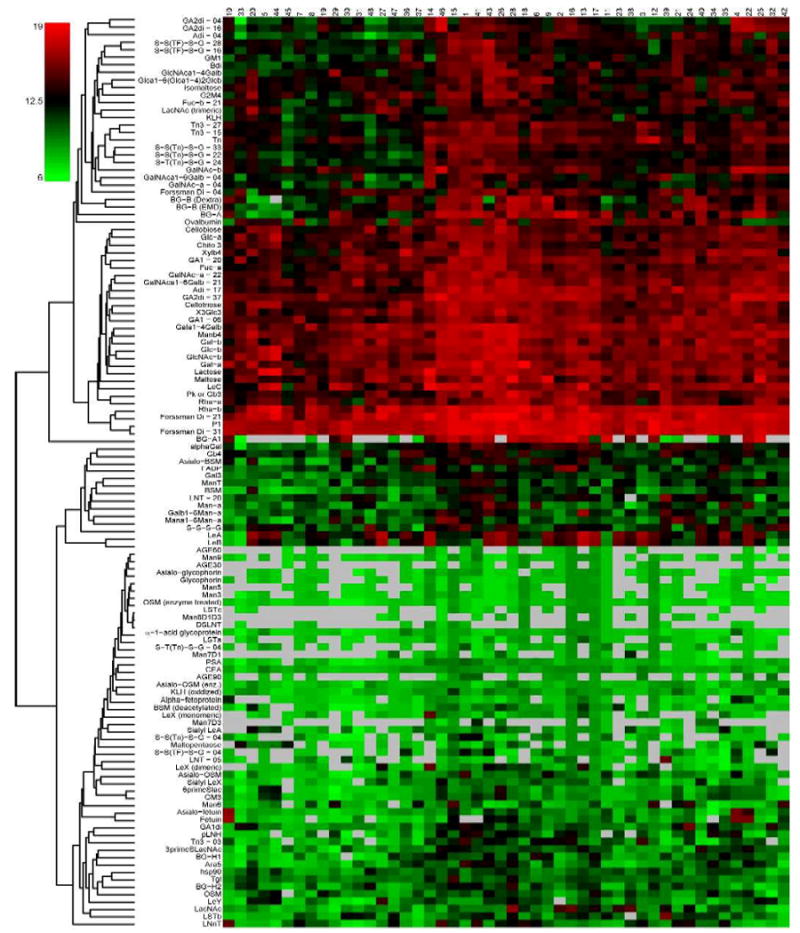
Microarray data from 48 healthy human donors for antibodies to 122 carbohydrate antigens. Heat map of data clustered without median centering. Carbohydrates are indicated in the rows and subjects are indicated in the columns. Each rectangle represents the log-transformed (base 2) normalized signal. The color of the rectangle corresponds to values on the color scale to the left of the heat map. Gray rectangles represent missing values, many of which were below detectable level.
Within-person anti-carbohydrate antibody levels
A third goal of this study was to evaluate temporal changes in antibody levels within individuals. With results from the group of 48 healthy donors showing substantial variability for a subset of carbohydrates from person to person, we next evaluated the variability in samples obtained from the same individual at different time points. This experiment enables us to determine whether observed differences between individual are greater than the baseline biological variability over time within an individual. This information is also critical for basic research as well as biomarker discovery and vaccine development.
To evaluate temporal variations in antibody levels, we obtained serum samples from 7 healthy adult volunteers twice or three times over periods ranging from 3 weeks to 13 weeks and evaluated the samples for levels of the 122 components of the array. All samples were processed using the same procedure and matched samples from each donor were evaluated in a single experiment on duplicate slides. Separately, we evaluated the variability associated with running biologically identical samples collected at the same time and run in a single experiment. By doing this, we were able to estimate the baseline aliquot-to-aliquot variability. Differences could then be compared to the expected baseline variation to detect possible biological variation over time. We calculated this least significant difference between two time points for an individual to be 2.0-fold (difference on log2 scale of 0.977, see Table S8 in supporting information). Based on a threshold of 2.0-fold, some carbohydrates exhibited statistically significant differences between time points for some subjects. However, almost all of these carbohydrates either are natural glycoproteins, which we have found to display higher variability than the neoglycoproteins, or had weak signals (<1000). The largest change observed for any array component was about 3.9-fold. Overall, we found that anti-carbohydrate antibody levels were quite stable over a period of several months.
Conclusions
In this study, we evaluated experimental variability of a carbohydrate array, biological variability among individuals, and temporal variability within individuals. We show that our assay has good reproducibility and responses correlate well with concentration of sample. We demonstrate that, sometimes, measuring variability for one component may not be sufficient to describe variability of the whole array. Some components may be measured more or less precisely than others, and the level of precision may depend on factors such as the structure of the analyte being measured or its average level. We found significant biological variability among individuals, but within a given individual we found that measured antibody levels were relatively stable over a period of months. To our knowledge, the results presented in this paper are the most comprehensive published for validating a carbohydrate microarray in terms of types of variability evaluated, number of carbohydrate epitopes, and number of individual human serum samples used in the study.
Taken together, the results presented here have significant implications for serum profiling and development of biomarkers. First, our results suggest that when designing comparative profiling studies, it is important to compare individuals or groups of individuals with others in the same age group, or to adjust for age in analyses. Doing this would reduce the influence of age-related differences in antibody levels, thus enabling more accurate identification of condition or treatment-related differences. Second, our results also show that variations in antibody levels associated with blood type go beyond the well-known blood group antigens. Therefore, blood type must be taken into consideration when comparing antibody levels for many antigens including known tumor-associated carbohydrate antigens such as the Tn antigen. Third, the high degree of variability between otherwise phenotypically similar individuals should be taken into account when designing studies to compare different groups of individuals. Fourth, anti-carbohydrate antibody levels within an individual are generally stable over a period of several months. This means that with a robust, validated assay in place, changes in antibody levels over time can be monitored to identify novel interesting antigens that can then be examined in subsequent studies for association of their temporal patterns with epidemiologic or clinical outcomes.
The results presented here also have implications for drug development. Several groups have been developing bivalent agents having a cell-targeting moiety on one end and an antibody binding element on the other end.40-44 For example, Kiessling and co-workers have developed agents containing a cancer cell targeting epitope coupled to the α-Gal epitope. These agents are designed to tag cancer cells with the α-Gal epitope, which will then be recognized by naturally occurring anti-α-Gal antibodies normally found in serum. Nearly all individuals in our group had high antibody levels to Rha-α, Rha-β, and the Forssman disaccharide suggesting that these may be useful alternatives to the α-Gal epitope since they are present at higher levels and in a higher proportion of individuals.
Supplementary Material
Acknowledgments
This research was supported by the Intramural Research Program of the NIH, NCI.
Footnotes
Supporting Information Available: List of array components, information about 48 subjects, regression and ANOVA analysis association results, heat map of median centered data from 48 normal donors, covariate association plots, and longitudinal study results. This material is available free at http://pubs.acs.org.
References
- 1.Chen YT, Gure AO, Scanlan MJ. Serological analysis of expression cDNA libraries (SEREX): an immunoscreening technique for identifying immunogenic tumor antigens. Methods Mol Med. 2005;103:207–16. [PubMed] [Google Scholar]
- 2.Cekaite L, Hovig E, Sioud M. Protein arrays: a versatile toolbox for target identification and monitoring of patient immune responses. Methods Mol Biol. 2007;360:335–48. doi: 10.1385/1-59745-165-7:335. [DOI] [PubMed] [Google Scholar]
- 3.Sioud M, Hansen M, Dybwad A. Profiling the immune responses in patient sera with peptide and cDNA display libraries. Int J Mol Med. 2000;6(2):123–128. doi: 10.3892/ijmm.6.2.123. [DOI] [PubMed] [Google Scholar]
- 4.Gnjatic S, Wheeler C, Ebner M, Ritter E, Murray A, Altorki NK, Ferrara CA, Hepburne-Scott H, Joyce S, Koopman J, McAndrew MB, Workman N, Ritter G, Fallon R, Old LJ. Seromic analysis of antibody responses in non-small cell lung cancer patients and healthy donors using conformational protein arrays. J Immunol Methods. 2009;341(12):50–8. doi: 10.1016/j.jim.2008.10.016. [DOI] [PubMed] [Google Scholar]
- 5.Sundaresh S, Doolan DL, Hirst S, Mu Y, Unal B, Davies DH, Felgner PL, Baldi P. Identification of humoral immune responses in protein microarrays using DNA microarray data analysis techniques. Bioinformatics. 2006;22(14):1760–6. doi: 10.1093/bioinformatics/btl162. [DOI] [PubMed] [Google Scholar]
- 6.Chen Y, Jain RK, Chanrasekaran EV, Matta KL. Use of sialylated or sulfated derivatives and acrylamide copolymers of Gal?1,3GalNAc?- and GalNAc?- to determine the specificities of blood group T- and Tn-specific lectins and the copolymers to measure anti-T and anti-Tn antibody levels in cancer patients. Glycoconj J. 1995;12(1):55. doi: 10.1007/BF00731869. [DOI] [PubMed] [Google Scholar]
- 7.Desai PR, Ujjainwala LH, Carlstedt SC, Springer GF. Antibodies to pancarcinoma Tn epitope: Their altered levels in breast carcinoma patients. Onkologie. 1997;20(6):472. [Google Scholar]
- 8.Smorodin EP, Kurtenkov OA, Sergeyev BL, Lilleorg AL, Chuzmarov VI. Antibodies to tumor-associated carbohydrate epitopes in sera of cancer patients and blood donors. Exp Oncology. 2001;23(2):109. [Google Scholar]
- 9.Von Mensdorff-Pouilly S, Petrakou E, Kenemans P, Van Uffelen K, Verstraeten AA, Snijdewint FGM, Van Kamp GJ, Schol DJ, Reis CA, Price MR, Livingston PO, Hilgers J. Reactivity of natural and induced human antibodies to MUC1 mucin with MUC1 peptides and N-acetylgalactosamine (GalNAc) peptides. Int J Cancer. 2000;86(5):702. doi: 10.1002/(sici)1097-0215(20000601)86:5<702::aid-ijc16>3.0.co;2-1. [DOI] [PubMed] [Google Scholar]
- 10.Liang PH, Wu CY, Greenberg WA, Wong CH. Glycan arrays: biological and medical applications. Curr Opin Chem Biol. 2008;12(1):86. doi: 10.1016/j.cbpa.2008.01.031. [DOI] [PMC free article] [PubMed] [Google Scholar]
- 11.Oyelaran O, Gildersleeve JC. Application of carbohydrate array technology to antigen discovery and vaccine development. Expert Rev Vaccines. 2007;6(6):957–69. doi: 10.1586/14760584.6.6.957. [DOI] [PubMed] [Google Scholar]
- 12.Park S, Lee MR, Shin I. Carbohydrate microarrays as powerful tools in studies of carbohydrate-mediated biological processes. Chem Comm. 2008;(37):4389–99. doi: 10.1039/b806699j. [DOI] [PubMed] [Google Scholar]
- 13.Paulson JC, Blixt O, Collins BE. Sweet spots in functional glycomics. Nat Chem Biol. 2006;2(5):238–248. doi: 10.1038/nchembio785. [DOI] [PubMed] [Google Scholar]
- 14.Blixt O, Kumagai-Braesch M, Tibell A, Groth CG, Holgersson J. Anticarbohydrate antibody repertoires in patients transplanted with fetal pig islets revealed by glycan arrays. Am J Transplant. 2009;9(1):83. [Google Scholar]
- 15.De Boer AR, Hokke CH, Deelder AM, Wuhrer M. Serum antibody screening by surface plasmon resonance using a natural glycan microarray. Glycoconj J. 2008;25(1):75. doi: 10.1007/s10719-007-9100-x. [DOI] [PubMed] [Google Scholar]
- 16.Kamena F, Tamborrini M, Liu X, Kwon YU, Thompson F, Pluschke G, Seeberger PH. Synthetic GPI array to study antitoxic malaria response. Nat Chem Biol. 2008;4(4):238–240. doi: 10.1038/nchembio.75. [DOI] [PubMed] [Google Scholar]
- 17.Lawrie CH, Marafioti T, Hatton CSR, Dirnhofer S, Roncador G, Went P, Tzankov A, Pileri SA, Pulford K, Banham AH. Cancer-associated carbohydrate identification in Hodgkin's lymphoma by carbohydrate array profiling. Int J Cancer. 2006;118(12):3161–3166. doi: 10.1002/ijc.21762. [DOI] [PubMed] [Google Scholar]
- 18.Parthasarathy N, DeShazer D, Peacock SJ, Wuthiekanun V, England MJ, Norris SL, Waag DM. Application of polysaccharide microarray technology for the serodiagnosis of Burkholderia pseudomallei infection (melioidosis) in humans. J Carbohydr Chem. 2008;27(1):32–40. [Google Scholar]
- 19.Parthasarathy N, Saksena R, Kovác P, DeShazer D, Peacock SJ, Wuthiekanun V, Heine HS, Friedlander AM, Cote CK, Welkos SL, Adamovicz JJ, Bavari S, Waag DM. Application of carbohydrate microarray technology for the detection of Burkholderia pseudomallei, Bacillus anthracis and Francisella tularensis antibodies. Carbohydr Res. 2008;343(16):2783. doi: 10.1016/j.carres.2008.05.021. [DOI] [PubMed] [Google Scholar]
- 20.Wang CC, Huang YL, Ren CT, Lin CW, Hung JT, Yu JC, Yu AL, Wu CY, Wong CH. Glycan microarray of Globo H and related structures for quantitative analysis of breast cancer. Proc Natl Acad Sci. 2008;105(33):11661–11666. doi: 10.1073/pnas.0804923105. [DOI] [PMC free article] [PubMed] [Google Scholar]
- 21.Schwarz M, Spector L, Gortler M, Weisshaus O, Glass-Marmor L, Karni A, Dotan N, Miller A. Serum anti-Glc(alpha 1,4)Glc(alpha) antibodies as a biomarker for relapsing-remitting multiple. J Neurol Sci. 2006;244(12):59–68. doi: 10.1016/j.jns.2005.12.006. [DOI] [PubMed] [Google Scholar]
- 22.Blixt O, Head S, Mondala T, Scanlan C, Huflejt ME, Alvarez R, Bryan MC, Fazio F, Calarese D, Stevens J, Razi N, Stevens DJ, Skehel JJ, van Die I, Burton DR, Wilson IA, Cummings R, Bovin N, Wong CH, Paulson JC. Printed covalent glycan array for ligand profiling of diverse glycan binding proteins. Proc Natl Acad Sci. 2004;101(49):17033–17038. doi: 10.1073/pnas.0407902101. [DOI] [PMC free article] [PubMed] [Google Scholar]
- 23.Dotan N, Altstock RT, Schwarz M, Dukler AA. Anti-glycan antibodies as biomarkers for diagnosis and prognosis. Lupus. 2006;15(7):442–450. doi: 10.1191/0961203306lu2331oa. [DOI] [PubMed] [Google Scholar]
- 24.Schwarz M, Spector L, Gargir A, Shtevi A, Gortler M, Altstock RT, Dukler AA, Dotan N. A new kind of carbohydrate array, its use for profiling antiglycan antibodies, and the discovery of a novel human cellulose-binding antibody. Glycobiology. 2003;13(11):749–754. doi: 10.1093/glycob/cwg091. [DOI] [PubMed] [Google Scholar]
- 25.Wang D, Liu S, Trummer BJ, Deng C, Wang A. Carbohydrate Microarrays for the Recognition of Cross-Reactive Molecular Markers of Microbes and Host Cells. Nat Biotechnol. 2002;20:275–281. doi: 10.1038/nbt0302-275. [DOI] [PubMed] [Google Scholar]
- 26.Oyelaran OO, Li Q, Farnsworth DF, Gildersleeve JC. Microarrays with Varying Carbohydrate Density Reveal Distinct Subpopulations of Serum Antibodies. J Proteome Res. 2009;8(7):3529–38. doi: 10.1021/pr9002245. [DOI] [PMC free article] [PubMed] [Google Scholar]
- 27.Li Q, Anver MR, Butcher DO, Gildersleeve JC. Resolving Conflicting Data on Expression of the Tn Antigen and Implications for Clinical Trials with Cancer Vaccines. Mol Cancer Res. 2009;8(4):971–9. doi: 10.1158/1535-7163.MCT-08-0934. [DOI] [PMC free article] [PubMed] [Google Scholar]
- 28.Hsu KL, Gildersleeve JC, Mahal LK. A simple strategy for the creation of a recombinant lectin microarray. Mol BioSyst. 2008;4(6):654–662. doi: 10.1039/b800725j. [DOI] [PMC free article] [PubMed] [Google Scholar]
- 29.Gildersleeve JC, Oyelaran O, Simpson JT, Allred B. Improved procedure for Direct Coupling of Carbohydrates to Proteins via Reductive Amination. Bioconjugate Chem. 2008;19(7):1485–90. doi: 10.1021/bc800153t. [DOI] [PMC free article] [PubMed] [Google Scholar]
- 30.Manimala JC, Roach TA, Li Z, Gildersleeve JC. High-throughput carbohydrate microarray profiling of 27 antibodies demonstrates widespread specificity problems. Glycobiology. 2007;17(8):17C–23C. doi: 10.1093/glycob/cwm047. [DOI] [PubMed] [Google Scholar]
- 31.Manimala JC, Roach TA, Li ZT, Gildersleeve JC. High-throughput carbohydrate microarray analysis of 24 lectins. Angew Chem Int Ed. 2006;45(22):3607–3610. doi: 10.1002/anie.200600591. [DOI] [PubMed] [Google Scholar]
- 32.Manimala J, Li Z, Jain A, VedBrat S, Gildersleeve CJ. Carbohydrate array analysis of anti-Tn antibodies and lectins reveals unexpected specificities: Implications for diagnostic and vaccine development. ChemBioChem. 2005;6(12):2229–2241. doi: 10.1002/cbic.200500165. [DOI] [PubMed] [Google Scholar]
- 33.Lyng H, Badiee A, Svendsrud DH, Hovig E, Myklebost O, Stokke T. Profound influence of microarray scanner characteristics on gene expression ratios: Analysis and procedure for correction. BMC Genomics. 2004;5 doi: 10.1186/1471-2164-5-10. [DOI] [PMC free article] [PubMed] [Google Scholar]
- 34.Gonzalez-Quintela A, Alende R, Gude F, Campos J, Rey J, Meijide LM, Fernandez-Merino C, Vidal C. Serum levels of immunoglobulins (IgG, IgA, IgM) in a general adult population and their relationship with alcohol consumption, smoking and common metabolic abnormalities. Clin Exp Immunol. 2008;151(1):42. doi: 10.1111/j.1365-2249.2007.03545.x. [DOI] [PMC free article] [PubMed] [Google Scholar]
- 35.Listì F, Candore G, Modica MA, Russo M, Di Lorenzo G, Esposito-Pellitteri M, Colonna-Romano G, Aquino A, Bulati M, Lio D, Franceschi C, Caruso C. A study of serum immunoglobulin levels in elderly persons that provides new insights into B cell immunosenescence. Ann N Y Acad Sci. 2006;1089:487–95. doi: 10.1196/annals.1386.013. [DOI] [PubMed] [Google Scholar]
- 36.Maddison SE, Stewart CC, Farshy CE, Reimer CB. The relationship of race, sex, and age to concentrations of serum immunoglobulins expressed in international units in healthy adults in the USA. Bull World Health Organ. 1975;52(2):179–85. [PMC free article] [PubMed] [Google Scholar]
- 37.Buonomano R, Tinguely C, Rieben R, Mohacsi PJ, Nydegger UE. Quantitation and characterization of anti-Galalpha1-3Gal antibodies in sera of 200 healthy persons. Xenotransplantation. 1999;6(3):173–80. doi: 10.1034/j.1399-3089.1999.00023.x. [DOI] [PubMed] [Google Scholar]
- 38.Grundbacher FJ. Quantity of hemolytic anti-A and anti-B in individuals of a human population: correlations with isoagglutinins and effects of the individual's age and sex. Zeitschrift für Immunitätsforschung, Allergie und klinische Immunologie. 1967;134(4):317–49. [PubMed] [Google Scholar]
- 39.Parker W, Lundberg-Swanson K, Holzknecht ZE, Lateef J, Washburn SA, Braedehoeft SJ, Platt JL. Isohemagglutinins and xenoreactive antibodies: members of a distinct family of natural antibodies. Hum Immunol. 1996;45(2):94–104. doi: 10.1016/0198-8859(95)00216-2. [DOI] [PubMed] [Google Scholar]
- 40.Shokat KM, Schultz PG. Redirecting the immune response: ligand-mediated immunogenicity. J Am Chem Soc. 1991;113:1861–1862. [Google Scholar]
- 41.Bertozzi CR, Bednarski MD. A receptor-mediated immune response using synthetic glycoconjugates. J Am Chem Soc. 1992;114:5543–5546. [Google Scholar]
- 42.Lussow AR, Buelow R, Fanget L, Peretto S, Gao L, Pouletty P. Redirecting circulating antibodies via ligand-hapten conjugates eliminates target cells in vivo. J Immunother Emphasis Tumor Immunol. 1996;19(4):257–65. doi: 10.1097/00002371-199607000-00002. [DOI] [PubMed] [Google Scholar]
- 43.Carlson CB, Mowery P, Owen RM, Dykhuizen EC, Kiessling LL. Selective tumor cell targeting using low-affinity, multivalent interactions. ACS Chem Biol. 2007;2(2):119–27. doi: 10.1021/cb6003788. [DOI] [PubMed] [Google Scholar]
- 44.Owen RM, Carlson CB, Xu J, Mowery P, Fasella E, Kiessling LL. Bifunctional ligands that target cells displaying the alpha v beta3 integrin. Chembiochem. 2007;8(1):68–82. doi: 10.1002/cbic.200600339. [DOI] [PubMed] [Google Scholar]
Associated Data
This section collects any data citations, data availability statements, or supplementary materials included in this article.