Abstract
In this paper we study position-dependent timing shifts and timing resolution in position sensitive avalanche photodiodes (PSAPDs) and their effect on the coincidence window used in positron emission tomography (PET) systems using these devices. There is a delay in PSAPD signals that increases as the excitation position moves from the corner to the center of the device and the timing resolution concurrently worsens. The difference in timing between the center and corner can be up to 30.7 ns for a 14×14 mm2 area PSAPD. This means that a PSAPD-based PET system could require a very wide coincidence timing window (>60 ns) if this effect is not corrected, although the individual crystal pairs still have full-width half-maximum (FWHM) timing resolutions better than 7.4 ns. In addition to characterizing the timing properties of PSAPDs, two correction methods were developed and applied to data from a pair of PSAPD detectors. These two timing offset corrections reduced the timing shift of a crystal pair from 52.4 ns to 9.7 ns or 1.3 ns, improved FWHM timing resolution of the detector pair from 24.6 ns to 9.5 ns or 6.0 ns and reduced the timing window (sufficient to cover at least twice the FWHM for all crystal pairs) from 65.1 ns to 22.0 ns or 15.2 ns respectively. A two-step timing alignment method is proposed for a PET system consisting of multiple PSAPDs. Lastly, the effect of PSAPD size on the timing performance was also evaluated.
Keywords: photodiodes, photodetectors, instrumentation, PET
1 Introduction
The use of position sensitive avalanche photodiodes (PSAPDs) is emerging as an interesting alternative to traditional photodetector technology such as photomultiplier tubes (PMT) for positron emission tomography (PET) detector development (Shah et al., 2004; Catana et al., 2006; Zhang et al., 2007; Yang et al., 2008). The small size of PSAPD-based detectors compared to more bulky PMT-based types may be advantageous for use in confined geometries. Compact detector designs possible with PSAPDs allow for scanner configurations with increased sensitivity and high and uniform spatial resolution. PSAPDs also have high quantum efficiency, a wide spectral response and are insensitive to magnetic fields (Pichler et al., 2006). Thus, PSAPD-based PET detectors have been adapted for applications such as depth-of-interaction (DOI)-encoding (Yang et al., 2008) and MR-compatible PET systems (Catana et al., 2008). Although one of the main advantages of using PSAPDs compared to conventional avalanche photodiodes (APDs) is the significant reduction in the number of electronic readout channels, this technology also presents challenges compared to APD- and PMT-based detectors. The most obvious, though most easily addressed, challenge is the pin-cushion distortion of spatial positional readout information due to the non-linear fashion in which charge is shared among the four corner anodes (Shah et al., 2004). Several groups have proposed both software (Despres et al., 2007; Zhang et al., 2007; Chaudhari et al., 2008) and hardware (Grazioso et al., 2002; Shah et al., 2002) solutions to correct or account for this distortion for flood map histogram discrimination. One other notable effect that our group has observed is the apparent time shift between signals originating from the center of the PSAPD versus those from the edges or corners. Previous studies have noted a timing shift of up to 25 ns (Catana et al., 2006). This has been attributed to the resistive readout present on PSAPDs. In order to maintain the high spatial resolution offered by a crystal array setup while capturing all coincidence events, a wide timing coincidence window of 80 ns is currently used in our PSAPD-based detectors. Here, we further characterize the time difference of signals originating from different positions on the PSAPD and explore their dependence on the size of the PSAPD. Using this information, we propose an approach to correct the timing signal after signal read out from the detector to the data processing portion of the system. The ability to correct for this timing shift will improve the timing resolution of a crystal array/PSAPD-based detector and reduce sensitivity to random events via much tighter coincidence windowing.
2 Materials & Methods
2.1 Timing shift and timing resolution at various locations on PSAPD surface
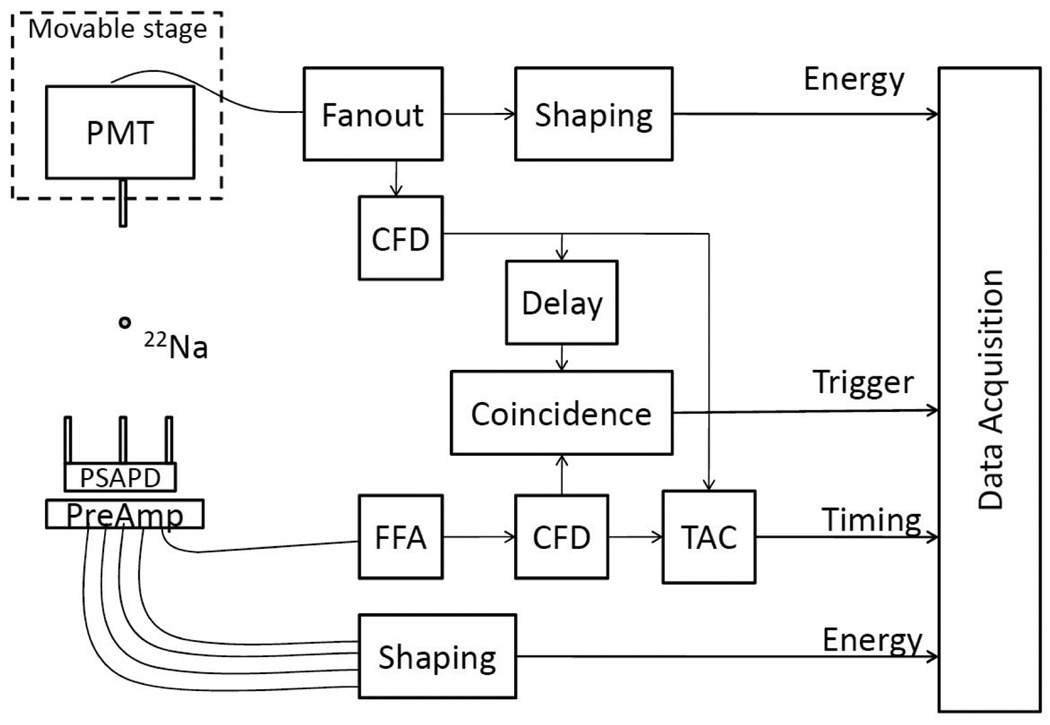
To determine the timing shift and timing resolution at different locations on the surface of a PSAPD, an experimental setup was built as shown in Figure 1. A 14×14 mm2 PSAPD was coupled to three individual LSO crystals each of size 1.43×1.43×6 mm3. The crystals were polished on all sides and wrapped with teflon tape on five sides except the one coupled to the PSAPD. The three crystals were placed at three representative locations, corner, edge and center, using a positioning guide made of teflon. Optical coupling between the LSO crystals and PSAPD was accomplished using optical grease (BC-630, Saint-Gobain Ceramics & Plastics, Inc., Newbury, OH). A PMT (R580, Hamamatsu, Hamamatsu City, Japan) coupled to a single LSO crystal with size of 1.5×1.5×20 mm3 was used as the timing reference. The separation between the front surfaces of the two detectors was 60 mm. A 22Na point-like source with activity 23 µCi was placed at the center of the setup.
Figure 1.
Experimental setup for timing measurements of a PSAPD-based LSO detector in coincidence with a PMT-based LSO detector.
The signal from the PMT was buffered with a fan-out unit (740, Philips Scientific, Mahwah, NJ); one output was fed to an ORTEC 584 constant fraction discriminator (CFD) (Advanced Measurement Technology, Inc., Oak Ridge, TN) and the generated trigger was used for PMT timing. The delay for the CFD was ~3 ns. Another fan-out output was shaped with a shaping amplifier (N568B, CAEN Technologies, Staten Island, NY) and fed to a data acquisition (DAQ) board (PD2-MFS-2M/14, United Electronic Industries, Inc., Walpole, MA). The shaping time was 1 µs.
Signals from the PSAPD were first amplified with 5 CR-110 charge sensitive pre-amplifiers (Cremat, Watertown, MA). The cathode signal from the PSAPD was then shaped using a fast filter amplifier (ORTEC 579) with a differentiation and integration time of 10 ns and fed to a CFD to generate the timing signal for the PSAPD. The shaped signal from the corner was observed to have a rise time of 55 ns and fall time of 110 ns and the signal from the center had a rise time of 80 ns and fall time of 160 ns. The delay for the CFD was ~45 ns. The 4 anode signals from the PSAPD were shaped using the N568B shaping amplifier with a shaping time of 1 µs and recorded by the data acquisition system.
A coincidence trigger was made from the timing signals obtained from the PMT and PSAPD using a coincidence unit (Philips Scientific 756). The trigger was then delayed and width-extended using a delay and gate generator (ORTEC 416A) before being sent to the DAQ system as the trigger. The coincidence timing window 2τ was set to 88 ns where τ was the width of the trigger signals from the PMT and PSAPD. To ensure correct timing for coincidence processing, a delay of 72 ns was introduced to the PMT timing signal before being passed to the coincidence unit to account for the intrinsic timing delay between PMT and PSAPD signals. The position-dependent timing difference between the PMT and PSAPD was measured with a time-to-analog convertor (TAC) unit (ORTEC 566). The PMT timing signal was used as the start signal and the PSAPD timing signal was used as the stop signal. The output was recorded by the DAQ system. In-house developed DAQ software was used to store the raw data (Judenhofer et al., 2005).
The timing spectrum for each crystal was generated and analyzed. The centroid of the timing spectra (with respect to an arbitrary reference time) and the full-width at half-maximum (FWHM) of the timing spectra (corresponding to the timing resolution) were calculated for each crystal. The timing shift is defined as the difference in the centroid locations for events occurring in two different crystals. The CFD thresholds were set just above the noise (~60 keV) and no software energy windows were applied, either for the PMT or PSAPD signals.
2.2 Timing shift and timing resolution of a crystal array on a PSAPD
A setup similar to Figure 1 was used to measure the timing shift and timing resolution of a complete LSO crystal array on a PSAPD. The individual crystals on the PSAPD were replaced with an array consisting of 8×8 crystal elements, where the size of each element was 1.43×1.43×6 mm3. The dimension of the whole array was 12×12×6 mm3 thus it covered 73% of the area of the PSAPD. The array was centered on the PSAPD with a positioning guide made of teflon. The single crystal on the PMT was replaced with an LSO crystal array. The crystal array was composed of 12×12 individual crystals with size of 1.51×1.51×10 mm3 and the size of array was 19.2×19.2×10 mm3. An LSO array was used on the PMT because it is impractical to perform the experiment using the movable stage with a point source. The 22Na source was replaced with a cylindrical 68Ge source and placed at the center of setup. The cylindrical source had a diameter of 25 mm and a length of 50 mm, and its activity was 71 µCi. A cylindrical source was chosen to avoid constrained solid angles that might bias the results. The separation between the front surfaces of the two detectors was 120 mm and the source was placed at the center of the setup.
The digitized timing and energy data were acquired, and the flood histogram was generated with the energy data and segmented with a method modified from (Chaudhari et al., 2008). The timing data were assigned to each crystal based on the crystal lookup table (LUT). Timing spectra were generated and the shift of the centroid of the timing spectrum and the timing resolution of each crystal measured. The spectra of the three selected locations closest to the ones described in Section 2.1 were compared to the results obtained with the individual crystals.
2.3 Timing shift and resolution between a pair of crystal array-PSAPD detectors
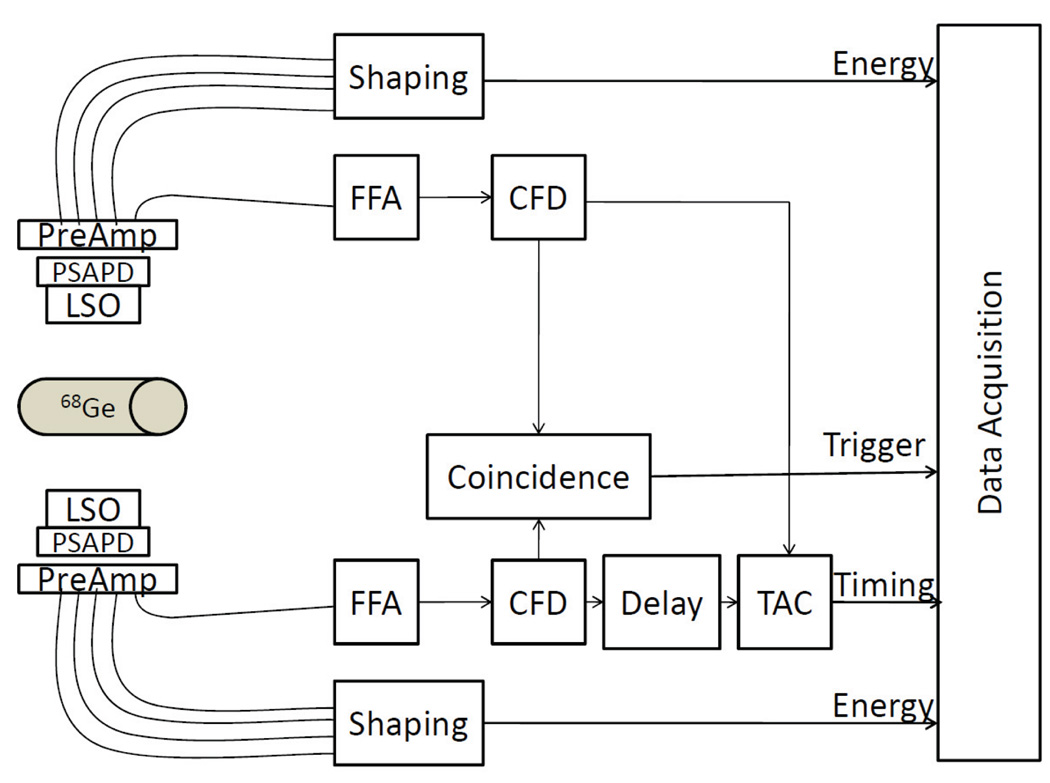
The experimental setup shown in Figure 2 was used to measure the timing shift and timing resolution between two PSAPD detectors. The same 8×8 LSO arrays described in Section 2.2 were centered on the PSAPDs with positioning guides made of teflon. Coincidences were determined directly from the two detector triggers. The timing window 2τ was 88 ns. A delay of 64 ns was added to the timing signal of one PSAPD, which was then used as the stop signal for TAC. This PSAPD detector is denoted PSAPD1. The other PSAPD detector is used as the start signal for the TAC and is denoted PSAPD2. The separation between the front surfaces of the two detectors was 120 mm and the same 68Ge source was placed at the center of setup.
Figure 2.
Experimental setup for timing measurements of two PSAPD-based LSO detectors in coincidence.
To collect sufficient information for timing alignment, a cylindrical source was chosen which was large enough to cover coincidence events between all individual crystal pairs. This measurement does not require that all pairs have exactly the same number of events. If a point source had been used, the overall timing spectrum might be artificially narrow because only a few LORs are intersecting the source.
Flood histograms and crystal LUTs were generated from the data acquired. Each event was assigned to a pair of crystals based on crystal LUTs. The timing spectrum for each pair of crystals was created and the shift of the timing centroid and the FWHM timing resolution of each pair calculated. In addition, a corner crystal on PSAPD2 was chosen as a reference crystal and the shift in the timing centroid and the FWHM timing resolution of all the crystals in the PSAPD1 detector with respect to this crystal were calculated.
2.4 Timing alignment using PMT-based detector as a reference (Method 1)
To improve the timing resolution of the pair of detectors and therefore reduce the coincidence timing window required, the timing shift differences between individual crystal pairs need to be corrected by applying a calibration offset to each pair. All PET systems generate coincidence events from single events in a coincidence unit, either in hardware or software, either centralized or distributed. A direct time alignment approach can be implemented in the coincidence processing unit, during coincidence processing, where the timing shifts of all crystal pairs are aligned by applying an offset to each crystal pair. However, this approach is not practical for two reasons. Firstly, the offset lookup table required is large, on the order of N2, where N is the total number of crystals in the whole system. Secondly, it requires complex coincidence logic; a wide coincidence window is still needed initially to find all possible coincidence events. The offset would then need to be applied from the offset LUT. Only at this point can coincidence events within a narrower coincidence window be selected. In contrast, a component-based approach can be implemented in either the coincidence or single event processing units. The difference here from the direct method is that the offset is applied to each single event using the offset value for the corresponding crystal before forming a coincidence event.
For the component-based approach, there are two ways to generate the offset LUT. One is to use a PMT-based detector as a reference, i.e. use the timing offset table derived from the timing data from a crystal array/PSAPD detector with a PMT-based detector. This would use the data generated in Section 2.2, and will be called Method 1. Method 2 uses offset tables derived from timing data obtained from a pair of PSAPD detectors, and is discussed in the next section.
For Method 1, each PSAPD can use either the same timing offset LUT (assumes timing shifts are invariant across different PSAPDs of the same size) or LUTs can be obtained for each detector separately (not studied here) in reference to a PMT-based detector. Although each individual offset LUT includes a fixed value which incorporates the intrinsic timing delay between the PMT and PSAPD signals, this cancels out if the same offset LUT is used for the two PSAPDs. A difference between the two fixed values will be included if different offset LUTs are used. However, this is not an issue for alignment correction because these timing differences only change the mean value of final timing spectra. This mean value can be subtracted. Implementation of this is further discussed in Section 4.2.
In a PET system, individual time alignment LUTs can be acquired if the detectors can be removed for individual measurement or the system has spare readout channels to insert a timing probe (Moses and Thompson, 2006) to determine multiple LUTs simultaneously. Here, we compare the use of a single, common offset LUT applied to both PSAPD detectors (Method 1) versus the use of a unique LUT for each detector (Method 2). The hypothesis is that if the timing differences are dominated by effects intrinsic to the PSAPD design, then a single common offset LUT may be sufficient for accurate time alignment. In this case, the two methods should give similar improvements in timing resolution. All offset tables were applied with a step-size of 0.3125 ns to mimic the resolution of typical commercial PET electronic systems (Musrock et al., 2003).
The timing spectra after offset correction were calculated and compared with the results obtained before correction. A coincidence timing window was calculated that would be sufficient to cover at least twice the FWHM for all crystal pairs. To calculate the overall timing window, the left (TWleft,i,j) and right (TWright,i,j) boundaries of the individual timing window were first calculated for each crystal pair using Equations 1 and 2, where TSi,j is the timing shift between crystal i from PSAPD1 and crystal j from PSAPD2 forming this pair and FWHMi,j is the timing resolution. The overall timing window width TWWoverall was then calculated with Equation 3. For calculating the overall timing window after correction with Method 1, the timing shift TSi,j was replaced by the timing shift after correction TSi,j−(TSi,PMT−TSj,PMT).
| (1) |
| (2) |
| (3) |
2.5 Timing alignment using a pair of PSAPD-detectors (Method 2)
Method 2 generates two different LUTs, one for each PSAPD-detector in a pair. This may help improve the resultant timing spectra because the relative location of the crystal array coupled to the PSAPD can be slightly different for every detector and the arrays may also have slightly different characteristics, not to mention the potential timing delay differences between each PSAPD in the system. Moreover, Method 2 can be implemented without the need to remove the detectors from a system and without the use of additional electronics channels to attach external probes.
Two timing offset LUTs were generated from the data obtained with a pair of LSO array-PSAPD detectors. MTS, the mean value of the timing shifts was first calculated using Equation 4 where TSi,j is the timing shift between crystal i from PSAPD1 and crystal j from PSAPD2 and N is the total number of crystal elements in one detector (here it was 64). The timing offset values for each crystal i from PSAPD1 (TO1,i) and crystal j from PSAPD2 (TO2,j) were calculated with Equations 5 and 6. To compare with the results obtained with Method 1, the offset LUTs were manually shifted to have the same mean value MTS,PMT as Method 1 calculated using Equation 7. As per Method 1, these timing offset LUTs include an arbitrary fixed mean value MTS,PMT, but this can be subtracted. For each pair, the offset TOPi,j was calculated using Equation 8 and applied to the timing data.
| (4) |
| (5) |
| (6) |
| (7) |
| (8) |
The timing shifts and coincidence timing window (same definition as in Section 2.4) after timing alignment correction were calculated and compared with those obtained with no timing alignment in Section 2.3. For calculating the overall timing window after correction with Method 2, the timing shift TSi,j was replaced by the timing shift after correction TSi,j−TOPi,j.
2.6 PSAPD size effect on timing
With larger area PSAPDs, more detector elements can be decoded with one photodetector and less electronics channels are needed per unit detector area. Due to the finite deadspace of the packaging around PSAPDs, this also increases the packing fraction, potentially increasing the sensitivity that is of significance for PET applications. However, the timing shift is mainly caused by the capacitance of the PSAPD and the resistive readout on the anode side that provides spatial location information. Increasing the size of the PSAPD should increase the capacitance and cause greater timing shifts between different regions of the PSAPD. To explore this, we compared the timing shifts measured from a 20×20 mm2 PSAPD to those from a 14×14 mm2 PSAPD, using the methods described in Section 2.1. The signal from a corner crystal had similar rise time and fall time to those observed with the 14×14 mm2 PSAPD. As the signal from the center of a 20×20 mm2 PSAPD was very slow (rise time of ~150ns and fall time of ~300ns), the timing shift was studied at two different CFD delays of 45 and 125 ns.
3 Results
3.1 Timing shift and timing resolution at various locations on PSAPD surface
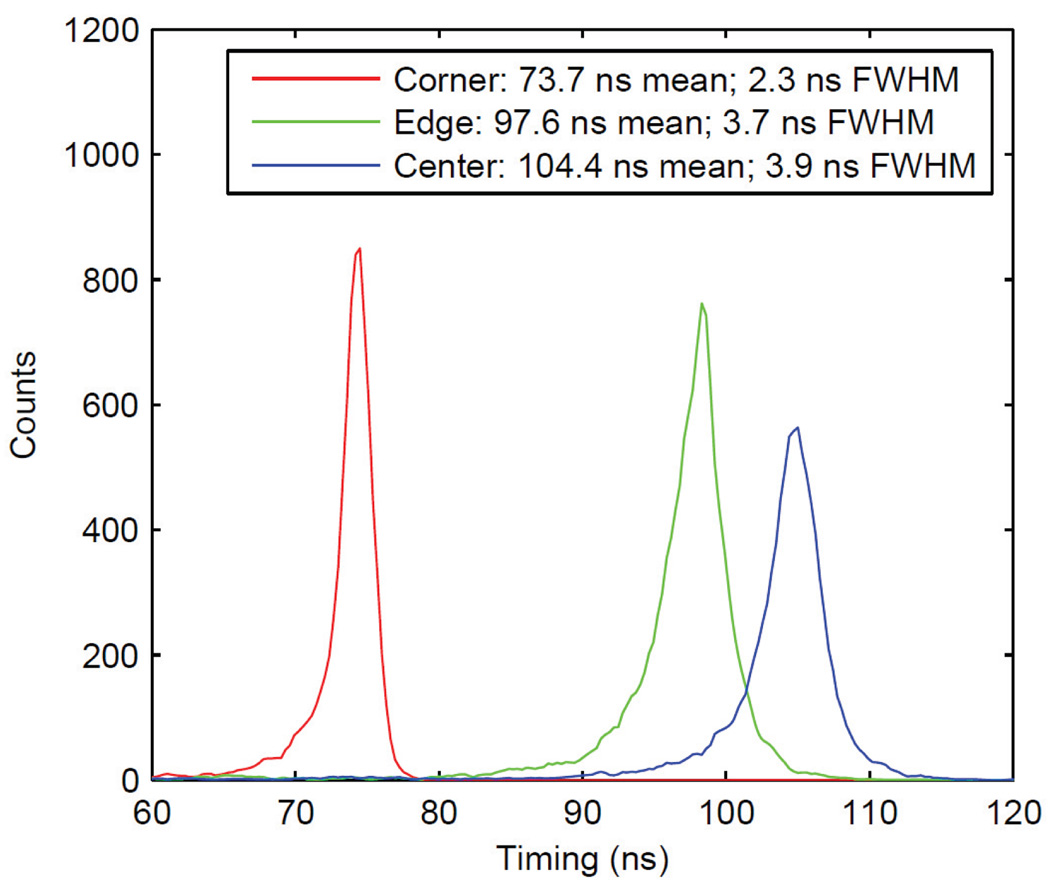
Figure 3 shows the timing spectra at three representative locations on a PSAPD. The timing is measured relative to the PMT signal, so each centroid includes a fixed value corresponding to the timing delay between the PMT and PSAPD. The corner position had the fastest signal and the best timing resolution of 2.3 ns while the center position had the slowest signal and worst timing resolution of 3.9 ns. The timing shift between the corner and the center crystals was 30.7 ns. Because of this shift, current PET systems using PSAPD technology need a wide timing window to accept coincident events from all locations across the surface of the PSAPDs. This necessarily increases the random events detected as well, decreasing the noise equivalent count rate (NECR), especially at high count rates.
Figure 3.
Timing shift and resolution at three locations on the surface of a PSAPD.
3.2 Timing shift and timing resolution of a crystal array on a PSAPD
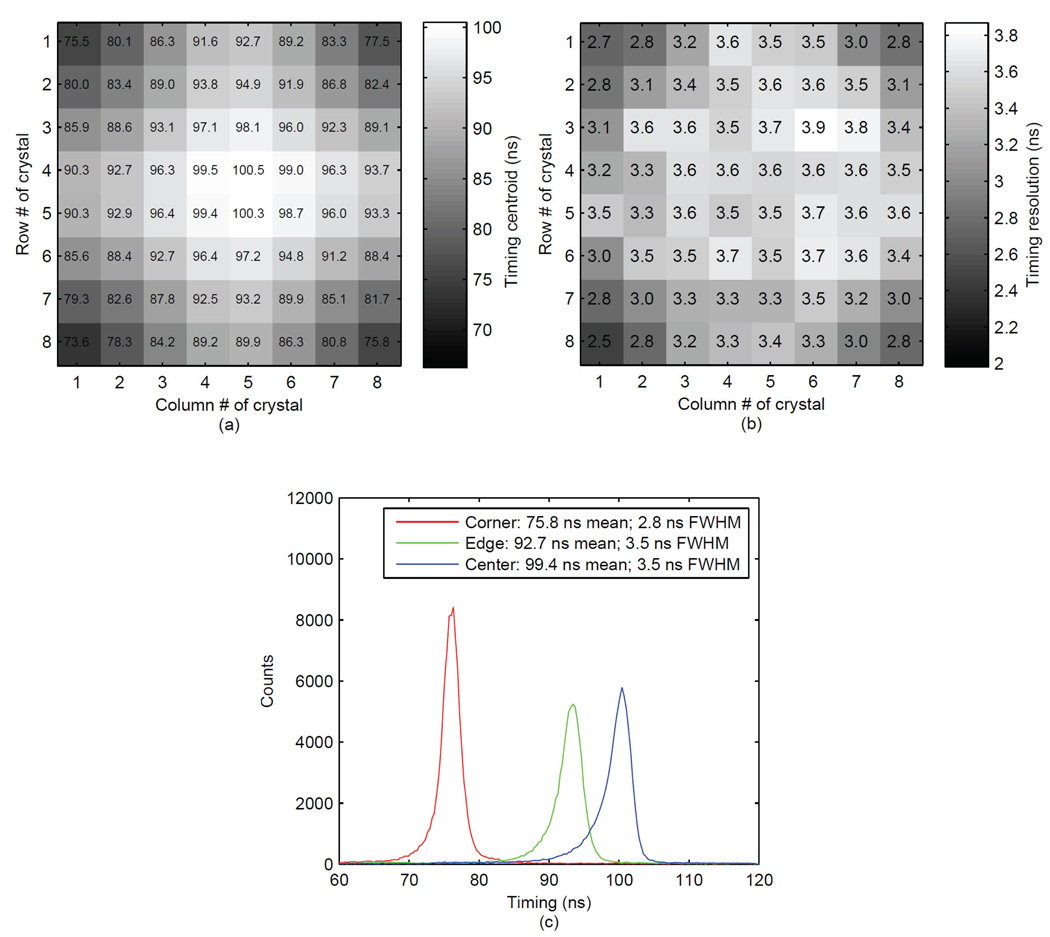
The timing characteristics for each crystal of an LSO array/PSAPD detector in coincidence with a PMT-based detector are plotted as a spatial distribution map in Figures 4a and 4b. The timing centroids had a standard deviation of 6.8 ns and the maximum timing shift was 26.9 ns. For timing resolutions, mean values of 3.4 ns with a standard deviation of 0.3 ns were observed with a maximum value of 3.9 ns and a minimum of 2.5 ns. The timing spectra for three crystal locations, corner, edge and close to the center are shown in Figure 4c. In agreement with the single crystal data, the results showed that corner locations had the fastest signal and best timing resolution of 2.8 ns and the central locations had slower signals and a worse timing resolution of 3.5 ns. The timing shift from the corner to center was 23.6 ns. The reduction in timing shift compared with the single crystal data of Section 3.1 is presumably due to some light sharing between crystals, which results in a greater spread of the scintillation light once it reaches the PSAPD surface.
Figure 4.
Spatial map of (a) the centroids of timing spectra (ns) and (b) the timing resolution (ns) for the whole array and timing spectra (c) for crystals at three representative locations on the PSAPD (comparable to the locations in Figure 3).
3.3 Timing shift and resolution between a pair of crystal array-PSAPD detectors
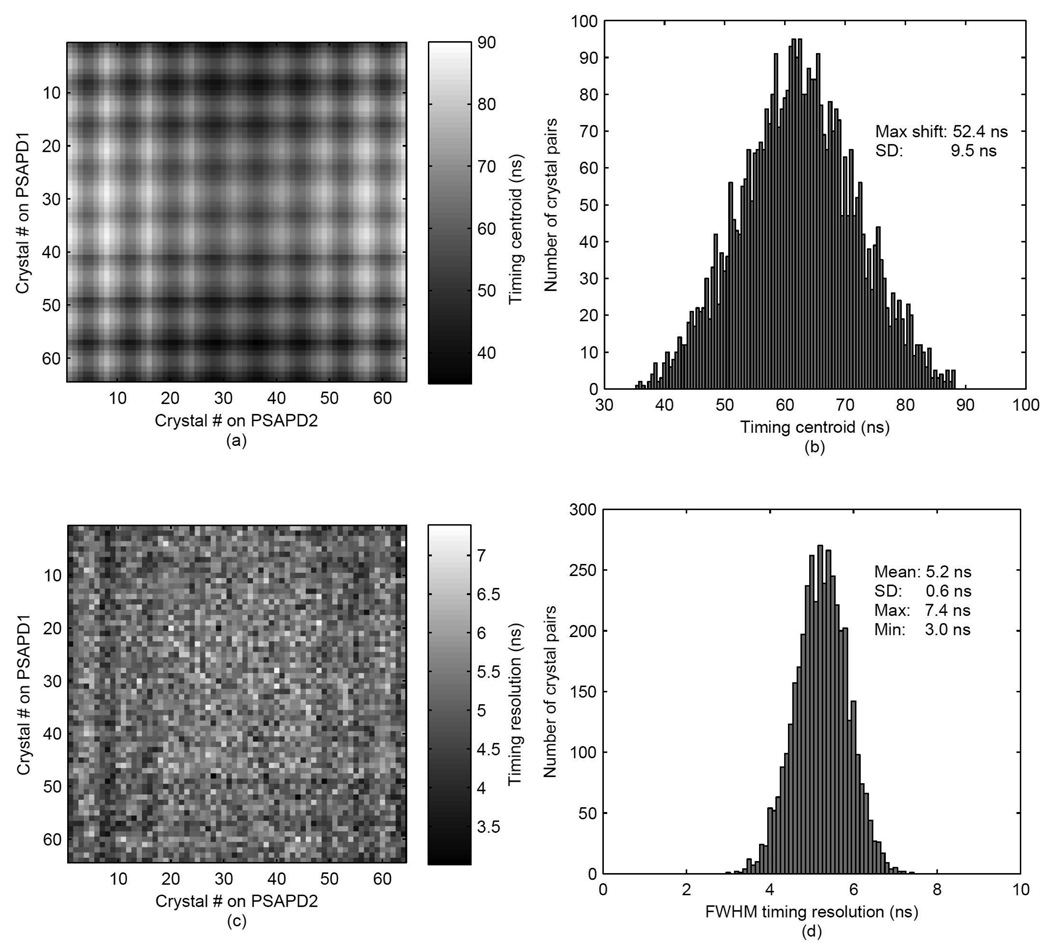
The map of the centroids of the timing spectra is shown for each pair of crystals in Figure 5a and the histogram of these centroid locations is shown in Figure 5b. The 64 crystals in the array in Figure 5a are numbered horizontally with 1 corresponding to the top left corner, 8 to the top right corner and 64 to the bottom right corner of the array. The timing centroids had a standard deviation of 9.5 ns and the maximum timing shift was 52.4 ns. The timing resolution map and the corresponding timing resolution histogram for each pair of crystals are shown in Figures 5c and 5d respectively. A mean FWHM timing resolution of 5.2 ns with a standard deviation of 0.6 ns was measured, with a maximum value of 7.4 ns of and a minimum value of 3.0 ns.
Figure 5.
Crystal-crystal map of (a) centroids of timing spectra, (b) histogram of centroids, (c) map of timing resolution and (d) histogram of timing resolution for all crystal pairs.
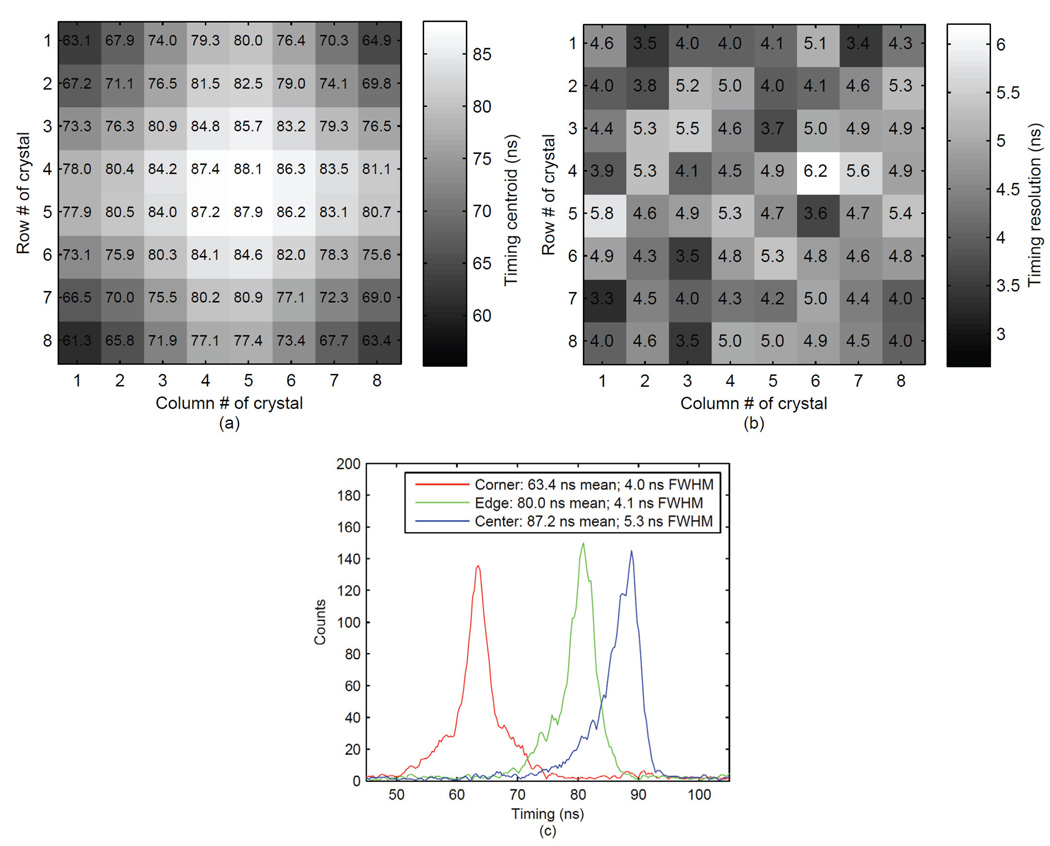
The centroid of the timing spectra and the timing resolutions for the crystals in PSAPD1 in coincidence with one corner crystal of PSAPD2 (opposing to the corner crystal on PSAPD1) are plotted in Figures 6a and 6b. Three representative locations were chosen and the timing spectra are plotted in Figure 6c. The results showed that the corner crystal had the fastest signal and timing resolution of 4.0 ns while the center had the slowest signal and worst timing resolution of 5.3 ns. The timing shift difference from the corner to the center was 23.8 ns.
Figure 6.
Spatial map of (a) centroids of timing spectra (ns), (b) timing resolution (ns) of crystals in PSAPD1 with respect to corner crystal in PSAPD2 and (c) timing spectra for three representative locations.
3.4 Timing alignment using PMT-based detector as a reference (Method 1)
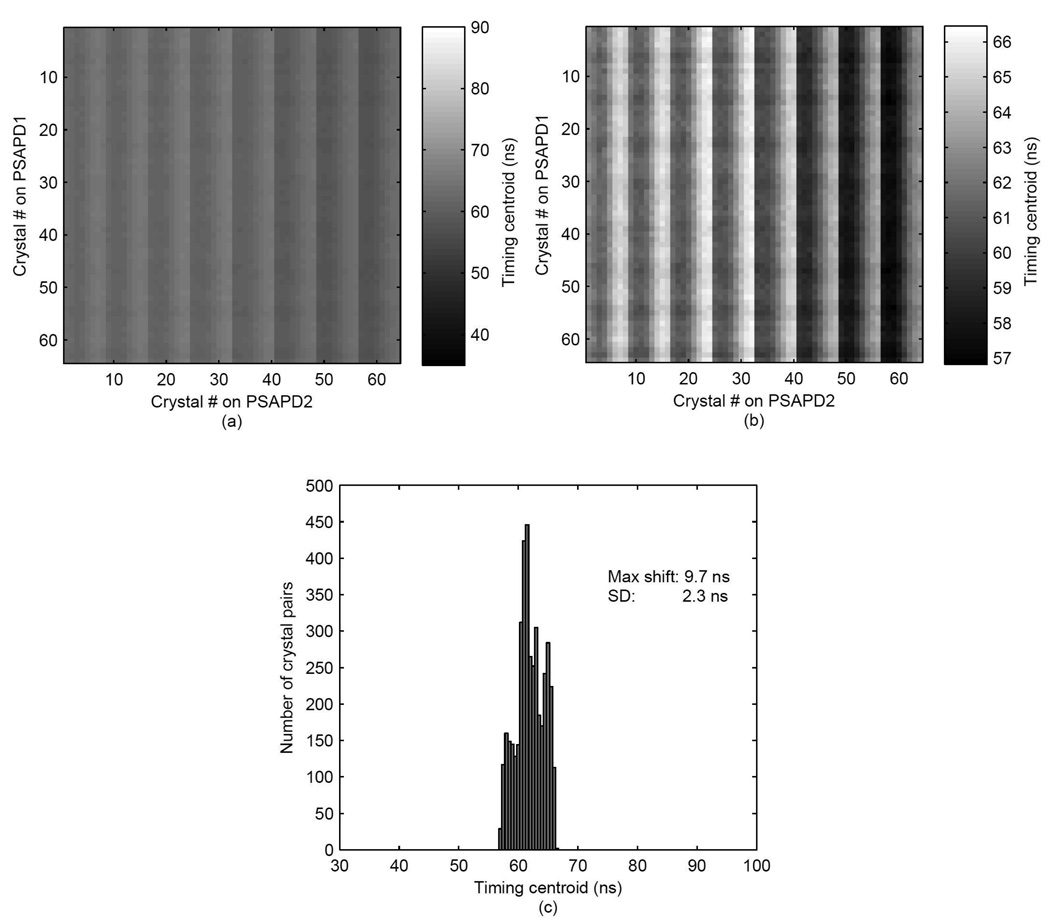
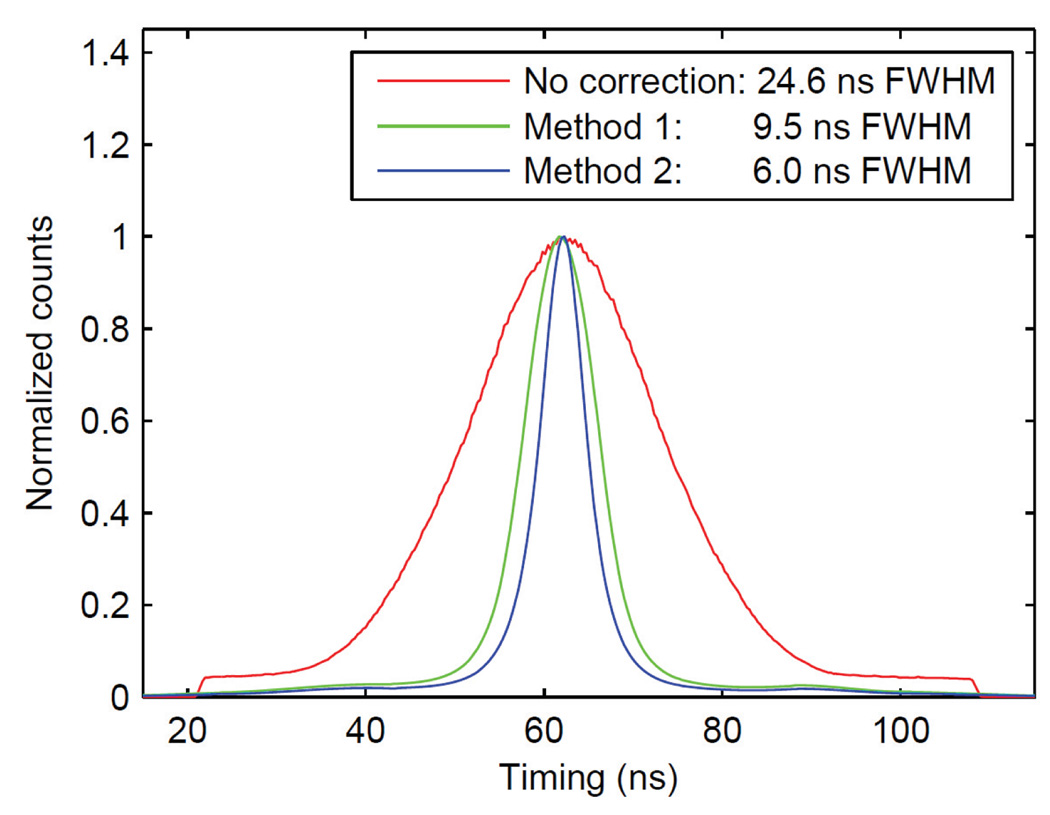
The timing offset LUT derived from Section 3.2 was applied to both PSAPDs. A map of the timing centroid for all crystal pairs after offset correction is plotted in Figure 7a (same scale as Figure 5a) and in Figure 7b (expanded scale). The histogram of the timing centroids is plotted in Figure 7c. The timing centroids had a standard deviation of 2.3 ns and the maximum timing shift was 9.7 ns. The measured averaged timing spectra of the pair of arrays before correction (red line) and after correction using Method 1 (green line) are plotted in Figure 10. The FWHM timing resolutions of the pair of arrays were 24.6 and 9.5 ns before and after correction respectively. The required timing window improved from 65.1 ns to 22.0 ns after correction.
Figure 7.
Crystal-crystal map of timing centroids plotted (a) on same scale as Figure 5a and (b) on expanded scale, and (c) histogram of timing centroids after time alignment correction with Method 1.
Figure 10.
Measured averaged timing spectra (over all crystal pairs) without (red line) and with timing offset correction Method 1 (green line) and Method 2 (blue line).
From Figures 7a and 7b, it is apparent that using the same offset LUT to correct both PSAPDs does not align all crystal pairs evenly. The maximum residual timing shift of 9.7 ns is still greater than the worst FWHM timing resolution of 7.4 ns measured between crystal pairs, thus these residual timing shifts still are the primary determinant of the timing window. This suggests that using one LUT is not likely the optimal method for time alignment.
3.5 Timing alignment using a pair of PSAPD-detectors (Method 2)
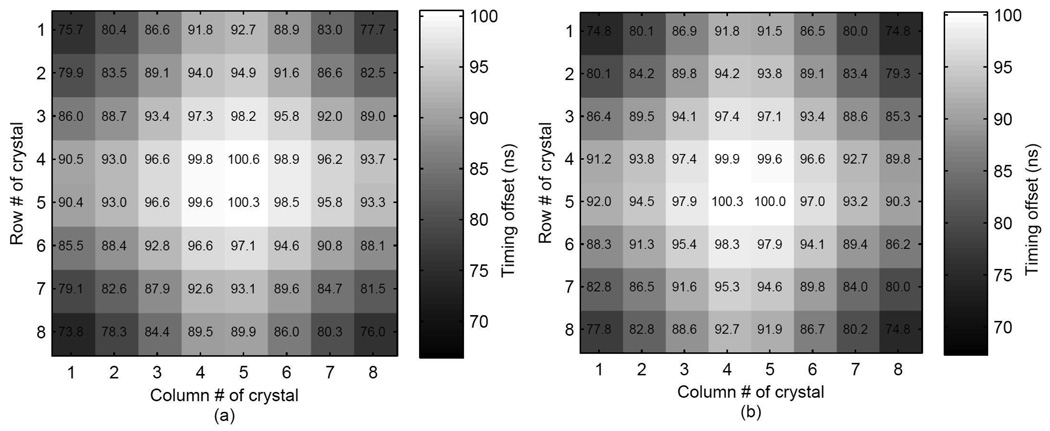
The timing offset LUTs generated from the two individual PSAPDs are shown in Figure 8. PSAPD1 which was used in the LSO array-PSAPD versus PMT measurements had almost the same offset table as measured previously (Figure 4a) while PSAPD2 had slightly different behavior (difference up to 4.5 ns), although overall metrics were similar. The timing offset table of PSAPD1 had a mean value of 89.7 ns, standard deviation of 6.8 ns, a maximum value of 100.6 ns and a minimum value of 73.8 ns. The timing offset table of PASPD2 had a mean value of 89.7 ns, standard deviation of 6.7 ns, maximum of 100.3 ns and minimum of 74.8 ns.
Figure 8.
Timing offset LUTs of (a) PSAPD1 and (b) PSAPD2 used for correction Method 2.
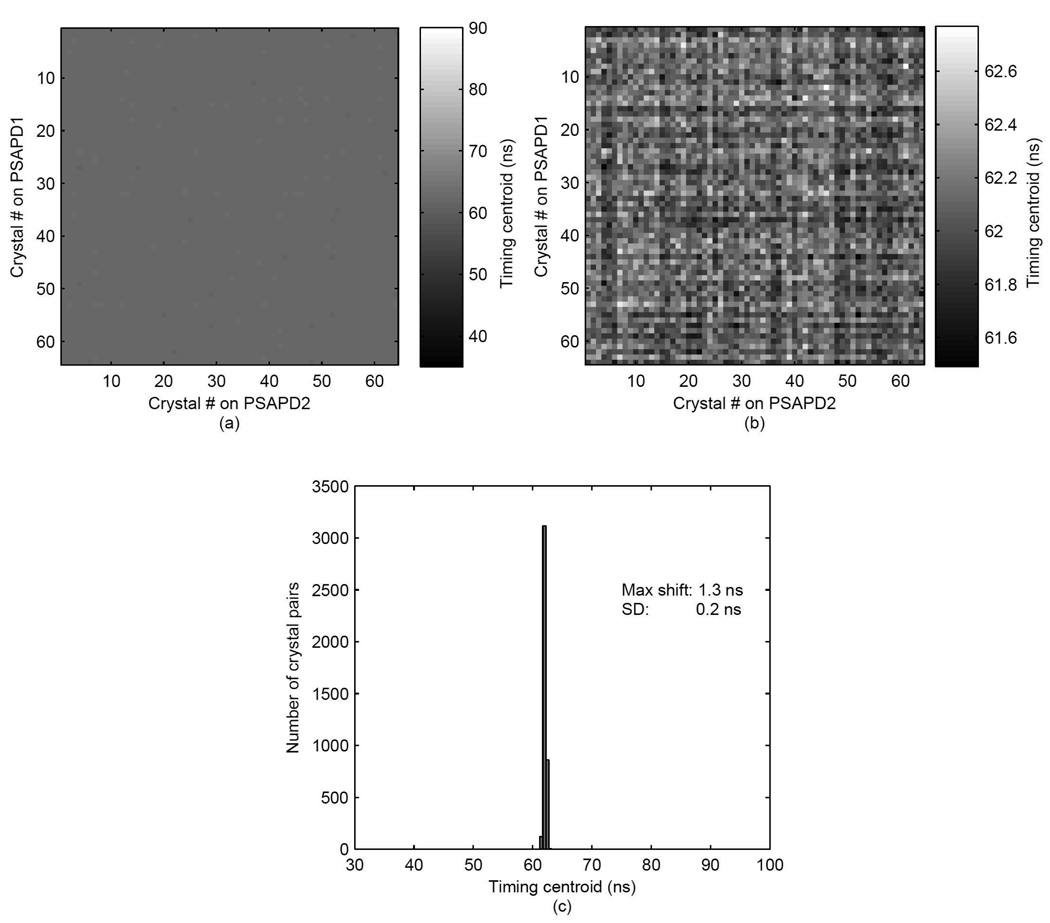
A map of the timing centroids for all crystal pairs after correction is shown in Figure 9a (same scale as Figure 5a) and in Figure 9b with expanded scale. The histogram of these centroids is plotted in Figure 9c. The timing centroids had a standard deviation of 0.2 ns and the maximum timing shift was reduced to just 1.3 ns. Compared to the results in Figure 7, no obvious correction bias to any particular crystal pair was observed in the map. A narrower timing centroid distribution was also seen. The measured averaged timing spectrum of the pair of arrays after this timing correction was applied is plotted in Figure 10 (blue line) and the FWHM timing resolution was measured to be 6.0 ns. The timing window necessary to cover twice the FWHM timing resolution for all crystal pairs was 15.2 ns.
Figure 9.
Crystal-crystal map of timing centroids plotted (a) on same scale as Figure 5a and (b) on expanded scale, and (c) histogram of timing centroids after time alignment correction with Method 2.
The results without correction and with the two time alignment correction methods are summarized in Table 1. The timing resolutions of individual crystal pairs were the same with and without correction. The difference between the maximum and minimum of the timing centroids after correction was significantly reduced from 52.4 ns to 9.7 ns or 1.3 ns respectively, and the FWHM timing resolution was improved from 24.6 ns to 9.5 ns or 6.0 ns respectively. The timing windows that could be applied were reduced from 65.1 ns to 22.0 ns or 15.2 ns respectively. The correction with one offset table for each PSAPD (Method 2) gave better results than one offset table for all PSAPDs (Method 1).
Table 1.
Comparison of results (unit: ns)
| Individual crystal pairs | Whole arrays | |||||||
|---|---|---|---|---|---|---|---|---|
| Timing resolution (FWHM) |
Timing centroid (mean of spectrum) |
Timing resolution (FWHM) |
Timing window (2τ) |
|||||
| Mean | SD | Max | Min | SD | Max-Min | |||
| No Correction | 5.2 | 0.6 | 7.4 | 3.0 | 9.5 | 52.4 | 24.6 | 65.1 |
| Method 1 | 5.2 | 0.6 | 7.4 | 3.0 | 2.3 | 9.7 | 9.5 | 22.0 |
| Method 2 | 5.2 | 0.6 | 7.4 | 3.0 | 0.2 | 1.3 | 6.0 | 15.2 |
3.6 PSAPD size effect on timing
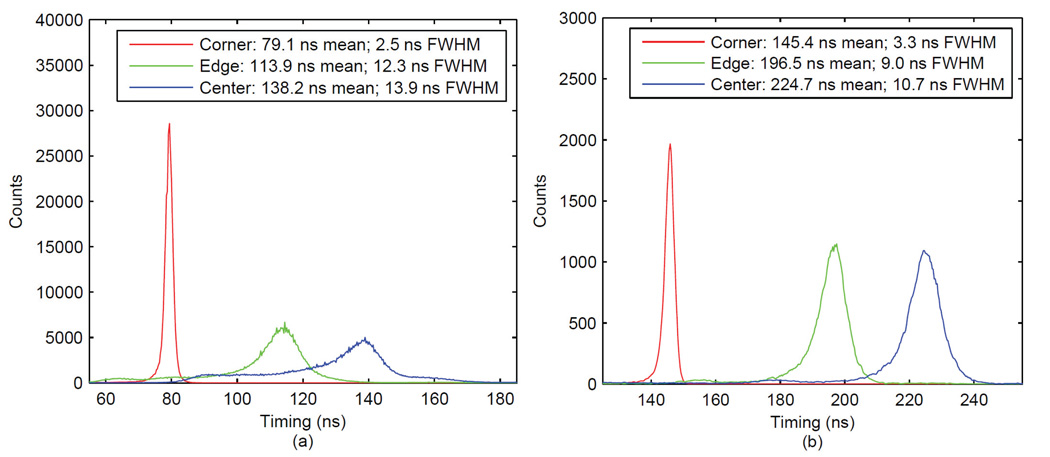
Using a 45 ns CFD delay, the results from a larger 20×20 mm2 PSAPD are plotted in Figure 11a. The center and edge crystals had very broad and asymmetric timing spectra with a FWHM of up to 13.9 ns. The left bump observed in the timing spectra of the center crystal in Figure 11a is probably caused by triggering on noise and the right bump is likely due to energy-dependent walk when the CFD operates as a leading-edge discriminator for low energy events. With a 125 ns CFD delay (Figure 11b), all three crystals had narrow timing spectral peaks and had timing centroids of 145.4, 196.5 and 224.7 ns and FWHM of 3.3, 9.0 and 10.7 ns respectively. Compared to the 14×14 mm2 PSAPD, the 20×20 mm2 PSAPD had a similar timing shift effect but the magnitude of both the offset of the centroids and the FWHM were greater. These results suggest that a 45 ns CFD delay was not enough to resolve signals arising from the crystal at the center of the 20×20 mm2 PSAPD. This signal required a longer CFD delay for proper peak resolution.
Figure 11.
Timing spectra obtained from 20 × 20 mm2 PSAPD with CFD delay of (a) 45 ns and (b) 125 ns.
4 Discussion
4.1 Comparison of timing shift and timing resolution in different experimental setups
Moving from individual crystals (Figure 3) to crystal arrays (Figure 4c), the timing shift was reduced, from 30.7 ns to 23.6 ns, and the timing resolution degraded slightly for a crystal located at the corner (from 2.3 ns to 2.8 ns), while there was a small improvement in timing resolution for crystals located on the edge or at the center (from 3.7 ns to 3.5 ns and 3.9 ns to 3.5 ns respectively). This is presumably due to effects of light sharing within the crystal array that results in a greater spread of the scintillation light once it reaches the PSAPD surface. The exact positioning of the crystal with respect to the PSAPD surface may also contribute to the small differences in timing resolution. Comparing the timing resolution obtained using a PMT reference (Figure 4c) to that obtained using one corner crystal on PSAPD2 as a reference (Figure 6c), the timing resolution became worse due to the lower timing resolution of the reference crystal (2~3 ns) and possible scattering (causing event mispositioning) in the crystal array on PSAPD1. The timing shift however remained almost the same, 23.6 ns and 23.8 ns respectively.
4.2 Implementation of timing alignment in an intact detector system
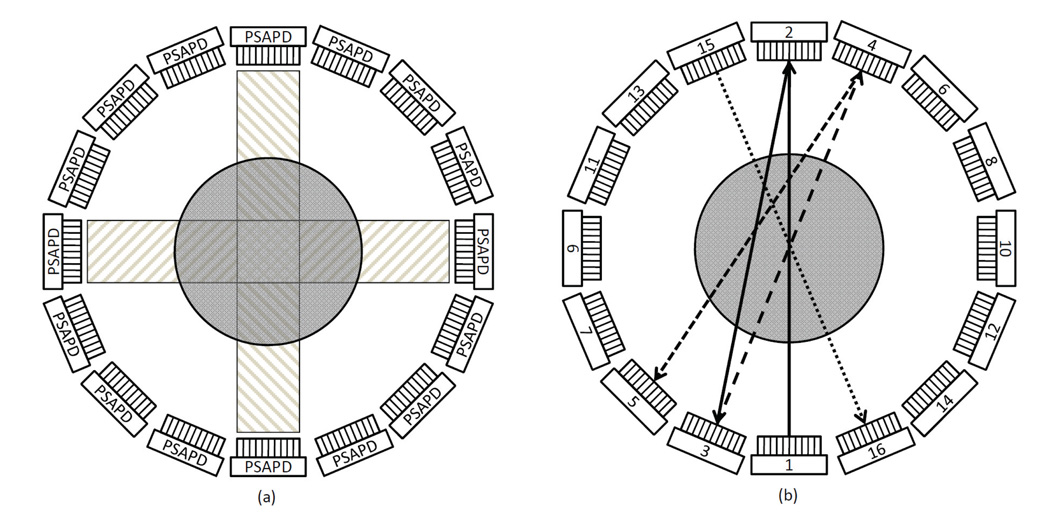
Timing alignment methods have been reported by several groups to improve timing resolution in detectors (Lenox et al., 2007) or systems (Lenox et al., 2006; Moses and Thompson, 2006). Because of the large timing shift in the PSAPD and potential integration with a MR system, these methods cannot be directly implemented in a PSAPD-based system. The timing correction/alignment described in Method 2 can however be implemented in a system with multiple PSAPDs in two steps: the first step is to determine the offset LUT for each PSAPD detector; this is followed by an alignment between the LUTs for all the detectors in the ring. The first step is shown in Figure 12a and can be performed in sequential pairs. In the single-ring configuration shown, there are 16 PSAPDs that are divided into 8 directly opposing pairs. The method described in Section 2.5 can be applied to each pair of PSAPDs. The mean value of each LUT can be subtracted to generate individual offset tables.
Figure 12.
Timing alignment scheme: to generate offset map for each individual PSAPD (a) and between PSAPDs (b). The cylinders in (a) and (b) represent the sources. The rectangles in (a) represent the regions covered by the opposing detector pairs. The lines with arrows in (b) show the calibration sequence, starting from PSAPD #1 and ending at #16. The lines from #5 to #15 are omitted for clarity.
The second step is to time align the offset LUTs between all the detectors in the ring. As shown in Figure 12b, this can be achieved by choosing one PSAPD detector as the reference. In the figure, PSAPD #1 is selected as the reference and the residual offset of PSAPD #2 compared to PSAPD #1 can be calculated by acquiring coincidences between detectors 1 and 2 after applying their individual offset tables. The offset of PSAPD #3 can be obtained by using #2 as reference, and so on. The source should be placed at the center as precisely as possible to minimize measurement error. After all 16 offsets are obtained, the mean value of these 16 offsets can be subtracted to generate a unique residual offset value for each PSAPD in the ring. By adding this residual offset value of PSAPD to the offset table of each PSAPD, the final offset table for the system calibration can be achieved. The second step can be easily extended to apply to multiple-ring systems.
4.3 PSAPD size effect
Using a long CFD delay (125 ns) gave reasonable timing resolution across the surface of 20×20 mm2 PSAPD, but it also caused energy thresholding problems, as shown in Figure 13a and 13b. For a CFD delay of 45 ns, the effective energy threshold for the corner was slightly higher than the edge and center, albeit still sufficient for adequate thresholding for a PET system. For a delay of 125 ns however, the effective threshold for the corner is much higher than the center despite having similar photopeak energies. The reason is that the constant fraction (CF) signal comes later than the duration of the thresholded signal for low energy events and therefore it is not triggered. This non-uniform response across the surface of PSAPD may cause normalization and/or random subtraction problems. The higher effective threshold associated with the longer CFD delay forces the PSAPD to work at very low threshold level, increasing the count rate and false triggers which have effects on dead time. Thus using larger PSAPDs, there is a challenge in simultaneously obtaining good energy and timing resolution because it is hard to find a CFD delay that is good for both measures. The proper functioning of a CFD relies on pulses varying only in amplitude, not in shape. But this is not the case in PSAPDs. A short delay did not provide good timing resolution because of the high noise associated with the signal. We are therefore exploring other techniques, including non-cable delay CFD (Binkley et al., 2002) and other signal processing techniques, for these large-area PSAPDs.
Figure 13.
Energy spectra obtained from 20×20 mm2 PSAPD with CFD delay of (a) 45 ns and (b) 125 ns.
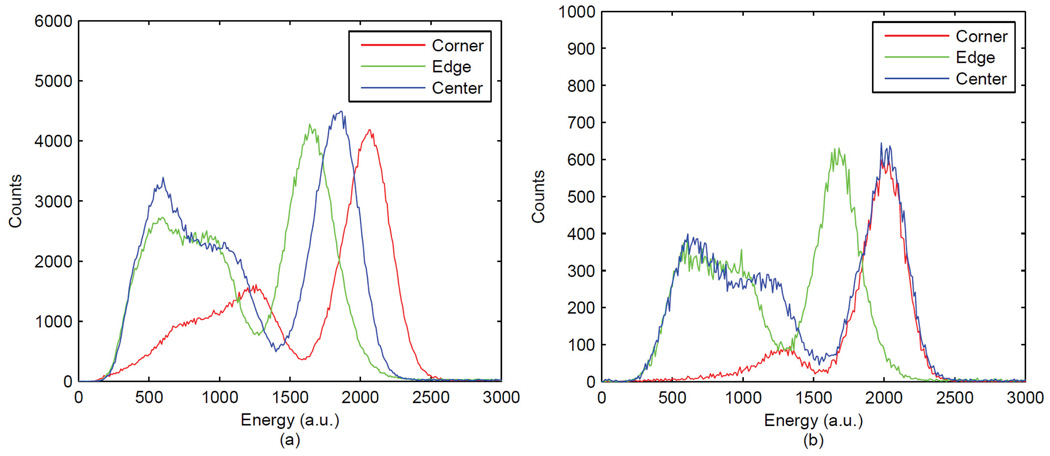
Another effect that can be seen from Figure 13 is the shift of photopeak and this is due to the sampling in the DAQ. The DAQ digitizes only one peak value for each signal per event and the sampling position is determined by the DAQ trigger which is a delayed version of the coincidence trigger. A shift in the trigger location caused the shift in energy photopeak, however this is not an issue as each individual crystal is calibrated using its own photopeak. In Figure 13a, the relatively small fraction of events that exhibit energy-dependent walk and the relatively small magnitude (up to 30 ns) of that walk does not have a significant effect on energy spectra in our studies because of the long shaping time used (1 µs).
5 Conclusions & Future Work
The position-dependent timing shift and timing resolution of PSAPDs were studied and two methods to correct these phenomena were described. Moving from the corner to the center of a PSAPD, the rise time of the signal becomes slower and the timing resolution worsened. Larger area PSAPDs magnified this effect. Correction of this effect using one offset lookup table derived from events acquired between an LSO array/PSAPD detector and a PMT reduced the timing shift and improved the timing resolution, thus allowing the coincidence timing window to be tightened. Using individual offset tables derived for each individual PSAPD the shift was further reduced. This additional improvement was probably because of the other contributions to the timing shift in addition to the intrinsic effect of PSAPD design, such as positioning of crystal array or unique characteristics of each crystal array. The timing correction methods described in this study can be applied to whole detector systems with multiple PSAPDs using a two-step algorithm. Future studies will involve applying these correction methods in novel PSAPDs detector systems. Further work is needed to determine the optimal detection electronics for larger area PSAPDs where the changes in signal shape across the face of the PSAPD make it hard to simultaneously achieve good timing and energy resolution.
Acknowledgments
The authors thank Dr Ciprian Catana from Athinoula A. Martinos Center for Biomedical Imaing, Department of Radiology, Massachusetts General Hospital for useful discussions; Dr Guobao Wang from the Department of Biomedical Engineering, University of California, Davis for useful discussions; and RMD Inc. for providing the PSAPDs. This work was supported by NIH under grants R01 EB000993, R01 EB006109 and R44 NS055377.
Footnotes
PACS: 85.60.Dw, 85.60.Gz, 87.57.uk
References
- Binkley DM, Puckett BS, Swann BK, Rochelle JM, Musrock MS, Casey ME. A 10-Mc/s, 0.5-mu m CMOS constant-fraction discriminator having built-in pulse tail cancellation. IEEE Transactions on Nuclear Science. 2002;49:1130–1140. [Google Scholar]
- Catana C, Procissi D, Wu Y, Judenhofer MS, Qi J, Pichler BJ, Jacobs RE, Cherry SR. Simultaneous in vivo positron emission tomography and magnetic resonance imaging. Proc Natl Acad Sci U S A. 2008;105:3705–3710. doi: 10.1073/pnas.0711622105. [DOI] [PMC free article] [PubMed] [Google Scholar]
- Catana C, Wu YB, Judenhofer MS, Qi JY, Pichler BJ, Cherry SR. Simultaneous acquisition of multislice PET and MR images: Initial results with a MR-compatible PET scanner. Journal of Nuclear Medicine. 2006;47:1968–1976. [PubMed] [Google Scholar]
- Chaudhari AJ, Joshi AA, Bowen SL, Leahy RM, Cherry SR, Badawi RD. Crystal identification in positron emission tomography using nonrigid registration to a Fourier-based template. Physics in Medicine and Biology. 2008;53:5011–5027. doi: 10.1088/0031-9155/53/18/011. [DOI] [PMC free article] [PubMed] [Google Scholar]
- Despres P, Barber WC, Funk T, McClish M, Shah KS, Hasegawa BH. Modeling and correction of spatial distortion in position-sensitive avalanche photodiodes. IEEE Transactions on Nuclear Science. 2007;54:23–29. [Google Scholar]
- Grazioso R, Farrell R, Shah KS, Glodo J, Olschner F. A novel, distortion-free position sensitive APD for nuclear imaging; Nuclear Science Symposium Conference Record, 2002 IEEE; 2002. pp. 464–467. [Google Scholar]
- Judenhofer MS, Pichler BJ, Cherry SR. Evaluation of high performance data acquisition boards for simultaneous sampling of fast signals from PET detectors. Physics in Medicine and Biology. 2005;50:29–44. doi: 10.1088/0031-9155/50/1/003. [DOI] [PubMed] [Google Scholar]
- Lenox M, McFarland A, Burbar Z, Hayden C. Coincidence timing analysis of APD based PET detectors; Nuclear Science Symposium Conference Record, 2007. NSS '07. IEEE; 2007; pp. 3766–3769. [Google Scholar]
- Lenox MW, Atkins BE, Pressley DR, McFarland A, Newport DF, Siegel SB. Digital Time Alignment of High Resolution PET Inveon Block Detectors; Nuclear Science Symposium Conference Record, 2006. IEEE; 2006. pp. 2450–2453. [Google Scholar]
- Moses WW, Thompson CJ. Timing Calibration in PET Using a Time Alignment Probe. IEEE Transactions on Nuclear Science. 2006;53:2660–2665. [Google Scholar]
- Musrock MS, Young JW, Moyers JC, Breeding JE, Casey ME, Rochelle JA, Binkley DM, Swann BK. Performance characteristics of a new generation of processing circuits for PET applications. IEEE Transactions on Nuclear Science. 2003;50:974–978. [Google Scholar]
- Pichler BJ, Judenhofer MS, Catana C, Walton JH, Kneilling M, Nutt RE, Siegel SB, Claussen CD, Cherry SR. Performance test of an LSO-APD detector in a 7-T MRI scanner for simultaneous PET/MRI. Journal of Nuclear Medicine. 2006;47:639–647. [PubMed] [Google Scholar]
- Shah KS, Farrell R, Grazioso R, Harmon ES, Karplus E. Position-sensitive avalanche photodiodes for gamma-ray imaging. IEEE Transactions on Nuclear Science. 2002;49:1687–1692. [Google Scholar]
- Shah KS, Grazioso R, Farrell R, Glodo J, McClish M, Entine G, Dokhale P, Cherry SR. Position sensitive APDs for small animal PET imaging. IEEE Transactions on Nuclear Science. 2004;51:91–95. [Google Scholar]
- Yang YF, Wu YB, Qi JY, James SS, Du HN, Dokhale PA, Shah KS, Farrell R, Cherry SR. A prototype PET scanner with DOI-encoding detectors. Journal of Nuclear Medicine. 2008;49:1132–1140. doi: 10.2967/jnumed.107.049791. [DOI] [PMC free article] [PubMed] [Google Scholar]
- Zhang J, Foudray AMK, Cott PD, Farrell R, Shah K, Levin CS. Performance characterization of a novel thin position-sensitive avalanche photodiode for 1 mm resolution positron emission tomography. IEEE Transactions on Nuclear Science. 2007;54:415–421. [Google Scholar]


