Abstract
A dedicated breast PET/CT system has been constructed at our institution, with the goal of having increased spatial resolution and sensitivity compared to whole-body systems. The purpose of this work is to describe the design and the performance characteristics of the PET component of this device. Average spatial resolution of a line source in warm background using maximum a posteriori (MAP) reconstruction was 2.5 mm, while average spatial resolution of a phantom containing point sources using filtered back projection (FBP) was 3.27 mm. A sensitivity profile was computed with a point source translated across the axial field of view (FOV) and the peak sensitivity of 1.64% was measured at the center of FOV. Average energy resolution determined on a per-crystal basis was 25%. Characteristic dead time for the front-end electronics and data acquisition (DAQ) was determined to be 145 ns and 3.6 µs, respectively. With no activity outside the FOV, a peak noise-equivalent count rate of 18.6 kcps was achieved at 318 µCi (11.766 MBq) in a cylindrical phantom of diameter 75 mm. After the effects of exposing PET detectors to x-ray flux were evaluated and ameliorated, the combined PET/CT scan was performed. The percentage standard deviations of uniformity along axial and transaixal directions were 3.7% and 2.8%, respectively. The impact of the increased reconstructed spatial resolution compared to typical whole-body PET scanners is currently being assessed in a clinical trial.
Keywords: instrumentation, PET, CT, breast imaging
1 Introduction
Positron emission tomography (PET) scanning is used routinely in assessing therapy response, staging, and restaging of breast cancer (Linden et al., 2006; Eubank and Mankoff, 2005). However, whole-body PET scanners are limited by low geometric sensitivity, low spatial resolution and signal loss due to attenuation in the body, and this reduces their utility in detecting small lesions (< 1 cm) and/or those with low tracer uptake (Avril et al., 2000). Since breast cancer patients frequently present with lesions < 1 cm in size, this is a significant limitation in the management of primary breast cancer. To overcome this, several groups are working on dedicated breast imaging systems with high-resolution detectors that can be placed close to the breast.
Of these, the scanner with the most clinical exposure to date is the PEM Flex (Naviscan PET systems, Inc, San Diego, CA). This device scans across the moderately compressed breast to cover up to a 24×16.4 cm field of view (FOV) (Weinberg et al., 2004). Data is partially tomographic, and the realized spatial resolution is 2.5 mm full-width at half-maximum (FWHM) parallel to the detectors and 6 mm perpendicular to them. Reports of clinical testing of this scanner are given in several publications including (Tafra et al., 2005) and (Berg et al., 2006). Devices that also scan the moderately compressed breast include that described by Turkington et al. (Turkington et al., 2002) and that described by Robar et al. (Robar et al., 1997). Assessments of the clinical performance of these devices have been reported by Rosen et al. (Rosen et al., 2005) and by Murthy et al. (Murthy et al., 2000) respectively. Fully tomographic dedicated breast PET scanners have also been constructed by Raylman et al. (Raylman et al., 2008), Wang et al. (Wang et al., 2006), the Crystal Clear Collaboration (Abreu et al., 2007) and the Shimadzu Corporation (Kitamura et al., 2008). Other devices are also proposed or under construction at Washington University, St Louis (Tai et al., 2006) and at Stanford University (Levin et al., 2004). A multi-purpose scanner that can be configured for breast imaging has also been built at MD Anderson Cancer Center (Li et al., 2007).
While PET provides good information about molecular processes, it has little structural information compared to computed tomography (CT) or magnetic resonance imaging (MRI). Combined PET/CT scanners allow near-simultaneous imaging of function and anatomy (Beyer and Townsend, 2006). In addition to serving as an anatomical reference, the CT image is also widely used for generation of the attenuation map for PET image reconstruction. Further, mismatch of findings between PET and X-ray breast imaging has been demonstrated to be highly predictive of malignancy (Berg et al., 2006) and accurate co-registration of tomographic breast PET and CT is likely to make the task of identifying such mismatch significantly easier. However, in the neoadjuvant chemotherapy setting, it has been observed that standard CT may lack the spatial resolution needed to differentiate between complete and partial response in primary breast cancer (Kanazawa et al., 2005).
The combination of these advantages and limitations motivated the construction of a combined dedicated high-resolution breast PET/CT system at UC Davis. It consists of a dedicated breast CT scanner and a dual-headed flat-panel lutetium oxyorthosilicate (LSO) PET scanner based on components described in (Doshi et al., 2001), (Lamare et al., 2005)and (Wu et al., 2006). The gantry for the PET component has been redesigned, a new control interface built, new acquisition electronics added and new software written to control the device.
The purpose of this work is to characterize aspects of the imaging performance of the redesigned breast PET scanner.
2 Materials and methods
2.1 System description
The PET component of the dedicated breast PET/CT system has two detector heads. There are 16 modules in each head arranged in a 4×4 matrix. In each module, there is one position-sensitive photon multiplier (PSPMT) and one crystal array consisting of 9×9 crystals. The crystal pitch is 3.3 mm and crystal size is 3×3×20 mm (Doshi et al., 2001). The detection surface is 12×12 cm. A resistive network is used to reduce the number of readout signals to 4 for each head (Doshi et al., 2001).
Prompt and random coincidence detection, energy and position measurement are implemented using Nuclear Instrumentation Module (NIM) based electronics similar to that described by Lamare et al. (Lamare et al., 2005) but with a new custom-built fast spectroscopy amplifier using CR-RC shaping with time constant of 80 ns. The coincidence time window (2τ) is set to 12 ns. For random coincidences a delay of 32 ns is introduced. Additionally, computer controlled counters (994, Ortec, Oak Ridge, TN) interfaced to the acquisition computer (a 3.4 GHz Pentium 4 PC) by means of RS232 connections record singles and coincidence rates for dead time estimation. The data acquisition system (DAQ) is based on the PCI PowerDAQ board PD2-MFS-2M/14 (United Electronic Industries, Inc., Walpole, MA) characterized for PET applications by Judenhofer et al. (Judenhofer et al., 2005). The maximum event rate that can be recorded by this system is 250 kHz. Buffer sizes for the DAQ are dynamically adjusted based on counting rates by means of custom software written in LabWindows (National Instruments Co., Austin, TX). Two DAQs are used to separately and simultaneously acquire prompt and random coincidences. For each coincidence event, 2 bytes are assigned to record each of the four outputs from each head (16 bytes per event). Position look-up-tables for each crystal are generated by automatically segmenting data acquired during flood illumination of both detectors using the method described by Chaudhari et al. (Chaudhari et al., 2008b). Subsequently list-mode data are generated in Matlab with an energy window of 350 keV to 650 keV imposed on a crystal-by-crystal basis.
The CT system has a flat-panel x-ray detector and cone-beam geometry similar to that described in (Boone et al., 2006). An x-ray generator (Pantak, East Haven, CT), an x-ray tube system (Comet, Flamatt, Switzerland) and a flat-panel CsI-based digital detector system Paxscan 4030CB (Varian Medical Systems, Palo Alto, CA) were used in the CT system and a servo motor (Kollmorgan, Radford, VA) was employed to drive the rotation. The spatial resolution was described in (Kwan et al., 2007). The 500 projection x-ray images can be acquired in 16.7 seconds for 360° coverage. The technique factors can be adjusted to optimize the images for different sizes of breast (Boone et al., 2005). Results from a clinical trial using this breast CT system have recently been reported (Lindfors et al., 2008).
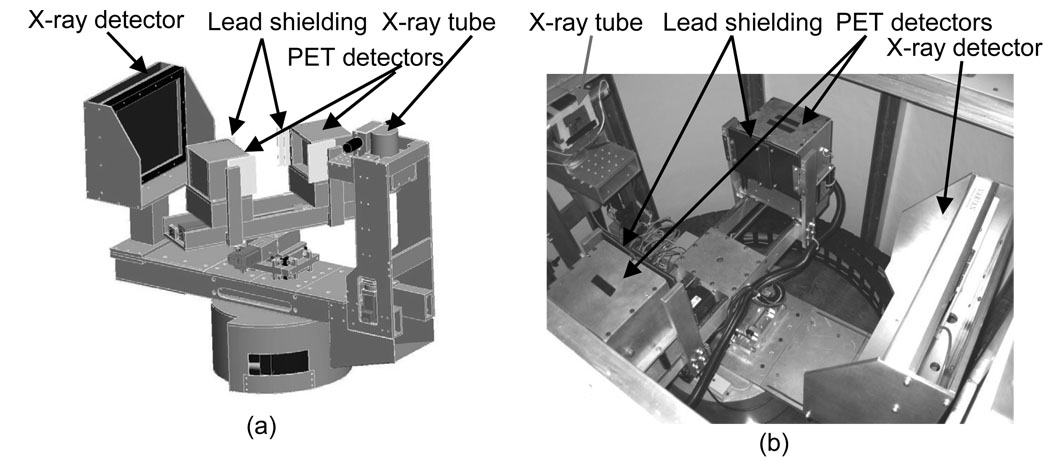
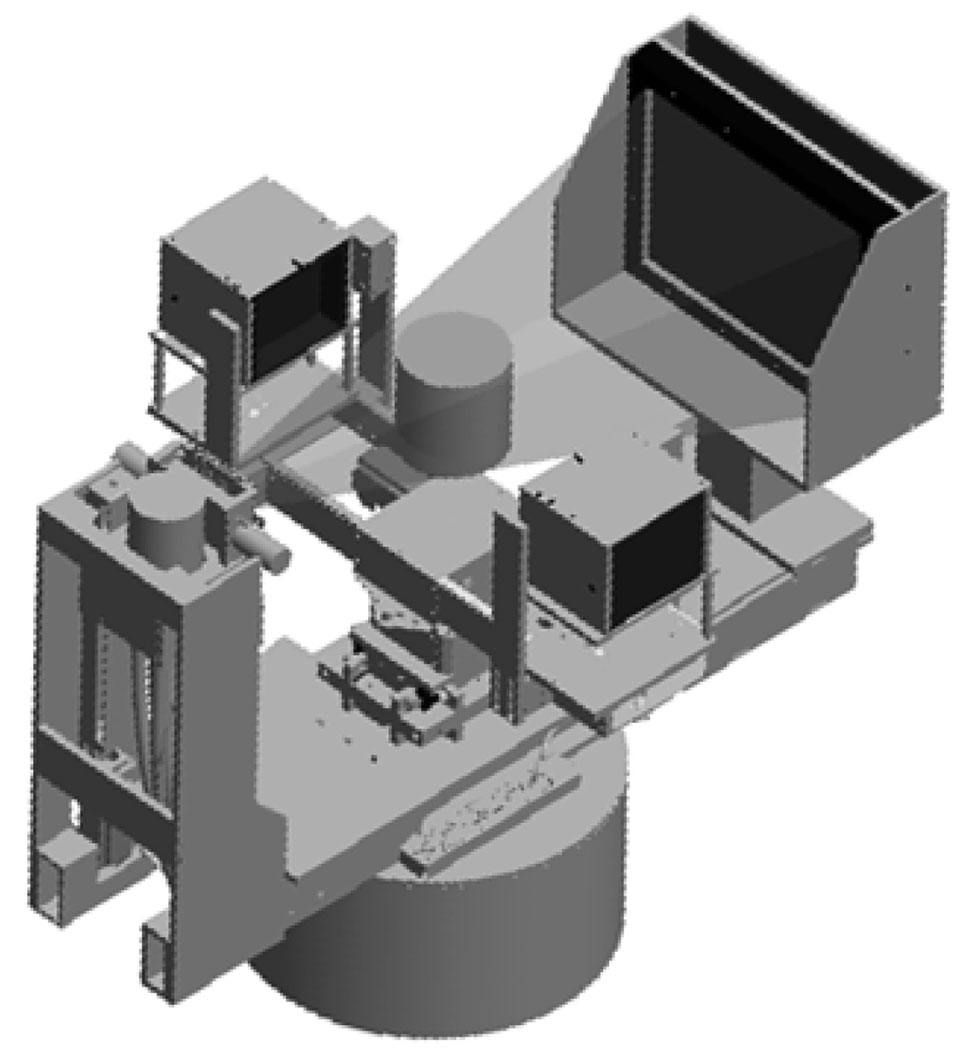
The integrated gantry is illustrated in figure 1. In the prototype described by Wu et al. (Wu et al. 2006), the PET detectors had one degree of freedom (rotation), but the current PET gantry has three MDrive23 stepper motors (Intelligent Motion Systems, Inc., Marlborough, CT) that control vertical, horizontal and rotational motion. The motors are programmed by the computer through RS-485 interfaces and the programs are stored in their nonvolatile memories. The host computer communicates with the three motors using shared digital control lines through the digital inputs/outputs of the first one of the two DAQ boards. The vertical drive allows the detectors to be moved as close as possible to chest wall. The horizontal motion permits variable head separation to accommodate breasts of different sizes. Gantry motion can be controlled from the acquisition software or directly at the gantry using a USB controller pad (MaxFire MiniPad V2, Genius, Taipei, Taiwan). For acquisition the PET heads are rotated in step and shoot mode. For this work the detector separation was fixed at 206 mm and 40 rotational steps were acquired over 180°. Due to the relatively small transaxial FOV of the PET (119 mm) with respect to the average breast diameter the number of angular steps (40) was chosen to obtain a high degree of angular sampling at the edge of the FOV throughout sinogram space while still allowing a reasonable scan time. Although the number of steps sufficient for 3D tomographic reconstruction at the center of FOV is far less than used in this study, as dictated by Orlov’s sufficiency condition (Orlov, 1975), even with 40 projections the edges of the FOV have incomplete angular sampling. The CT has FOV of 157×157×136 mm and the PET has FOV of 119×119×119 mm. The FOVs are co-registered with a custom-made phantom containing 4 non-co-planar point sources. The tops of FOVs can be aligned with each other if desired.
Figure 1.
Design drawing (a) and system picture (b) of integrated PET/CT gantry.
During the CT scan, the PET system rotates with the CT gantry, while the CT gantry remains still during PET scan. Two separate programs control the CT and PET motions but reading each other’s position information. To permit safe rotation, all the PET cables go through the CT gantry’s energy chain prior to connection to the NIM electronics.
2.2 Image reconstruction and spatial resolution
2.2.1 Normalization and reconstruction
The detection efficiency of each LOR was measured directly by using a custom planar phantom, as shown in figure 2(a). Data were reconstructed using the Maximum a Posteriori-Preconditioned Conjugate Gradient (MAP-PCG) method (Qi and Leahy, 2000; Qi et al., 1998; Chatziioannou et al., 2000) with the normalization factors and center of rotation effects incorporated in the forward model; sinograms were also generated, corrected for sensitivity variations due to the rotating geometry and detection efficiencies, and reconstructed using filtered backprojection (FBP) with ramp filter with cut off at 1.0 Nyquist frequency. For FBP reconstruction sinograms are summed axially. No maximum ring difference or transverse angle limits were applied.
Figure 2.
Normalization phantom (a) and spatial resolution measurement phantom for FBP (b) and for MAP (c).
2.2.2 Spatial resolution
A phantom consisting of four point sources was constructed as shown in figure 2(b). Capillary tubes with inner diameter of 1 mm were used to draw up small drops of 18F-FDG in aqueous solution. These were then located at the following positions: at 20 mm off center perpendicular to detector surface, and at 10 mm, 30 mm and 40 mm off center parallel to detector surface. Data were acquired for 10 minutes. Sinograms were generated, summed axially and reconstructed using FBP with a ramp filter (cut-off frequency = 1.0 Nyquist). The image size was 200×200 with a pixel size of 0.412×0.412 mm. The FWHM values using linear interpolation were calculated.
Another phantom was constructed as shown in figure 2(c) to measure the spatial resolution with MAP reconstruction (Yang et al., 2004). A capillary tube with inner diameter of 0.8 mm and length 70 mm was positioned at the center of a fillable plastic cylinder with diameter of 40 mm and length of 60 mm. The activity concentration ratio of the line source in capillary tube to the background in the cylinder was 400:1, leading to an intensity ratio in the reconstructed images ranging from 5:1 to 9:1. The phantom was placed in two positions to measure spatial resolutions. It was placed vertically (line source parallel to axial direction) to measure transaxial spatial resolutions and horizontally (line source perpendicular to axial direction) to measure axial spatial resolution. The total activity of 18F-FDG was ~400 µCi (14.8 MBq) and data were acquired for 400 seconds for each measurement. Sinograms were generated and reconstructed with MAP algorithm, the FWHM values with linear interpolation were calculated (NEMA, 2007). The vertically placed phantom images were also reconstructed using FBP with a ramp filter (cut-off frequency = 1.0 Nyquist) after single slice rebinning (SSRB) and resampling and FWHM calculated.
Memory constraints prevented the iterative reconstruction of isotropically highly-sampled image sets for resolution measurements. To reduce sampling error, different voxel sizes were therefore chosen for transaxial and axial resolution measurements. The image matrix size was set to 108×108×36 with voxel size of 1.10×1.10×3.30 mm for transaxial spatial resolution measurements. For axial resolution calculations the image matrix size was 36×36×216 with voxel size of 3.30×3.30×0.55 mm. For FBP transaxial resolution reconstruction of cylindrical phantom, the image matrix size was 150×150×35 with voxel size of 0.55×0.55×3.30 mm.
2.2.3 Derenzo phantom images
A Derenzo phantom with hot rods (Mini Deluxe, Data Spectrum Corporation, Hillsborough, NC, USA) was imaged. The phantom has 6 groups of rods with diameter of 4.8 mm, 4.0 mm, 3.2 mm, 2.4 mm, 1.6 mm, 1.2 mm, and the separation between the rods is 2 times the rod diameter. The phantom was filled with 700 µCi (25.9 MBq) 18F-FDG, and the phantom was scanned on the breast PET scanner for 30 minutes. The image was reconstructed using MAP and FBP with ramp filter cut off at Nyquist frequency after axial summing. The MAP image was summed axially after reconstruction and the pixel size was 1.10×1.10 mm. The pixel size of FBP image was 0.825×0.825 mm. For comparison, the phantom was re-filled with 1 mCi (37 MBq) 18F-FDG, and re-scanned on a GE Discovery ST whole-body PET/CT scanner (GE Medical Systems, Milwaukee, WI) for 40 minutes. The image was reconstructed with OS-EM with 12 iterations and 30 subsets and again summed axially, and the pixel size was 1.37 mm.
2.3 Sensitivity
To measure the sensitivity, a small-diameter (1 mm) 68Ge source of 20.14 µCi (745 kBq) (Eckert & Ziegler Isotope Products, Valencia, CA) was put at the rotational center of the system. The source was moved along the axial direction by a stepper motor with an increment of 5 mm. A total of 29 positions were recorded. For each step, the prompt and random coincidences were acquired simultaneously for 300 seconds. LSO background was acquired for 300 seconds with no point source in the FOV. An energy window of 350–650 keV was applied in software and the count rate was calculated. The randoms and background count rates were subtracted and the sensitivity was calculated.
2.4 Energy resolution
The planar normalization phantom (figure 2(a)) was filled with 500 µCi (18.5 MBq) 18F-fluorodeoxyglucose (18F-FDG) and placed at the center of two heads. Single events were acquired for 30 minutes for each head and LSO backgrounds were also acquired for 30 minutes for each head. Both singles and backgrounds were assigned to crystals based on a segmented crystal look-up-table. Energy spectra from each crystal were generated and the background spectra were subtracted from singles spectra. The energy spectra were fitted to Gaussian curves and energy resolutions calculated.
2.5 Count rate performance
To determine the count rate performance, an approximately cylindrical phantom with a length of 110 mm and diameter 75 mm was used. The activity in the phantom at the beginning of experiment was 820 µCi (30.34 MBq). Data were acquired at different activity for a total 12 half-lives. The singles count rate and DAQ input/output count rates were recorded over time. The count rates were fitted to appropriate dead time models and dead times were calculated.
To calculate noise-equivalent count rate (NECR), the scatter fraction (SF) must be measured or estimated (Strother et al., 1990). Since no standard, validated method for measuring scatter fraction in a breast PET device is currently available, a Monte Carlo simulation with GATE (Jan et al., 2004) was performed to estimate SF. A cylindrical phantom approximating that used experimentally was modeled.
The NECR was calculated using equation (1) (Watson et al., 2005), where R was the randoms rate which was measured, T (trues) and S (scatters) were defined in equation (2) and (3) respectively, k is either 0 or 1. In equation (2) and (3), P (prompts) was the coincidence rate which was measured directly and SF was taken from the simulation. Randoms and scatters included only events containing lines of response (LOR) passing through the cylindrical phantom.
| (1) |
| (2) |
| (3) |
2.6 Effects of x-ray scatter on LSO detectors
In the combined configuration (see figure 1), x-rays may scatter onto the detector faces during CT acquisition. This may potentially stimulate long-lived after-glow in the LSO crystals, negatively impacting subsequent PET scans (Rogers and Batty, 2000). To determine the magnitude of such effects, the PET detectors were placed in the CT gantry with and without 2 mm thick lead shielding and at several different locations (figure 3). The primary x-ray beam was collimated and a cylindrical breast phantom (CIRS, Norfolk, VA) with consistency equivalent to 50% fat and 50% glandular tissue (diameter = 15 cm) was place at the center of the field of view. PET detectors were placed at 10 cm, 5 cm and 2.5 cm from the edge of the primary x-ray beam path. The primary x-ray beam width was 22.8 cm at the phantom center. The x-ray tube was then energized with typical acquisition parameters (7 mA, 80 kVp, 16.7 seconds duration) and the background count rates and flood histograms from the LSO detectors were subsequently recorded over time.
Figure 3.
Experimental setup for effects of x-ray scatter on LSO detectors.
2.7 Combined PET/CT scan
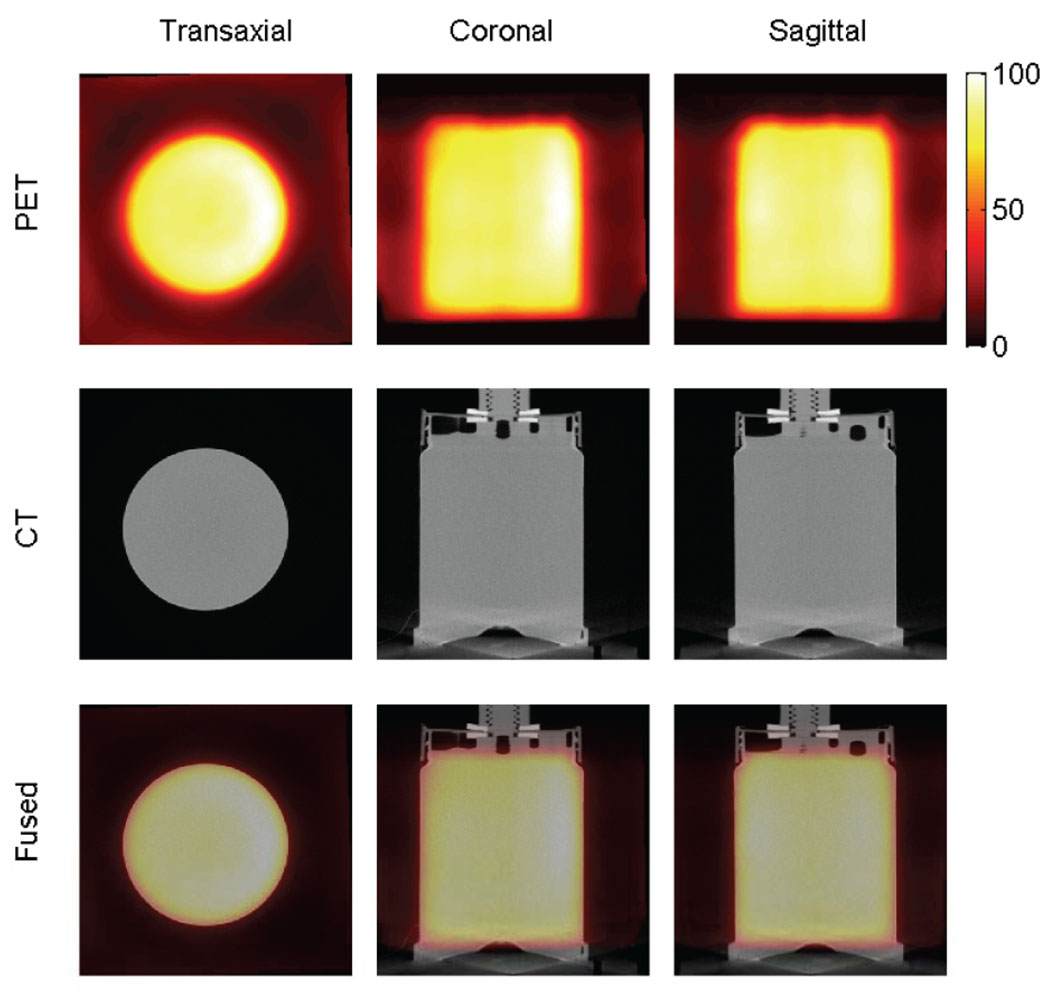
The PET and CT data were taken sequentially and reconstructed independently and currently no CT based attention correction was applied. The co-registration parameters were determined with a custom-made phantom containing 4 non-co-planar point sources. An approximately cylindrical phantom with a length of 110 mm and diameter 75 mm was imaged by both PET and CT. The duration of PET scan was 80 minutes and the initial activity was 110 µCi, and the CT data was acquired without CT contrast immediately prior to the PET scan with typical technique (7 mA, 80 kVp, 16.7 seconds duration). The PET image was reconstructed using MAP with 108×108×36 voxels of dimension 1.1×1.1×3.3 mm. The CT image was reconstructed using Feldkamp (Feldkamp et al., 1984) algorithm with 512×512×512 voxels of dimension 0.245×0.245×0.278 mm.
2.8 Image uniformity
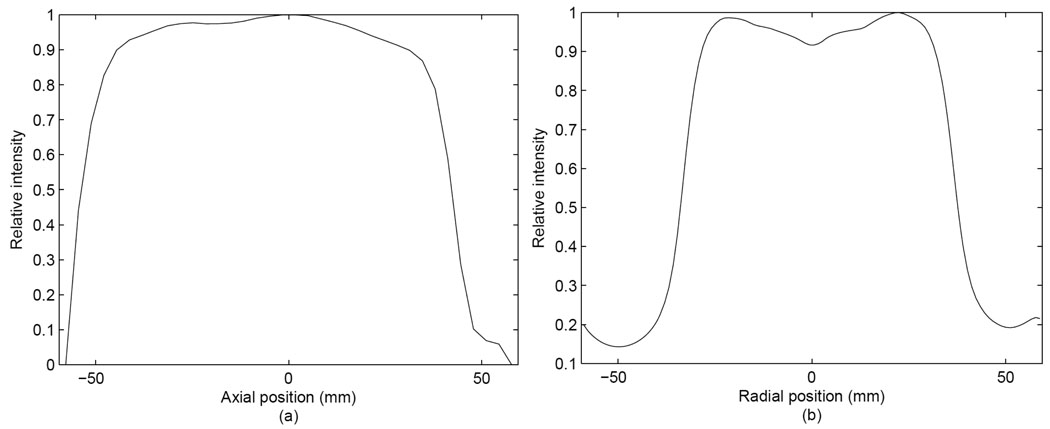
The axial and transaxial profiles of the images in Section 2.7 were calculated. The axial profile was calculated in 36 slices. In each slice, a circular region within diameter of 56.25 mm (75% of 75 mm) was chosen and the values were summed. The transaxial images were summed in range of axial position from −45 to 35 mm and the transaxial profile crossing the center of cylinder was calculated. This range was chosen to include the truly uniform region of the phantom based on the shape shown in the coronal image.
3 Results
3.1 Image reconstruction and spatial resolution
Reconstructed transaxial image resolutions at a range of positions with respect to the center of field of view are shown in Table 1. Average transaxial spatial resolution for the FBP reconstruction was 3.27 mm. The standard deviation was calculated from 3 repeated experiments with separately prepared point sources. The axial summing of the data prior to FBP reconstruction may have resulted in a slight degradation of the resolution measurement, although this is unlikely to be a large effect. The tangential resolution is much worse than the radial resolution when the position is close to the edge of FOV and this is presumably due to the depth-of-interaction (DOI) effect. At the location close to the edge of FOV, when measuring the radial resolution, the detector faces are close to parallel to the radial direction and the covered angle is limited, resulting in reduced DOI uncertainty.
Table 1.
Spatial resolution (FWHM) at different locations (point sources phantom)
| Location (X: mm, Y: mm, Z = 0) | −30, 0 | −10, 0 | 40, 0 | 0, −20 |
|---|---|---|---|---|
| Radial (mean ± SD: mm) | 3.27±0.01 | 3.52±0.20 | 2.80±0.02 | 2.53±0.58 |
| Tangential (mean ± SD: mm) | 3.59±0.07 | 3.77±0.46 | 3.67±0.09 | 3.01±0.41 |
The MAP algorithm gave improved resolution compared to FBP, as listed in Table 2. The standard deviation was calculated from 11 slices of the line source image. The average spatial resolution of MAP reconstruction was 2.5 mm.
Table 2.
Spatial resolution (FWHM) at different locations (cylindrical phantom)
| Location (X, Y: mm, Z=0) | 0, 0 | 45, 0 | |
|---|---|---|---|
| Radial (mean ± SD: mm) | 3.28±0.11 | 3.00±0.08 | |
| FBP | Tangential (mean ± SD: mm) | 2.77±0.06 | 3.98±0.19 |
| Radial (mean ± SD: mm) | 2.70±0.13 | 2.69±0.08 | |
| MAP | Tangential (mean ± SD: mm) | 2.73±0.10 | 2.49±0.14 |
| Axial (mean ± SD: mm) | 2.17±0.08 | 2.10±0.10 | |
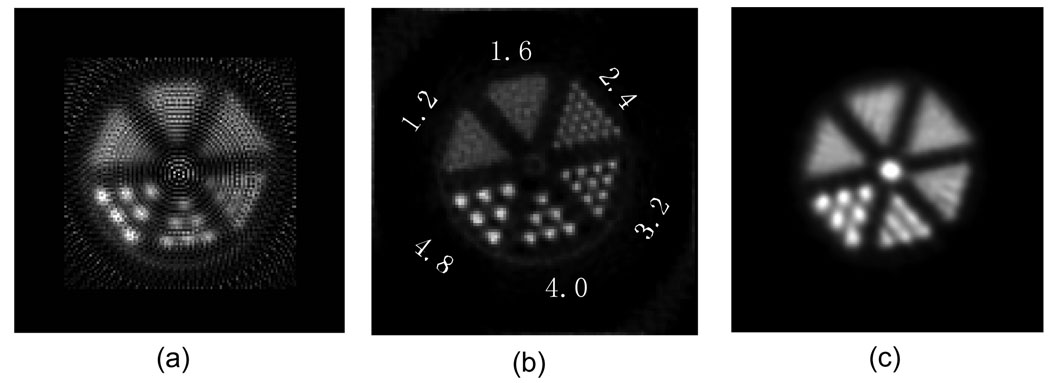
Reconstructions of the Derenzo phantom data are shown in figure 4. For FBP with ramp filter (cut-off frequency = 1.0 Nyquist) rods with diameter as small as 3.2 mm were resolved, where as MAP reconstruction allowed the visualization of rods as small as 2.4 mm in diameter. As seen in the image, ring artifacts were present and this is probably due to the very simple normalization implemented in the FBP reconstruction. The data obtained using the GE Discovery ST whole-body PET/CT scanner were reconstructed using the manufacturer’s implementation of OS-EM, with 12 iterations and 30 subsets; the resulting image is shown in figure 4(c). Rods with diameter 4.0 mm were resolved in the whole-body images.
Figure 4.
Derenzo phantom images. FBP reconstructed (a), MAP reconstructed (b) and acquired on a GE Discovery ST whole-body PET/CT, reconstructed with OS-EM (c)
3.2 Sensitivity
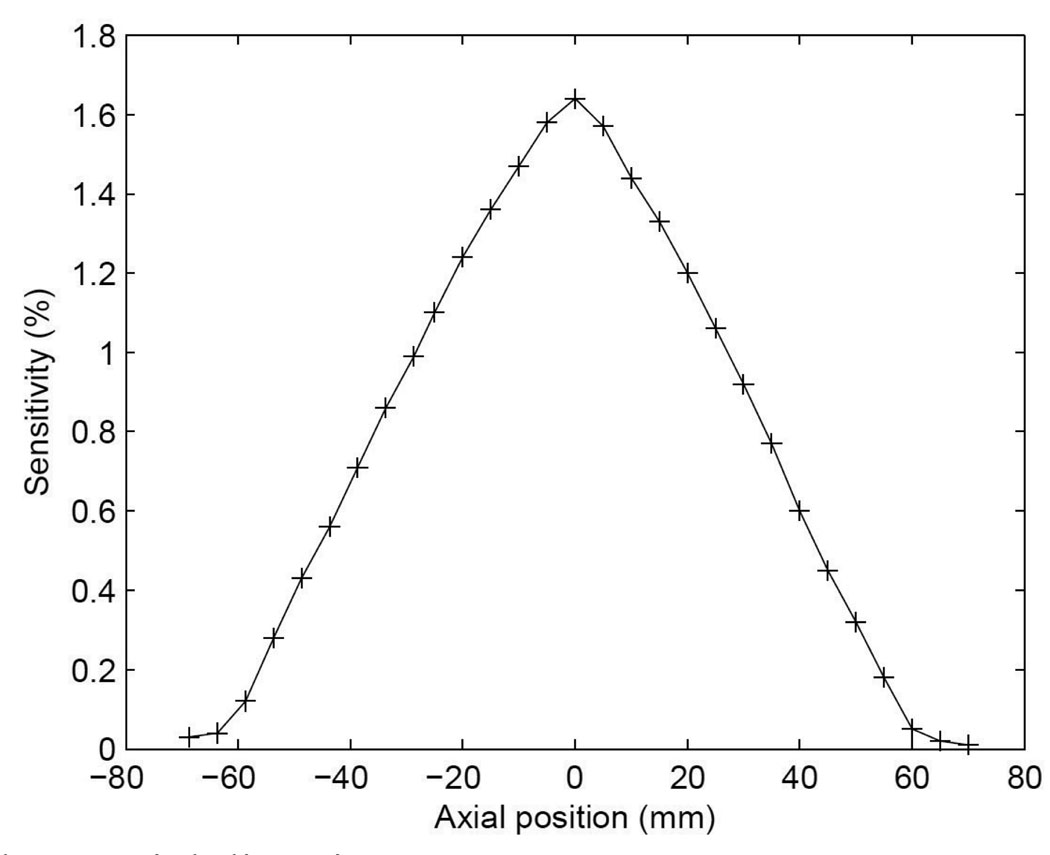
The sensitivity along the axial direction is plotted in figure 5. The measured sensitivity was 1.64% (0.61 kcps/µCi) at the center of FOV without dead time correction. In the National Electrical Manufacturers Association (NEMA) standard (NEMA, 2007), the count loss due to dead time should be <1% for the sensitivity measurement. In our measurement, the combined count loss, i.e. dead time percentage, due the singles dead time and data acquisition dead time was 6.7% with a maximum of 10.0% at the center of FOV. In addition, our simple approach is affected by self-attenuation of the point source, which means that the sensitivity measurement is somewhat underestimated.
Figure 5.
Sensitivity along axial direction.
3.3 Energy resolution
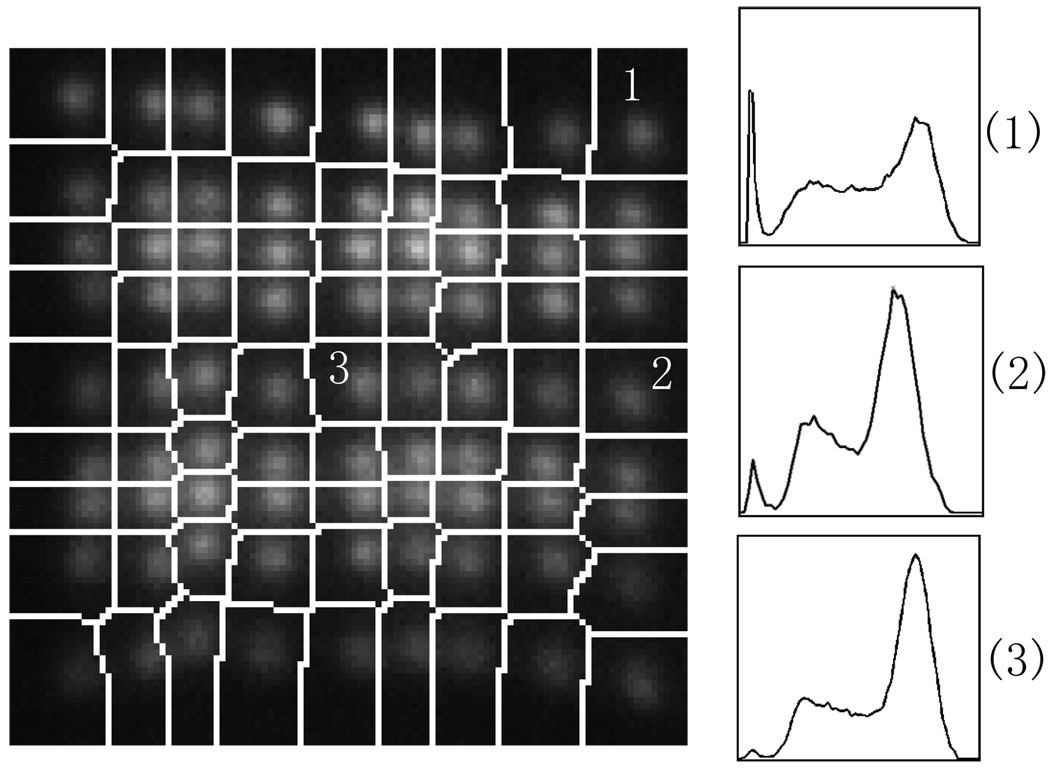
Figure 6 shows part of a segmented flood image containing one module of a detector head. Energy spectra of three different individual crystals are also shown in figure 6 and their energy resolutions are 35%, 30% and 21% respectively (full-width at half-maximum of full energy peak). The overall average energy resolution for the system is 25% with minimum of 18%, maximum of 40% and standard deviation of 3.7%. No significant difference was observed from module to module.
Figure 6.
Segmented flood histogram and energy spectra.
3.4 Count rate performance
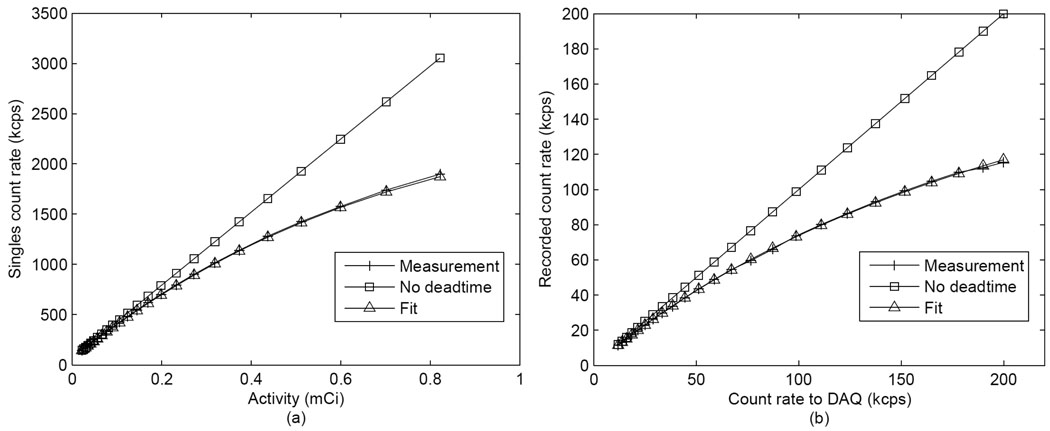
The singles count rate was recorded and plotted against activity as shown in figure 7(a). The count rate was fitted to a paralyzable model (Knoll, 2000) with the equation (4), where m is the measured count rate, n is the real count rate and τ is characteristic dead time per event. The dead time per event calculated for singles was 145 ns. The main cause of singles dead time was the front end processing electronics. The recorded count rate of DAQ was plotted against input count rate as shown in figure 7(b). It was fitted to a non-paralyzable model (Knoll, 2000) as in equation (5), and the characteristic dead time per event was determined to be 3.6 µs. The main cause of DAQ dead time was the limited sampling rate of DAQ system (rating 250 kHz) and it reduced the prompts rate at high activity.
| (4) |
| (5) |
Figure 7.
Count rate measurements. (a): Singles count rate versus activity. (b): recorded count rate by the DAQ versus the input count rate.
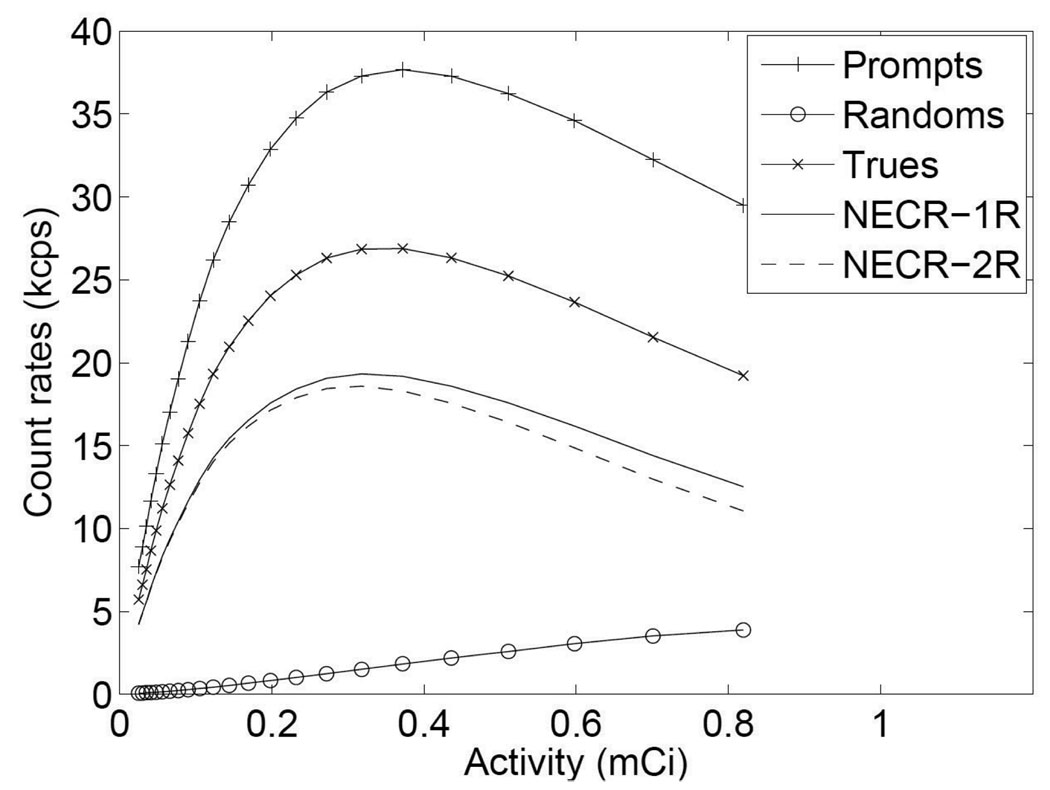
The measured prompts and randoms are plotted in figure 8, together with trues, scatters and NECR (calculated using both the 1R and 2R methods, where k was 0 and 1 in equation (1) respectively). The peak NECR was 19.3 kcps at 318 µCi (11.766 MBq) for 1R method or 18.6 kcps at 318 µCi (11.766 MBq) for 2R method. The reason for the fall off of NECR and prompts curves was the multiplexing readout. At high count rate, the pile-up caused event mispositioning which can be seen from flood histogram and energy add-up. The mispositioning caused the incorrect energy threshold applied to the event and therefore reduced the prompts rate. Random coincidences did not affect NECR much in this setup primarily because of the favorable geometry with no activity outside of the field of view.
Figure 8.
NECR performance.
3.5 Effects of x-ray scatter on LSO detectors
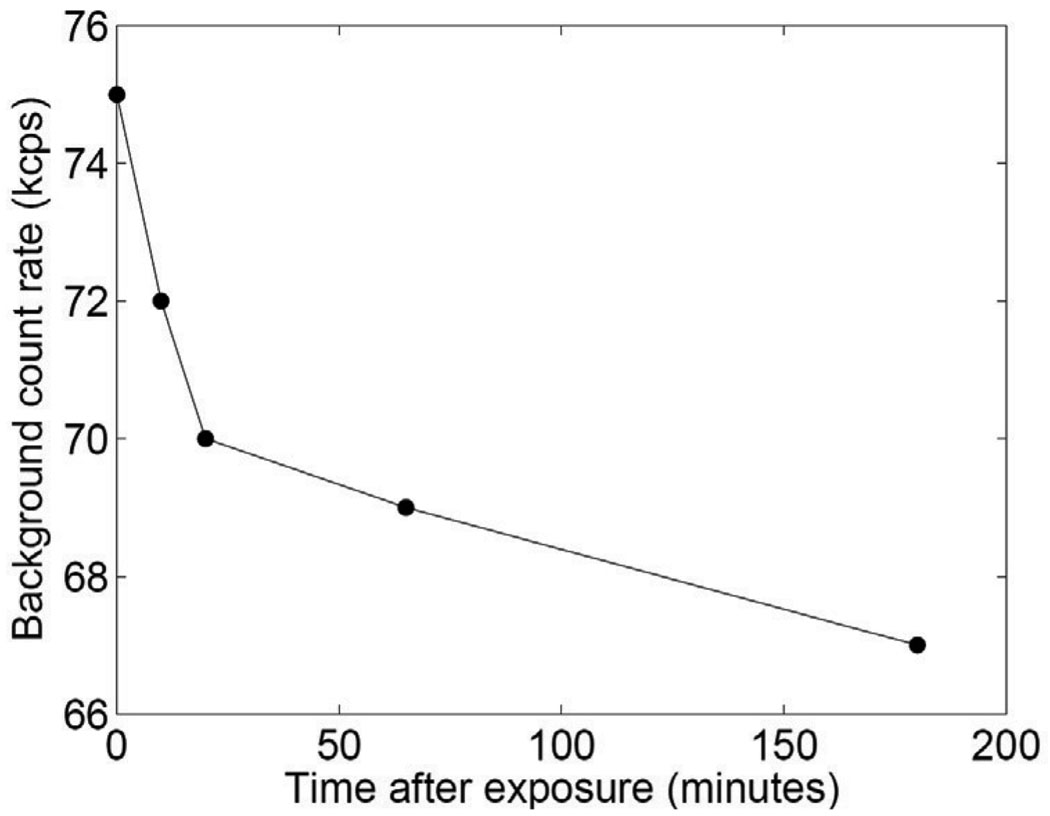
Without shielding, after energizing the x-ray tube, the background count rates increased and took several hours to return to baseline status (figure 9). The baseline count rate was 67 kcps before x-ray energization. The flood histogram was also seen to degrade. The peak-to-valley ratio decreased by 18±4% for five rows of five detectors (one row each detector) after x-ray energization. As expected, the effect was strongest when the detectors were closest to the edge of the beam. Figure 9 shows the background count rate as a function of time at the closest distance used (2.5 cm from the beam edge).
Figure 9.
LSO background count rate after energizing x-ray tube.
With 2 mm of lead shielding on the front and sides, no obvious degradation was seen compared to the baseline flood histogram and no significant change was seen in the background count rate. The peak-to-valley ratio decreased by 5±3% for the same five rows of five detectors after x-ray energization. This result was obtained with the detectors as close as 2.5 cm to primary beam. Lead shutters of thickness 3 mm have been fabricated and installed for the system to shield the detectors during CT acquisition.
3.6 Combined PET/CT scan
The transaxial, coronal and sagittal views of PET, CT and fused images are shown in figure 10. The first row are PET images, the second row CT images and the last row fused images. From left to right are transaxial, coronal and sagittal views, respectively.
Figure 10.
PET, CT and fused images of an approximately cylindrical phantom.
3.7 Image uniformity
The axial and transaxial profiles are shown in figures 11(a) and 11(b). The percentage standard deviation of axial profile in range from −45 to 35 mm was 3.7% and the one of transaxial profile in range from −28 to 28 mm was 2.8%.
Figure 11.
Axial (a) and transaxial (b) profiles of uniformity.
4 Discussion
The multiplexing readout and DAQ dead time causes the NECR to peak at relatively low activity of 318 µCi (11.766 MBq), but we note that the actual activity in the patient breast with a 10 mCi (370 MBq) 18F-FDG injection, 60 minutes of uptake and 20% excretion (assuming 2% goes to each breast) would be significantly less than this (~110 µCi or 4.07 MBq). However in human imaging, activity outside of the field of view is likely to significantly degrade peak NECR (Lamare et al., 2005). Dead time could be significantly reduced by reading detector modules individually and implementing a new DAQ with less dead time. A project to undertake this effort is under way, in collaboration with workers at the Lawrence Berkeley National Laboratory and funded by the Susan G. Komen Foundation.
Sensitivity for this prototype system is moderate in the geometry examined. Greater gains would be possible if the detectors were operated with a lesser separation distance, but this is not likely to be practical for tomographic imaging of typical breast sizes. The system sensitivity may be improved in a future system by utilizing more detector material and/or a different geometry (Bowen et al., 2006).
The spatial resolution can be improved by using a more finely pixelated LSO crystal array, but the long length of crystal that is needed to maintain sensitivity would introduce parallax error and degrade the benefits of finer sampling. Edge-on, dual-ended readout and segmented detector designs have been proposed to reduce this effect in breast PET scanners (Wang et al., 2006; Abreu et al., 2007; Zhang et al., 2007; Kitamura et al., 2008). We are currently exploring a hybrid dual-ended readout detector design to solve this problem while maintaining a large detector packing fraction (Chaudhari et al., 2008c).
A device such as the one described here can also be used to image other extremities and we are currently exploring the possibility of using it to image response to therapy in the wrist for patients with rheumatoid arthritis (Chaudhari et al., 2008a).
5 Conclusions and future work
The PET component of the dedicated breast PET/CT system at our institution has improved imaging characteristics in comparison to commercial whole-body scanners, particularly when MAP reconstruction is used. Corrections for efficiency normalization, center of rotation offsets and geometric effects have been implemented. To facilitate fully quantitative high-resolution PET imaging of the human breast, effort is now being directed at implementing and validating accurate corrections for attenuation, scatter, randoms and dead time. The first studies in humans are shortly to be reported elsewhere; once quantitative images can be generated we plan to investigate the utility of dedicated breast PET/CT in monitoring response to neo-adjuvant therapy for primary breast cancer.
Acknowledgements
This work was supported by the California Cancer Research Program under grant 11IB-0114, by the Susan G. Komen Foundation under grant BCTR0707455 and by the American Cancer Society under grant IRG-95-125-07. Support for some authors (Kai Yang, Nathan Packard, George Burkett Jr. and John M Boone) was provided by National Institutes of Health under grant R01 EB002138.
Footnotes
PACS: 87.57.uk, 87.57.qp, 87.57.cf
References
- Abreu MC, Aguiar D, Albuquerque E, Almeida FG, Almeida P, Amaral P, Auffray E, Bento P, Bruyndonckx P, Bugalho R, Carrico B, Cordeiro H, Ferreira M, Ferreira NC, Goncalves F, Lecoq P, Leong C, Lopes F, Lousa P, Luyten J, Martins MV, Matela N, Mendes PR, Moura R, Nobre J, Oliveira N, Ortigao C, Peralta L, Rego J, Ribeiro R, Rodrigues P, Santos AI, Silva JC, Silva MM, Tavernier S, Teixeira IC, Teixeira JP, Trindade A, Trurnmer J, Varela J. Clear-PEM: A PET imaging system dedicated to breast cancer diagnostics. 2007:81–84. [Google Scholar]
- Avril N, Rose CA, Schelling M, Dose J, Kuhn W, Bense S, Weber W, Ziegler S, Graeff H, Schwaiger M. Breast imaging with positron emission tomography and fluorine-18 fluorodeoxyglucose: Use and limitations. Journal of Clinical Oncology. 2000;18:3495–3502. doi: 10.1200/JCO.2000.18.20.3495. [DOI] [PubMed] [Google Scholar]
- Berg WA, Weinberg IN, Narayanan D, Lobrano ME, Ross E, Amodei L, Tafra L, Adler LP, Uddo J, Stein W, Levine EA. High-resolution fluorodeoxyglucose positron emission tomography with compression ("positron emission mammography") is highly accurate in depicting primary breast cancer. Breast Journal. 2006;12:309–323. doi: 10.1111/j.1075-122X.2006.00269.x. [DOI] [PubMed] [Google Scholar]
- Beyer T, Townsend DW. Putting 'clear' into nuclear medicine: a decade of PET/CT development. Eur J Nucl Med Mol I. 2006;33:857–861. doi: 10.1007/s00259-006-0137-z. [DOI] [PubMed] [Google Scholar]
- Boone JM, Kwan ALC, Seibert JA, Shah N, Lindfors KK, Nelson TR. Technique factors and their relationship to radiation dose in pendant geometry breast CT. Medical Physics. 2005;32:3767–3776. doi: 10.1118/1.2128126. [DOI] [PubMed] [Google Scholar]
- Boone JM, Kwan ALC, Yang K, Burkett GW, Lindfors KK, Nelson TR. Computed tomography for imaging the breast. J. Mammary Gland Biol. Neoplasia. 2006;11:103–111. doi: 10.1007/s10911-006-9017-1. [DOI] [PubMed] [Google Scholar]
- Bowen SL, Cherry SR, Boone JM, Badawi RD. Monte Carlo simulation study of several camera designs for the PET component of a dedicated breast PET/CT scanner. Eur J Nucl Med Mol I. 2006;33 S117-S. [Google Scholar]
- Chatziioannou A, Qi J, Moore A, Annala A, Nguyen K, Leahy R, Cherry SR. Comparison of 3-D maximum a posteriori and filtered backprojection algorithms for high-resolution animal imaging with microPET. Ieee Transactions on Medical Imaging. 2000;19:507–512. doi: 10.1109/42.870260. [DOI] [PubMed] [Google Scholar]
- Chaudhari AJ, Burkett GW, Bowen SL, Harse R, Packard NJ, Stern RL, Naguwa SM, Hunter JC, Boone JM, Buonocore MH, Badawi RD. Multimodality high resolution wrist imaging for monitoring response to therapy in rheumatoid arthritis: Instrumentation and techniques. Nuclear Science Symposium Conference Record, 2008. NSS '08. IEEE. 2008a:4840–4844. [Google Scholar]
- Chaudhari AJ, Joshi AA, Bowen SL, Leahy RM, Cherry SR, Badawi RD. Crystal identification in positron emission tomography using nonrigid registration to a Fourier-based template. Phys Med Biol. 2008b;53:5011–5027. doi: 10.1088/0031-9155/53/18/011. [DOI] [PMC free article] [PubMed] [Google Scholar]
- Chaudhari AJ, Yang YF, Farrell R, Dokhale PA, Shah KS, Cherry SR, Badawi RD. PSPMT/APD hybrid DOI detectors for the PET component of a dedicated breast PET/CT system - A feasibility study. IEEE Transactions on Nuclear Science. 2008c;55:853–861. [Google Scholar]
- Doshi NK, Silverman RW, Shao Y, Cherry SR. maxPET: A dedicated mammary and axillary region PET imaging system for breast cancer. IEEE Transactions on Nuclear Science. 2001;48:811–815. [Google Scholar]
- Eubank WB, Mankoff DA. Evolving role of positron emission tomography in breast cancer imaging. Seminars in Nuclear Medicine. 2005;35:84–99. doi: 10.1053/j.semnuclmed.2004.11.001. [DOI] [PubMed] [Google Scholar]
- Feldkamp LA, Davis LC, Kress JW. PRACTICAL CONE-BEAM ALGORITHM. Journal of the Optical Society of America a-Optics Image Science and Vision. 1984;1:612–619. [Google Scholar]
- Jan S, Santin G, Strul D, Staelens S, Assie K, Autret D, Avner S, Barbier R, Bardies M, Bloomfield PM, Brasse D, Breton V, Bruyndonckx P, Buvat I, Chatziioannou AF, Choi Y, Chung YH, Comtat C, Donnarieix D, Ferrer L, Glick SJ, Groiselle CJ, Guez D, Honore PF, Kerhoas-Cavata S, Kirov AS, Kohli V, Koole M, Krieguer M, van der Laan DJ, Lamare F, Largeron G, Lartizien C, Lazaro D, Maas MC, Maigne L, Mayet F, Melot F, Merheb C, Pennacchio E, Perez J, Pietrzyk U, Rannou FR, Rey M, Schaart DR, Schmidtlein CR, Simon L, Song TY, Vieira JM, Visvikis D, Van de Walle R, Wieers E, Morel C. GATE: a simulation toolkit for PET and SPECT. Physics in Medicine and Biology. 2004;49:4543–4561. doi: 10.1088/0031-9155/49/19/007. [DOI] [PMC free article] [PubMed] [Google Scholar]
- Judenhofer MS, Pichler BJ, Cherry SR. Evaluation of high performance data acquisition boards for simultaneous sampling of fast signals from PET detectors. Physics in Medicine and Biology. 2005;50:29–44. doi: 10.1088/0031-9155/50/1/003. [DOI] [PubMed] [Google Scholar]
- Kanazawa T, Akashi-Tanaka S, Iwamoto E, Takasugi M, Shien T, Kinoshita T, Miyakawa K, Shimizu C, Ando M, Katsumata N, Fujiwara Y, Fukutomi T. Diagnosis of complete response to neoadjuvant chemotherapy using diagnostic Imaging in primary breast cancer patients. Breast Journal. 2005;11:311–316. doi: 10.1111/j.1075-122X.2005.00003.x. [DOI] [PubMed] [Google Scholar]
- Kitamura K, Ohi J, Tonami H, Yamada Y, Furumiya T, Furuta M, Satoh M, Tsuda T, Nakazawa M, Hashizume N, Yamakawa Y, Kawashima A, Kumazawa Y. Development of a C-shaped breast PET scanner equipped with four-layer DOI detectors. Nuclear Science Symposium Conference Record, 2008. NSS '08. IEEE. 2008:5662–5665. [Google Scholar]
- Knoll GF. Radiation Detection and Measurement. 3rd edition. John Wiley & Sons Inc; 2000. [Google Scholar]
- Kwan ALC, Boone JM, Yang K, Huang SY. Evaluation of the spatial resolution characteristics of a cone-beam breast CT scanner. Medical Physics. 2007;34:275–281. doi: 10.1118/1.2400830. [DOI] [PubMed] [Google Scholar]
- Lamare F, Bowen SL, Visvikis D, Cortes P, Wu Y, Tran VH, Boone JM, Cherry SR, Badawi RD. Design simulation of a rotating dual-headed PET/CT scanner for breast imaging; Nuclear Science Symposium Conference Record, IEEE; 2005. pp. 1524–1529. [Google Scholar]
- Levin CS, Foudray AMK, Olcott PD, Habte F. Investigation of position sensitive avalanche photodiodes for a new high-resolution PET detector design. IEEE Trans. Nucl. Sci. 2004;51:805–810. [Google Scholar]
- Li HD, Wong WH, Baghaei H, Uribe J, Wang Y, Zhang YX, Kim SS, Ramirez R, Liu JG, Liu ST. The engineering and initial results of a transformable low-cost high-resolution PET camera. IEEE Transactions on Nuclear Science. 2007;54:1583–1588. [Google Scholar]
- Linden HM, Stekhova SA, Link JM, Gralow JR, Livingston RB, Ellis GK, Petra PH, Peterson LM, Schubert EK, Dunnwald LK, Krohn KA, Mankoff DA. Quantitative fluoroestradiol positron emission tomography imaging predicts response to endocrine treatment in breast cancer. Journal of Clinical Oncology. 2006;24:2793–2799. doi: 10.1200/JCO.2005.04.3810. [DOI] [PubMed] [Google Scholar]
- Lindfors KK, Boone JM, Nelson TR, Yang K, Kwan ALC, Miller DF. Dedicated breast CT: Initial clinical experience. Radiology. 2008;246:725–733. doi: 10.1148/radiol.2463070410. [DOI] [PMC free article] [PubMed] [Google Scholar]
- Murthy K, Aznar M, Thompson CJ, Loutfi A, Lisbona R, Gagnon JH. Results of preliminary clinical trials of the positron emission mammography system PEM-I: A dedicated breast imaging system producing glucose metabolic images using FDG. J. Nucl. Med. 2000;41:1851–1858. [PubMed] [Google Scholar]
- NEMA. NEMA Standards Publication NU 2-2007 Performance Measurements of Positron Emission Tomographs. 2007 [Google Scholar]
- Orlov SS. THEORY OF 3-DIMENSIONAL RECONSTRUCTION .1. CONDITIONS FOR A FULL SET OF PROJECTIONS. Kristallografiya. 1975;20:511–515. [Google Scholar]
- Qi J, Leahy RM. Resolution and Noise Properties of MAP Reconstruction for Fully 3-D PET. IEEE Transactions on Medical Imaging. 2000;19:493–506. doi: 10.1109/42.870259. [DOI] [PubMed] [Google Scholar]
- Qi JY, Leahy RM, Cherry SR, Chatziioannou A, Farquhar TH. High-resolution 3D Bayesian image reconstruction using the microPET small-animal scanner. 1998:1001–1013. doi: 10.1088/0031-9155/43/4/027. [DOI] [PubMed] [Google Scholar]
- Raylman RR, Majewski S, Smith MF, Proffitt J, Hammond W, Srinivasan A, McKisson J, Popov V, Weisenberger A, Judy CO, Kross B, Ramasubramanian S, Banta LE, Kinahan PE, Champley K. The positron emission mammography/tomography breast imaging and biopsy system (PEM/PET): design, construction and phantom-based measurements. Physics in Medicine and Biology. 2008;53:637–653. doi: 10.1088/0031-9155/53/3/009. [DOI] [PubMed] [Google Scholar]
- Robar JL, Thompson CJ, Murthy K, Clancy R, Bergman AM. Construction and calibration of detectors for high-resolution metabolic breast cancer imaging. Nuclear Instruments & Methods in Physics Research Section A – Accelerators Spectrometers Detectors and Associated Equipment. 1997;392:402–406. [Google Scholar]
- Rogers JG, Batty CJ. Afterglow in LSO and its possible effect on energy resolution. IEEE Transactions on Nuclear Science. 2000;47:438–445. [Google Scholar]
- Rosen EL, Turkington TG, Soo MS, Baker JA, Coleman RE. Detection of primary breast carcinoma with a dedicated, large-field-of-view FDG PET mammography device: Initial experience. Radiology. 2005;234:527–534. doi: 10.1148/radiol.2342040654. [DOI] [PubMed] [Google Scholar]
- Strother SC, Casey ME, Hoffman EJ. Measuring PET scanner sensitivity - relating countrates to image signal-to-noise ratios using noise equivalent counts. IEEE Transactions on Nuclear Science. 1990;37:783–788. [Google Scholar]
- Tafra L, Cheng Z, Uddo J, Lobrano MB, Stein W, Berg WA, Levine E, Weinberg IN, Narayanan D, Ross E, Beylin D, Yarnall S, Keen R, Sawyer K, Van Geffen J, Freimanis RL, Staab E, Adler LP, Lovelace J, Shen P, Stewart J, Dolinsky S. Pilot clinical trial of 18F-fluorodeoxyglucose positron-emission mammography in the surgical management of breast cancer. American Journal of Surgery. 2005;190:628–632. doi: 10.1016/j.amjsurg.2005.06.029. [DOI] [PubMed] [Google Scholar]
- Tai Y-C, Wu HY, Janecek M. Initial study of an asymmetric PET system dedicated to breast cancer imaging. IEEE Trans. Nucl. Sci. 2006;53:121–126. [Google Scholar]
- Turkington TG, Majewski S, Weisenberger AG, Popov V, Smith MF, Sampson WH, Wojcik R, Kieper D. A large field of view positron emission mammography imager; Nuclear Science Symposium Conference Record, 2003 IEEE; 2002. pp. 1883–1886. vol.3. [Google Scholar]
- Wang GC, Huber JS, Moses WW, Qi J, Choong WS. Characterization of the LBNL PEM camera. IEEE Trans. Nucl. Sci. 2006;53:1129–1135. [Google Scholar]
- Watson CC, Casey ME, Bendriem B, Carney JP, Townsend DW, Eberl S, Meikle S, DiFilippo FP. Optimizing injected dose in clinical PET by accurately modeling the counting-rate response functions specific to individual patient scans. Journal of Nuclear Medicine. 2005;46:1825–1834. [PubMed] [Google Scholar]
- Weinberg I, Beylin D, Yarnall S, Anashkin E, Stepanov P, Dolinsky S, Zavarzin V, Peter W, Lauckner K, Morton K, Freimanis R, Lesko N, Levine E, Perrier N, Lovelace J, Geisinger K, Williams R, Wollenweber S, Narayanan D, Doss M, Hummel J, Sigurdson E, Evers K, Torosian M, Adler L. Applications of a PET device with 1.5 mm FWHM intrinsic spatial resolution to breast cancer imaging. Biomedical Imaging: Macro to Nano, 2004. IEEE International Symposium on. 2004;Vol. 2:1396–1399. [Google Scholar]
- Wu Y, Yang K, Packard NJ, Fu L, Stickel JR, Tran V-H, Qi J, Boone JM, Cherry SR, Badawi RD. Characteristics of the PET Component of a Dedicated Breast PET/CT Scanner Prototype; Nuclear Science Symposium Conference Record, IEEE; 2006. pp. 2335–2339. [Google Scholar]
- Yang YF, Tai YC, Siegel S, Newport DF, Bai B, Li QZ, Leahy RM, Cherry SR. Optimization and performance evaluation of the microPET II scanner for in vivo small-animal imaging. Physics in Medicine and Biology. 2004;49:2527–2545. doi: 10.1088/0031-9155/49/12/005. [DOI] [PubMed] [Google Scholar]
- Zhang J, Olcott PD, Chinn G, Foudray AMK, Levin CS. Study of the performance of a novel 1 mm resolution dual-panel PET camera design dedicated to breast cancer imaging using Monte Carlo simulation. Medical Physics. 2007;34:689–702. doi: 10.1118/1.2409480. [DOI] [PMC free article] [PubMed] [Google Scholar]


