

Abstract
Although talents and disabilities appear to run in families, direct links between genes and cognitive ability are difficult to establish. Investigators are currently searching for intermediate phenotypes with plausible links to both genome and cognome (the cognitive phenotype). Cortical anatomy could provide one such intermediate phenotype. Variation in cortical size, asymmetry and sulcal pattern is influenced by genetic variation in neurotrophic factors and can predict variation in verbal and mathematical talent. Anecdotal evidence suggests that individuals with a rare morphological variant of Sylvian fissure sometimes have superior visualization ability combined with verbal deficits. Documentation of such ‘cognitive cortical syndromes’ might prove as genetically informative as the identification of dysmorphic syndromes associated with mental retardation. A necessary prerequisite for the establishment of such syndromes is a reliable technique for the identification of cortical patterns. Recent technical advances in software for automatically labeling and measuring cortical sulci now provide the possibility of establishing standard measures for their shape, size and location. Such measures are a prerequisite for genetic studies of cortical patterns that could illuminate the neurodevelopmental pathways by which genes affect cognitive ability.
Keywords: Anatomy, asymmetry, cognition, MRI
Although talents and disabilities frequently run in families (Francks et al. 2003; West 1997), direct links between genes and cognitive ability are difficult to establish (Chorney et al. 1998; Fisher et al. 2002). The link between genome and cognome (the cognitive phenotype) can be obscured by epigenesis. Cognitive abilities develop over a protracted period in childhood and adolescence. In talented families, early aptitude is reinforced through continual exposure to expert tutoring and high expectations. In families with disabilities, by contrast, early vulnerabilities may be ignored and/or amplified due to inexpert guidance and low expectations.
Epigenesis is a complex concept with different meanings in different disciplines. In child development, epigenesis refers to the processes by which genetic predispositions are reinforced or thwarted by parental, peer and other societal influences (Bateson 1975). Geneticists reserve the term for molecular alterations of gene expression, such as X chromosome inactivation, that occur very early in embryogenesis (Jaenisch & Bird 2003). Whether narrowly or broadly defined, epigenetic processes modify the cognitive phenotype, necessitating a search for intermediate phenotypes that are more directly linked to genetic mechanisms. In this paper, we explore the idea that cortical anatomy might provide such an intermediate phenotype. Cortical patterns are shaped by genetic influences on neural development (Free et al. 2003; Fukuchi-Shimogori & Grove 2001), and regional differences in these patterns are associated with variation in information-processing efficiency that affect cognitive ability (Krubitzer & Kahn 2003).
We will present evidence from a variety of sources to support the validity of anatomy as an intermediate phenotype. In section I, we summarize the work from our laboratory showing that variation in two anatomical measures –cerebral size and Sylvian fissure asymmetry – is related to individual differences in cognitive ability across a wide variety of diagnoses. Section II presents a reanalysis of data from a published twin study that suggests that low concordance rates for anatomical measurements in monozygotic (MZ) twins may underestimate their genetic associations. Section III, the longest section, is a more general discussion of cortical patterns, their measurement, their origin and some associations with cognitive function. Study of the genetic precursors of cortical patterns may hold special promise, because these patterns become set during prenatal development (Cachia et al. 2003; Kostovic et al. 2002) and may be more resistant to postnatal epigenetic modification than cognitive performance.
I. Cortical variation and verbal ability
Cerebral size
Genetic influences on the size of the cerebral hemispheres are substantial (Pennington et al. 2000; Schoenemann et al. 2000), single genes with marked effects on brain size have been identified (Bond et al. 2002; Chenn & Walsh 2002), and variation in brain size is associated with modest but reliable variation in cognitive function (Andreasen et al. 1993; MacLullich et al. 2002; Pennington et al. 2000; Reiss et al. 1996; Schoenemann et al. 2000; Willerman et al. 1991). In our own studies of schizophrenia (Leonard et al. 1999) and language-learning disorders (Eckert et al. 2003; Leonard et al. 2001; 2002), we have been impressed at the stability of the relationship between cerebral volume and verbal ability in children and adults across a variety of diagnoses. The differences in cerebral volume that sometimes occur between experimental and control groups are usually associated with group differences in verbal ability.
Over a series of individual studies, we observed that performance on the Woodcock–Johnson Test of Passage Comprehension (Woodcock & Johnson 1989) (a procedure in which participants are asked to fill in the blank in a sentence with a suitable word) showed a robust relationships with measures of cortical anatomy. Measures of reading comprehension correlate highly with other measures of verbal intelligence such as vocabulary and the ability to solve analogies (Carroll 1993).
Our magnetic resonance-imaging (MRI) archive was searched for all individuals that had received Woodcock–Johnson Test of Passage Comprehension. Table 1 provides descriptive statistics for the 330 individuals identified in this search. They have been divided into the following four diagnostic groups; Adults: 72 healthy adults recruited as controls for studies of schizophrenia and learning disability; Schizophrenia (S): 46 patients with schizophrenia who were diagnosed using standard research criteria (First et al. 1996); Children: 102 healthy children recruited for a study of normal development; Language-learning disability (LLD): 110 individuals with diagnoses of either dyslexia (poor single-word reading ability) or specific language impairment (poor performance on tests of oral language). Written consent was obtained from all participants and parents, and assent was obtained from each child. Each project had received approval from the Institutional Review Boards of the participating institutions.
Table 1.
Means and standard deviations for demographic and anatomical variables in the four diagnostic groups comprising the magnetic resonance-imaging archive
| Adult | S | Children | LLD | |
|---|---|---|---|---|
| n (M/F) | 66/6 | 37/9 | 59/43 | 72/38 |
| Age | 33 13 | 41 (10) | 9.4 (1.7) | 12.3 (4.9) |
| Parental SES | 40 (11) | 40 (14) | 46 (12) | 39 (13) |
| Dextrality | 0.73 (0.36) | 0.51 (0.59) | 0.67 (0.46) | 0.70 (0.44) |
| Reading comprehension | 116 (14) | 92 (15) | 112 (15) | 95 (18) |
| Cerebral volume | 0.34 (1.0) | −0.12 (1.2) | 0.06 (0.95) | −0.13 (1.1) |
| Sylvian fissure asymmetry | 0.13 (0.21) | 0.13 (0.16) | 0.10 (0.20) | 0.09 (0.20) |
M, male; F, female; S, Schizophrenia; LLD, language-learning disorders; SES, socioeconomic status.
Parental socioeconomic status measured with the Hollingshead four factor scale (available for 213 participants) (Hollingshead 1975); Dextrality was measured with a modified Edinburgh questionnaire (1 is completely right handed, −1, completely left handed) (Briggs & Nebes 1974); Reading comprehension was measured with the Passage Comprehension subtest from the Woodcock–Johnson Achievement Test Battery (Woodcock & Johnson 1989). Cerebral volume was normalized for sex differences using data from a normal sample of brains from our archive. The Sylvian fissure measurement was derived by adding together surface area measurements of all structures found in the posterior Sylvian fissure: the planum temporale, planum parietale and Heschl’s gyri. The coefficient of asymmetry was calculated according to the standard formula (left − right)/[(left + right/2]. This asymmetry was significantly greater than 0 in each of the diagnostic groups (paired test, t > 4.5, P < 0.0001).
Figure 1 shows the relation between cerebral volume and reading comprehension in these 330 individuals. Although there is substantial variation around each point, there is a highly significant relation between reading comprehension and cerebral volume (Pearson r = 0.31, P < 0.0001). The results of multiple regression analyses provided in Table 2 demonstrate that individual differences in socioeconomic status (SES) (Hollingshead 1975), dextrality and anatomy are attributable to differences in reading comprehension rather than diagnosis.
Figure 1. The statistical relationship between reading comprehension and brain volume (means and standard errors).
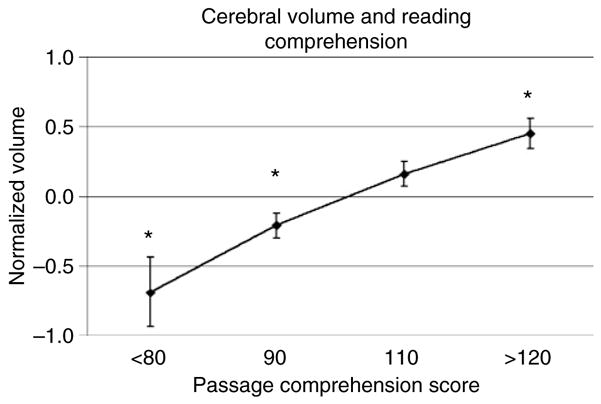
Individuals from a magnetic resonance-imaging archive of normal individuals and patients with schizophrenia and a range of learning disabilities were classified on the basis of their reading comprehension scores as measured by the Woodcock–Johnson Test of Passage Comprehension (Woodcock & Johnson 1989). Individuals with below average reading comprehension are more likely to have below average brain volume than individuals with above average reading comprehension, although there is extensive individual variability (Pearson r = 0.31, P < 0.0001). Asterisks indicate that mean value is significantly different from zero (P < 0.05).
Table 2.
The results of multiple regression analyses to identify the relative contributions of diagnosis and reading comprehension (a marker of verbal ability) on individual differences in demographic and anatomical variables. The results demonstrate that ability differences within, rather than across, diagnoses explain anatomical, handedness and SES differences among individuals
| Overall | Diagnostic group | Reading comprehension | |
|---|---|---|---|
| F (4,325) (p) | F (p) | F (p) | |
| Age | 217.7 (0.0001) | 290.2 (.0001) | 0.94 (NS) |
| Parental SES | 8.05 (0.0001) | 2.53 (NS) | 17.0 (0.0001) |
| Dextrality | 2.89 (0.05) | 1.77 (NS) | 4.22 (0.05) |
| Cerebral volume | 9.56 (0.0001) | 0.75 (NS) | 27.1 (0.0001) |
| Sylvian fissure asymmetry | 4.32 (0.001) | 1.6 (NS) | 16.7 (0.0001) |
Multiple regression analysis performed to determine the relative contribution of diagnostic and ability differences to SES, dextrality and anatomy was performed with PC-SAS (SAS 2002).
Sylvian fissure asymmetry
Figure 2 shows the relationship between reading comprehension and Sylvian fissure asymmetry in these 330 individuals. The Sylvian fissure measurement was derived by adding together surface area measurements of all structures found in the posterior Sylvian fissure: the planum temporale, planum parietale and Heschl’s gyri. The coefficient of asymmetry was calculated according to the standard formula (left − right)/[(left + right)/2]. The graph shows that individuals with very poor reading comprehension are more likely to have a right Sylvian fissure that is longer than the left than individuals with average reading comprehension (Pearson r = 0.21, P < 0.005). Interestingly, as there is no correlation between Sylvian fissure asymmetry and cerebral volume (Pearson r = 0.03, P = 0.58), these two aspects of cerebral morphology contribute independently to cognitive ability.
Figure 2. The statistical relationship between reading comprehension and Sylvian fissure asymmetry (means and standard errors) in the same individuals as shown in Fig. 1.

Measurements of Heschl’s gyrus, the planum temporale and the planum parietale were added together to create an index of Sylvian fissure length. Individuals with poor reading comprehension are more likely to have rightward asymmetry (r > l), while individuals with superior reading comprehension are more likely to have extreme leftward asymmetry (L » R) (Pearson r = 0.21, P < 0.005). The three means on the right are statistically different from zero (P < 0.0001).
These data on cerebral size and Sylvian fissure asymmetry have been included to make a cautionary point. When phenotypic differences are found between diagnosed and control groups, it is important to make sure that these differences are specific markers for the diagnosis rather than a non-specific marker of generalized cognitive deficit. Regardless of diagnosis, otherwise normal children with poor reading comprehension, dyslexics with poor reading comprehension and schizophrenics with poor reading comprehension have greater anatomical similarities than individuals with the same diagnosis who have better reading comprehension. If the continuum of cognitive ability is not taken into account in the design of genetic studies, non-specific genes for cognitive disability that contribute to behavioral variation within diagnoses may be misidentified as genes that contribute to behavioral variation between diagnoses. The evidence presented above suggests that Sylvian fissure asymmetry and cerebral volume might be good candidates for genetic study of intermediate phenotypes linked to cognitive ability.
Previous work on asymmetry and cognitive ability
There have been previous reports that the most well-known subdivision of the Sylvian fissure – the planum temporale – is associated with a variety of measures of verbal and reading ability (Eckert et al. 2001; Leonard et al. 1996; Rumsey et al. 1997). The planum temporale is the brain structure that Geschwind and Levitsky (1968) found was five times more likely to be longer on the left than the right. Remarkably, that ratio has held true over the succeeding three decades, in spite of marked variations in sample composition, technology and measurement technique (Foundas et al. 2002; Kulynych et al. 1995; Shapleske et al. 1999; Watkins et al. 2001). For example, 70% of the 330 individuals described here had significant leftward asymmetry (significance is conventionally defined as an asymmetry greater than 10%), 15% had symmetrical plana temporale and 15% had significant rightward asymmetry with no difference in proportion in the four diagnostic subgroups.
A left hemisphere advantage in the size of the planum temporale may contribute to a left hemisphere advantage in the speed of processing verbal information. We recently reported that the degree of visual field asymmetry in the speed of lexical decision and word naming was associated with the degree of leftward planar asymmetry in 20 normal college students (Chiarello et al. 2004a). Given the importance of left hemisphere mechanisms for language processing in the evolution of our species, it is reasonable to search for a genetic basis for planar asymmetry. The next section presents a reanalysis of data from a published study on MZ twins that addressed this question.
II. Heritability of planar asymmetry
To date, the major genetic strategy for the analysis of cortical variation has been the twin study. In twin designs, the difference between the association in MZ and dizygotic twin pairs is taken as evidence for the degree of heritability (Wright et al. 2002). These studies have not provided strong evidence for genetic influences on sulcal anatomy (Bartley et al. 1993; Lohmann et al. 1999; White et al. 2002). It is possible, however, that twin studies may underestimate genetic influences. Differences in birth weight suggest an unequal distribution of placental resources, and later differences in a variety of biometric indices are correlated with these birth weight differences (Charlemaine et al. 2000). Cortical development would be expected to be particularly susceptible to unequal resource distribution, because it is most rapid in the last trimester when crowding of the uterus is at its peak and deviance from the optimal trajectory most likely (Dooling et al. 1983; Garel et al. 2003).
We reported evidence consistent with the idea that events during fetal development affect the concordance of planar asymmetry in monozygous male twins (Eckert et al. 2002). The twins (mean age 11.9, 83% right handed) were recruited from the American Academy of Child and Adolescent Psychiatry, the Virginia Commonwealth University Twin Registry and the National Organization of Mothers of Twins Clubs by J. Giedd. Zygosity was verified using 9–14 unlinked short tandem repeat loci, by BRT Laboratories Inc (Baltimore, MD). Purported MZ cases which did not yield a probability of twinship >99% were tested further for a total of 21 loci. Written assent from the child and consent from the parents was obtained for each participant, and the project received approval from the National Institute of Mental Health and the University of Florida Institutional Review Boards. The investigation was confined to male twins to exclude the possibly confounding effects of random X chromosome inactivation.
In the initial analysis, the values of planar asymmetry in the co twins did not show a significant association. The correlation (Pearson r) between planar asymmetries in each twin pair only became significant when six twin pairs with greater than 20% difference in birth weight were excluded. In the published paper, the post hoc exclusion of these twins was justified on the basis of probable twin transfusion syndrome, a condition in which the blood supply passes through one twin before the other, jeopardizing the health of both (Haverkamp et al. 2001; Tan et al. 1979). Because of differences in growth rate, twins with twin transfusion syndrome are frequently discordant on many measures. But even when these six twin pairs were excluded from the analysis, the concordance between measures of planar asymmetry was relatively low (r = 0.44, P < 0.05).
For the present article, we asked whether we could find evidence for disturbed development in a larger proportion of the sample. We reanalyzed the data to see whether the size of the discrepancy in cerebral volume predicted the size of the discrepancy in planum temporale size. The graphs presented in Figs 3 and 4 show a wide variation in concordance of cerebral volume, even though the overall correlation was very high (Pearson r = 0.94, P < 0.01). Figure 3 suggests that individuals can be divided between those whose values for cerebral volume lie on and off the diagonal. The right side of Fig. 3 shows that the volume discrepancies in the 11 pairs of twins whose data lie along the diagonal were below 1%, while those in the other 16 pairs ranged from 2 to 7%.
Figure 3. The concordance between brain volumes in 27 pairs of male monozygotic twins studied by Eckert et al. (2001).

Although there is a very high correlation between brain volumes in twin 1 and twin 2 (Pearson r = 0.94, P < 0.001), the graph on the left shows two clusters. The values for one group fall directly on the diagonal (perfect correlation), while those in the other group are more discrepant and fall below the diagonal. On the right, it can be seen that there are 11 pairs with volume discrepancies of less than 1%, while the 16 other pairs have discrepancies ranging up to 7%. Because twins with smaller brain volumes have larger discrepancies (Pearson r = 0.46, P < 0.05), it appears that adverse events in the uterus may both lower brain volume and decrease concordance.
Figure 4. Left: in the 11 twin pairs with concordant brain volumes (discrepancies < 1%), there is a significant relationship between left planum length in twin 1 and twin 2.

Right: in the 16 twin pairs with discrepant brain volumes, there is no relationship between left planum length in twin 1 and twin 2. The fact that both brain volume and planar length are discrepant in the same twin pairs suggests that intrauterine events have interfered with the genetic program of brain development.
The formation of these two subgroups was further justified by the fact that there was a clear difference in the absolute size as well as the variability of the volume discrepancy in the two groups. The mean volume discrepancy in the concordant subgroup was 3.2 ± 2 cc, while the mean discrepancy in the discordant group was more than 10 times as high: 42.7 ± 17.7 cc. These two groups also differed in the degree of concordance for the planum temporale. There was no correlation between planar lengths or asymmetries in the discordant pairs (all r < 0.05). By contrast, both left and right planar lengths were significantly correlated in the pairs with concordant cerebral volume (r of 0.74 and 0.73, P < 0.05). Planar asymmetry showed a non-significant but positive correlation (r = 0.40) in this subgroup. Figure 4 shows the relationship of left planar length in concordant and discordant twin pairs.
The graph on the right side of Fig. 3 suggests the possibility that the twins with the largest cerebral volumes had the smallest discrepancies. These twins may have had longer gestation periods. Perhaps healthy fetal development that permits the development of large cerebral volumes also reduces environmentally induced inequality in development, consistent with the work of Charlemaine and colleagues cited above. The twins recruited for this study came from upper-middle class households and had intelligence quotients considerably above average. The fact that twins from such protected environments demonstrate evidence of fetal disturbance suggests estimates of heritability in twins might need modification for the general population. The next section reviews some recent studies that use other strategies to connect genetic, cortical and cognitive variation.
III. The investigation of cortical patterns
Until the advent of high-resolution structural MRI in the early 1990s, it was impractical to study the relationship between genes, cortical morphology and cognitive function, because the large samples necessary were difficult to obtain in post-mortem studies. Furthermore, in such studies, quantitative measurements require irreversible damage to the object of study. Even now, there are relatively few studies of the genes that influence cortical patterns. There are probably many reasons: (a) MRI is expensive and inconvenient; (b) the advent of functional MRI diminished interest in structure; (c) genetic influences were assumed to be limited, because the sulcal patterns of identical twins are not identical (Bartley et al. 1993; Lohmann et al. 1999; White et al. 2002); (d) the boundaries of cytoarchitectonic areas don’t coincide exactly with gyral boundaries (Rademacher et al. 2001; Zilles et al. 2002) and (e) sulcal analysis is labor intensive and without standard quantitative or qualitative assessment methods.
Approaches to measurement
The earliest attempt to develop standard methods for assessment of cortical morphology in imaging studies was the cortical parcellation method developed at Massachusetts General Hospital (Caviness et al. 1996; Kennedy et al. 1998; Rademacher et al. 1993). This method was developed on a sample of 20 individuals. Because of the wide variation in sulcal branching patterns, an elaborate set of guidelines was developed for identifying boundaries of areas designed to be roughly equivalent to Brodmann areas. Application of these guidelines greatly improved inter-rater reliability because of the elimination of subjective decisions. It is possible, however, that treating inter-subject variation in sulcal patterns as noise to be eliminated might reduce the usefulness of this method for genetic investigations.
The cortical parcellation method is by far the most detailed, theoretically and anatomically well-grounded method currently available. Recent improvements in the software have enabled the automated parcellation of images, given that scans are of sufficiently high quality (Fischl et al. 2002). Never the less, it has not proved as popular as voxel-based morphometry (VBM). The VBM method eliminates local information about sulcal form by representing brains as maps of gray matter intensities registered to a representative template. This method is fully automated and thus perfectly reliable (Ashburner & Friston 2000; Good et al. 2001; Wilke et al. 2004). It is becoming the standard technique used in imaging studies of genetic variation (Belton et al. 2003; Free et al. 2003; Reiss et al. 2004). As in the case of cortical parcellation, there is the chance that eliminating information about sulcal variation may eliminate important genetic or functionally important variance (Eckert et al. 2005).
One way of attempting to deal with the problem of sulcal variation is to develop metrics such as gyrification and complexity as global indicators of curvature. An early method, developed by the Zilles group (Zilles et al. 1988), created a ratio between surface and hidden cortex. An automated measure of complexity has been developed at University of California at Los Angeles (UCLA) (Narr et al. 2004), where the analysis is performed on hemispheres warped to manually identified sulci. Both methods hold promise as indicators of genetically based variance in cortical morphology.
The methods described above treat variation in each sulcal region as a continuous variable, even though many brains have missing and duplicated sulci that do not easily fit into such a scheme. An alternate but considerably more tedious approach is to categorize the presence of branches, sulci and interruptions. The modern bible for this technique reports results on 20 brains examined at post-mortem (Ono et al. 1990). Quantitative data on frequency and location of sulcal branches in the left and right hemisphere are reported for all lobes, but the post-mortem examination made it impractical to obtain measurements of length or volume. More sizable databases have been used in imaging studies of variation in sulcal patterns focused on one sulcus or region (Ide et al. 1999; Leonard et al. 1998; Naidich et al. 1995; Paus et al. 1996; Witelson & Kigar 1992; Yousry et al. 1997). There is a pressing need to develop methods for assessing sulcal patterns that utilize information about normal variation in the general population.
Sylvian fissure classification
One reason that a study of normal variation is needed is that quantitative differences in volumetric measurements of a particular region may reflect underlying differences in the frequency of qualitatively different structures rather than normal variation around a single mean. In the case of planar asymmetry, qualitative variants in parietotemporal morphology are associated with Sylvian fissures of different length (Steinmetz et al. 1990) as shown in Fig. 5. Briefly, the most frequent Sylvian fissure type (type 1) in both the left and the right hemisphere has both a horizontal branch (planum temporale) forming the superior surface of the superior temporal sulcus and a vertical branch (planum parietale) ascending into the supramarginal gyrus. In the left hemisphere, the most frequent variants are horizontal branches that extend posterior to the supramarginal gyrus into the angular gyrus (type 3) or fissures that lack a vertical branch altogether (type 2). In the right hemisphere, types 2 and 3 are rare. The most frequent variant (type 4) lacks a horizontal branch, because the vertical branch rises directly posterior to the central sulcus, anterior to the supramarginal gyrus. Witelson and Kigar have observed the same left/right differences in fissure type (Witelson & Kigar 1992). In the Witelson and Kigar scheme, type 1 is called HV because of the presence of both horizontal and vertical branches, type 2 is called type H because of the absence of a vertical branch (more common in the left hemisphere) and type 4 is called V, because of the absence of a horizontal branch (more common in the right hemisphere).
Figure 5. Four hemispheres from right-handed adult males demonstrating the four Sylvian fissure types of Steinmetz and colleagues (Steinmetz et al. 1990).
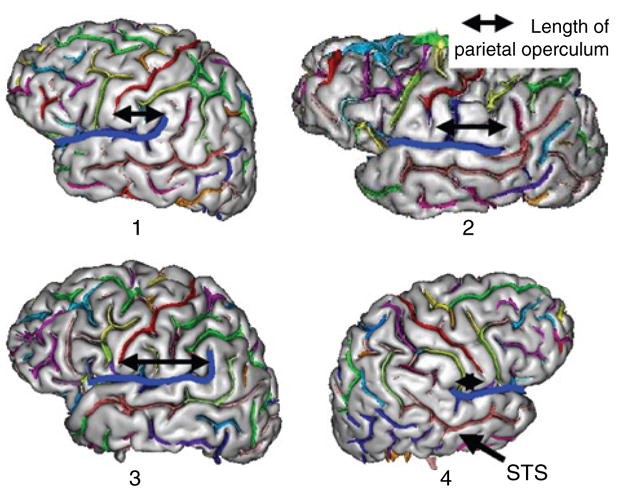
The horizontal black arrow shows how the size of the parietal operculum varies with fissure type. The length of the planum temporale varies with operculum size, because it lies inferiorly to the operculum on the lower bank of the Sylvian fissure (blue). Type 1, where a single postcentral sulcus (yellow) descends between the central sulcus (in red at anterior tip of arrow) and the posterior ascending ramus of the Sylvian fissure (blue), is the most common in both the left and right hemisphere. Types 2 and 3 are more common in the left hemisphere (LH: 33%, RH: 3%), while type 4, in which the planum temporale is very short because the Sylvian fissure merges with the postcentral sulcus, is more common in the right hemisphere (LH: 3%, RH: 14%) (Steinmetz et al. 1990). Type 4 fissures are associated with a relatively enlarged posterior parietal lobe due to the absence of temporal lobe posterior to the postcentral sulcus. Brain scans were automatically processed and labeled with BrainVisa© (Riviere et al. 2002).
Possible cognitive associations of missing planum temporale
These qualitative differences in branching pattern may underlie the population bias toward leftward planar asymmetry. It is possible that associations between cognitive, genetic and anatomical measures might be stronger if qualitative differences in Sylvian fissure morphology were taken into account. For example, there is anecdotal evidence that the absence of a planum temporale can be associated with the unusual combination of verbal deficits and higher mathematical talent that characterize some gifted individuals who struggle in primary school (West 1997). During our studies, we have encountered type 4 fissures in the right hemisphere of two successful dyslexic individuals who reported being told they might be mentally retarded during childhood (Chiarello et al. 2004b; Leonard et al. 1993) as well as in a child with severe word-finding difficulties (Linda Lombardino, unpublished data). A type V formation was seen, bilaterally, in two individuals with dyslexia diagnosed in adulthood, who were highly successful academic physicians in fields emphasizing visuospatial skills (Leonard et al. 1993). Witelson subsequently reported the same bilateral absence of plana temporale in Einstein (Witelson et al. 1999), a gifted mathematical thinker with a self-reported poor memory for words and inability to learn foreign languages (two frequent characteristics of dyslexia) (Hoffman & Dukas 1972).
Because both type V and type 4 fissures are associated with an enlarged posterior parietal lobe (due to the foreshortened Sylvian fissure and parietal operculum), these anecdotal data are consistent with the view that the posterior parietal lobe plays a special role in mathematical processing (Garcia-Orza et al. 2003). In addition, a recent report found that girls with a chromosomal abnormality that causes arithmetic deficits (Turner’s syndrome) have specific abnormalities in the major sulcus of the posterior parietal lobe, the intraparietal sulcus (Molko et al. 2003). The idea that an enlarged posterior parietal lobe may contain genetically coded sulcal variants that are associated with a heightened ability to visualize complex mathematical relationships is intriguing.
Cortical cognitive syndromes?
The evidence presented above suggests the possibility that there may be cortical cognitive syndromes – clusters of cognitive and developmental symptoms that are associated with particular constellations of cortical morphology. In the field of dysmorphology, a number of craniofacial syndromes associated with mental retardation turned out to have a simple genetic basis (McKusick & Amberger 1994). The success of the syndrome approach in that field suggests it might be a promising strategy for identifying genetic cognitive links more broadly.
At present, the evidence that sulcal variants are linked to cognitive variation is still limited. Because individuals with a particular genetic syndrome or complex behavioral disorder vary on many different cognitive dimensions, it is not surprising that there are few replicated studies and many conflicting findings (Billingsley et al. 2003; Clark & Plante 1998; Hiemenz & Hynd 2000; Kikinis et al. 1994; Leonard et al. 1993; 2001; Levitt et al. 2003). Recently, however, two separate groups have reported a diminished frequency of the paracingulate sulcus in the left hemisphere in schizophrenia (Le Provost et al. 2003; Yucel et al. 2002). This replicated finding is especially interesting, because paracingulate activation is associated with the generation of verbal output (Crosson et al. 1999), and its size is associated with variation in cognitive ability (Fornito et al. 2004). A missing paracingulate sulcus may be associated with a particular cognitive syndrome that is sometimes co-morbid with schizophrenia, rather than with schizophrenia, itself.
The origin of sulcal patterns
How does variation in sulcal patterning arise? Although many early investigators attributed the folds to simple mechanical folding of overgrown cortex into the constrained space provided by the skull, skull bone position is responsive to brain growth and need not provide a constraining environment (Welker 1990). The strong consistency between the sulcal morphology of species within orders where individual size varies dramatically (such as lions and house cats) seems unlikely to be a result of simple mechanical folding. Welker maintains that ‘intertaxon differences in gyral sulcal pattern of organization reflect fundamental taxonomic differences in the number, diversity, relative size, spatial organization and connectivity patterns of cortical areas’ (p. 105). He also proposed that individual differences in gyral patterns were, like fingerprints, genetically determined and suggested a variety of experimental approaches to determining the mechanisms and significance of sulcal folding.
A number of different lines of evidence suggest that the size and location of gyri and sulci may be determined by their axonal connections. A study of human fetal development demonstrated that sulcal invaginations occurred in cortical regions that overlay thinning in the subplate (Kostovic & Rakic 1990). Because the subplate serves as the staging ground for fiber entry into cortex, Kostovic and Rakic proposed that ‘the pattern of cerebral convolutions depends on the relative amount and orientation of axonal bundles that lie below the cortical plate’ (p. 467). We have preliminary evidence in support of this hypothesis. Figure 6 shows the fiber trajectories from the posterior superior temporal gyrus in two individuals with different Sylvian fissure morphology in the right hemisphere. The fibers shown in blue come from an individual with symmetrical plana temporale and type HV fissures in each hemisphere. As can be seen, there are fibers projecting to the frontal lobe in both hemispheres. The individual whose fibers are plotted in yellow has a type V fissure in the right hemisphere. In this individual, there are no fibers projecting from the superior temporal gyrus to the frontal lobe in the right hemisphere. In such a case, the parietal lobe projections to the frontal lobe would have less competition from temporal lobe input. Such differences in fiber connections may underlie the superior visual spatial or mathematical abilities seen in individuals with type V and type 4 fissures.
Figure 6. The fiber trajectories obtained from bilateral seeds in the posterior superior temporal gyrus (T) of diffusion weighted scans from two individuals with different Sylvian fissure morphology in the right hemisphere (R).
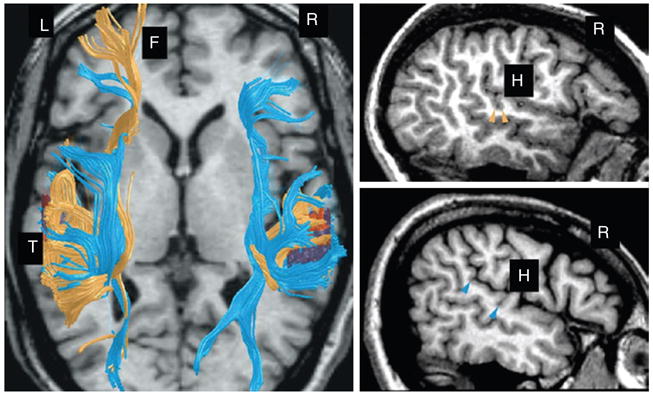
Fiber trajectories have been superimposed on an axial high-resolution magnetic resonance image. Blue fibers come from an individual with symmetrical plana temporale, i.e. type HV fissures in each hemisphere (blue arrows on the right top image show the boundaries of the planum temporale in this individual). Fibers project to the frontal lobe (F) in both hemispheres. Yellow fibers come from an individual with a type V fissure on the right. The yellow arrowheads in the right lower image mark the posterior boundary of Heschl’s gyrus (H) which coincides with the posterior boundary of the Sylvian fissure, because there is no planum temporale. There are no fibers projecting to the frontal lobe from this region in the right hemisphere of this individual.
A relationship between connectivity and sulcal patterning is also suggested by the fact that peak activation loci are eight times more likely to be found in the fundi of sulci than would be expected on the basis of chance (Markowitsch & Tulving 1994). The location and shape of sulcal folds may provide important information about the constituents of functional networks. The dependence of sulcal location on fiber connections is also suggested by the finding that extra sulci appear in visual cortex after neonatal frontal or retinal damage (Dehay et al. 1996; Goldman & Galkin 1978; Rakic 1991). It may be relevant that computer simulations suggest that the arrangement of cortical areas is the one that minimizes the total volume of connecting axons (Klyachko & Stevens 2003).
Van Essen has suggested that sulcal folds may be produced during development by the tension arising from competition between distant and local fiber connections (Van Essen 1997). The idea that the pattern of axonal connectivity determines the size and shape of cortical sulci could be tested by diffusion tensor-imaging studies that assessed the covariation of fiber directionality and sulcal morphology between individuals (such as the example shown in Fig. 6). It would be interesting to know if variation in expression of molecules that guide fiber in growth (Bolz et al. 2004; Sestan et al. 2001) is related to the temporal course of sulcal ontogenesis. This question could be investigated in ferrets, a species with consistent sulcal patterning (Smart & McSherry 1986a, 1986b).
Genetic studies of cortical morphology
There are a few imaging studies of the effect of mutations in genes for transcription and neurotrophic factors and guidance molecules on human cortical morphology. One early study found that resistance to thyroid hormone caused by a mutation in the thyroid receptor gene was associated with an elevated incidence of a duplication of primary auditory cortex (duplicated Heschl’s gyrus) (Leonard et al. 1995) that is also seen in dyslexia (Leonard et al. 1993; 2001). The effect of thyroid resistance on brain morphology was limited to boys, and there have been no further studies investigating the relationship between thyroid hormone and sulcal morphology. An interaction between early developmental insults and sex is frequently found and needs to be further explored (Barr et al. 2004; Collinson et al. 2003; Johns et al. 2002).
Two studies of Williams syndrome, a genetic deletion syndrome associated with severe deficits in visual spatial perception relative to language, have found that the central sulcus extends less dorsally (Galaburda et al. 2001; Jackowski & Schultz 2005). Even more intriguing, the frequency of a type 2 Sylvian fissure is increased in the right hemisphere in this syndrome (Thompson et al. 2005). In this fissure type, which is rarely seen in the right hemisphere of normal individuals, the temporal lobe is enlarged at the expense of the parietal lobe. Poor visual spatial ability in Williams syndrome may be associated with the diminished size of the parietal lobe.
Another promising research line has been opened up by the study of mutations in genes involved in neural development. For example, different types of mutations in PAX6, a highly conserved, developmentally regulated gene, are associated with different types of abnormal morphology in the occipital and temporal cortex (Free et al. 2003; Mitchell et al. 2003). Parallel studies are investigating the possible cognitive consequences of these neurodevelopmental alterations (Bamiou et al. 2004). A search should be made for functional polymorphisms in the genes that regulate cortical arealization (Funatsu et al. 2004; Nakagawa et al. 1999; O’Leary & Nakagawa 2002) and cerebral and behavioral asymmetry (Liang et al. 2000; Raya & Izpisua Belmonte 2004; Rogers 2000) during early development. The study of genes that are differentially expressed in humans and chimpanzees might also prove illuminating (Caceres et al. 2003; Khaitovich et al. 2004; Watanabe et al. 2004).
New methods for analyzing cortical variation
The preceding sections have briefly reviewed the evidence linking genes, cortical variation and cognitive function. This review suggested that interpretation of these studies depends on the availability of quantitative information about normal cortical variation. It seems clear that both traditional manual methods of analysis and the newer automated methods are inappropriate for this task. Traditional methods are too time consuming and unreliable, while VBM does not preserve information about sulcal variation. Fortunately, some new automated or semi automated methods have recently become available.
BrainVisa, a suite of programs and visualization tools available at http://www.brainvisa.info/ may be particularly suited for this study (Mangin et al. 2004; Riviere et al. 2002). The key to this system is the authors’ novel solution to the problem of sulcal branching and interruptions. The standard approach to sulcal variability has been to make arbitrary decisions about boundaries, in an attempt to establish canonical formations (Caviness et al. 1996) or comparable subdivisions for subsequent warping (Sowell et al. 1999; Van Essen et al. 2001). The French group’s approach is quite different. They hypothesize that the major sulci are composed of a variable number of primitives or ‘sulcal roots’ that start to appear in the fifth month of fetal development (Chi et al. 1977; Garel et al. 2003; Levine & Barnes 1999). These sulcal roots persist in the adult brain as the deepest parts of the cortical folds. Reasoning that these sulcal roots might be more consistent in location and appearance than more superficial regions, these investigators used neural network techniques to assign experts to each root and each pair of adjacent roots (Riviere et al. 2002). These experts compete with each other to assign labels to each sulcus. By the time the hemisphere is finished processing, a set of numerical parameters, including volume, surface area, depth, position and number of nodes has been generated for each sulcus. This is the only software currently available that attempts to maintain information about variation in sulcal branches, interruptions and position.
The first study to be published using this approach analyzed left–right asymmetries in the superior temporal sulcus and found that interruptions persist more superficially in the left hemisphere (Ochiai et al. 2004). Another study, in Turner’s syndrome, identified alterations in the interparietal sulcus that were associated with inferior arithmetic ability (Molko et al. 2003). It should be noted that both these studies come from the group that developed the software. It will be interesting to see if other groups can be as successful, because some aspects of the application still need improvement. For example, at present, each labeled sulcus must be individually inspected, because misidentification is fairly common, due, no doubt, to the relatively small database used to train the network. Still, this software appears to offer a promising approach to a here to fore intractable task of cortical analysis
Alternative freely available software has been developed by groups at Washington University, St Louis, (Van Essen et al. 2001) http://www.brainmap.wustl.edu/resources/ and Harvard (Fischl et al. 2002) http://www.surfer.nmr.mgh.harvard.edu/. These approaches differ from that of BrainVisa in that the goal is to register all brains to a common space to produce flat maps of the cortex resembling a Mercator projection. It is to be hoped that comparative studies will be performed using several different software approaches to determine the problems for which each is most appropriate.
Summary
The genome and cognome are separated by complex developmental pathways. This article has argued for the use of anatomical morphology as an intermediate phenotype, because it is plausibly linked to both cognitive function and genetic mechanisms. This argument is strengthened by a growing number of studies that have demonstrated altered cortical morphology in genetic syndromes affecting cognitive function (Belton et al. 2003; Free et al. 2003; Galaburda et al. 2001; Reiss et al. 2004) as well as associated with allelic variants in the normal population (Pezawas et al. 2004). A serious impediment to the search for genetic associations with anatomy is the present lack of quantitative information about the range of normal variation in cortical patterns. Recent improvements in automated software should facilitate the collection of such information.
Future directions
The decoding of the human genome has provided a powerful new tool – the examination of genetic polymorphisms that contribute to variation in brain development. The effects of these genes on many different dimensions of brain development are known in animals (mainly rodents). For example, a complex network of transcription factors and secreted molecules regulates the development of regional identity in the cortex (Bishop et al. 2000; Fukuchi-Shimogori & Grove 2001). Growing evidence suggests that mutations in the genes for some of these molecules affect the shape and size of cortical sulci in the human. It is now possible to generate reasonable hypotheses about links between neurotrophic factors, guidance molecules, sulcal development and adaptive function. Large, longitudinal, family-based studies will be needed to investigate the relationship between allelic variants in these genes, neural differences in cortical morphology and cognitive development. It may be valuable to attempt to document the occurrence of cortical cognitive syndromes in which clusters of cognitive and morphological characteristics are associated, shifting attention from a one-time snapshot of behavioral performance to the case history approach that has proven so powerful in the identification of the genetic syndromes associated with mental retardation (McKusick & Amberger 1994). These new paradigms may allow a biologically based approach to the understanding of cognitive and behavioral variation.
Acknowledgments
We are grateful to the patients and their families who participated in the studies contributing to this report as well as the students and collaborators who recruited the subjects and performed the behavioral and anatomical assessments. We also particularly thank Christine Chiarello and Linda Lombardino for their support and counsel. The work was supported, in part, by NIH grants DC002922 and DC005364, and DC 006957, the March of Dimes, and the Research Service of the Veterans Administration.
References
- Andreasen NC, Flaum M, Swayze V, O’Leary DS, Alliger R, Cohen G, Ehrhardt J, Yuh WTC. Intelligence and brain structure in normal individuals. Am J Psychiatry. 1993;150:130–134. doi: 10.1176/ajp.150.1.130. [DOI] [PubMed] [Google Scholar]
- Ashburner J, Friston KJ. Voxel-based morphometry –the methods. Neuroimage. 2000;11:805–821. doi: 10.1006/nimg.2000.0582. [DOI] [PubMed] [Google Scholar]
- Bamiou DE, Musiek FE, Sisodiya SM, Free SL, Davies RA, Moore A, van Heyningen V, Luxon LM. Deficient auditory interhemispheric transfer in patients with PAX6 mutations. Ann Neurol. 2004;56:503–509. doi: 10.1002/ana.20227. [DOI] [PubMed] [Google Scholar]
- Barr CS, Newman TK, Lindell S, Shannon C, Champoux M, Lesch KP, Suomi SJ, Goldman D, Higley JD. Interaction between serotonin transporter gene variation and rearing condition in alcohol preference and consumption in female primates. Arch Gen Psychiatry. 2004;61:1146–1152. doi: 10.1001/archpsyc.61.11.1146. [DOI] [PubMed] [Google Scholar]
- Bartley AJ, Jones DW, Torrey EF, Zigun JR, Weinberger DR. Sylvian fissure asymmetries in monozygotic twins: a test of laterality in schizophrenia. Biol Psychiatry. 1993;34:853–863. doi: 10.1016/0006-3223(93)90053-g. [DOI] [PubMed] [Google Scholar]
- Bateson MC. Mother-infant exchanges: the epigenesis of conversational interaction. Ann N Y Acad Sci. 1975;263:101–113. doi: 10.1111/j.1749-6632.1975.tb41575.x. [DOI] [PubMed] [Google Scholar]
- Belton E, Salmond CH, Watkins KE, Vargha-Khadem F, Gadian DG. Bilateral brain abnormalities associated with dominantly inherited verbal and orofacial dyspraxia. Hum Brain Mapp. 2003;18:194–200. doi: 10.1002/hbm.10093. [DOI] [PMC free article] [PubMed] [Google Scholar]
- Billingsley RL, Slopis JM, Swank PR, Jackson EF, Moore BD., III Cortical morphology associated with language function in neurofibromatosis, type I. Brain Lang. 2003;85:125–139. doi: 10.1016/s0093-934x(02)00563-1. [DOI] [PubMed] [Google Scholar]
- Bishop KM, Goudreau G, O’Leary DDM. Regulation of area identity in the mammalian neocortex by emx2 and pax6. Science. 2000;288:344–349. doi: 10.1126/science.288.5464.344. [DOI] [PubMed] [Google Scholar]
- Bolz J, Uziel D, Muhlfriedel S, Gullmar A, Peuckert C, Zarbalis K, Wurst W, Torii M, Levitt P. Multiple roles of ephrins during the formation of thalamocortical projections: maps and more. J Neurobiol. 2004;59:82–94. doi: 10.1002/neu.10346. [DOI] [PubMed] [Google Scholar]
- Bond J, Roberts E, Mochida GH, Hampshire DJ, Scott S, Askham JM, Springell K, Mahadevan M, Crow YJ, Markham AF, Walsh CA, Woods CG. ASPM is a major determinant of cerebral cortical size. Nat Genet. 2002;32:316–320. doi: 10.1038/ng995. [DOI] [PubMed] [Google Scholar]
- Briggs GG, Nebes RD. Patterns of hand preference in a student population. Cortex. 1974;11:230–238. doi: 10.1016/s0010-9452(75)80005-0. [DOI] [PubMed] [Google Scholar]
- Caceres M, Lachuer J, Zapala MA, Redmond JC, Kudo L, Geschwind DH, Lockhart DJ, Preuss TM, Barlow C. Elevated gene expression levels distinguish human from non-human primate brains. Proc Natl Acad Sci USA. 2003;100:13030–13035. doi: 10.1073/pnas.2135499100. [DOI] [PMC free article] [PubMed] [Google Scholar]
- Cachia A, Mangin JF, Riviere D, Kherif F, Boddaert N, Andrade A, Papadopoulos-Orfanos D, Poline JB, Bloch I, Zilbovicius M, Sonigo P, Brunelle F, Regis J. A primal sketch of the cortex mean curvature: a morphogenesis based approach to study the variability of the folding patterns. IEEE Trans Med Imaging. 2003;22:754–765. doi: 10.1109/TMI.2003.814781. [DOI] [PubMed] [Google Scholar]
- Carroll JB. Human Cognitive Abilities: A Survey of Factor, Analytic Studies. Cambridge University Press; Cambridge: 1993. [Google Scholar]
- Caviness VC, Meyer J, Makris N, Kennedy DN. MRI based topographic parcellation of human neocortex: an anatomically specified method with estimate of reliability. J Cogn Neurosci. 1996;8:566–587. doi: 10.1162/jocn.1996.8.6.566. [DOI] [PubMed] [Google Scholar]
- Charlemaine C, Duyme M, Ville Y, Aurengo A, Tremblay R, Frydman R, Pons JC. Fetal biometric parameters, twin type and birth weight difference. A longitudinal study. Eur J Obstet Gynecol Reprod Biol. 2000;93:27–32. doi: 10.1016/s0301-2115(00)00239-6. [DOI] [PubMed] [Google Scholar]
- Chenn A, Walsh CA. Regulation of cerebral cortical size by control of cell cycle exit in neural precursors. Science. 2002;297:365–369. doi: 10.1126/science.1074192. [DOI] [PubMed] [Google Scholar]
- Chi JG, Dooling EC, Gilles FH. Gyral development of the human brain. Ann Neurol. 1977;1:86–93. doi: 10.1002/ana.410010109. [DOI] [PubMed] [Google Scholar]
- Chiarello C, Kacinik N, Manowitz B, Otto R, Leonard C. Cerebral asymmetries for language: evidence for structural-behavioral correlations. Neuropsychology. 2004a;18:219–231. doi: 10.1037/0894-4105.18.2.219. [DOI] [PubMed] [Google Scholar]
- Chiarello C, Lombardino L, Kacinik MA, Otto R, Leonard CM. Neuroanatomical and behavioral asymmetry in an adult compensated dyslexic; Cognitive Neuroscience Society Annual Meeting; San Francisco CA. 2004b. [DOI] [PubMed] [Google Scholar]
- Chorney MJ, Chorney K, Seese N, Owen MJ, Daniels J, McGuffin P, Thompson LA, Detterman DK, Benbow C, Lubinski D, Eley T, Plomin R. A quantitative trait locus associated with cognitive ability in children. Psychol Sci. 1998;9:159–166. [Google Scholar]
- Clark M, Plante E. Morphology of the inferior frontal gyrus in developmentally language disordered adults. Brain Lang. 1998;61:288–303. doi: 10.1006/brln.1997.1864. [DOI] [PubMed] [Google Scholar]
- Collinson SL, Mackay CE, James AC, Quested DJ, Phillips T, Roberts N, Crow TJ. Brain volume, asymmetry and intellectual impairment in relation to sex in early-onset schizophrenia. Br J Psychiatry. 2003;183:114–120. doi: 10.1192/bjp.183.2.114. [DOI] [PubMed] [Google Scholar]
- Crosson B, Sadek JR, Bobholz JA, Gokcay D, Mohr C, Leonard CM, Maron L, Auerbach EJ, Browd S, Freeman AJ, Briggs RW. Medial frontal activity during word generation is centered within the paracingulate sulcus; an fMRI study of functional anatomy in 28 individuals. Cereb Cortex. 1999;9:307–316. doi: 10.1093/cercor/9.4.307. [DOI] [PubMed] [Google Scholar]
- Dehay C, Giroud P, Berland M, Killackey H, Kennedy H. Contribution of thalamic input to the specification of cytoarchitectonic cortical fields in the primate: effects of bilateral enucleation in the fetal monkey on the boundaries, dimensions, and gyrification of striate and extrastriate cortex. J Comp Neurol. 1996;367:70–89. doi: 10.1002/(SICI)1096-9861(19960325)367:1<70::AID-CNE6>3.0.CO;2-G. [DOI] [PubMed] [Google Scholar]
- Dooling EC, Chi JG, Gilles FH. Telencephalic development: changing gyral patterns. In: Gilles FH, Leviton A, Dooling EC, editors. The Developing Human Brain. Wright; Boston: 1983. pp. 94–104. [Google Scholar]
- Eckert MA, Lombardino LJ, Leonard CM. Planar asymmetry tips the phonological playground and environment raises the bar. Child Dev. 2001;72:988–1002. doi: 10.1111/1467-8624.00330. [DOI] [PubMed] [Google Scholar]
- Eckert MA, Leonard CM, Molloy EA, Blumenthal J, Zijdenbos AP, Giedd JN. The epigenesis of planum temporale asymmetry in twins. Cereb Cortex. 2002;12:749–755. doi: 10.1093/cercor/12.7.749. [DOI] [PMC free article] [PubMed] [Google Scholar]
- Eckert MA, Leonard CM, Richards TL, Aylward EH, Thomson J, Berninger VW. Anatomical correlates of dyslexia: frontal and cerebellar findings. Brain. 2003;126:482–494. doi: 10.1093/brain/awg026. [DOI] [PubMed] [Google Scholar]
- Eckert M, Leonard CM, Wilke M, Eckert M, Richards T, Richards A, Berninger VB. Anatomical signatures of dyslexia in children: unique information from manual and voxel based morphometry brain measures. Cortex. 2005;41:304–314. doi: 10.1016/s0010-9452(08)70268-5. [DOI] [PubMed] [Google Scholar]
- First M, Gibbon M, Spitzer RL, Williams JBW. The structured clinical interview for DSM-IV-TR. 1996 doi: 10.1001/archpsyc.1992.01820080032005. [DOI] [PubMed] [Google Scholar]
- Fischl B, Salat DH, Busa E, Albert M, Dieterich M, Haselgrove C, van der Kouwe A, Killiany R, Kennedy D, Klaveness S, Montillo A, Makris N, Rosen B, Dale AM. Whole brain segmentation: automated labeling of neuroanatomical structures in the human brain. Neuron. 2002;33:341–355. doi: 10.1016/s0896-6273(02)00569-x. [DOI] [PubMed] [Google Scholar]
- Fisher SE, Francks C, Marlow AJ, MacPhie IL, Newbury DF, Cardon LR, Ishikawa-Brush Y, Richardson AJ, Talcott JB, Gayan J, Olson RK, Pennington BF, Smith SD, DeFries JC, Stein JF, Monaco AP. Independent genome-wide scans identify a chromosome 18 quantitative-trait locus influencing dyslexia. Nat Genet. 2002;30:86–91. doi: 10.1038/ng792. [DOI] [PubMed] [Google Scholar]
- Fornito A, Yucel M, Wood S, Stuart GW, Buchanan JA, Proffitt T, Anderson V, Velakoulis D, Pantelis C. Individual differences in anterior cingulate/paracingulate morphology are related to executive functions in healthy males. Cereb Cortex. 2004;14:424–431. doi: 10.1093/cercor/bhh004. [DOI] [PubMed] [Google Scholar]
- Foundas AL, Leonard CM, Hanna-Pladdy B. Variability in the anatomy of the planum temporale and posterior ascending ramus: do right- and left handers differ? Brain Lang. 2002;83:403–424. doi: 10.1016/s0093-934x(02)00509-6. [DOI] [PubMed] [Google Scholar]
- Francks C, Fisher SE, Marlow AJ, MacPhie IL, Taylor KE, Richardson AJ, Stein JF, Monaco AP. Familial and genetic effects on motor coordination, laterality, and reading-related cognition. Am J Psychiatry. 2003;160:1970–1977. doi: 10.1176/appi.ajp.160.11.1970. [DOI] [PubMed] [Google Scholar]
- Free SL, Mitchell TN, Williamson KA, Churchill AJ, Shorvon SD, Moore AT, van Heyningen V, Sisodiya SM. Quantitative MR image analysis in subjects with defects in the PAX6 gene. Neuroimage. 2003;20:2281–2290. doi: 10.1016/j.neuroimage.2003.07.001. [DOI] [PubMed] [Google Scholar]
- Fukuchi-Shimogori T, Grove EA. Neocortex patterning by the secreted signaling molecule FGF8. Science. 2001;294:1071–1074. doi: 10.1126/science.1064252. [DOI] [PubMed] [Google Scholar]
- Funatsu N, Inoue T, Nakamura S. Gene expression analysis of the late embryonic mouse cerebral cortex using DNA microarray: identification of several region- and layer-specific genes. Cereb Cortex. 2004;14:1031–1044. doi: 10.1093/cercor/bhh063. [DOI] [PubMed] [Google Scholar]
- Galaburda AM, Schmitt JE, Atlas SW, Eliez S, Bellugi U, Reiss AL. Dorsal forebrain anomaly in Williams syndrome. Arch Neurol. 2001;58:1865–1869. doi: 10.1001/archneur.58.11.1865. [DOI] [PubMed] [Google Scholar]
- Garcia-Orza J, Leon-Carrion J, Vega O. Dissociating Arabic numeral reading and basic calculation: a case study. Neurocase. 2003;9:129–139. doi: 10.1076/neur.9.2.129.15070. [DOI] [PubMed] [Google Scholar]
- Garel C, Chantrel E, Elmaleh M, Brisse H, Sebag G. Fetal MRI: normal gestational landmarks for cerebral biometry, gyration and myelination. Childs Nerv Syst. 2003;19:422–425. doi: 10.1007/s00381-003-0767-4. [DOI] [PubMed] [Google Scholar]
- Geschwind N, Levitsky W. Human brain: left-right asymmetries in temporal speech region. Science. 1968;161:186–187. doi: 10.1126/science.161.3837.186. [DOI] [PubMed] [Google Scholar]
- Goldman PS, Galkin T. Prenatal removal of frontal association cortex in the fetal rhesus monkey: anatomical and functional consequences in postnatal life. Brain Res. 1978;152:451–485. doi: 10.1016/0006-8993(78)91103-4. [DOI] [PubMed] [Google Scholar]
- Good CD, Johnsrude I, Ashburner J, Henson RN, Friston KJ, Frackowiak RS. Cerebral asymmetry and the effects of sex and handedness on brain structure: a voxel-based morphometric analysis of 465 normal adult human brains. Neuroimage. 2001;14:685–700. doi: 10.1006/nimg.2001.0857. [DOI] [PubMed] [Google Scholar]
- Haverkamp F, Lex C, Hanisch C, Fahnenstich H, Zerres K. Neurodevelopmental risks in twin-to-twin transfusion syndrome: preliminary findings. Europ J Paediatr Neurol. 2001;5:21–27. doi: 10.1053/ejpn.2001.0400. [DOI] [PubMed] [Google Scholar]
- Hiemenz JR, Hynd GW. Sulcal/gyral pattern morphology of the perisylvian language region in developmental dyslexia. Brain Lang. 2000;74:113–133. doi: 10.1006/brln.2000.2343. [DOI] [PubMed] [Google Scholar]
- Hoffman B, Dukas H. Albert Einstein: Creator and Rebel. New American Library; New York: 1972. [Google Scholar]
- Hollingshead AB. Four Factor Index of Social Skills. Yale University; New Haven: 1975. [Google Scholar]
- Ide A, Dolezal C, Fernandez M, Labbe E, Mandujano R, Montes S, Segura P, Verschae G, Yarmuch P, Aboitiz F. Hemispheric differences in variability of fissural patterns in parasylvian and cingulate regions of human brains. J Comp Neurol. 1999;410:235–242. [PubMed] [Google Scholar]
- Jackowski A, Schultz R. Foreshortened dorsal extension of the central sulcus in Williams syndrome. Cortex. 2005;41:282–290. doi: 10.1016/s0010-9452(08)70266-1. [DOI] [PubMed] [Google Scholar]
- Jaenisch R, Bird A. Epigenetic regulation of gene expression: how the genome integrates intrinsic and environmental signals. Nat Genet. 2003;33 (Suppl):245–254. doi: 10.1038/ng1089. [DOI] [PubMed] [Google Scholar]
- Johns JM, Lubin DA, Lieberman JA, Lauder JM. Developmental effects of prenatal cocaine exposure on 5-HT1A receptors in male and female rat offspring. Dev Neurosci. 2002;24:522–530. doi: 10.1159/000069363. [DOI] [PMC free article] [PubMed] [Google Scholar]
- Kennedy DN, Lange N, Makris N, Bates J, Meyer J, Caviness VS. Gyri of the human neocortex: an MRI-based analysis of volume and variance. Cereb Cortex. 1998;8:372–384. doi: 10.1093/cercor/8.4.372. [DOI] [PubMed] [Google Scholar]
- Khaitovich P, Muetzel B, She X, Lachmann M, Hellmann I, Dietzsch J, Steigele S, Do HH, Weiss G, Enard W, Heissig F, Arendt T, Nieselt-Struwe K, Eichler EE, Paabo S. Regional patterns of gene expression in human and chimpanzee brains. Genome Res. 2004;14:1462–1473. doi: 10.1101/gr.2538704. [DOI] [PMC free article] [PubMed] [Google Scholar]
- Kikinis R, Shenton ME, Gerig G, Hokama H, Haimson J, O’Donnell BF, Wible CG, McCarley RW, Jolesz FA. Temporal lobe sulco-gyral pattern anomalies in schizophrenia: an in vitro three-dimensional surface rendering study. Neurosci Lett. 1994;182:7–12. doi: 10.1016/0304-3940(94)90192-9. [DOI] [PubMed] [Google Scholar]
- Klyachko VA, Stevens CF. Connectivity optimization and the positioning of cortical areas. Proc Natl Acad Sci USA. 2003;100:7937–7941. doi: 10.1073/pnas.0932745100. [DOI] [PMC free article] [PubMed] [Google Scholar]
- Kostovic I, Rakic P. Developmental history of the transient subplate zone in the visual and somatosensory cortex of the macaque monkey and human brain. J Comp Neurol. 1990;297:441–470. doi: 10.1002/cne.902970309. [DOI] [PubMed] [Google Scholar]
- Kostovic I, Judas M, Rados M, Hrabac P. Laminar organization of the human fetal cerebrum revealed by histo-chemical markers and magnetic resonance imaging. Cereb Cortex. 2002;12:536–544. doi: 10.1093/cercor/12.5.536. [DOI] [PubMed] [Google Scholar]
- Krubitzer L, Kahn DM. Nature versus nurture revisited: an old idea with a new twist. Prog Neurobiol. 2003;70:33–52. doi: 10.1016/s0301-0082(03)00088-1. [DOI] [PubMed] [Google Scholar]
- Kulynych JJ, Vladar K, Fantre BD, Jones DW, Weinberger DR. Normal asymmetry of the planum temporale in patients with schizophrenia. Three dimensional cortical morphometry with mri. Br J Psychiatry. 1995;166:742–749. doi: 10.1192/bjp.166.6.742. [DOI] [PubMed] [Google Scholar]
- Le Provost JB, Bartres-Faz D, Paillere-Martinot ML, Artiges E, Pappata S, Recasens C, Perez-Gomez M, Bernardo M, Baeza I, Bayle F, Martinot JL. Paracingulate sulcus morphology in men with early-onset schizophrenia. Br J Psychiatry. 2003;182:228–232. doi: 10.1192/bjp.182.3.228. [DOI] [PubMed] [Google Scholar]
- Leonard CM, Voeller KS, Lombardino LJ, Morris MK, Alexander AW, Andersen HG, Garofalakis MA, Hynd GW, Honeyman JC, Mao J, Agee OF, Staab EV. Anomalous cerebral structure in dyslexia revealed with magnetic resonance imaging. Arch Neurol. 1993;50:461–469. doi: 10.1001/archneur.1993.00540050013008. [DOI] [PubMed] [Google Scholar]
- Leonard CM, Martinez P, Weintraub BD, Hauser P. Magnetic resonance imaging of cerebral anomalies in subjects with resistance to thyroid hormone. Am J Med Genet. 1995;60:238–243. doi: 10.1002/ajmg.1320600314. [DOI] [PubMed] [Google Scholar]
- Leonard CM, Lombardino LJ, Mercado LR, Browd SR, Breier JI, Agee OF. Cerebral asymmetry and cognitive development in children: a magnetic resonance imaging study. Psychol Sci. 1996;7:79–85. [Google Scholar]
- Leonard CM, Puranik C, Kuldau JM, Lombardino LJ. Normal variation in the frequency and location of human auditory cortex landmarks: Heschl’s gyrus: where is it? Cereb Cortex. 1998;8:397–406. doi: 10.1093/cercor/8.5.397. [DOI] [PubMed] [Google Scholar]
- Leonard CM, Kuldau JM, Breier JI, Zuffante PA, Gautier ER, Heron DC, Lavery EM, Packing J, Williams SA, DeBose CA. Cumulative effect of anatomical risk factors for schizophrenia: an MRI study. Biol Psychiatry. 1999;46:374–382. doi: 10.1016/s0006-3223(99)00052-9. [DOI] [PubMed] [Google Scholar]
- Leonard CM, Eckert MA, Lombardino LJ, Oakland T, Kranzler J, Mohr CM, King WM, Freeman AJ. Anatomical risk factors for phonological dyslexia. Cereb Cortex. 2001;11:148–157. doi: 10.1093/cercor/11.2.148. [DOI] [PubMed] [Google Scholar]
- Leonard CM, Lombardino LJ, Walsh K, Eckert MA, Mockler JL, Rowe LA, Williams S, DeBose CB. Anatomical risk factors that distinguish dyslexia from SLI predict reading skill in normal children. J Commun Disord. 2002;35:501–531. doi: 10.1016/s0021-9924(02)00120-x. [DOI] [PubMed] [Google Scholar]
- Levine D, Barnes PD. Cortical maturation in normal and abnormal fetuses as assessed with prenatal MR imaging. Radiology. 1999;210:751–758. doi: 10.1148/radiology.210.3.r99mr47751. [DOI] [PubMed] [Google Scholar]
- Levitt JG, Blanton RE, Smalley S, Thompson PM, Guthrie D, McCracken JT, Sadoun T, Heinichen L, Toga AW. Cortical sulcal maps in autism. Cereb Cortex. 2003;13:728–735. doi: 10.1093/cercor/13.7.728. [DOI] [PubMed] [Google Scholar]
- Liang JO, Etheridge A, Hantsoo L, Rubinstein AL, Nowak SJ, Izpisua Belmonte JC, Halpern ME. Asymmetric nodal signaling in the zebrafish diencephalon positions the pineal organ. Development. 2000;127:5101–5112. doi: 10.1242/dev.127.23.5101. [DOI] [PubMed] [Google Scholar]
- Lohmann G, von Cramon DY, Steinmetz H. Sulcal variability of twins. Cereb Cortex. 1999;9:754–763. doi: 10.1093/cercor/9.7.754. [DOI] [PubMed] [Google Scholar]
- MacLullich AM, Ferguson KJ, Deary IJ, Seckl JR, Starr JM, Wardlaw JM. Intracranial capacity and brain volumes are associated with cognition in healthy elderly men. Neurology. 2002;59:169–174. doi: 10.1212/wnl.59.2.169. [DOI] [PubMed] [Google Scholar]
- Mangin JF, Riviere D, Cachia A, Duchesnay E, Cointepas Y, Papadopoulos-Orfanos D, Collins DL, Evans AC, Regis J. Object-based morphometry of the cerebral cortex. IEEE Trans Med Imaging. 2004;23:968–982. doi: 10.1109/TMI.2004.831204. [DOI] [PubMed] [Google Scholar]
- Markowitsch HJ, Tulving E. Cognitive processes and cerebral cortical fundi: findings from positron-emission tomography studies. Proc Natl Acad Sci USA. 1994;91:10507–10511. doi: 10.1073/pnas.91.22.10507. [DOI] [PMC free article] [PubMed] [Google Scholar]
- McKusick VA, Amberger JS. The morbid anatomy of the human genome: chromosomal location of mutations causing disease (update 1 December 1993) J Med Genet. 1994;31:265–279. doi: 10.1136/jmg.31.4.265. [DOI] [PMC free article] [PubMed] [Google Scholar]
- Mitchell TN, Free SL, Williamson KA, Stevens JM, Churchill AJ, Hanson IM, Shorvon SD, Moore AT, van Heyningen V, Sisodiya SM. Polymicrogyria and absence of pineal gland due to PAX6 mutation. Ann Neurol. 2003;53:658–663. doi: 10.1002/ana.10576. [DOI] [PubMed] [Google Scholar]
- Molko N, Cachia A, Riviere D, Mangin JF, Bruandet M, Le Bihan D, Cohen L, Dehaene S. Functional and structural alterations of the intraparietal sulcus in a developmental dyscalculia of genetic origin. Neuron. 2003;40:847–858. doi: 10.1016/s0896-6273(03)00670-6. [DOI] [PubMed] [Google Scholar]
- Naidich TP, Valavanis AG, Kubik S. Anatomic relationships along the low-middle convexity: part I – normal specimens and magnetic resonance imaging. Neurosurgery. 1995;36:517–532. doi: 10.1227/00006123-199503000-00011. [DOI] [PubMed] [Google Scholar]
- Nakagawa Y, Johnson JE, O’Leary DD. Graded and areal expression patterns of regulatory genes and cadherins in embryonic neocortex independent of thalamocortical input. J Neurosci. 1999;19:10877–10885. doi: 10.1523/JNEUROSCI.19-24-10877.1999. [DOI] [PMC free article] [PubMed] [Google Scholar]
- Narr KL, Bilder RM, Kim S, Thompson PM, Szeszko P, Robinson D, Luders E, Toga AW. Abnormal gyral complexity in first-episode schizophrenia. Biol Psychiatry. 2004;55:859–867. doi: 10.1016/j.biopsych.2003.12.027. [DOI] [PubMed] [Google Scholar]
- O’Leary DD, Nakagawa Y. Patterning centers, regulatory genes and extrinsic mechanisms controlling arealization of the neocortex. Curr Opin Neurobiol. 2002;12:14–25. doi: 10.1016/s0959-4388(02)00285-4. [DOI] [PubMed] [Google Scholar]
- Ochiai T, Grimault S, Scavarda D, Roch G, Hori T, Riviere D, Mangin JF, Regis J. Sulcal pattern and morphology of the superior temporal sulcus. Neuroimage. 2004;22:706–719. doi: 10.1016/j.neuroimage.2004.01.023. [DOI] [PubMed] [Google Scholar]
- Ono M, Jubik S, Abernathy CD. Atlas of the Cerebral Sulci. Thieme; New York: 1990. [Google Scholar]
- Paus T, Tomaiuolo F, Otaky N, MacDonald D, Petrides M, Atlas J, Morris R, Evans AC. Human cingulate and paracingulate sulci; pattern, variability, asymmetry, and probabilistic map. Cereb Cortex. 1996;6:207–214. doi: 10.1093/cercor/6.2.207. [DOI] [PubMed] [Google Scholar]
- Pennington BF, Filipek PA, Lefly D, Chhabildas N, Kennedy DN, Simon JH, Filley CM, Galaburda A, DeFries JC. A twin MRI study of size variations in human brain. J Cogn Neurosci. 2000;12:223–232. doi: 10.1162/089892900561850. [DOI] [PubMed] [Google Scholar]
- Pezawas L, Verchinski BA, Mattay VS, Callicott JH, Kolachana BS, Straub RE, Egan MF, Meyer-Lindenberg A, Weinberger DR. The brain-derived neurotrophic factor val66met polymorphism and variation in human cortical morphology. J Neurosci. 2004;24:10099–10102. doi: 10.1523/JNEUROSCI.2680-04.2004. [DOI] [PMC free article] [PubMed] [Google Scholar]
- Rademacher J, Caviness VS, Steinmetz H, Galaburda AM. Topographical variation of the human primary cortices; implications for neuroimaging, brain mapping and neurobiology. Cereb Cortex. 1993;3:313–329. doi: 10.1093/cercor/3.4.313. [DOI] [PubMed] [Google Scholar]
- Rademacher J, Morosan P, Schormann T, Schleicher A, Werner C, Freund HJ, Zilles K. Probabilistic mapping and volume measurement of human primary auditory cortex. Neuroimage. 2001;13:669–683. doi: 10.1006/nimg.2000.0714. [DOI] [PubMed] [Google Scholar]
- Rakic P. Experimental manipulation of cerebral cortical areas in primates. Philos Trans R Soc Lond B Biol Sci. 1991;331:291–294. doi: 10.1098/rstb.1991.0019. [DOI] [PubMed] [Google Scholar]
- Raya A, Izpisua Belmonte JC. Unveiling the establishment of left-right asymmetry in the chick embryo. Mech Dev. 2004;121:1043–1054. doi: 10.1016/j.mod.2004.05.005. [DOI] [PubMed] [Google Scholar]
- Reiss AL, Abrams MT, Singer HS, Ross JL, Denckla MB. Brain development, gender and IQ in children. A volume tric imaging study. Brain. 1996;119:1763–1774. doi: 10.1093/brain/119.5.1763. [DOI] [PubMed] [Google Scholar]
- Reiss AL, Eckert MA, Rose FE, Karchemskiy A, Kesler S, Chang M, Reynolds MF, Kwon H, Galaburda A. An experiment of nature: brain anatomy parallels cognition and behavior in Williams syndrome. J Neurosci. 2004;24:5009–5015. doi: 10.1523/JNEUROSCI.5272-03.2004. [DOI] [PMC free article] [PubMed] [Google Scholar]
- Riviere D, Mangin JF, Papadopoulos-Orfanos D, Martinez JM, Frouin V, Regis J. Automatic recognition of cortical sulci of the human brain using a congregation of neural networks. Med Image Anal. 2002;6:77–92. doi: 10.1016/s1361-8415(02)00052-x. [DOI] [PubMed] [Google Scholar]
- Rogers L. Evolution of hemispheric specialization: advantages and disadvantages. Brain Lang. 2000;73:236–253. doi: 10.1006/brln.2000.2305. [DOI] [PubMed] [Google Scholar]
- Rumsey JM, Donahue BC, Brady DR, Nace K, Giedd JN, Andreason P. A magnetic resonance imaging study of planum temporale asymmetry in men with developmental dyslexia. Arch Neurol. 1997;54:1481–1489. doi: 10.1001/archneur.1997.00550240035010. [DOI] [PubMed] [Google Scholar]
- SAS. SAS/STAT guide for personal computers, Version 8. Cary NC: SAS Institute; 2002. [Google Scholar]
- Schoenemann PT, Budinger TF, Sarich VM, Wang WSY. Brain size does not predict general cognitive ability within families. Proc Natl Acad Sci USA. 2000;97:4922–4937. doi: 10.1073/pnas.97.9.4932. [DOI] [PMC free article] [PubMed] [Google Scholar]
- Sestan N, Rakic P, Donoghue MJ. Independent parcellation of the embryonic visual cortex and thalamus revealed by combinatorial Eph/ephrin gene expression. Curr Biol. 2001;11:39–43. doi: 10.1016/s0960-9822(00)00043-9. [DOI] [PubMed] [Google Scholar]
- Shapleske J, Rossell SL, Woodruff PW, David AS. The planum temporale: a systematic, quantitative review of its structural, functional and clinical significance. Brain Res Brain Res Rev. 1999;29:26–49. doi: 10.1016/s0165-0173(98)00047-2. [DOI] [PubMed] [Google Scholar]
- Smart IH, McSherry GM. Gyrus formation in the cerebral cortex in the ferret. I. Description of the external changes. J Anat. 1986a;146:141–152. [PMC free article] [PubMed] [Google Scholar]
- Smart IH, McSherry GM. Gyrus formation in the cerebral cortex of the ferret. II. Description of the internal histological changes. J Anat. 1986b;147:27–43. [PMC free article] [PubMed] [Google Scholar]
- Sowell ER, Thompson PM, Holmes CJ, Jernigan TL, Toga AW. In vivo evidence for post-adolescent brain maturation in frontal and striatal regions. Nat Neurosci. 1999;2:859–861. doi: 10.1038/13154. [DOI] [PubMed] [Google Scholar]
- Steinmetz H, Ebeling U, Huang Y, Kahn T. Sulcus topography of the parietal opercular region: an anatomic and MR study. Brain Lang. 1990;38:515–533. doi: 10.1016/0093-934x(90)90135-4. [DOI] [PubMed] [Google Scholar]
- Tan KL, Tan R, Tan SH, Tan AM. The twin transfusion syndrome. Clinical observations on 35 affected pairs. Clin Pediatr (Phila) 1979;18:111–114. doi: 10.1177/000992287901800206. [DOI] [PubMed] [Google Scholar]
- Thompson PM, Lee AD, Dutton RA, Geaga JA, Hayashi KM, Eckert MA, Bellugi U, Galaburda AM, Korenberg JR, Mills DL, Toga AW, Reiss AL. Abnormal cortical complexity and thickness profiles mapped in Williams syndrome. J Neurosci. 2005;25:4146–58. doi: 10.1523/JNEUROSCI.0165-05.2005. [DOI] [PMC free article] [PubMed] [Google Scholar]
- Van Essen DC. A tension-based theory of morphogenesis and compact wiring in the central nervous system. Nature. 1997;385:313–318. doi: 10.1038/385313a0. [DOI] [PubMed] [Google Scholar]
- Van Essen DC, Drury HA, Dickson J, Harwell J, Hanlon D, Anderson CH. An integrated software suite for surface-based analyses of cerebral cortex. J Am Med Inform Assoc. 2001;8:443–459. doi: 10.1136/jamia.2001.0080443. [DOI] [PMC free article] [PubMed] [Google Scholar]
- Watanabe H, Fujiyama A, Hattori M, et al. DNA sequence and comparative analysis of chimpanzee chromosome 22. Nature. 2004;429:382–388. doi: 10.1038/nature02564. [DOI] [PubMed] [Google Scholar]
- Watkins KE, Paus T, Lerch JP, Zijdenbos A, Collins DL, Neelin P, Taylor J, Worsley KJ, Evans AC. Structural asymmetries in the human brain: a voxel-based statistical analysis of 142 MRI scans. Cereb Cortex. 2001;11:868–877. doi: 10.1093/cercor/11.9.868. [DOI] [PubMed] [Google Scholar]
- Welker W. Why does cerebral cortex fissure and fold? A review of determinants of gyri and sulci. In: Jones EG, Peters A, editors. Cerebral Cortex. Plenum Publishing Co; New York, USA: 1990. pp. 3–136. [Google Scholar]
- West TG. In the Mind’s Eye. Prometheus Books; Amherst, NY: 1997. [Google Scholar]
- White T, Andreasen NC, Nopoulos P. Brain volumes and surface morphology in monozygotic twins. Cereb Cortex. 2002;12 :486–493. doi: 10.1093/cercor/12.5.486. [DOI] [PubMed] [Google Scholar]
- Wilke M, Kowatch RA, DelBello MP, Mills NP, Holland SK. Voxel-based morphometry in adolescents with bipolar disorder: first results. Psychiatry Res. 2004;131:57–69. doi: 10.1016/j.pscychresns.2004.01.004. [DOI] [PubMed] [Google Scholar]
- Willerman L, Schultz R, Rutledge JN, Bigler ED. In vivo brain size and intelligence. Intelligence. 1991;15:223–228. [Google Scholar]
- Witelson SF, Kigar D. Sylvian fissure morphology and asymmetry in men and women: bilateral differences in relation to handedness in men. J Comp Neurol. 1992;323:326–340. doi: 10.1002/cne.903230303. [DOI] [PubMed] [Google Scholar]
- Witelson SF, Kigar D, Harvey T. The exceptional brain of Albert Einstein. Lancet. 1999;353:2149–2153. doi: 10.1016/S0140-6736(98)10327-6. [DOI] [PubMed] [Google Scholar]
- Woodcock RW, Johnson RB. Woodcock–Johnson tests of achievement: standard and supplemental batteries. Allen, TX, DLM/Teaching Resources; 1989. [Google Scholar]
- Wright IC, Sham P, Murray RM, Weinberger DR, Bullmore ET. Genetic contributions to regional variability in human brain structure: methods and preliminary results. Neuroimage. 2002;17:256–271. doi: 10.1006/nimg.2002.1163. [DOI] [PubMed] [Google Scholar]
- Yousry TA, Schmid UD, Alkadhi H, Schmidt D, Peraud A, Buettner A, Winkler P. Localization of the motor hand area to a knob on the precentral gyrus: a new landmark. Brain. 1997;120:141–157. doi: 10.1093/brain/120.1.141. [DOI] [PubMed] [Google Scholar]
- Yucel M, Stuart GW, Maruff P, Wood SJ, Savage GR, Smith DJ, Crowe SF, Copolov DL, Velakoulis D, Pantelis C. Paracingulate morphologic differences in males with established schizophrenia: a magnetic resonance imaging morphometric study. Biol Psychiatry. 2002;52:15–23. doi: 10.1016/s0006-3223(02)01312-4. [DOI] [PubMed] [Google Scholar]
- Zilles K, Armstrong E, Schleicher A, Kretschmann HJ. The human pattern of gyrification. Anat Embryol. 1988;179:173–179. doi: 10.1007/BF00304699. [DOI] [PubMed] [Google Scholar]
- Zilles K, Palomero-Gallagher N, Grefkes C, Scheperjans F, Boy C, Amunts K, Schleicher A. Architectonics of the human cerebral cortex and transmitter receptor fingerprints: reconciling functional neuroanatomy and neurochemistry. Eur Neuropsychopharmacol. 2002;12:587–599. doi: 10.1016/s0924-977x(02)00108-6. [DOI] [PubMed] [Google Scholar]