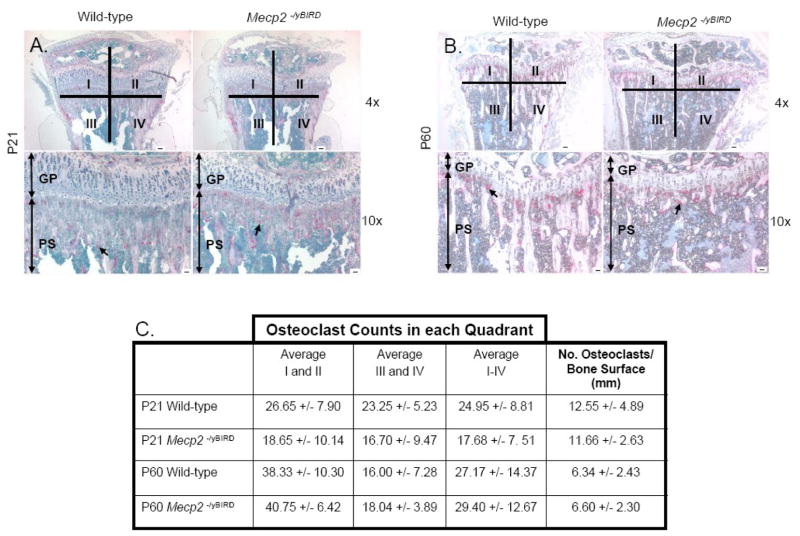
Figure 3. Similar number of osteoclasts quantified by TRAP staining.
A–B) In the decalcified paraffin-embedded tibia, osteoclasts were assessed from representative Tartrate Resistant Acid Phosphatase (TRAP) staining at the base of the growth plate and in the primary spongiosium of P21 and P60 wild-type and Mecp2 null mice (n≥4). Scale bars = 50μm. Black arrows indicate individual osteoclasts stained for TRAP. Quadrants I–IV that were used for osteoclast quantification are depicted. C) Quantitative measurements of osteoclasts in each quadrant (labeled I–IV) +/− SD, which were determined by TRAP cell counting, and the number of osteoclasts per bone surface (mm) was measured in the primary spongiosum within a constant ROI at both P21 and P60. Values are reported +/− SD.

