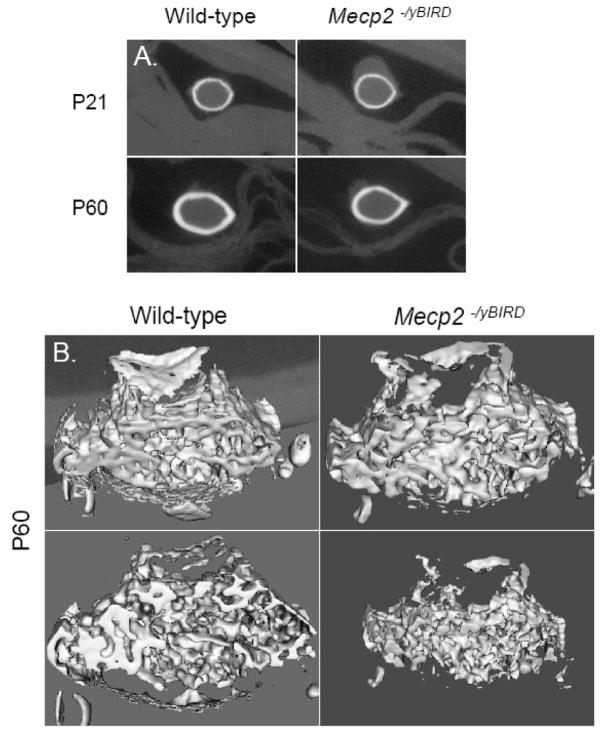
Figure 5. Differences observed in cortical and trabecular bone volumes between Mecp2−/yBIRD and wild-type femurs at P60.
A) A characteristic cross-sectional image of cortical bone at the femoral mid-diaphysis of P21 and P60 Mecp2 null and wild-type mice (n≥4). B) A representative three-dimensional view of the trabecular bone ROI used in the trabecular bone analysis of P60 samples (n≥4).

