

Abstract
Lead-in
The recent discovery of short, non-protein coding RNA molecules such as microRNAs (miRNAs) that can control gene expression has unveiled a whole new layer of complexity in the regulation of cell function. Since 2001, there has been a surge of interest in understanding the regulatory role of the hundreds to thousands of miRNAs expressed in both plants and animals. Significant progress in this area requires the development of quantitative bioanalytical methods for the rapid, multiplexed detection of all miRNAs present in a particular cell or tissue sample. In this Minireview, we discuss some of the latest methods for high-throughput miRNA profiling and the unique technological challenges that must be surmounted in this endeavor.
Keywords: Microarray, microRNA, miRNA, profiling, RNA silencing
I. Introduction
MicroRNAs (miRNAs) are a class of small (∼19-23 nucleotides), non-protein coding RNA molecules found in a broad range of plants, viruses and mammals. miRNAs are initially transcribed in the cell nucleus as long precursors (pri-miRNA) that are enzymatically processed into ∼70 nucleotide stem-loop structures (pre-miRNA), which are then exported into the cell cytoplasm. A second enzymatic processing step creates ∼22 nucleotide long mature miRNAs. These mature miRNAs can regulate gene expression following incorporation into an active RNA-induced silencing complex (RISC) where they interact with complementary sites on messenger RNA molecules resulting in translational repression and sometimes degradation of the target messenger RNA. While identification of the characteristic stem-loop structure of pre-miRNA is important for miRNA classification,[1] it is the expression level of the mature form that is of most interest to researchers investigating the biological function of miRNAs. There are a number of good reviews available on the mechanism of gene regulation and silencing by miRNAs.[2-6]
Although the first published description of a miRNA appeared more than a decade ago,[7] the importance of miRNA in gene regulation and cell function is just beginning to be understood. Studies in model organisms have shown miRNAs are involved in the regulation of many critical biological processes such as development, differentiation, metabolism and immunological response.[8-10] Recently, several research groups have established links between alterations in the expression levels of miRNAs and the initiation and development of human cancers.[11, 12] Comparative analyses between various malignant and normal tissue samples revealed characteristic patterns, where some miRNAs are overexpressed and others strongly repressed, that depended on the cancer type, disease stage and response to treatment.[12] Also, miRNA expression levels have been shown to play a controlling role in tumor growth rates suggesting possible new strategies for therapeutic treatment.[13] A key approach emerging in the investigation of the cellular roles of miRNAs is to profile the mature miRNA expression levels in specific tissue types at various developmental or disease stages.
For this reason, considerable effort has been devoted to the development of new methods for high throughput, multiplexed miRNA gene expression analysis. Currently, over 4500 miRNA sequences are listed in the miRNA Registry,[14, 15] including 475 human miRNAs. The total number of miRNAs in the human genome is not yet known, but estimates based on computational analyses range up to 1000.[2, 16] Recently, Tuschl and colleagues published one of the most comprehensive survey of mammalian miRNA expression patterns to date where they used a variety of experimental and computational methods to analyze miRNA expression profiles from 26 different organ systems and cell types of humans and rodents.[17] A timeline for miRNA discovery and detection is shown in Figure 1. The earliest attempts at systematically profiling miRNA expression were performed using a large number of single miRNA detection experiments such as northern blotting.[18] Although laborious and sample intensive, multiplexed northern blotting continues to be widely used as the standard method against which data from newer, more sensitive detection techniques are validated. Other multiplexed single miRNA approaches such as a modified invader assay[19] and quantitative RT-PCR of precursor miRNAs[20] or mature miRNAs[21, 22] are very sensitive and require low amounts of starting material. The successful application of real-time PCR is the result of innovative approaches towards the design of RT primers with high specificity towards individual mature miRNA species[22]; potentially, multiple primers could be combined in a single pool that would enable much higher-throughput profiling than currently possible with individual sample analyses.
Figure 1.

Timeline for microRNA discovery and detection. Initially, expression analysis was performed using northern blotting. Cloning and sequencing methods were later used to discover hundreds more miRNAs. The improved understanding of miRNA properties has enabled the development of computer algorithms that search for possible miRNA gene locations and targets. Experimental methods have progressed through several generations of microarray-based strategies with improved sensitivity and accuracy.
In recent years, these multiplexed single miRNA methods have been supplanted by the use of oligonucleotide microarray-based detection platforms as the most efficient approach to miRNA high-throughput profiling.[23-32] Complementary DNA (cDNA) microarrays for the multiplexed detection of messenger RNA molecules have proven to be extremely valuable for the study of gene expression in biological samples[33]; in a similar fashion, the population of known miRNA molecules should in principle be detected and characterized by creating DNA microarrays with hundreds to thousands of complementary probe sequences immobilized on a single chip surface. However, the short sequence length of miRNAs (19-23mers) means that the methods used to detect messenger RNA with oligonucleotide microarrays cannot be used. In addition, direct PCR amplification of mature miRNAs cannot be used, making the ultrasensitive detection of miRNA at femtomolar concentrations particularly difficult. In this Minireview, we focus on the latest developments that overcome the various difficulties in the application of microarray-based detection platforms for the profiling of miRNA expression in biological samples.
II. Challenges in miRNA profiling
Microarray-based techniques are particularly attractive for miRNA profiling since they are able to screen large numbers of miRNAs simultaneously. However, miRNAs present several unique challenges that make them more difficult to analyze than conventional oligonucleotide microarray targets such as genomic DNA and messenger RNA. The short length of mature miRNAs provides very little sequence to work with for the design of complementary microarray probes. The duplex melting temperature (Tm) of each known miRNA and its complementary DNA strand varies widely and normalization of the hybridization efficiency for each microarray element cannot be achieved by simply reducing the length of some of the probe sequences. The short lengths of miRNAs also make it difficult to reliably amplify or label each miRNA without introducing signal bias. Furthermore, miRNAs represent only a small fraction (∼0.01%) of the mass of a total RNA sample, with the relative expression levels between different miRNAs varying by as much as four orders of magnitude from a few copies to over 50,000 copies per cell.[2] It is also important to ensure that the non-active pri-miRNA and pre-miRNA precursor species do not contribute to the array detection signal.
Efforts to improve the accuracy of miRNA profiling measurements have primarily focused on developing new strategies for (i) complementary probe design and (ii) miRNA labeling. Most miRNA studies reported to date have employed DNA capture probes resulting in conditions more reliable for comparing expression levels of the same miRNAs in different samples than actually for comparing the relative levels of different miRNAs in the same sample. To equalize the hybridization conditions without compromising specificity, several researchers have proposed incorporating modified nucleotides into the probe sequences[31, 32] or extending the length of the probe sequence-miRNA duplex interaction with additional base pairs introduced upon miRNA labeling.[34] Recently Castoldi et al[31] demonstrated the application of locked nucleic acids (LNAs) in place of conventional DNA probes. LNAs are commercially available nucleic acid analogs containing one or more modified nucleotide monomers where the ribose moiety is modified with an extra bridge connecting the 2′-O and 4′-C atoms. By controlling the number and location of modified nucleotides, the thermostability of each miRNA-LNA duplex can be significantly increased as well as making it possible to design a complete set of Tm-normalized probes that results in more accurate profiling. The increased binding affinity of LNA probes not only yields a ten-fold increase in sensitivity compared to unmodified DNA probes but also improves hybridization discrimination among closely related miRNAs.[31, 35]
Another challenge in miRNA profiling is that conventional methods used to amplify or label longer RNA and DNA targets prior to detecting a microarray hybridization signal cannot be directly applied. In order to produce an accurate miRNA profile it is extremely important that the labeling method quantitatively reflects the abundance of different miRNAs present in the sample while maintaining the biological integrity and hybridization performance of the target miRNA. The specificity of the labeling assay towards mature miRNAs can also be improved through the use of commercially available miRNA enrichment kits (e.g. Ambion, Qiagen), which removes the precursor miRNAs and other larger RNA species. In the following sections we discuss a variety of chemical and enzymatic methods designed (a summary of which is shown in Table I) to directly attach a label or tag allowing sensitive detection. For comparison with labeling methods, examples of detection methods that do not involve miRNA modification prior to hybridization are also described.
Table I.
Summary of methods for miRNA expression profiling
| Method | Notes | Ref. | |
|---|---|---|---|
| DIRECT DETECTION | Northern blotting | Hybridization of complementary 32P- or digoxigenin-labeled oligo probes after gel separation. | [18, 35, 52] |
| Single molecule fluorescence | Dual hybridization of two fluorescent-labeled LNA probes in a sandwich assay format. | [39] | |
| Signal-amplifying ribozymes | Hybridization of miRNA to ribozyme or molecular beacon induces separation of fluorophore and quencher thus increasing signal. | [53] | |
| In-situ hybridization | In-situ tissue and cell analysis: hybridization of fluorescent-labeled complementary probes containing chemically modified nucleotides (e.g. LNA’s). | [36-38] | |
| SOLUTION BASED CHEMICAL MODIFICATION | Fluorescence imaging | Coordination of Pt-fluorophore complex to G base residues. (Ulysis™ Alexa Fluor) | [23] |
| Alkylation of N heteroatoms on any nucleotide base. (Label IT™ reagent) | [43] | ||
| 3′ end labeling: (i) NaIO4 and (ii) formation of amine derivative which is reacted with NHS-Cy5. | [32] | ||
| 3′ end labeling: (i) NaIO4, (ii) Biotin hydrazide and (iii) binding of streptavidin-quantum dot conjugates to hybridized miRNA. | [45] | ||
| Electrochemistry | 3′ end labeling: (i) NaIO4 and (ii) isoniazid-conjugated OsO2 nanoparticles. | [46] | |
| SOLUTION BASED ENZYMATIC MODIFICATION | Cloning | Large-scale cDNA cloning and sequencing. | [54] |
| Fluorescence imaging | T4 RNA ligase reaction covalently attaching labeled nucleotides directly to the 3′-end of miRNA. | [24, 31, 34, 55] | |
| (i) Poly(A) polymerase reaction to create a 3′ tail containing amine modified nucleotides that (ii) react with NHS-ester dye. (mirVana™ labeling kit) | [47] | ||
| (i) Poly(A) polymerase tailing, (ii) T4 DNA ligation of tag DNA and (iii) hybridization of labeled DNA dendrimer. (Ncode™ labeling kit) | [29, 48] | ||
| (i) T4 RNA ligation of 3′ and 5′ adaptor oligos and (ii) RT-PCR incorporating labels. | [27, 28, 30] | ||
| Invader assay | Binding of overlapping two hairpin probes to miRNA forming a site recognized for cleavage and subsequent fluorimetric analysis. | [19] | |
| Quantitative RT-PCR | Various strategies for creating primers that target individual precursor or mature miRNA species. | [20-22] | |
| Rolling circle amplification | miRNA detection protocol based on padlock probes and enzymatic amplification. | [56] | |
| Fluorescent bead cytometry | (i) Ligation of 3′ and 5′ adaptor oligos to miRNA and (ii) RT-PCR with biotin-labeled primer (iii) bead assay. | [27, 57] | |
| SURFACE BASED ENZYMATIC MODIFICATION | SPR imaging | (i) Poly(A) polymerase 3′ extension of hybridized-adsorbed miRNA and (ii) complementary hybridization of T30-coated gold nanoparticles. | [49] |
| RAKE assay (fluorescence imaging) | (i) Klenow enzyme extension of hybridized-adsorbed miRNA with biotin-conjugated nucleotides and (ii) detection with streptavidin-dye conjugate binding. | [50, 51] |
III. Direct Detection of miRNA
Despite the challenges described in the previous section, there are a handful of reports demonstrating direct multiplexed detection of miRNA with sensitivities comparable to or greater than northern blotting. By direct, we mean here the detection of miRNA without the need for chemical or enzymatic modification of the target molecules prior to analysis. Another very active area of non-multiplexed direct detection that we will not discuss in this review is the area of in-situ hybridization, where fluorescently labeled complementary locked nucleic acid (LNA) probes are used to directly visualize the specific location and evolution of a mature miRNA target within different organisms and tissue sections.[36-38]
A number of direct detection methods have been developed for miRNA profiling applications, and are listed in Table I. In this section we describe two examples of direct multiplexed miRNA detection: (i) a solution-based sandwich assay format where the target miRNA simultaneously hybridizes to a pair of spectrally distinguishable fluorescent oligonucleotide probes, which are each complementary to one half of the target miRNA, and (ii) a surface-based assay directly measuring sequence specific adsorption (termed “hybridization adsorption”) onto complementary probe array elements created on the surface of a supported gold thin film.
Solution-based direct multiplexed detection of miRNA
A dual-probe hybridization scheme capable of directly detecting single miRNA molecules in solution was recently demonstrated by Neely et al.[39] Each probe is labeled with a different fluorescence tag and specifically binds to one half of the target miRNA (see Fig. 2). This measurement was only made possible through the use of LNA probes, whose higher binding affinity to miRNA compared with conventional DNA enabled the use of short 10mer probe lengths. Following hybridization, the sample solution is flown through a microfluidic capillary where multiple lasers at different wavelengths excite the fluorescent probes that pass through a very small focused volume. Individual miRNA molecules are easily identified by a coincident burst of photons at different colors from both hybridized fluorophore probes, with the number of miRNAs counted over a given time period rate used to determine the sample concentration. As a demonstration, the expression levels of 45 human miRNAs within 16 different tissues were quantified with a detection limit of 500 fM. High specificity was also achieved with the LNA probes enabling miRNAs differing by only a single nucleotide to be clearly distinguished. Only one miRNA is targeted in each sample volume, however a single assay can be performed with as little as 50-100 ng of total RNA. This is an order of magnitude lower than standard microarray methods, which usually involve additional miRNA labeling/amplification preparative steps.
Figure 2.

Single-molecule direct detection of miRNA. Step 1: Two spectrally distinct fluorescent LNA probes (F1-LNA and F2-LNA) are hybridized in solution to each target miRNA in a sandwich assay format to form the duplex labeled F1-LNA + F2-LNA)/miRNA. Step 2: Complementary DNA probes modified with a quencher molecule (Q-DNA1 and Q-DNA2) are then added which hybridize to the remaining “free” LNA probes forming two different duplexes (Q-DNA2/F2-LNA and Q-DNA1/F1-LNA). Step 3: The sample solution is subsequently flown through a microfluidic capillary within which light from lasers operating at the F1 and F2 exciting wavelengths is focused closely together. A signal corresponding to the target miRNA is observed as two coincident spikes when both probes F1 and F2 are excited simultaneously. Adapted from reference [39].
Surface-based direct multiplexed detection of miRNA
The detection and identification of short, unlabeled RNA and DNA oligonucleotides can also be achieved in a microarray format using surface plasmon resonance imaging (SPRI). This is a surface-sensitive optical technique that has been widely applied to the real-time monitoring of various bioaffinity interactions (e.g. DNA-DNA, RNA-DNA, peptide-protein) at biopolymer layers formed on a thin gold film.[40] Although the SPRI detection limit for DNA and RNA analysis lies in the low nanomolar range,[41, 42] which is not as sensitive as fluorescence microarray measurements, SPRI analysis does provide valuable insights into the kinetics and thermodynamics limitations of the miRNA surface hybridization adsorption reaction.
An example of the detection of RNA by hybridization adsorption onto DNA microarrays with SPRI is shown in Figure 3. A two-component single stranded DNA (ssDNA) microarray is exposed to target RNA, with only the perfectly matched array elements forming duplexes via hybridization adsorption (see Fig. 3 inset). A positive increase in percent reflectivity (Δ%R) due to selective hybridization adsorption is observed. If the increase in SPRI signal upon hybridization adsorption remains below 10%, then it is directly proportional to the relative surface coverage (θ) of complementary RNA. The binding affinity between RNA and the surface immobilized DNA probe can be quantitatively evaluated by creating a Langmuir isotherm plot such as that shown in Figure 3. θ is related to the bulk RNA concentration (C) by the Langmuir adsorption isotherm:
| (1) |
where KAds is the Langmuir adsorption coefficient. For RNA hybridization adsorption onto a DNA microarray, KAds is around ∼107 M-1. This value can be increased by approximately by a factor of ten by replacing the ssDNA probes with LNAs that bind more strongly to the RNA target, which improves both the sensitivity and specificity of the surface hybridization measurement.[31]
Figure 3.
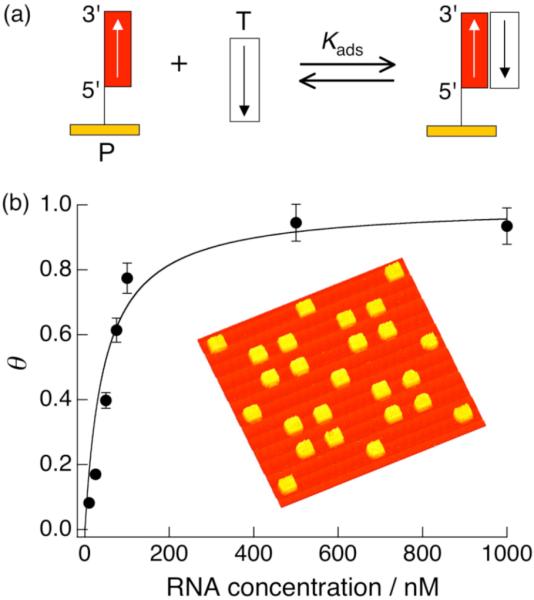
(a) Schematic of target (T) single-stranded RNA hybridization adsorption onto a probe (P) ssDNA microarray element. (b) A representative plot of relative surface coverage as a function of target RNA concentration. The solid line is a Langmuir isotherm fit to the data, from which a value of KAds = 2 × 10⁷ M-1 was determined. The inset is a representative SPRI difference image obtained by subtracting images acquired before and after sequence-specific RNA hybridization adsorption on a two-component DNA microarray.
The SPRI data in Figure 3 show that at biologically relevant concentrations (pM and lower) the equilibrium fractional surface coverage of miRNA on each microarray element will be extremely small. For example, given a KAds of ∼108 M-1 and a bulk miRNA concentration of 10 fM, the equilibrium fractional surface coverage of miRNA is only 10-6. A good approximation of the surface density of LNA probes on a microarray element is 1 × 10¹² molecules/cm2, so that the surface density of LNA/miRNA duplexes is 106 molecules/cm2 at 10 fM. For a 500 μm array element used in SPRI, this corresponds to 2500 miRNA molecules; for a 50 μm array element size typically used in fluorescence imaging measurements, this surface density corresponds to only 25 miRNA molecules! This demonstrates the difficulty in detecting very low concentrations and the importance of designing probe sequences that have a high binding affinity towards the target miRNA.
A second reason that it is difficult to detect low miRNA concentrations with microarrays is the kinetics of hybridization adsorption. The hybridization adsorption rate (ka) for miRNA is approximately 104M-1s-1. Since the velocity of the adsorption reaction can be described by kaC , the time required to reach an equilibrium surface coverage increases significantly as the concentration is lowered. In addition, there is also a diffusional contribution that becomes significant at lower concentrations due to the time required for the miRNA molecules to reach the surface array elements. For 10 fM detection, a minimum reaction time of ∼4h is necessary to reach a steady-state coverage provided a circulating flow cell is used to minimize diffusion effects. At even lower concentrations and if a circulating flow cell is not used then longer reaction times will be required.
Both the Langmuir adsorption equilibrium arguments and adsorption kinetics clearly demonstrate that the application of microarray based techniques to perform miRNA profiling require the use of an amplification technology. A variety of chemical and enzymatic assays designed to enhance the sensitivity of both fluorescence and SPRI based microarray measurements are discussed in the following sections.
IV. Chemical modification strategies for multiplexed miRNA detection
To achieve higher sensitivity in a miRNA assay, it is necessary to chemically or enzymatically modify the target miRNA species prior to detection. A list of the chemical modification strategies that have been used to date is given in Table I. The simplest method of chemical modification is to attach a fluorescent label directly onto the miRNA molecules. Figure 4 outlines three exemplary strategies that have recently been adapted for fluorescence-based miRNA detection with chemical labeling.
Figure 4.

Chemical strategies for miRNA labeling. (a) Reaction of a platinum fluorophore complex (Ulysis™ Alexa Fluor reagent) to form a coordinative bond at the N7 position of any guanine (G) base. (b) An alkylation reaction (Label IT™ reagent) which targets any reactive N heteroatom on the miRNA with some preference for the guanine (G), cytosine (C) and adenine (A) bases. (c) A two-step end labeling reaction where the 2′, 3′-diol on the ribose ring at the 3′-terminus of the miRNA is first oxidized to a dialdehyde by sodium periodate followed by a condensation reaction with a hydrazide derivative linked to a labeling moiety.
The use of a platinum dye complex that forms a stable adduct at the N7 position of any guanine base in the miRNA sequence (see Fig. 4a) was first demonstrated by Babak et al.[23] The cisplatin derivative (Ulysis™ Alexa Fluor, Molecular Probes) is covalently bound to a fluorophore with only one reactive coordination site available. Upon incubation in solution with miRNAs at an elevated temperature, a ligand exchange reaction takes place with a labile nitrate at the reactive site replaced by a coordinative bond firmly coupling the fluorophore to the miRNA target. This approach assumes that all miRNAs contain at least one G residue.
A second approach which also targets nucleotide bases in the miRNA sequence is shown in Figure 4(b). In this case an aromatic nitrogen mustard reactive group linked to a fluorophore (Label IT™, Mirus Bio) directly alkylates any reactive N heteroatom in the miRNA with possible preference for N7 of guanine, N3 of adenine and N3 of cytosine.[43] Because this labeling reaction is based on the modification of nucleotide bases, care must be taken to remove excess reagent to prevent spurious labeling of oligonucleotide probes on the microarray surface. The major drawback of both nucleotide modification strategies is that they lack specificity for miRNA as compared to other RNA or DNA species in the sample. Further specificity towards small RNA species can be obtained by size fractionating to create a sample enriched in mature miRNA prior to labeling. In addition, there is a possibility that the binding affinity between modified miRNA and oligonucleotide probes may be partially impaired.
A third approach that has better control over the total number of labels attached to each miRNA, and which was developed originally for labeling mRNA by Weiler et al.[32, 44], is shown schematically in Figure 4(c). Here, the 2′, 3′-diol on the ribose ring at the 3′-terminus of the miRNA is first oxidized to a dialdehyde by sodium periodate. A condensation reaction with a hydrazide derivative can then be performed to covalently couple a single label onto the 3′ end of each miRNA. Since this approach requires an intact 2′, 3′-diol, possible background signal contributions from contaminant RNA bearing 3′-phosphate groups or DNA can be minimized. In addition to dye labeling[32] this reaction has also been used to biotinylate miRNA samples prior to microarray analysis.[45] The hybridized miRNA was then detected using fluorescence measurements of streptavidin-quantum dot conjugates which bind to the miRNA through the streptavidin-biotin interaction. The reported detection limit of ∼40 pM (0.4 fmol) was similar to a comparable approach by the same authors based on colorimetric measurements using streptavidin-modified gold nanoparticles.[45] A further example of this chemical labeling method is the direct attachment of OsO2 nanoparticles to miRNAs hybridized onto a modified electrode surface.[46] Although limited to a single miRNA per electrode, amperometric measurements involving the OsO2 electrocatalyzed oxidation of hydrazine could be applied to detect 80 fM concentrations.
V. Solution Enzymatic Modification Strategies
The most successful miRNA modification strategies to date for multiplexed miRNA detection employ enzymatic modification reactions, either in solution or directly on the microarray surface. Nucleic acid enzymes are often used in biotechnological applications as highly efficient tools for the amplification and site-selective manipulation of genomic DNA and RNA. One of the most widely used essential enzymatic reactions for miRNA modification is the lengthening of the target miRNA by catalyzing the addition of nucleotides to either the 3′ or 5′ ends; these extension reactions enable conventional techniques such as cloning and PCR-amplification to be employed for miRNA discovery and detection.
Several solution-based enzymatic assays have been proposed for high-throughput miRNA proling using microarrays. A common approach used by several researchers is to ligate adapter oligonucleotide sequences to both the 3′ and 5′ ends of miRNA followed by reverse transcriptase (RT) to create a complementary DNA (cDNA) library. Further PCR amplification incorporating fluorescent probes is then performed prior to microarray analysis.[27, 28, 30] Although highly sensitive, this indirect approach to miRNA profiling requires extensive sample manipulation. We describe here three more convenient enzymatic assays designed to directly attach one or more labels to each target miRNA in solution.
One of the most powerful enzymatic modification reactions applied to miRNA analysis is the use of T4 RNA ligase to covalently couple the 5′-end of a polynucleotide sequence of any desired length to the 3′-OH end of miRNA. This reaction was first applied by Thomson et al[24] to directly attach a fluorophore-conjugated dinucleotide to the miRNA pool prior to microarray hybridization. Figure 5(a) shows a schematic of the reaction indicating the position of the fluorophore, which blocks the 3′-end ensuring that only one label is attached to each miRNA. Recently, the enzyme reaction conditions were further optimized by Wang et al[34] to minimize (but not completely remove) the effect of variations in miRNA sequences and secondary structure on the ligation efficiency, and claimed a detection limit of ∼ 5 fM (0.2 amol in 45 μl) by also using an improved probe design strategy.
Figure 5.

Enzymatic strategies for miRNA labeling. (a) Ligation of a fluorophore-conjugated dinucleotide to the 3′-OH end of miRNA using T4 RNA ligase. (b) E. Coli poly(A) polymerase is used to catalyze the multiple addition of nucleotides a create a poly(U) tail at the 3′-end of each miRNA. A fraction of the added nucleotides are amine-modified which are then covalently coupled to a fluorophore containing a N-Hydroxysuccinimide (NHS) ester reactive group. (c) The enzyme catalyzed formation of a 3′ poly(A) tail is followed by a second enzymatic reaction where a DNA tag sequence is ligated to the 3′-end of the tail. The tagged miRNA is then hybridized to a microarray and subsequently detected via a DNA-modified dendrimer that is complementary to the tag sequence and which also incorporates up to several hundred fluorophores for amplified detection.
Further enhancements in sensitivity have been investigated by instead using combined tailing/labeling procedures such as that shown in Figure 5(b) and (c) which allow the attachment of multiple signaling species. The mirVana™ miRNA labeling kit method (Ambion) shown in Figure 5(b) appends a 20-50 polynucleotide to each miRNA using the enzyme poly(A) polymerase to create a 3′ tail that is a propriety mixture of standard and amine-modified bases.[47] The amine-labeled miRNAs are then covalently coupled to an amine-reactive dye to produce a multiply labeled miRNA sample which is subsequently introduced to the microarray and detected by fluorescence imaging. The NCode™ (Invitrogen) enzymatic method described in Figure 5(c) also entails the creation of a 3′ poly(A) tail. A second enzymatic reaction using T4 DNA ligase is then used to covalently couple a unique oligonucleotide tag sequence to the 3′-end of the poly(A) tail. Following clean-up of the RNA sample solution and hybridization to the microarray, each tagged miRNA is detected by hybridizing to a single sequence specific dendrimer that contains as many as 900 fluorophores, thus greatly amplifying the detection signal. Recently, this method was further extended to achieve greater sensitivity using a combination of reverse transcriptase with a poly(dT) primer and T7 polymerase reactions to comparably amplify all miRNA species prior to dendrimer labeling detection.[48]
VI. Surface-based Enzymatic Modification Strategies
There are several significant advantages if enzymatic modification strategies used to specifically label miRNA can be implemented directly on a microarray surface instead of in solution. One major advantage of a surface-based approach is that there is no sample manipulation before miRNA hybridization to the microarray. This avoids possible biases that could be introduced due to differential labeling between various miRNAs or sample loss during the labeling reaction and clean-up. Furthermore, multi-step reactions are easier to perform sequentially on a surface than in solution and only miRNAs hybridized to the surface are modified whereas in solution all RNA species are potentially labeled. Note that surface labeling will not work for the first two chemical reactions highlighted in Section IV, which are not specific to RNA and will also label the oligonucleotide probes attached to the microarray surface. In principle, the sodium periodate chemical reaction in Section IV should be amenable to the specific labeling of surface attached miRNAs but has not yet been demonstrated in a microarray format. In this section we describe two recent examples of miRNA detection based on surface enzyme reactions.
Recently, we developed a novel approach that combines both a surface poly(A) polymerase reaction and DNA-modified nanoparticle enhancement for the ultrasensitive microarray detection of miRNAs using SPR imaging.[49] As outlined in Figure 6, target miRNA is first hybridized from solution onto a single stranded LNA microarray (step i). The surface-bound miRNA is then polyadenylated with poly(A) polymerase (step ii). The SPRI response is then further amplified by the hybridization adsorption of T30-coated nanoparticles onto the poly(A) tails (step iii).
Figure 6.

Detection of microRNAs using a combination of surface polyadenylation and nanoparticle-amplified SPRI. Step (i) - hybridization adsorption of miRNA onto a complementary LNA array element. Step (ii) - poly(A) tail addition at the 3′-end of surface bound miRNAs using poly(A) polymerase. Step (iii) - hybridization adsorption of T30-coated Au nanoparticles to poly(A) tails. Reprinted with permission from reference [49].
The surface polyadenylation-nanoparticle amplification methodology was demonstrated with the multiplexed detection of three different miRNAs present in a total RNA sample extracted from mouse liver tissue. A four-component microarray was constructed containing three LNA probes designed to bind to the known miRNA sequences, miR-16, miR-122b, and miR-23b, with a DNA probe used as a negative control.[49] A 250 ng RNA sample in a volume of 500 μl was circulated over the microarray surface repeatedly for 4 hours followed by surface amplification. Analysis of the resulting SPRI difference image (Figure 7a) and corresponding line profile (Figure 7c) clearly shows the miR-122b sequence as the most abundant. Having already calibrated the SPRI response signal using synthetic analogues of the target sequences it was possible to estimate miRNA concentrations of 20 fM, 50 fM and 2 pM for miR-16, miR-23b and miR-122b, respectively. Further verification of the concentration of the least abundant miRNA (miR-16) was obtained by repeating the measurement with the addition of 100 fM synthetic miR-16. As shown in Figure 7(b) and 7(c), a 5-fold increase in SPRI signal was observed only at the miR-16 probe array elements. The detection limit of this amplified SPRI methodology was found to be 5 attomoles (10 fM in 500 μl), which is at least 50 times more sensitive than the solution based enzymatic tailing/labeling fluorescent measurements mentioned in the previous section.
Figure 7.

Quantitative analysis of miRNAs from 250 ng of mouse liver total RNA using polyadenylation-nanoparticle amplified SPRI measurements. (a) SPRI difference image obtained by subtracting images acquired before and after the nanoparticle amplification step. (b) An SPRI difference image obtained from a separate chip using the same total RNA concentration as the top image plus the addition of 100 fM synthetic miR-16. (c) Comparison of line profiles taken from both SPRI difference images with the solid and dashed lines corresponding to top and bottom images respectively. (d) Schematic of the four-component LNA probe microarray and the line profile location. Reprinted with permission from reference [49].
Another example of surface-based enzymatic amplification reaction for miRNA detection is the RNA-primed array-based Klenow enzyme assay (RAKE) approach.[25, 50, 51] This assay is based on the ability of a miRNA molecule to act as a primer for a Klenow polymerase extension reaction when the miRNA is fully base paired with a ssDNA probe. Providing there is no mismatch, the 3′-end of the miRNA is extended with biotin-conjugated nucleotides, the number of which depends on the DNA probe template. Streptavidin-conjugated fluorophores are then used to visualize and quantify the microarray elements containing hybridized and Klenow-extended miRNAs. The sensitivity of the RAKE assay was found to be comparable to other fluorescent-based microarray assays involving the direct attachment of a single label.[24] However, RAKE avoids sample manipulation procedures associated with labeling or amplification prior to hybridization and is also highly specific with superior discrimination between miRNAs that differ at their 3′-ends.
VII. Summary and Outlook
There is no doubt that the demand for rapid, high quality miRNA profiling will continue to increase exponentially as the complex roles of miRNAs in regulatory networks and human diseases become more understood. The ideal miRNA profiling technique will be easy to multiplex, have negligible sequence bias towards particular miRNAs, involve simple experimental protocols with minimum sample manipulation prior to hybridization, and have a large measurement dynamic range from sub-femtomolar to nanomolar concentrations. While this ultimate technique does not yet exist, recent developments utilizing microarray-based detection platforms in combination with various chemical and enzymatic miRNA-labeling strategies are very close to achieving this idealized goal. To date, most of the miRNA labeling reactions are performed in solution and require one or more reaction steps; more recent methods employ surface enzymatic reactions that can be easily cleaned up since the selective labeling of miRNAs occurs after hybridization adsorption onto the probe microarray surface. In addition, the new surface-based labeling strategies will most likely employ either multiple fluorophores or multiple nanoparticles with a single miRNA; however, some care will have to be taken since the signal levels of these detection methods are less controlled and quantifiable. In general, we expect that in the not too distant future a variety of new quantitative, ultrasensitive approaches for miRNA expression profiling using microarrays will amply fill the needs of researchers interested in the study of miRNA in biological systems.
Acknowledgements
We gratefully acknowledge funding support from the National Institutes of Health (2RO1 GM059622-04), the National Science Foundation (CHE-0551935) and the DARPA Micro/Nano Fluidics Fundamentals Focus (MF3) Center at UCI.
References
- [1].Ambros V, Bartel B, Bartel DP, Burge CB, Carrington JC, Chen X, Dreyfuss G, Eddy SR, Griffiths-Jones S, Marshall M, Matzke M, Ruvkun G, Tuschl T. RNA. 2003;9:277. doi: 10.1261/rna.2183803. [DOI] [PMC free article] [PubMed] [Google Scholar]
- [2].Bartel D. Cell. 2004;116:281. doi: 10.1016/s0092-8674(04)00045-5. [DOI] [PubMed] [Google Scholar]
- [3].He L, Hannon GJ. Nat. Rev. Genetics. 2004;5:522. doi: 10.1038/nrg1379. [DOI] [PubMed] [Google Scholar]
- [4].Kim VN. Nat. Rev. Mol. Cell Biol. 2005;6:376. doi: 10.1038/nrm1644. [DOI] [PubMed] [Google Scholar]
- [5].Pasquinelli AE, Hunter S, Bracht J. Curr. Opin. Genet. Dev. 2005;15:200. doi: 10.1016/j.gde.2005.01.002. [DOI] [PubMed] [Google Scholar]
- [6].Arenz C. Angew. Chem. 2006;118:5170. [Google Scholar]; Angew. Chem. Int. Ed. Engl. 2006;45:5048. [Google Scholar]
- [7].Lee RC, Feinbaum RL, Ambros V. Cell. 1993;75:843. doi: 10.1016/0092-8674(93)90529-y. [DOI] [PubMed] [Google Scholar]
- [8].Ambros V. Nature. 2004;431:350. doi: 10.1038/nature02871. [DOI] [PubMed] [Google Scholar]
- [9].Carthew RW. Curr. Opin. Genet. Dev. 2006;16:203. doi: 10.1016/j.gde.2006.02.012. [DOI] [PubMed] [Google Scholar]
- [10].Rodriguez A, Vigorito E, Clare S, Warren MV, Couttet P, Soond DR, Dongen SV, Grocock RJ, Das PP, Miska EA, Vetrie D, Okkenhaug K, Enright AJ, Dougan G, Turner M, Bradley A. Science. 2007;316:608. doi: 10.1126/science.1139253. [DOI] [PMC free article] [PubMed] [Google Scholar]
- [11].Esquela-Kerscher A, Slack FJ. Nat. Rev. Cancer. 2006;6:259. doi: 10.1038/nrc1840. [DOI] [PubMed] [Google Scholar]
- [12].Calin GA, Croce CM. Nat. Rev. Cancer. 2006;6:857. doi: 10.1038/nrc1997. [DOI] [PubMed] [Google Scholar]
- [13].Kumar MS, Lu J, Mercer KL, Golub TR, Jacks T. Nat. Genet. 2007;39:673. doi: 10.1038/ng2003. [DOI] [PubMed] [Google Scholar]
- [14].Griffiths-Jones S. Nucl. Acids Res. 2004;32:D109. doi: 10.1093/nar/gkh023. [DOI] [PMC free article] [PubMed] [Google Scholar]
- [15].Griffiths-Jones S, Grocock RJ, Dongen SV, Bateman A, Enright AJ. Nucl. Acids Res. 2006;34:D140. doi: 10.1093/nar/gkj112. [DOI] [PMC free article] [PubMed] [Google Scholar]
- [16].Bentwich I, Avniel A, Karov Y, Aharonov R, Gilad S, Barad O, Barzilai A, Einat P, Einav U, Meiri E, Sharon E, Spector Y, Bentwich Z. Nat. Genet. 2005;37:766. doi: 10.1038/ng1590. [DOI] [PubMed] [Google Scholar]
- [17].Landgraf P, Rusu M, Sheridan R, Sewer A, Iovino N, Aravin A, Pfeffer S, Rice A, Kamphorst AO, Landthaler M, Lin C, Socci ND, Hermida L, Fulci V, Chiaretti S, Foa R, Schliwka J, Fuchs U, Novosel A, Muller R-U, Schermer B, Bissels U, Inman J, Phan Q, Chien M, Weir DB, Choksi R, De Vita G, Frezzetti D, Trompeter H-I, Hornung V, Teng G, Hartmann G, Palkovits M, Di Lauro R, Wernet P, Macino G, Rogler CE, Nagle JW, Ju J, Papavasiliou FN, Benzing T, Lichter P, Tam W, Brownstein MJ, Bosio A, Borkhardt A, Russo JJ, Sander C, Zavolan M, Tuschl T. Cell. 2007;129:1401. doi: 10.1016/j.cell.2007.04.040. [DOI] [PMC free article] [PubMed] [Google Scholar]
- [18].Lagos-Quintana M, Rauhut R, Lendeckel W, Tuschl T. Science. 2001;294:853. doi: 10.1126/science.1064921. [DOI] [PubMed] [Google Scholar]
- [19].Allawi HT, Dahlberg JE, Olson S, Lund E, Olson M, Ma W-P, Takova T, Neri BP, Lyamichev VI. RNA. 2004;10:1153. doi: 10.1261/rna.5250604. [DOI] [PMC free article] [PubMed] [Google Scholar]
- [20].Schmittgen TD, Jiang J, Liu Q, Yang L. Nucl. Acids Res. 2004;32:e43. doi: 10.1093/nar/gnh040. [DOI] [PMC free article] [PubMed] [Google Scholar]
- [21].Raymond CK, Roberts BS, Garrett-Engele P, Lim LP, Johnson JM. RNA. 2005;11:1737. doi: 10.1261/rna.2148705. [DOI] [PMC free article] [PubMed] [Google Scholar]
- [22].Chen C, Ridzon DA, Broomer AJ, Zhou Z, Lee DH, Nguyen JT, Barbisin M, Xu NL, Mahuvakar VR, Andersen MR, Lao KQ, Livak KJ, Guegler KJ. Nucl. Acids Res. 2005;33:e179. doi: 10.1093/nar/gni178. [DOI] [PMC free article] [PubMed] [Google Scholar]
- [23].Babak T, Zhang W, Morris Q, Blencowe BJ, Hughes TR. RNA. 2004;10:1813. doi: 10.1261/rna.7119904. [DOI] [PMC free article] [PubMed] [Google Scholar]
- [24].Thomson JM, Parker J, Perou CM, Hammond SM. Nat. Methods. 2004;1:47. doi: 10.1038/nmeth704. [DOI] [PubMed] [Google Scholar]
- [25].Nelson PT, Baldwin DA, Scearce LM, Oberholtzer JC, Tobias JW, Mourelatos Z. Nat. Methods. 2004;1:155. doi: 10.1038/nmeth717. [DOI] [PubMed] [Google Scholar]
- [26].Liu C-G, Calin GA, Meloon B, Gamliel N, Sevignani C, Ferracin M, Dumitru CD, Shimizu M, Zupo S, Dono M, Alder H, Bullrich F, Negrini M, Croce CM. Proc. Nat. Acad. Sci. U. S. A. 2004;101:9740. doi: 10.1073/pnas.0403293101. [DOI] [PMC free article] [PubMed] [Google Scholar]
- [27].Barad O, Meiri E, Avniel A, Aharonov R, Barzilai A, Bentwich I, Einav U, Gilad S, Hurban P, Karov Y, Lobenhofer EK, Sharon E, Shiboleth YM, Shtutman M, Z B, P E. Genome Res. 2004;14:2486. doi: 10.1101/gr.2845604. [DOI] [PMC free article] [PubMed] [Google Scholar]
- [28].Miska EA, Alvarez-Saavedra E, Townsend M, Yoshii A, Sestan N, Rakic P, Constantine-Paton M, Horvitz R. Genome Biol. 2004;5:R68. doi: 10.1186/gb-2004-5-9-r68. [DOI] [PMC free article] [PubMed] [Google Scholar]
- [29].Goff LA, Yang M, Bowers J, Getts RC, Padgett RW, Hart RP. RNA Biol. 2005;2:93. doi: 10.4161/rna.2.3.2059. [DOI] [PubMed] [Google Scholar]
- [30].Baskerville S, Bartel DP. RNA. 2005;11:241. doi: 10.1261/rna.7240905. [DOI] [PMC free article] [PubMed] [Google Scholar]
- [31].Castoldi M, Schmidt S, Benes V, Noerholm M, Kulozik AE, Hentze MW, Muckenthaler MU. RNA. 2006;12:913. doi: 10.1261/rna.2332406. [DOI] [PMC free article] [PubMed] [Google Scholar]
- [32].Beuvinky I, Kolb FA, Budach W, Garnier A, Lange J, Natt F, Dengler U, Hall J, Filipowicz W, Weiler J. Nucl. Acids Res. 2007;35:e52. doi: 10.1093/nar/gkl1118. [DOI] [PMC free article] [PubMed] [Google Scholar]
- [33].Lockhart DJ, Winzeler EA. Nature. 2000;405:827. doi: 10.1038/35015701. [DOI] [PubMed] [Google Scholar]
- [34].Wang H, Ach RA, Curry B. RNA. 2007;13:151. doi: 10.1261/rna.234507. [DOI] [PMC free article] [PubMed] [Google Scholar]
- [35].Valoczi A, Hornyik C, Varga N, Burgyan J, Kauppinen S, Havelda Z. Nucl. Acids Res. 2004;32:e175. doi: 10.1093/nar/gnh171. [DOI] [PMC free article] [PubMed] [Google Scholar]
- [36].Wienholds E, Kloosterman WP, Miska E, Alvarez-Saavedra E, Berezikov E, Bruijn ED, Horvitz HR, Kauppinen S, Plasterk RHA. Science. 2005;309:310. doi: 10.1126/science.1114519. [DOI] [PubMed] [Google Scholar]
- [37].Kloosterman WP, Wienholds E, Bruijn ED, Kauppinen S, Plasterk RHA. Nat. Methods. 2006;3:27. doi: 10.1038/nmeth843. [DOI] [PubMed] [Google Scholar]
- [38].Deo M, Yu J-Y, Chung K-H, Tippens M, Turner DL. Dev. Dynamics. 2006;235:2538. doi: 10.1002/dvdy.20847. [DOI] [PubMed] [Google Scholar]
- [39].Neely LA, Patel S, Garver J, Gallo M, Hackett M, McLaughlin S, Nadel M, Harris H, Gullans S, Rooke J. Nat. Methods. 2006;3:41. doi: 10.1038/nmeth825. [DOI] [PubMed] [Google Scholar]
- [40].Lee HJ, Wark AW, Corn RM. Langmuir. 2006;22:5241. doi: 10.1021/la060223o. [DOI] [PMC free article] [PubMed] [Google Scholar]
- [41].Wark AW, Lee HJ, Corn RM. Anal. Chem. 2005;77:3904. doi: 10.1021/ac050402v. [DOI] [PubMed] [Google Scholar]
- [42].Lee HJ, Li Y, Wark AW, Corn RM. Anal. Chem. 2005;77:5096. doi: 10.1021/ac050815w. [DOI] [PubMed] [Google Scholar]
- [43].Enos JM, Duzeski JL, Roesch PL, Hagstrom JE, Watt M-AV. Biotechniques. 2007;42:378. [Google Scholar]
- [44].Garnier A, Hüsken D, Weiler J. Nucleosides, Nucleotides & Nucleic Acids. 2001;20:1181. doi: 10.1081/NCN-100002515. [DOI] [PubMed] [Google Scholar]
- [45].Liang R, Li W, Li Y, Tan C, Li J, Jin Y, Ruan K. Nucl. Acids Res. 2005;33:e17. doi: 10.1093/nar/gni019. [DOI] [PMC free article] [PubMed] [Google Scholar]
- [46].Gao Z, Yang Z. Anal. Chem. 2006;78:1470. doi: 10.1021/ac051726m. [DOI] [PubMed] [Google Scholar]
- [47].Shingara J, Keiger K, Shelton J, Laosinchai-Wolf L, Powers P, Conrad R, Brown D, Labourier E. RNA. 2005;11:1461. doi: 10.1261/rna.2610405. [DOI] [PMC free article] [PubMed] [Google Scholar]
- [48].Mattie MD, Benz CC, Bowers J, Sensinger K, Wong L, Scott GK, Fedele V, Ginzinger D, Getts R, Haqq C. Mol. Cancer. 2006;5:24. doi: 10.1186/1476-4598-5-24. [DOI] [PMC free article] [PubMed] [Google Scholar]
- [49].Fang S, Lee HJ, Wark AW, Corn RM. J. Am. Chem. Soc. 2006;128:14044. doi: 10.1021/ja065223p. [DOI] [PMC free article] [PubMed] [Google Scholar]
- [50].Nelson PT, Baldwin DA, Kloosterman WP, Kauppinen S, Plasterk RHA, Mourelatos Z. RNA. 2006;12:187. doi: 10.1261/rna.2258506. [DOI] [PMC free article] [PubMed] [Google Scholar]
- [51].Berezikov E, Tetering GV, Verheul M, Belt JVD, Laake LV, Vos J, Verloop R, Wetering MVD, Guryev V, Takada S, Zonneveld AJV, Mano H, Plasterk R, Cuppen E. Genome Res. 2006;16:1289. doi: 10.1101/gr.5159906. [DOI] [PMC free article] [PubMed] [Google Scholar]
- [52].Ramkissoon SH, Mainwaring LA, Sloand EM, Young NS, Kajigaya S. Mol. Cell. Probes. 2006;20:1. doi: 10.1016/j.mcp.2005.07.004. [DOI] [PubMed] [Google Scholar]
- [53].Hartig JS, Grune I, Najafi-Shoushtari SH, Famulok M. J. Am. Chem. Soc. 2004;126:722. doi: 10.1021/ja038822u. [DOI] [PubMed] [Google Scholar]
- [54].Chen PY, Manninga H, Slanchev K, Chien M, Russo JJ, Ju J, Sheridan R, John B, Marks DSS, Gaidatzis D, Sander C, Zavolan M, Tuschl T. Genes & Dev. 2005;19:1288. doi: 10.1101/gad.1310605. [DOI] [PMC free article] [PubMed] [Google Scholar]
- [55].He L, Thomson JM, Hemann MT, Hernando-Monge E, Mu D, Goodson S, Powers S, Cordon-Cardo C, Lowe SW, Hannon GJ, Hammond SM. Nature. 2005;435:828. doi: 10.1038/nature03552. [DOI] [PMC free article] [PubMed] [Google Scholar]
- [56].Jonstrup SP, Koch J, Kjems J. RNA. 2006;12:1747. doi: 10.1261/rna.110706. [DOI] [PMC free article] [PubMed] [Google Scholar]
- [57].Lu J, Getz G, Miska EA, Alvarez-Saavedra E, Lamb J, Peck D, Sweet-Cordero A, Ebert BL, Mak RH, Ferrando AA, Downing JR, Jacks T, Horvitz HR, Golub TR. Nature. 2005;435:834. doi: 10.1038/nature03702. [DOI] [PubMed] [Google Scholar]