Abstract
Lipid storage protein 2 (Lsd 2) is a conserved insect protein that belongs to the small PAT family of proteins. PAT proteins are found associated to the lipid droplets of adipocytes and play significant roles in the regulation of triacylglycerides metabolism. Here we describe the expression and purification of Lsd2, its reconstitution in lipoprotein particles, the location of putative lipid binding sites and its secondary structure. This study provides the starting point for future studies on the mechanism of function of Lsd2. The similarities and differences between Lsd1 and Lsd2, the only PAT proteins found in insects, are discussed.
Keywords: Lipid storage droplet protein, adipocytes, fat body, Drosophila, lipolysis
INTRODUCTION
Neutral lipids in the form of triacylglycerides (TAG) are the predominant form of storage of fatty acids and comprise the main energy reserve in all animals [1]. TAG are stored mostly in adipocytes in the form of cytosolic lipid droplets (LD). The lipid droplets are spherical bodies of several microns of diameter that are composed of a core of TAG surrounded by a layer of phospholipid and large variety of proteins [2–4]. Utilization of the TAG stores requires previous hydrolysis of the TAG molecules. However, since the bulk of TAG resides in the core of the LD, the accessibility of TAG-lipases to the TAG molecules is restricted by the layer of phospholipids and proteins. Thus, the lipid droplet surface represents a central player in the regulation of TAG metabolism. In the presence of the proper hormonal stimuli changes on the surface of the lipid droplets ensure a rapid hydrolysis of TAG. It is already known that certain proteins of the LD and reactions of phosphorylation and de-phosphorylation play an active role in the rate of lipolysis [5]. However, little is known about the mechanisms of regulation.
Insect LDs contain many proteins [4, 6]. However, only few of the LD proteins appear to be LD specific proteins. In fact only two of the LD proteins, Lsd1 and Lsd2, are exclusively found on the surface of the insect lipid droplets. These LD specific proteins belong to the PAT family of proteins (pfam 03036), which includes the mammalian proteins Perilipin (accession number AAA41830), ADRP (accession number P43883), and TIP47 (accession number NP_080112) first described by Lu et al. [7]. The PAT domain is simply defined on the basis of the unique sequence homology found among the N-terminal ~100 residues found in these proteins.
PAT proteins play important roles in the deposition and utilization of TAG [5, 8, 9]. Perilipin represents the best studied PAT protein so far. Studies performed in cells over-expressing perilipin have shown that this protein inhibits TAG hydrolysis in the non phosphorylated state and stimulates lipolysis upon phosphorylation [10]. It must be noted, however, that perilipin has not been purified, yet. Insect genomes encode only two PAT domain proteins, Lsd1 and Lsd2, which localize in the LD [11, 12].
Studies in insects have suggested relevant roles for Lsd1 and Lsd2 in TAG homeostasis. Phosphorylation of Lsd1 was shown to play a major role in activation of TAG lipolysis [6, 13]. Moreover, we have recently shown that Lsd1 can be purified and reconstituted with lipid to study its mechanism of function in vitro [13].
Studies in Drosophila melanogaster have shown that the accumulation of TAG in the fly correlates with the levels of expression of Lsd2 [11, 14–16]. Over-expression of Lsd2 leads to fat flies whereas a decrease in Lsd2 expression results in lean adult flies. These studies and the fact that Lsd2 is located in the lipid droplets suggest that Lsd2 could play a direct role in the regulation of enzymes dedicated to either the synthesis or the hydrolysis of TAG. However, in order to elucidate the mechanism of function of Lsd2 it is necessary to work with an in vitro system to investigate the interaction of Lsd2 with other cellular proteins. In the present study we show that recombinant D. melanogaster Lsd2 can be purified and reconstituted in lipid droplet like particles suitable for functional and structural studies. The secondary structure of the protein in the lipid-free and lipid-bound state was determined and putative lipid binding sites identified. This study also shows some distinct physical properties of Lsd1 (accession number NP_732904) and Lsd2 (accession number NP_572996).
MATERIAL AND METHODS
Materials
pET32 Ek/LIC vector, E. coli Rosetta 2, DNAse I, anti-His and anti S-tag antibodies were obtained from Novagen. DMPG (dimyristoyl phosphatidylglycerol) was purchased from Serdary Res. Labs; Total mRNA from Drosophila melanogaster was purchased from Invitrogen. All other chemicals were of analytical grade.
Expression and purification of recombinant Lsd2
Total mRNA was reverse transcribed using oligo-d(T)18-primer and the cDNA was used to amplify the coding region of Lsd 2 (CG9057, AY060242) by PCR. The left and right primers were 5′- GACGACGACAAGATGGCCAGTGCAGAGCAGAAACAC and GAGGAGAAGCCCGGTCTAAGACGACACCGCCGGCGC. The product was ligated into the vector pET-32 Ek/LIC that contains an N-terminal coding sequence for thioredoxin followed by His-Tag and S-Tag coding sequences. E. coli strain NovaBlue GigaSingles cells were transformed with the recombinant plasmid. Positive clones were confirmed by DNA sequencing. E. coli Rosetta 2 cells were transformed for protein expression. Expression of the recombinant protein was induced with 1mM IPTG in 1 liter of suspension culture. After 2 h, bacteria were collected and resuspended in lysis buffer (50mM Tris pH8, 1mM EDTA, 100mM NaCl, 1mM PMSF) containing 0.3 mg/ml of lysozyme. After 30 min incubation, the preparation was centrifuged at 100,000 × g for 1h. The fusion protein was found in the pellet, which was resuspended in 0.1M sodium acetate pH5, 5mM MgCl2 and incubated with DNAse I at 37 °C for 1h. Sample was centrifuged (35,000 × g, 20min) and the pellet was resuspended in 20mM Tris pH7.9, 6M urea, 0.5M NaCl and sonicated in two steps for 1min each time. The preparation was centrifuged (5000 × g, 20 min) and the Trx-Lsd2 solution (5mg/ml) was adjusted to 20 mM imidazole and combined with 3 ml of resin pre-equilibrated with the same buffer. The slurry was incubated for 4 h. The resin was washed with ten bed volumes of wash buffer I (20mM Tris pH7.9, 6M urea, 0.5M NaCl, 20mM imidazole), followed by ten bed volumes of wash buffer II (20mM Tris pH7.9, 6M urea, 0.5M NaCl, 40 mM imidazole). The fusion protein was eluted with 60 mM imidazole. Fractions containing Trx-Lsd2 were combined and dialyzed against 20mM Tris pH7.9, 0.1M NaCl. Sample was concentrated to 0.5 mg / ml by ultrafiltration and incubated with thrombin (2 units per ml of Lsd2 preparation) for 2 h at room temperature. Sample was combined with 2 ml resin pre-equilibrated in 20mM Tris pH7.9, 0.5M NaCl buffer. After washing the resin with buffer Lsd2 was eluted with 5 mM imidazole. Protein was concentrated (0.5 mg / ml) and kept in the freezer.
Reconstitution of Lsd2 in lipoprotein particles
DMPG liposomes (6mg/ml) in 20mM Tris pH7.5, 0.10M NaCl, were prepared by adding 0.2 ml of buffer into a glass vial containing a thin film of DMPG (1.2 mg). The vial was vortexed vigorously for 30s at RT. DMPG liposomes (400 nmol) were mixed with 8 nmoles of Lsd2 in 20 mM Tris pH7.5, 0.10M NaCl, 0.01% cholate followed by exhaustive dialysis for 24 h against phosphate buffer (5mM PO4Na3 pH7.5, 20 mM NaCl) at 4°C.
Circular Dichroism (CD)
CD spectroscopy was performed with a Jasco-715 (Jasco Corporation, Tokyo, Japan) spectropolarimeter using a 0.1 cm path length cell over the 195–260 nm range. The spectra were acquired every 1 nm with a 2 s averaging time per point and a 1 nm bandpass. Quadruplicates of the spectra were averaged, corrected for background, and smoothed. Protein concentrations were determined by UV at 280 nm using extinction coefficients of 30,035 M−1.cm−1 for Lsd2 and 37,360 M−1 cm−1 for Lsd1, respectively. The mean residue ellipticity (deg·cm2·dmol−1) was calculated from the corresponding number of residues (S-tagged-Lsd2, 379 and S-tagged-Lsd1, 458). The secondary structure of Lsd2 was estimated with the program Selcon3 using a 29-protein dataset of basic spectra [17].
Mass spectrometry
Lsd2 was separated by SDS-PAGE. Protein bands were excised, reduced and alkylated, and digested with trypsin (Promega V5111). Peptide extracts were analyzed by Maldi-tof. Linear mass spectra were also collected using alternative Maldi matrices 2,5-dihydroxy benzoic acid and sinapic acid. Peptide mass fingerprints were used for database searching with the Mascot® software (Matrix Science).
Other methods
SDS-PAGE was performed according to Laemmli and proteins were visualized by Coomassie Brilliant Blue R staining. For Western Blotting, proteins were separated by SDS-PAGE (10%) and transferred to nitrocellulose membranes. Anti-S tag and anti-His tag monoclonal antibody was purchased from Novagen. Immunodetection was performed using the corresponding horseradish peroxidase-conjugated secondary antibody and ECL chemiluminescence reagents (Amersham Biosciences).
RESULTS AND DISCUSSION
Overexpression and Purification Lsd2
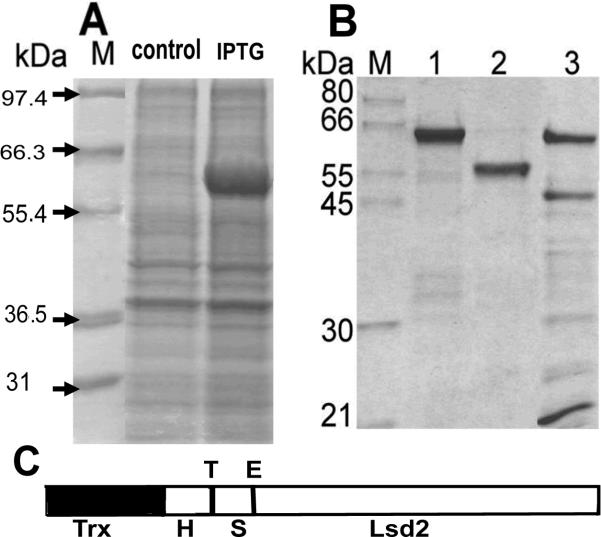
Lsd2 localizes to the surface lipid droplets found in fat body and oocytes of Drosophila melanogaster and it is required for normal deposition of TAG [11,14]. In order to study the biochemical properties of this protein we produced recombinant Lsd2 from Drosophila melanogaster in E. coli as a fusion protein with thioredoxin (Trx). To facilitate the purification and detection of Lsd2, a His and S tag sequence was also present in the fusion protein between the Trx and Lsd2. A thrombin cleavage site separates the His tag from the S tag and Lsd2. Successful expression of the fusion protein was possible using the E.coli strain Rosetta 2. Maximum accumulation of Lsd2 in total cell lysates occurred 2h after IPTG induction (Fig. 1A). The fusion protein (Trx-Lsd2) localized in the inclusion bodies from where was extracted by sonication in the presence of 6 M urea. After purification to homogeneity by Ni-affinity chromatography (Fig. 1B) Trx-Lsd2 was soluble in aqueous buffer in the absence of urea. The fusion protein has an estimated molecular mass of 55.2kDa but in the SDS-PAGE runs as a 65 KDa protein (Fig. 1, lane 1). The Trx-His tag portion was cleaved with thrombin. The separation of Lsd2 from the 14kDa N-terminal domain (Trx-His tag) was done by Ni-affinity chromatography as described in Materials and Methods. The specificity of thrombin cleavage was verified by Western blot using anti S tag and anti His tag antibodies. As expected, the anti S tag antibody recognized both uncut and cut protein, whereas the anti His tag only recognized the uncut protein (data not shown). Specific cleavage with enterokinase to remove the remaining S tag was not possible. As it is shown in Fig 1 (panel B), the cleavage with enterokinase produced several products even at very low concentration of protease when a significant amount of fusion protein was still present in the preparation. Therefore, subsequent work was carried out with S tagged Lsd2, which was soluble in Tris buffer. As the fusion protein, Lsd2 also showed a lower electrophoretic mobility (55 kDa) than that expected from its molecular mass (41.1 kDa). However, the identity of the 55kDa protein was confirmed by Maldi-tof, which unambiguously identified this protein band as Lsd2 from D. melanogaster, NP_572996. The cause of the lower electrophoretic mobility of Lsd2 is not known. However, we suspect that some regions of the protein remain unfolded and may not bind SDS as efficiently as most proteins do.
Figure 1. Expression and purification of Lsd2.
A) Expression: SDS-PAGE of bacterial lysate before (Control) and 2h after addition of IPTG (IPTG); B) Purification: SDS-PAGE of purified Trx-Lsd2 (Lane 1); Trx-Lsd2 after thrombin cleavage (Lane 2); Trx-Lsd2 after enterokinase cleavage (Lane 3). C) Scheme of the Trx-Lsd2: The locations of the His-tag (H), S-Tag (S), and the protease cleavage sites for thrombin (T) and enterokinase (E) are indicated.
Secondary structure of Lsd2 in the lipid-free and lipid-bound states
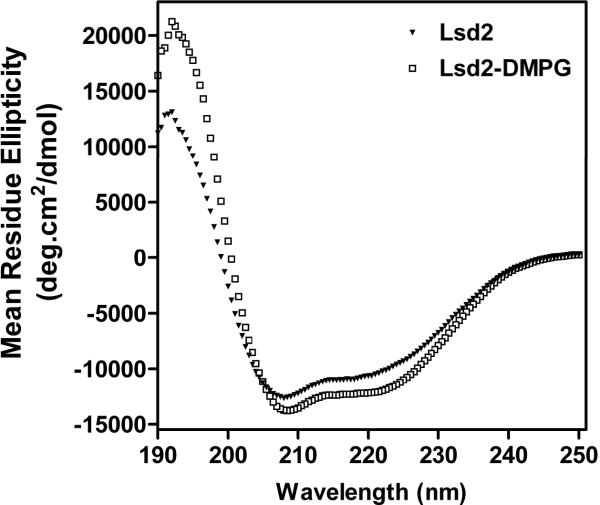
The structure of Lsd2 in the lipid-free state was studied by far-UV CD spectroscopy. As shown in the Fig. 2, the spectrum of Lsd2 shows the typical features of the spectra of α-helical proteins. Estimation of the structural composition using the “Self-consistent” method (Selcon3) [17] indicated that the structure of Lsd2 comprises 40.3% α-helix, 18% β-pleated sheets and 20% of each turns and unordered structures.
Figure 2. Secondary structure of Lsd2.
Circular dichroism spectra of Lsd2 in the lipid-free state (triangles) and in lipoproteins complexes with DMPG (Squares). Data were acquired at 24°C. Other experimental details were described in Methods.
Lipoprotein complexes of Lsd 2 and DMPG were obtained by the cholate dialysis method amply used to obtain lipoprotein particles with apolipoproteins [18] and recently used to obtain phospholipid-Lsd1complexes [13]. Lsd2 formed small lipoprotein complexes suitable for spectroscopic studies. As suggested by the increase in the intensity of the 220 nm band of the CD spectrum (Fig. 2), binding of Lsd2 to phospholipids is estimated to promote a modest increase in α-helical content from 40.3 to 44.4 %.
Predicted Location of Helical and Lipid Binding Regions of Lsd 2
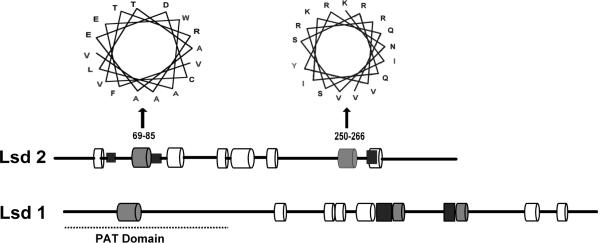
The probable location of the α-helical regions of Lsd2 was obtained using the program GOR 4 [19]. This approach provided an estimate of α-helical content of 39%, which is similar to that estimated on the basis of the CD-spectrum. The predicted location of the α-helical regions of Lsd2 is shown in the Fig 3. A total of eight helical regions were identified. Analysis of the amphipathic character of the helices suggests that only two of the helices (69–85 and 250–266) are highly amphipathic (high hydrophobicity and hydrophobic moment) and could be involved in anchoring Lsd2 to the phospholipid surface of the lipid droplets. As observed in Lsd1, these two amphipathic helices are located near two short hydrophobic sequence stretches that could strengthen the lipid-protein interaction. Overall, this analysis suggests that Lsd2 could bind to the lipid droplet by means of two sets of amphipathic/hydrophobic regions. One of these regions is found near the N-terminal whereas the other is found closer to the C-terminal region of Lsd2.
Figure 3. Predicted α-helical regions of Lsd2.
The locations of the eight predicted α-helices of Lsd2 (352aa) are indicated with cylinders: 36–44, 69–85, 110–114, 143–152, 153–176, 187–197, 250–266 and 275–286. Grey cylinders represent putative lipid-binding helices. Black rectangles represent hydrophobic segments that could also interact with the lipid droplet. Helical wheel diagrams of the two predicted lipid binding helices are shown. A scheme of the helices found in Lsd1 is shown for comparison.
Four additional helical segments are found in between these two putative lipid binding regions. As suggested from the structure of TIP47 [20] these helices could adopt a four-helix bundle similar to that found in human apolipoprotein-E. However, given the low amphiphilicity of the helices, the involvement of the putative helix bundle in binding to the lipid droplet surface does not seem likely.
Lsd2 from Drosophila melanogaster was identified as a PAT family member and a LD protein in 2001 [7]. Progress in the genome projects of several insect species has increased the number of available Lsd2 sequences and it is now possible to make a comparison of these sequences. Six Lsd2 sequences from different insects are currently available. A blast search using D. melanogaster Lsd2 sequence shows a high degree of homology with the Lsd2 sequences of three insects from the diptera order; 61% identity (79% similarity) with Anopheles gambiae; 60% identity (76% similarity) with Aedes aegypti and 59% identity (73% similarity) with Culex pipiens. On the other hand a lower degree of identity (36%) was found with the sequences of two hymenoptera insects, the bee, Apis mellifera (56% similarity), and the wasp, Nasonia vitripennis (58% similarity). The similarity among the sequences is particularly high in the central region of the proteins residues 35 through 293. In this central region, which includes all the helical regions of Lsd2, the degrees of identity range between 60–62% (76–79% similarity) for insects of the diptera order and decreases to 36% (58% similarity) when the Drosophila sequence is compared with the Lsd2 sequences of the hymenoptera order. Interestingly, the comparison of the D. melanogaster region comprised between the residues 234 and 284, which contains two putative lipid binding segments, with equivalent Lsd2 regions of the other five insect species shows over 90 % similarity. This high level of similarity suggest an important functional role of this putative lipid binding region, which includes an amphipathic and a hydrophobic α-helix.
Structural and Functional Comparison between Lsd1 and Lsd2
Sequence similarities
Insect genomes encode only two PAT domain proteins, Lsd1 and Lsd2, which localize in the LD [11, 12]. Current information on the function of these proteins suggests that they play opposite roles in the metabolism of TAG. Expression of Lsd2 favors the accumulation of TAG in flies [11, 14–16] whereas Lsd1 plays an important role in activation of the hydrolysis of TAG [6, 13, 23]. To investigate possible relationships between the structure and function of these proteins we compared first the similarities between the protein sequences. An overall sequence identity of 25% (45% similarity) is found between Lsd2 and Lsd1. Alignment of the amino acid sequences of Lsd1 and Lsd2 using the T-Coffee program identifies a 119-residues N-terminal region, localized between residues 11 to 130 in Lsd1 and residues 37 to 156 in Lsd2, as the section of highest identity (32 %) between these two proteins. This region contains the PAT domain originally described in the lipid droplet-associated proteins perilipins, ADRP and TI47 [7]. Because the PAT domain is characteristic of LD proteins its role in targeting the proteins to the lipid droplets has been evaluated. The studies, however, have shown that it is not required for targeting of perilipin and ADRP to the lipid droplet [21, 22]. Thus the role of the PAT domain remains uncertain.
Several amino acid sequence repeats are found in both Lsd1 and Lsd2. Some of these repeats are shown in Table 1. More repeats can be found in Lsd2 than Lsd1. For example, the sequence TTT appears four times at residues 186, 315, 319, and 321, and the sequence SS is present six times at residues 223, 275, 292, 304, 325, 349. The functional significance of these repeats remains to be investigated.
Table 1. Amino acid sequence repeats in Lsd1 and Lsd2.
The repeats are underlined.
| Lsd1 | Lsd2 |
|---|---|
|
23LVESSVKRVETIYDK37 69LFEPSIQRLDNVMCK83 |
10TGNGTGNG19 |
|
69LFEPSIQRLDNVMCKSLDILE89 114LVRPVLKRADSVKQIGNAVLE134 |
50NAAWDKSQDVYGKVKG65 162DLAWQKANEVLATQYG177 |
|
188QQLNRMFGHKSPQEDDNEAVPDERGAIKAIH219 221QRFSRKLKRRLTQRTTAEARALKKQSKEAIH252 |
65GKNRVFEWALTAAEDCVTRAVTT87 221GKSSENDMPVPASEDPVLHTVQT243. |
Phosphorylation sites
Sequence based analysis of possible PKA and PKC phosphorylation sites in Lsd1 and Lsd2 showed the presence of multiple conserved PKC sites in both proteins. However, only Lsd1 contained sites for PKA catalyzed phosphorylation. This result is consistent with the fact that PKA catalyzes the phosphorylation of Lsd1 in vivo and in vitro promoting activation of the fat body TAG-lipase. Lsd2 is phosphorylated in vivo but the nature of the kinase involved has not been studied yet. The sequence analysis suggests that PKC could be involved in regulating TAG metabolism through phosphorylation of Lsd2. Five consensus sites for PKC phosphorylation (S178, T243, S248, S277 and S343) are fully conserved among the six Lsd2 sequences available.
Structural similarities
Lsd1 and Lsd2 are basic proteins with isoelectric points of 9.17 and 8.53, respectively. As shown in Fig 4, and discussed above the proteins show a significant sequence similarity. The secondary structure of Lsd1 in the lipid bound state [13] is predominately α-helical and similar to that determined for Lsd2. As shown in the Fig. 3, Lsd1 and Lsd2 also share some similarities in the location of possible lipid binding sites and the presence of several helical regions. In spite of these similarities a contrasting structural stability is observed when the proteins are compared in the lipid-free state. Thus, whereas Lsd2 is soluble in aqueous buffers, Lsd1 can be maintained in aqueous solutions only in the presence of denaturants or detergents [13]. This difference suggests that Lsd2 can fold in an aqueous environment adopting a stable tertiary structure. Although the stability of lipid-bound proteins is difficult to assess due to the lack of reversibility of the unfolding process, the apparent stabilities of Lsd1 and Lsd2 in lipoprotein particles of DMPG were compared by monitoring denaturant induced changes in the secondary structure of the proteins. The Fig. 5 shows that low concentrations of Gdm induce a rapid change in the α-helical content of both proteins. However, whereas Lsd1 becomes fully unfolded when the concentration of denaturant reaches ~500mM, only 50 % of the secondary structure of Lsd 2 is lost at this concentration. This result indicates that although the structure of both proteins is highly sensitive to changes in the environment, Lsd1 appears to be more prone to undergo large structural changes.
Figure 4. Amino acid sequence alignment of Lsd1 and Lsd2 from Drosophila melanogaster.
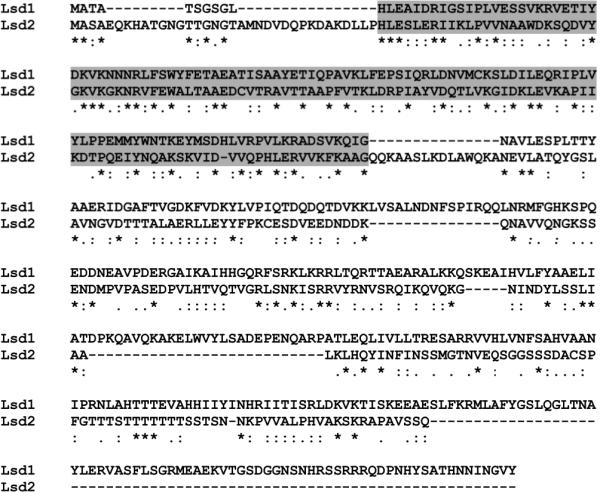
The alignment was performed using the T Coffee program available at www.ebi.ac.uk/t-coffee. Lines in the sequence are gaps introduced by the program to optimize the alignment. Identical residues in all the sequences are denoted by asterisks; conservative substitutions are denoted by dots. Conserved PAT domains are boxed in gray.
Figure 5. Stability of Lsd1 and Lsd2 in lipoprotein complexes.
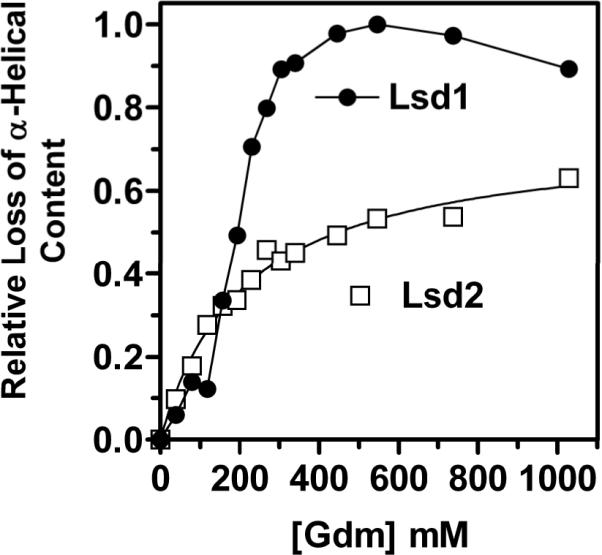
Guanidinium.HCl-induced unfolding was monitored by circular dichroism. CD-spectra were acquired at each concentration of denaturant. The fraction of lost α-helical content was determined from the change in mean residue ellipticity (MRE) at 220nm assuming a value of −3000 deg.cm2/dmol for the MRE corresponding to absence of α-helical content.
Concluding Remarks
Lsd2 is a conserved protein found in many insect species. The location of Lsd2 in the lipid droplets of insect adipocytes and studies involving alteration of the expression of Lsd2 in Drosophila melanogaster have suggested a direct a role of Lsd2 in TAG homeostasis. The present study shows that Lsd2 can be purified and reconstituted with lipids to form lipoprotein particles that to some extent resemble the environment found in the lipid-droplet. These results suggest that it will be possible to advance in the study of the mechanism by which this protein affects the homeostasis of TAG metabolism.
The current study also identified two conserved regions within the Lsd2 sequence that could be involved in binding of the protein to the surface of the lipid droplets. Each of these regions consists of a highly amphipathic helix followed by a short stretch of hydrophobic residues. The secondary structure its solubility in aqueous buffers in the absence of lipid or detergents suggest that Lsd2 folds into a stable tertiary structure. This property defines a major difference with Lsd1, which is only stable in the lipid-bound state or in the presence of detergents [13]. Thus, in spite of the significant sequence similarity shared by Lsd1 and Lsd2 this study shows that they have major differences in their physical properties.
ACKNOWLEDGEMENTS
This work was supported by National Institutes of Health Grant GM 64677 and Oklahoma Agricultural Experiment Station.
REFERENCES
- [1].Wolins NE, Brasaemle DL, Bickel PE. FEBS Lett. 2006;580:5484. doi: 10.1016/j.febslet.2006.08.040. [DOI] [PubMed] [Google Scholar]
- [2].Murphy DJ. Prog Lipid Res. 2001;40:325. doi: 10.1016/s0163-7827(01)00013-3. [DOI] [PubMed] [Google Scholar]
- [3].Liu P, Ying Y, Zhao Y, Mundy DI. J Biol Chem. 2004;279:3787. doi: 10.1074/jbc.M311945200. [DOI] [PubMed] [Google Scholar]
- [4].Beller M, Riedel D, Jansch L, Dieterich G. Mol Cell Proteomics. 2006;5:1082. doi: 10.1074/mcp.M600011-MCP200. [DOI] [PubMed] [Google Scholar]
- [5].Brasaemle DL. J Lipid Res. 2007;48:2547. doi: 10.1194/jlr.R700014-JLR200. [DOI] [PubMed] [Google Scholar]
- [6].Patel RT, Soulages JL, Hariharasundaram B, Arrese EL. J Biol Chem. 2005;280:22624. doi: 10.1074/jbc.M413128200. [DOI] [PubMed] [Google Scholar]
- [7].Lu X, Gruia-Gray J, Copeland NG, Gilbert DJ. Mamm Genome. 2001;12:741. doi: 10.1007/s00335-01-2055-5. [DOI] [PubMed] [Google Scholar]
- [8].Londos C, Sztalryd C, Tansey JT, Kimmel AR. Biochimie. 2005;87:45. doi: 10.1016/j.biochi.2004.12.010. [DOI] [PubMed] [Google Scholar]
- [9].Londos C, Brasaemle DL, Schultz CJ, Segrest JP, Kimmel AR. Semin Cell Dev Biol. 1999;10:51. doi: 10.1006/scdb.1998.0275. [DOI] [PubMed] [Google Scholar]
- [10].Tansey JT, Huml AM, Vogt R, Davis KE. J Biol Chem. 2003;278:8401. doi: 10.1074/jbc.M211005200. [DOI] [PubMed] [Google Scholar]
- [11].Teixeira L, Rabouille C, Rorth P, Ephrussi A, Vanzo NF. Mech Dev. 2003;120:1071. doi: 10.1016/s0925-4773(03)00158-8. [DOI] [PubMed] [Google Scholar]
- [12].Miura S, Gan JW, Brzostowski J, Parisi MJ. J Biol Chem. 2002;277:32253. doi: 10.1074/jbc.M204410200. [DOI] [PubMed] [Google Scholar]
- [13].Arrese EL, Rivera L, Hamada M, Mirza S, Hartson S, Weintraub S, Soulages JL. Arch. Biochem. Biophys. 2008 doi: 10.1016/j.abb.2008.02.036. doi:10.1016/j.abb.2008.02.036. [DOI] [PMC free article] [PubMed] [Google Scholar]
- [14].Gronke S, Beller M, Fellert S, Ramakrishnan H. Curr Biol. 2003;13:603. doi: 10.1016/s0960-9822(03)00175-1. [DOI] [PubMed] [Google Scholar]
- [15].Welte MA, Cermelli S, Griner J, Viera A. Curr Biol. 2005;15:1266. doi: 10.1016/j.cub.2005.06.062. [DOI] [PubMed] [Google Scholar]
- [16].Fauny JD, Silber J, Zider A. Dev Dyn. 2005;232:725. doi: 10.1002/dvdy.20277. [DOI] [PubMed] [Google Scholar]
- [17].Sreerama N, Venyaminov SY, Woody RW. Anal Biochem. 2000;287:243. doi: 10.1006/abio.2000.4879. [DOI] [PubMed] [Google Scholar]
- [18].Soulages JL, Arrese EL. Biochemistry. 2001;40:14279. doi: 10.1021/bi010949d. [DOI] [PubMed] [Google Scholar]
- [19].Garnier J, Gibrat JF, Robson B. Methods Enzymol. 1996;266:540. doi: 10.1016/s0076-6879(96)66034-0. [DOI] [PubMed] [Google Scholar]
- [20].Hickenbottom SJ, Kimmel AR, Londos C, Hurley JH. Structure. 2004;12:1199. doi: 10.1016/j.str.2004.04.021. [DOI] [PubMed] [Google Scholar]
- [21].Nakamura N, Fujimoto T. Biochem Biophys Res Commun. 2003;306:333. doi: 10.1016/s0006-291x(03)00979-3. [DOI] [PubMed] [Google Scholar]
- [22].Garcia A, Sekowski A, Subramanian V, Brasaemle DL. J Biol Chem. 2003;278:625. doi: 10.1074/jbc.M206602200. [DOI] [PubMed] [Google Scholar]
- [23].Arrese EL, Patel RT, Soulages JL. J Lipid Res. 2006;47:2656. doi: 10.1194/jlr.M600161-JLR200. [DOI] [PubMed] [Google Scholar]


