

Abstract
Epidemiological studies suggest that chronic use of nonsteroidal anti-inflammatory drugs lowers the incidence of Parkinson's disease (PD) in humans and implicate neuroinflammatory processes in the death of dopamine (DA) neurons. Here, we demonstrate that regulator of G-protein signaling 10 (RGS10), a microglia-enriched GAP (GTPase accelerating protein) for Gα subunits, is an important regulator of microglia activation. Flow-cytometric and immunohistochemical analyses indicated that RGS10-deficient mice displayed increased microglial burden in the CNS, and exposure to chronic systemic inflammation induced nigral DA neuron loss measured by unbiased stereology. Primary microglia isolated from brains of RGS10-deficient mice displayed dysregulated inflammation-related gene expression profiles under basal and stimulated conditions in vitro compared with that of primary microglia isolated from wild-type littermates. Similarly, knockdown of RGS10 in the BV2 microglia cell line resulted in dysregulated inflammation-related gene expression, overproduction of tumor necrosis factor (TNF), and enhanced neurotoxic effects of BV2 microglia on the MN9D dopaminergic cell line that could be blocked by addition of the TNF decoy receptor etanercept. Importantly, ablation of RGS10 in MN9D dopaminergic cells further enhanced their vulnerability to microglial-derived death-inducing inflammatory mediators, suggesting a role for RGS10 in modulating the sensitivity of dopaminergic neurons against inflammation-mediated cell death. Together, our findings indicate that RGS10 limits microglial-derived TNF secretion and regulates the functional outcome of inflammatory stimuli in the ventral midbrain. RGS10 emerges as a novel drug target for prevention of nigrostriatal pathway degeneration, the neuropathological hallmark of PD.
Keywords: RGS10, microglia, neuroinflammation, tumor necrosis factor, dopaminergic neurodegeneration, Parkinson's disease
Introduction
Neuroinflammatory processes have been implicated in the pathogenesis of Parkinson's disease (PD) (for review, see Tansey et al., 2007), a progressive neurodegenerative movement disorder resulting from the loss of dopaminergic (DA) neurons in the substantia nigra pars compacta (SNpc) (Przedborski, 2005; Olanow, 2007). Progress has been made in identifying inflammatory mediators that contribute to DA neuronal dysfunction (McGeer and McGeer, 2008; Skaper, 2007; Tansey et al., 2007), but key molecular regulators of neuroinflammatory responses in the ventral midbrain remain unknown.
Microglia are resident brain macrophages that respond to environmental stresses and immunological challenges (Puntambekar et al., 2008; Tansey and Wyss-Coray, 2008). Chronically activated microglia overproduce soluble inflammatory mediators such as tumor necrosis factor (TNF) (Sawada et al., 2006), nitric oxide (Moss and Bates, 2001; Liu et al., 2002), and interleukin-1 (IL-1) (Chao et al., 1995; Mrak and Griffin, 2005, 2007) and enhance inflammation-induced oxidative stress in the ventral midbrain (Liu et al., 2002; Block and Hong, 2005; McGeer et al., 2005; Mrak and Griffin, 2007). Central and peripheral administration of lipopolysaccharide (LPS), the endotoxin produced by Gram-negative bacteria often used to model CNS infection, potently activates microglia and induces delayed, progressive, and selective DA neuron death (Gao et al., 2002; Ling et al., 2002; Gibbons and Dragunow, 2006; Ling et al., 2006; Qin et al., 2007). Although TNF-dependent mechanisms have been implicated in the death of midbrain DA neurons (Sriram et al., 2002, 2006a,b; Ferger et al., 2004; McCoy et al., 2006), the mechanisms that limit microglial-derived TNF production to protect the nigrostriatal pathway are unknown.
The regulator of G-protein signaling (RGS) family of proteins negatively regulate G-protein-coupled receptor (GPCR) signaling by virtue of their GTPase accelerating protein (GAP) activity at Gα subunits (Berman et al., 1996; Siderovski et al., 1999; Ross and Wilkie, 2000). Twenty-one functional RGS genes divided into six families are expressed in mice and humans (Zheng et al., 1999; Ross and Wilkie, 2000), and the striatal-enriched RGS9-2 has been implicated in PD-related motor abnormalities (Gold et al., 2007). RGS10 is a 20 kDa member of the R12 subfamily (Hunt et al., 1996; Siderovski et al., 1999; Ross and Wilkie, 2000) expressed at high levels in brain circuits relevant to higher brain function, including the hippocampus, striatum, and dorsal raphe (Gold et al., 1997). Although RGS10 protein has been detected in a number of subcellular compartments in mouse neurons and microglia (Waugh et al., 2005), the function of RGS10 in these cell types has not been determined. In humans, genetic susceptibility loci for age-related maculopathy, a photoreceptor degenerative disease associated with microgliosis, map to the same region of human chromosome 10q26 as the RGS10 gene (Jakobsdottir et al., 2005; Schmidt et al., 2006), suggesting that loss of RGS10 may predispose an organism to neurodegenerative disease. The primary goal of these studies was to test the hypothesis that RGS10 regulates microglial activation, thereby influencing DA neuron survival in the ventral midbrain.
Materials and Methods
Mice.
B6;129S5-Rgs10Gt(IRESBetageo)421Lex mice were generated by Lexicon Genetics using their proprietary random-targeting technology (Zambrowicz et al., 1998). The RGS10-deficient (RGS10−/−) and wild-type (WT) littermate mice used in the study were derived from RGS10 heterozygote (RGS10+/−) breeding pairs (mixed 129/C57BL/6, nonbackcrossed) and were housed in a pathogen-free climate-controlled facility with ad libitum access to food and water. PCR analysis of tail DNA was used for genotyping that was later confirmed by postmortem Western blot analysis. All animal studies were approved by the Institutional Animal Care and Use Committee at The University of Texas Southwestern Medical Center at Dallas.
Reagents.
Rabbit anti-tyrosine hydroxylase (TH) antibody was purchased from Millipore Bioscience Research Reagents. Goat anti-RGS10 antibody was obtained from Santa Cruz Biotechnology. Anti-CD68 antibody was purchased from AbD Serotec. The CellTiter 96 AQueous Assay (MTS) reagent for the viability assay was obtained from Promega. Cell culture reagents were purchased from Sigma-Aldrich or Invitrogen.
Primary microglial cell culture.
Primary microglial cells were harvested from mouse pups at postnatal day 3 (P3)–P6. The brain cortices were isolated and minced. Tissues were dissociated in 0.25% trypsin-EDTA for 20 min at 37°C and agitated every 5 min. Trypsin was neutralized with complete media [DMEM/F12 supplemented with 20% heat-inactivated fetal bovine serum (Sigma), 1% penicillin-streptomycin, and 1% l-glutamine (Sigma)]. Mixed glial cultures were maintained in complete media at 37°C and 5% CO2 for 14–18 d in vitro. Once cultures reached ∼95% confluency, primary microglial cells were harvested by mechanical agitation (150 rpm for 40 min). Isolated microglia were plated in DMEM/F12 supplemented with 10% heat-inactivated fetal bovine serum with desired density. The purity of the microglial cultures was assessed by performing immunocytochemistry with the panmicroglial marker CD68 (macrosialin) and found to be >95%. Contamination by astrocytes (assessed by GFAP immunocytochemistry) and neurons (assessed by MAP2 immunocytochemistry) was found to be <5%.
Flow cytometry.
Mouse brain tissues from P6 pups were dissociated to single-cell suspension by enzymatic degradation using a MACS Technology neural tissue dissociation kit from Miltenyi Biotec according to the manufacturer's protocol. Brain tissues were weighed before mincing, a prewarmed enzyme mix was added to the tissue pieces, and they were incubated with agitation at 37°C. The tissue was further mechanically dissociated by trituration, and the suspension was applied to a 40 μm cell strainer. Cells were processed immediately for MACS MicroBead separations. To separate primary microglia, the CD11b-positive cells were magnetically labeled with CD11b (microglia) MicroBeads. The cell suspension was loaded onto a MACS Column (Miltenyi Biotec), which was placed in the magnetic field of a MACS Separator (Miltenyi Biotec). The magnetically labeled CD11b-positive cells were retained within the column. After removing the column from the magnetic field, the magnetically retained CD11b-positive cells were eluted as the positively selected cell fraction.
Cells were incubated with FITC conjugated to monoclonal mouse CD11b antibodies (Miltenyi Biotec) and/or phycoerythrin (PE) conjugated to mouse F4/80 antibodies (Caltag Laboratories). FITC- and PE-conjugate monoclonal antibodies (mAbs) with irrelevant specificity were used as negative controls. A total of 104 cells with light scatter characteristics of cells of each sample were analyzed using FACSCalibur (BD Biosciences).
Cell culture.
Culture conditions for the BV2 microglia cell line consisted of DMEM/F-12 medium supplemented with 5% heat-inactivated fetal bovine serum. Cultures of the MN9D dopaminergic cell line consisted of DMEM supplemented with 10% fetal bovine serum. To induce process outgrowth in MN9D cells and increase their sensitivity to apoptotic stimuli, cells were incubated with 5 mm valproic acid in N2-supplemented serum-free DMEM for 3 d to induce terminal neuronal differentiation.
Small interfering RNA.
RGS10-specific small interfering RNA (siRNA) duplexes, nonsilencing control siRNA, and siRNA transfection reagents were purchased from Santa Cruz Biotechnology. The siRNA transfection was performed according to the manufacturer's protocol. In each case, the final siRNA concentration was 60 nm.
Perfusion and tissue processing for immunohistochemistry.
At 6 weeks after start of intraperitoneal LPS injections [7.5 × 10⁵ endotoxin units (E.U.)/kg twice weekly], young adult (3–5 months old) mice were deeply anesthetized with Euthasol (pentobarbital sodium and phenytoin sodium) and intracardially perfused with 10 ml of heparinized 1× PBS/0.1% glucose, pH 7.4, followed by 50 ml of 4% paraformaldehyde (PFA) in PBS. Processing of brain sections was done as described previously (McCoy et al., 2006). Brains were postfixed for 24 h in 4% PFA solution and cryoprotected in 20% sucrose in PBS for 18–24 h. Coronal sections (30 μm thickness) were cut through the striatum and SNpc on a Leica cryostat and mounted on glass slides (SuperFrost Plus; Fisher Scientific) for immunohistological analyses and stereological estimate of DA neuron number.
Immunohistochemistry.
Sections on glass slides were fixed for an additional 15 min in 4% paraformaldehyde, followed by a 1× PBS rinse, pH 7.4. Sections were incubated in 0.2 m glycine, pH 7.4, for 30 min to minimize tissue autofluorescence caused by the aldehyde fixative. Sections were permeabilized for 35 min in TBS containing 0.3% Triton X-100 and 1% normal donkey serum (NDS), followed by blocking for 60 min in TBS containing 1% NDS. Sections were incubated in primary antibody for 24 h at 4°C in TBS containing 0.1% Triton X-100 and 1% NDS. Secondary antibody incubations were performed for 4 h at room temperature in the same dilution buffer. Nuclei were counterstained with 0.5 μg/ml Hoechst 33258. Sections were coverslipped with aqueous-based mounting medium with antifade reagent (Biomeda). IgG sera were used at the same concentration as the corresponding primary antibodies to confirm the specificity of staining.
Stereological nigral DA neuron counts.
StereoInvestigator analyses software (MicroBrightField) was used to perform unbiased stereological counts of TH-immunoreactive cell bodies in the SNpc using the optical fractionator method (West et al., 1991). For analysis, the treatment of the various brain sections was blinded to the observer. The boundary of SNpc was outlined under magnification of the 4× objective. Cells were counted with a 40× oil-immersion objective (1.3 numerical aperture) using a Nikon 80i upright fluorescence microscope. Serial sections through the extent of SNpc were cut on a Leica CM1650 cryostat and placed eight per slide (cut thickness of 30 μm and final mounted thickness of 22 μm) for systematic analysis of randomly placed counting frames (size, 50 × 50 μm) on a counting grid (size of 120 × 160 μm) and sampled using an 18 μm optical dissector with 2 μm upper and lower guard zones. Every other slide was stained for TH/Hoechst 33258. A DA neuron was defined as a TH-immunoreactive cell body with a clearly visible TH-negative nucleus.
Immunocytochemistry.
Cells were fixed with 4% paraformaldehyde, permeabilized with TBS containing 3% gelatin from cold water fish skin (CWFS) (Sigma), 1% BSA, and 0.3% Triton X-100, blocked with TBS containing 3% CWFS and 1% BSA. Primary antibody incubations were done for 24 h at 4°C with primary antibodies diluted in antibody diluent (TBS containing 3% CWFS, 1% BSA, and 0.1% Triton X-100), anti-RGS10 (1:250), anti-CD68 (1:250), or anti-TH (1:250). The bound primary antibody was visualized on a fluorescence microscope after incubation with an appropriate Invitrogen Alexa-conjugated secondary antibody (1:1000). Nuclei were counterstained with 0.5 μg/ml Hoechst 33258. Stained cells were coverslipped with aqueous-based mounting medium with antifade reagent (Biomeda). Images were captured with a CoolSnap CCD ES monochromatic camera and analyzed with MetaMorph software (Molecular Devices). Each experimental set was repeated three times.
Target effector assay.
Murine microglial BV2 cells were cultured in the presence of various concentrations of LPS for 24 h. The murine MN9D dopaminergic cell line was plated in flat-bottomed 96-well plates at a density of 7 × 10³ cells per well. Conditioned medium (CM) from BV2 cells was transferred into wells containing adherent MN9D cells followed by incubation for 2 d at 37°C in a humidified atmosphere of 5% CO2. Cell viability was measured by using the CellTiter 96 AQueous Assay reagent (Promega). This reagent uses the novel tetrazolium compound 3-(4,5-dimethylthiazol-2-yl)-5-(3-carboxymethoxyphenyl)-2-(4-sulfophenyl)-2H-tetrazolium inner salt (MTS) and the electron-coupling reagent phenazine methosulfate. MTS is chemically reduced by cells into formazan, which is soluble in tissue culture medium. The measurement of the absorbance of the formazan was performed in multititer 96-well plates at 492 nm during the last 2–4 h of a 2 d culture. Each experimental condition was performed in triplicate (or quadruplicate in the case of experiments involving differentiated MN9D cells), and three to four independent experiments were conducted to confirm the results.
Quantitative real-time PCR array.
Microglia from WT and RGS10−/− mice were cultured as mentioned above and plated at 5 × 10⁵ cells per well in a six-well plate in DMEM/F-12 with 10% FBS and stimulated with or without LPS (10 ng/ml) for 6 h. RNA was harvested using Qiagen RNeasy mini kit and converted into first-strand cDNA using RT2 First Strand Kit (SuperArray Bioscience Corporation). Quantitative real-time PCR was performed using an ABI Prism 7900HT Fast Detection System (Applied Biosystems). Each 10 μl reaction was performed in 384-well format of Mouse Inflammatory Cytokines and Receptors RT2 Profiler PCR Array (SuperArray Bioscience Corporation; catalog #PAMM-011). The PCR mix was denatured at 95°C for 10 min before the first PCR cycle. The thermal cycle profile was denaturation for 15 s at 95°C and annealing for 60 s at 60°C. A total of 40 PCR cycles were performed. The resulting threshold cycle values for all wells were analyzed using the Data Analysis Template Excel file provided by SuperArray Bioscience Corporation.
Real-time quantitative PCR.
Real-time quantitative PCR (QPCR) was performed as described below. Total RNA was isolated from cultured cells or mouse tissues using RNA Stat-60 (Tel-Test), treated with DNase I (Invitrogen), and reverse transcribed using Superscript II RNase H-reverse transcriptase (Invitrogen). RNA concentration was determined by absorbance at 260 nm. Quantitative real-time PCR was performed using an ABI Prism 7900HT Fast Detection System (Applied Biosystems). Each 10 μl reaction was performed in 384-well format with 25 ng of cDNA, 5 μl of SYBR green PCR Master Mix (Applied Biosystems), and a concentration of 150 nm of each PCR primer. All reactions were performed in triplicate. The mRNA expression levels were normalized to those of the mouse house-keeping gene cyclophilin B. Oligonucleotide primers were obtained from Integrated DNA Technologies. The following mouse primers were used for gene amplification: TNF, inducible nitric oxide synthase (iNOS), IL-1β, cyclooxygenase 1 (Cox-1), RGS10, Fas, and Cox-2. Primer sequences are available on request.
Electrophoresis and immunoblots.
Cells were lysed with 1% NP-40, 10 mm Tris, pH 7.4, 150 mm NaCl, 100 μg/ml PMSF, and protease inhibitor mix (Sigma) for 30 min on ice. The lysates were electrophoretically separated on a 4–10% SDS-PAGE gel (Invitrogen). Membranes were probed with RGS10 mAb (C-20) and anti-α-tubulin (Santa Cruz Biotechnology) followed by the appropriate secondary antibody linked to horseradish peroxidase (HRP). Immunoreactive bands were visualized with a chemiluminescent HRP substrate (ChemiGlow; Pierce Biotechnology) according to the manufacturer's instructions.
Mouse inflammatory cytokine multiplexed assay.
Murine microglial BV2 cells were cultured in the presence of various concentrations of LPS for 24 h. CM from BV2 cells was used to measure the production of cytokines including murine interferon-γ, IL-1β, IL-6, IL-10, IL-12, KC, and TNF using a multiplex assay per the manufacturer's instructions (Meso Scale Discovery).
Oligonucleotide arrays.
Murine BV2 microglia transfected with scrambled control siRNA or with siRNA specific for RGS10 were cultured in the presence or absence of LPS (10 ng/ml) for 6 h. Total cellular RNA was isolated using the RNA STAT-60 reagent (Tel-Test). The mouse Th1-Th2-Th3 cytokine array was obtained from SuperArray Bioscience Corporation and was performed according to the manufacturer's instructions. Briefly, 2 μg of total RNA was used for generating the biotin-16-UTP (Roche)-labeled cRNA. Biotinylated cRNAs were used as probes, and hybridization was performed as per the manufacturer's instructions. The arrays were exposed to an Alpha Innotech FluorChem Image system for image correction and analyzed using GEArray Expression Analysis Suite (SuperArray Bioscience Corporation). The level of expression for each gene was determined from the average density, where the mean was normalized to a value of 100 and the minimum positive value was 10. To perform background correction, the lowest average density spot on the array was found and set as the minimum value. Normalization was performed using glyceraldehyde-3-phosphate dehydrogenase with comparable results. Comparison of the two arrays was performed using a fold ratiometric analysis (x/y).
Statistical analysis.
Statistical analysis was done using two-tailed Student's t test; a p value of 0.05 or less was considered significant.
Results
RGS10 deficiency contributes to increased microglial burden in the CNS
Based on the observation that microglia display high levels of RGS10 as measured by in situ hybridization (Waugh et al., 2005), we hypothesized that loss of RGS10 may result in dysregulation of microglia number and/or microglia activation in the CNS. To test this hypothesis, we isolated microglial populations at P6 from brains of RGS10-deficient mice or wild-type littermate mice and performed quantitative flow cytometry with a pan-microglial marker (CD11b) and an activation marker (F4/80). Our results indicated both an increase in the CD11b-positive population and an increase in the F4/80-positive population (Fig. 1A). To extend these findings and to investigate the extent of regional differences in microglial burden, we performed immunofluorescence labeling of microglia in brain sections of RGS10-deficient mice and WT littermates with pan-microglial and activation-specific microglial markers. Remarkably, anti-CD68 labeling revealed a marked increase in the microglial burden in the CNS of RGS10-deficient mice, in areas including forebrain regions, such as the neocortex and hippocampus, as well as the ventral midbrain (Fig. 1B). Together, immunohistological and flow-cytometric analyses indicate increased microglial density and activation status in RGS10-deficient mouse brains, implicating RGS10 as an important regulator of microglia proliferation and/or activation responses. To investigate this possibility directly, we isolated microglia from brains of RGS10-deficient and wild-type mice and performed quantitative PCR array analysis of inflammation-related gene expression in vitro under resting or LPS-stimulated conditions. Our results revealed dysregulation of a number of genes in RGS10-deficient microglia under basal conditions (including several chemokines, interleukins, and interleukin receptors) as well as dysregulated gene expression in response to an LPS challenge compared with microglia from wild-type littermates (Tables 1, 2). Therefore, results from these multiple approaches led us to conclude that RGS10 is an important regulator of microglial phenotype and may have important regulatory roles in neuroinflammatory processes.
Figure 1.

RGS10-deficient mice display increased microglial burden in the CNS. A, Brain tissues from WT (dotted line) and RGS10-deficient (solid line) mice were dissociated and stained as described in Materials and Methods. CD11b and F4/80 expression were analyzed using FACScan flow cytometry. B, Dark-field immunofluorescence photomicrographs of CD68 immunoreactivity in hippocampus, neocortex, and midbrain of WT (right) and RGS10−/− (left) mice. Dotted contours denote the approximate boundaries of the substantia nigra (SN) in the coronal sections shown. Scale bars, 250 μm. Inset, High-magnification image of microglia.
Table 1.
RGS10 regulates expression of chemokines and other inflammatory mediators

Quantitative PCR array analysis of chemokines and other inflammatory mediators in resting or LPS-stimulated primary microglia from WT and RGS10−/− mice were performed as described in Materials and Methods. Fold-up regulation is denoted in red, and fold-down regulation is denoted in green.
Table 2.
RGS10 regulates expression of interleukins and other inflammatory mediators
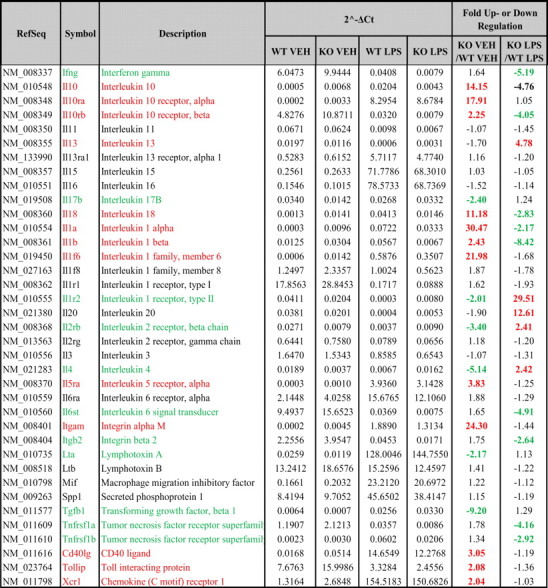
Quantitative PCR array analysis of specific interleukins and other inflammatory mediators in resting or LPS-stimulated primary microglia from WT and RGS10−/− mice were performed as described in Materials and Methods. Fold-up regulation is denoted in red, and fold-down regulation is denoted in green.
RGS10 deficiency increased vulnerability of the nigrostriatal pathway to inflammation-induced degeneration
The midbrain has one of the highest microglia densities in the CNS (Lawson et al., 1990), and midbrain DA neurons are extremely sensitive to inflammation-induced death (De Pablos et al., 2005; Tansey et al., 2007). Hence, we reasoned that if RGS10 is a key regulator of microglial activation, loss of RGS10 may result in dysregulated microglia and possibly nigrostriatal pathway degeneration. To test this idea, we exposed young adult (3–5 months old) mice to a chronic systemic LPS inflammogen regimen (7.5 × 10⁵ E.U./kg, i.p., twice weekly) previously reported to trigger neuroinflammation and increased microglial burden in the CNS (Kitazawa et al., 2005). Immunofluorescence analysis confirmed that systemic LPS exposure triggered a neuroinflammatory response independent of genotype, but microglia in RGS10-deficient brains were activated to a greater extent than microglia in brains from WT littermates as measured by the activation-specific marker F4/80 (data not shown). More importantly, when we compared midbrain sections stained with an antibody against TH, the SNpc of RGS10-deficient mice exposed to chronic systemic inflammation displayed reduced TH immunoreactivity compared with that of WT littermate mice exposed to the same regimen (Fig. 2B), suggesting increased vulnerability of the nigrostriatal pathway to inflammation-induced death in the absence of RGS10. Stereological quantification of TH-positive neurons in the SNpc of WT mice subjected to 6 weeks of systemic (i.p.) LPS injections exhibited only a marginal, not statistically significant loss of DA neurons in the SNpc (Fig. 2A) as expected based on their genetic background and the low dose and duration of LPS administered systemically (our unpublished observation). In contrast, RGS10-deficient mice exposed to chronic peripheral LPS displayed significant loss (43%) of nigral DA neurons compared with saline-injected RGS10-deficient mice, and a 47% decrease compared with saline-injected WT mice (p < 0.05) (Fig. 2A). The loss of DA neurons was restricted to the dorsal-lateral tier of the SNpc, a pattern reminiscent to that induced by MPTP, whereas the ventral tegmental area was relatively spared. Moreover, the RGS10-deficient DA neurons that survived the LPS regimen displayed signs of atrophy and degeneration compared with DA neurons in LPS-treated wild-type mice or saline-treated RGS10-deficient mice (Fig. 2B, insets). These findings suggest a protective role for RGS10 against inflammation-mediated cell death in the SNpc, raising the possibility that the loss of RGS10 in the CNS resulted in overproduction of microglial-derived neurotoxic mediators and contributed to the selective loss of DA neurons in the ventral midbrain.
Figure 2.

RGS10-deficient mice display nigral DA neuron loss in response to chronic systemic inflammation. A, Unbiased stereological analysis of the number of TH-positive neurons in the SNpc of RGS10−/− [knock-out (KO)] or wild-type littermate mice injected with saline (Sal) or LPS (7.5 × 10⁵ E.U./kg twice weekly) for 6 weeks. Values represent mean ± SEM. *p < 0.05. B, Immunofluorescence labeling of the dopaminergic marker TH in anatomically matched midbrain coronal sections from WT or RGS10-deficient mice injected with saline or LPS (7.5 × 10⁵ E.U./kg twice weekly). Insets, High-magnification images of DA neurons in SNpc. Scale bar, 250 μm.
RGS10 is expressed in microglia and dopaminergic neurons in the ventral midbrain
To probe the molecular mechanism by which RGS10 deletion renders nigral DA neurons susceptible to chronic inflammatory stimuli, we investigated the pattern of RGS10 expression in the ventral midbrain of WT mice. Expression of RGS10 protein in the rodent brain has been reported previously in neurons and microglia but not in astrocytes (Waugh et al., 2005). To confirm the expression of RGS10 in microglia and DA neurons, we performed dual-labeling immunofluorescence microscopy. RGS10 immunoreactivity in the cell body and nucleus of microglia was easily detected in CD68-positive microglial cells in midbrain regions of wild-type mice (Fig. 3A) but not in RGS10−/− mice in which RGS10 protein is undetectable (Fig. 3B), confirming the specificity of the RGS10 antibody. In addition, RGS10 immunoreactivity in TH-positive DA neurons of the ventral midbrain was detectable in wild-type mice (Fig. 3A) albeit at a lower intensity relative to that detected in microglia; as expected, RGS10−/− mice expressed no detectable RGS10 protein in DA neurons (Fig. 3B). The implication of these findings is that the neurodegenerative phenotype of RGS10-deficient mice could have resulted from loss of RGS10 function in either or both cell types.
Figure 3.

Cell-type specific expression of RGS10 protein in ventral midbrain of WT mice and cellular localization of microglial RGS10 in response to inflammatory stimuli. A, Single-channel and overlay images of immunofluorescence labeling for RGS10 (green) and the microglial marker CD68 (red) or RGS10 (green) and the dopaminergic neuron marker TH (red) in the ventral midbrain of wild-type mice. B, Single-channel and overlay images of dual-labeling immunofluorescence with RGS10 (green) and the microglial marker CD68 (red) or RGS10 (green) and the dopaminergic neuron marker TH (red) in the ventral midbrain of RGS10-deficient mice. Scale bar, 110 μm.
Inflammatory stimuli regulate RGS10 localization and protein levels in microglia
Given the RGS10 enrichment in microglia, we performed in vitro studies with primary microglial cells to investigate whether expression and localization of RGS10 were modulated by inflammatory stimuli. In resting primary microglia, RGS10 was expressed throughout cytoplasmic and nuclear compartments. After stimulation with low-dose LPS (10 ng/ml), microglia (CD68-positive cells) became activated and adopted an ameboid shape (Fig. 4A). The activation phenotype coincided with rapid and robust nuclear enrichment of RGS10 discernible by 24 h after stimulation (Fig. 4A, insets). In the continued presence of LPS, overall levels of RGS10 decreased by as much as 50% relative to α-tubulin as measured by quantitative immunoblot analysis (Fig. 4B). We confirmed and extended these observations in the murine BV2 microglial cell line. Interestingly, we found that chronic activation of BV2 microglia with low-dose (10 ng/ml) LPS (Fig. 5A), but not with high-dose (1 μg/ml) LPS (Fig. 5B), induced rapid downregulation of RGS10 protein levels in BV2 microglial cells. In agreement with results obtained in primary microglia, immunofluorescence labeling of BV2 microglia with anti-RGS10 antibody and nuclear bis-benzimide (Hoechst 33258) counterstain revealed that RGS10 was localized to both nuclear and cytoplasmic compartments in resting BV2 microglia (Fig. 5C). Next, we investigated whether the time-dependent LPS-induced downregulation of RGS10 protein levels could be mimicked by another classical immune activator and known LPS effector, TNF. Stimulation of BV2 microglia with TNF (10 ng/ml) also resulted in decreased levels of RGS10 protein relative to α-tubulin as measured by immunoblotting analysis (Fig. 5D). These findings suggest that RGS10 protein turnover in microglia is regulated by at least two key neuroimmune modulators and may be differentially regulated by stimuli of different duration and strengths.
Figure 4.

Inflammatory stimuli regulate RGS10 protein localization in primary microglia. A, Single-channel and overlay images of dual-labeling immunofluorescence with the microglial marker CD68 (red) and RGS10 (green) in primary microglia from brains of WT mice after 24 or 48 h LPS (10 ng/ml) treatment in vitro. Insets, High-magnification images of primary microglia. Scale bar, 55 μm. B, Immunoblot analysis of RGS10 protein expression (normalized to α-tubulin) in primary microglia in response to LPS (10 ng/ml) treatment. Veh, Vehicle.
Figure 5.

Inflammatory stimuli regulate RGS10 protein levels in BV2 microglial cells. A, Western blot analysis of RGS10 protein expression (normalized to α-tubulin) in the BV2 microglia cell line indicates downregulation of RGS10 in response to low (10 ng/ml) LPS. B, Western blot analysis of RGS10 protein expression (normalized to α-tubulin) in the BV2 microglia cell line indicates no change in RGS10 levels in response to high (1 μg/ml) LPS. C, Phase-contrast and immunofluorescence dual-labeling (DAPI/RGS10) images of BV2 microglial cells treated with low or high LPS for 48 h. Scale bar, 55 μm. D, Western blot analysis of RGS10 protein expression (normalized to α-tubulin) in BV2 microglia cells in response to TNF (10 ng/ml) treatment. Veh, Vehicle.
Loss of RGS10 protein in BV2 microglia results in dysregulation of proinflammatory gene expression
It has been proposed that the functional outcome of microglial activation on neuronal survival in the brain may depend on the nature of the initiating stimulus. Specifically, acute inflammatory stimuli (mimicked by high-dose LPS in vitro) may elicit a protective microglial phenotype to limit tissue damage, whereas a chronic inflammatory stimulus (mimicked by low-dose LPS in vitro) may promote a neurotoxic microglial phenotype associated with overproduction of proapoptotic inflammatory mediators that activate lipid peroxidation, oxidative stress, and cellular dysfunction (Wyss-Coray, 2006). We hypothesized that RGS10 functions to regulate microglia activation or phenotype switching; therefore, loss of RGS10 should result in dysregulated inflammation-related gene expression. To test this hypothesis, we first performed oligonucleotide arrays to investigate the inflammation-related gene expression profile of BV2 microglial cells under resting versus LPS-stimulated conditions after transfection with siRNA specific for RGS10 or a scrambled siRNA control. In agreement with our results of gene expression analyses in isolated microglia from RGS10-deficient mice, we found that siRNA-mediated specific knockdown of RGS10 resulted in dysregulated expression of several chemokine, interleukins, and SOCS genes under resting conditions relative to control scrambled knockdown as well as dysregulated expression of these or other inflammation-related genes after LPS treatment (supplemental Table 1, available at www.jneurosci.org as supplemental material). To validate and extend these findings, we next established the time course of expression of several LPS-induced inflammation-related genes by QPCR in BV2 microglia to determine an optimal time window during which to survey for dysregulated expression after RGS10 knockdown. On the basis of these results (supplemental Fig. S1, available at www.jneurosci.org as supplemental material), we reasoned that loss of RGS10 may result in persistent rather than transient expression of cytokines such as TNF or IL-1β and/or premature expression of enzymes with characteristic delayed expression such as Cox-1 and iNOS. Therefore, we performed siRNA-mediated knockdown of RGS10 in BV2 microglia (Fig. 6A) and investigated its effect on mRNA expression of candidate inflammation-related genes 24 h after LPS stimulation and 48 h after control or RGS10-specific knockdown (Fig. 6B). Transfection of siRNA against RGS10 into BV2 microglial cells resulted in rapid reduction (∼50%) of RGS10 mRNA (Fig. 6C). Immunoblot analysis revealed that overall RGS10 protein levels were drastically reduced by 24 h, followed by a gradual recovery of the protein to resting levels by 96 h (Fig. 6A), suggesting a rapid turnover of RGS10 in microglial cells. Immunocytochemical analysis of RGS10 protein in BV2 microglia confirmed the high efficiency of the knockdown by the siRNA directed against RGS10; a scrambled siRNA (control A) demonstrated the specificity of the knockdown (supplemental Fig. S2, available at www.jneurosci.org as supplemental material). Real-time quantitative PCR analyses indicated that specific knockdown of RGS10 in microglia resulted in altered regulation of basal and/or LPS-stimulated mRNA levels of key inflammation-related genes, including statistically significant increases in LPS-induced expression of TNF, IL-1β, and Fas; a trend for increased LPS-induced expression of iNOS and Cox-1 that did not reach statistical significance; and no change in Cox-2 mRNA (Fig. 6D). Together, our findings suggest that one important function of RGS10 in activated microglia may be to regulate the synthesis of a subset of microglial genes that encode soluble mediators with toxic activities toward DA neurons. Given the dynamic pattern of gene expression after LPS stimulation, a more detailed time-course analysis after RGS10 knockdown should reveal additional information to critically test a role for RGS10 in regulation of gene transcription during microglial activation responses. In light of the fact that a number of studies have demonstrated that activated glial cells participate in the degeneration of DA neurons (Akiyama and McGeer, 1989; Herrera et al., 2000; He et al., 2001; Castaño et al., 2002; Depino et al., 2003), our results suggest that RGS10 may represent a novel target for drug development aimed at modulating microglial phenotype and protecting vulnerable neuronal populations from inflammation-induced cell death.
Figure 6.

Silencing RGS10 protein in BV2 microglia dysregulates inflammatory gene expression. A, Western blot analysis of RGS10 protein expression (normalized to α-tubulin) in BV2 microglia after silencing using siRNA interference. B, Schematic of experimental design to probe the effects of RGS10 knockdown on inflammation-induced gene expression and inflammatory factor production. C, Real-time quantitative PCR analysis of RGS10 mRNA in BV2 cells transfected with scrambled (control) siRNA (siCon) or RGS10 siRNA (siRGS10). D, Real-time quantitative PCR analysis of inflammatory-related genes in BV2 microglia 48 h after control or RGS10 knockdown in cells stimulated with vehicle or LPS for 24 h. Levels of each mRNA were normalized to those of the mouse house-keeping gene cyclophilin B. Values shown are group means ± SEM of three independent treatment conditions in one experiment representative of three independent experiments. *Significant difference between the vehicle and LPS at p < 0.05; #significant difference between control knockdown and RGS10 knockdown condition at p < 0.05. Veh, Vehicle.
RGS10 protects DA cells by limiting microglial production of inflammatory cytokines
We reasoned that if RGS10 is a regulator of microglial phenotype, and therefore a critical determinant of the functional outcome of microglial activation on DA neuron survival, acute knockdown of RGS10 in microglia may impact the viability of DA neurons in a target-effector cell assay. We used BV2 microglia as effector cells and the dopaminergic cell line (MN9D) as a target cell to investigate the effect of acute RGS10 knockdown in each cell type on dopaminergic cell viability (Fig. 7A). BV2 microglia and MN9D cells were chosen for these experiments because they can be transfected with high efficiency. More importantly, MN9D cells express TH (supplemental Fig. S3, available at www.jneurosci.org as supplemental material) and can be induced to exit the cell cycle and undergo terminal differentiation by exposure to valproic acid, making them a suitable DA neuron-like cell model. Functional assays indicated that CM from LPS-treated BV2 microglia induced robust death of MN9D cells in a dose-dependent manner with kinetics similar to that displayed by primary DA neurons from ventral midbrain (data not shown). MN9D toxicity induced by CM of BV2 cells stimulated with low LPS (10 ng/ml) was markedly enhanced by knockdown of RGS10 in BV2 microglia (Fig. 7B), suggesting that one function of RGS10 in microglia is to limit production of soluble neurotoxic mediators.
Figure 7.

Silencing RGS10 protein in BV2 microglia or dopaminergic MN9D cells enhances inflammation-induced dopaminergic cell death and neutralization of TNF signaling abolishes RGS10-mediated enhancement of microglial cytotoxicity on dopaminergic cells. A, Schematic of functional assay design using BV2 microglia cells as effector cells and MN9D dopaminergic cells as target cells. B, Viability of MN9D target cells 48 h after addition of CM of LPS-treated (24 h) control siRNA-transfected BV2 microglia effector cells versus RGS10 siRNA-transfected BV2 microglia effector cells. Viability of MN9D cells was measured by MTS incorporation during the last 4 h of a 2 d culture. Values represent group means ± SEM of triplicate cultures and are representative of three independent experiments. *Significant difference between the vehicle and LPS at p < 0.05; #significant difference between control knockdown and RGS10 knockdown conditions at p < 0.05. C, MN9D cells were transfected with control siRNA or RGS10 siRNA. Survival of MN9D cells 48 h after transfer of CM from saline- or LPS-treated (24 h) BV2 microglia onto MN9D cells was measured by MTS incorporation during the last 4 h of a 2 d culture. Values shown represent group means ± SEM of triplicate treatments and are representative of three independent experiments. *Significant difference between the vehicle and LPS at p < 0.05; #significant difference between control knockdown and RGS10 knockdown conditions at p < 0.05. D, Addition of the TNF decoy receptor etanercept (200 ng/ml) to BV2 microglial cultures during costimulation with LPS to neutralize microglial-derived soluble TNF in the CM promotes greater viability of MN9D target cells and abolishes the RGS10-mediated enhanced cytotoxicity. Cell viability was measured by MTS incorporation assay during the last 4 h of a 2 d culture. Values shown represent group means ± SEM for triplicate wells and are representative of three independent experiments. *Significant difference between LPS and LPS + etanercept at p < 0.05; #significant difference between control knockdown and RGS10 knockdown LPS-treated conditions at p < 0.05. siRGS10, RGS10 siRNA; Veh, vehicle; Etan, etanercept.
Although we found that wild-type microglia express higher levels of RGS10 relative to midbrain DA neurons, the increased vulnerability of nigral DA neurons in RGS10-deficient mice to inflammation-induced degeneration compelled us to rule out a regulatory role for RGS10 in dopaminergic cells during chronic inflammatory stress. To investigate whether removal of RGS10 influences dopaminergic survival, we performed siRNA-mediated knockdown of RGS10 in MN9D cells and then assayed their sensitivity to CM from BV2 microglial cells stimulated with saline or LPS. Surprisingly, knockdown of RGS10 in MN9D dopaminergic cells rendered them more susceptible to the death-inducing effects of LPS-treated BV2 microglia CM (Fig. 7C).
The enhanced toxicity of the CM from RGS10-deficient BV2 microglia on dopaminergic cells suggested that acute loss of RGS10 may have resulted in enhanced production of soluble microglial-derived neurotoxic mediators and/or reduced production of microglial-derived protective factors in the CM. Although the exact molecular mechanism(s) by which loss of RGS10 in microglial cells compromised dopaminergic cell survival remained unclear, QPCR results in microglia (Fig. 6D) implicated cytokines such as TNF and IL-1β as the most likely candidates for mediating enhanced dopaminergic cytotoxicity. To test this possibility, we investigated whether acute knockdown of RGS10 in BV2 microglia resulted in enhanced production of inflammatory mediators.
Multiplexed immunoassays revealed that CM of LPS-treated BV2 cells contained significant amounts of soluble TNF in a physiologically relevant concentration range and modestly increased levels (but not statistically significantly) of several other cytokines including IL-1β, IL-6, IL-10, IL-12, and the chemokine CXCL1 also known as KC or GRO-1 (Fig. 8). The siRNA-mediated knockdown of RGS10 in BV2 microglia enhanced production of neurotoxic mediators and, in particular, TNF. Given that previous studies revealed soluble TNF to be a critical mediator of 6-hydroxydopamine-induced nigral DA neuron death in vivo and in vitro (McCoy et al., 2006), we investigated the extent to which this inflammatory cytokine could account for the RGS10-dependent enhanced cytotoxicity of the CM of LPS-treated BV2 microglia on MN9D dopaminergic cells. Using the soluble decoy TNF receptor drug etanercept (200 ng/ml) to deplete soluble TNF from the CM of LPS-stimulated BV2 microglia, we found that blocking TNF action abolished the cytotoxic effect of CM collected after an LPS stimulus from both control and RGS10-depleted BV2 microglia (Fig. 7D). Consistent with a robust rescue by addition of the TNF inhibitor, parallel experiments demonstrated that other inflammatory mediators (i.e., IL-6 and IL-1β) played a minor role in LPS-induced toxicity in MN9D cells (data not shown).
Figure 8.

RGS10 limits production of microglial TNF and other inflammatory mediators. CM of LPS-treated (24 h) control siRNA-transfected BV2 microglia versus RGS10 siRNA-transfected BV2 microglia analyzed with a mouse proinflammatory cytokine multiplex panel (Meso Scale Discovery) showed the specificity of TNF increases after siRNA-mediated knockdown of RGS10. Values shown are group means ± SEM of three independent treatment conditions run in duplicate in one experiment representative of three independent experiments. *Significant difference between vehicle and LPS-treated condition at p < 0.05; #significant difference between control knockdown and RGS10 knockdown at p < 0.05. siControl, Control siRNA; siRGS10, RGS10 siRNA; Veh, vehicle.
In summary, in vivo studies indicated that RGS10 deficiency resulted in increased microglial burden in the CNS and degeneration of nigral DA neurons in animals exposed to chronic systemic inflammation. Mechanistically, in vitro studies indicated that the loss of RGS10 resulted in an inflammatory-neurodegenerative process that begins with upregulation of inflammation-related genes, followed by overproduction of microglial-derived inflammatory mediators with known cytotoxic effects on DA neurons, and enhanced sensitivity of DA neurons to microglial-derived inflammatory mediators. On the basis of these findings, we conclude that RGS10 is a key regulator of microglia stress responses in the CNS and thus a critical determinant of the functional outcome of neuroinflammatory events on DA neurons in the ventral midbrain. Targeting RGS10 activity may represent a novel therapeutic approach to prevent onset and/or progression of PD in humans.
Discussion
RGS10 is expressed in microglia throughout the brain and in neurons involved in higher brain circuits located in hippocampus, striatum, and dorsal raphe, yet its function in the brain remains poorly defined. Together, our findings that RGS10-deficient mice display increased microglial burden and enhanced vulnerability to inflammation-induced nigrostriatal pathway degeneration demonstrate a novel regulatory role for RGS10 in determining the functional outcome of inflammation. Mechanistically, these findings suggest a protective role for RGS10 against inflammation-induced degeneration in the ventral midbrain. The differential regulation of RGS10 protein levels in response to low- versus high-dose LPS concentrations in vitro raises the interesting possibility that the strength and duration of TLR4 (toll-like receptor-4) activation triggers negative feedback loops that regulate RGS10 stability or turnover.
RGS10 ablation in microglia resulted in overproduction of soluble TNF, which is toxic to ventral midbrain DA neurons; and removal of RGS10 from dopaminergic cells heightened their sensitivity to inflammation-induced death. Therefore, the increased vulnerability of the nigrostriatal pathway of RGS10-null mice to the neurotoxic effects of chronic neuroinflammation is likely a result of synergistic loss of RGS10 function in both ventral DA neurons and microglia. Ongoing experiments in primary ventral mesencephalon neuron cultures deficient for RGS10 are aimed at extending these findings to elucidate the exact molecular and signaling mechanisms by which RGS10 modulates DA neuron survival and microglial activation. A recent report indicated that RGS10-deficient mice exhibited impaired osteoclast differentiation and severe osteopetrosis (increased bone density) because of the absence of RGS10-dependent calcium current oscillations and loss of NFATc1 (nuclear factor of activated T cells c1) expression (Yang and Li, 2007). Therefore, we speculate that RGS10 may play an important role in the regulation of intracellular calcium oscillations in neurons. Although future studies will reveal whether RGS10 has similar roles in DA neurons, the data presented here strongly suggest that RGS10 function in microglia and neurons serves a protective role against inflammation-induced degeneration in the nigrostriatal pathway.
To date, the primary function of RGS proteins is believed to be the regulation of heterotrimeric G-protein signaling at the plasma membrane. Coimmunoprecipitation studies demonstrated that RGS10 associates specifically with activated forms of Gαi3 and Gαz but not with activated Gαs (Hunt et al., 1996). However, our findings as well as those of others (Chatterjee and Fisher, 2000; Burgon et al., 2001; Waugh et al., 2005) reveal that RGS proteins translocate to the nucleus and are found at high abundance at other intracellular sites. Specifically, it has been reported that phosphorylation of RGS10 at serine 168 by the cAMP-dependent PKA (protein kinase A) leads to translocation of RGS10 from the cytosol to the nucleus, thereby nullifying RGS10 activity at the plasma membrane necessary for RGS10 modulation of G-protein-dependent activation of GIRK (G-protein-gated inwardly rectifying potassium channel) (Burgon et al., 2001). These data suggest that RGS proteins possess functions that go beyond regulating heterotrimeric G-protein signaling. Indeed, our findings raise the interesting possibility that RGS10 might function to regulate microglial stress responses through mechanisms that include changes in gene transcription. Experiments are in progress to investigate the relative contribution of transcriptional versus posttranslational events in the RGS10-dependent modulation of microglial activation responses.
The significance of our findings is twofold: first, RGS10 emerges as a molecular switch important for the regulation of microglial stress responses and DA neuron sensitivity to inflammatory stimuli. Second, our findings implicate age-dependent or neuroinflammation-induced loss of RGS10 as a risk factor for idiopathic PD. Specifically, our observations that chronic inflammatory stimuli downregulate RGS10 protein expression in microglia raise the interesting possibility that inflammation in the aging brain may contribute to dysregulation of microglial activation responses and overproduction of neurotoxic cytokines. Hence, a possible long-term consequence of having a self-propelling cycle of neuroinflammation in the midbrain may be to predispose an aging individual to nigrostriatal degeneration and development of PD. A better understanding of the normal function of RGS10 in the CNS along with proof-of-concept studies to demonstrate that manipulation of RGS10 levels and/or its activity in the ventral midbrain has positive effects on DA neuron survival without exerting untoward effects on other cell types may reveal its potential as a therapeutic target for blocking or delaying the progressive loss of nigrostriatal DA neurons in PD.
Footnotes
This work was supported by Grant 5R01 NS049433-02 (M.G.T.) from the National Institute of Neurological Disorders and Stroke–National Institutes of Health. We thank Bryan Potts for assistance with animal studies; Thi Tran for assistance with real-time QPCR; Eric Nestler in the Department of Psychiatry for his support in obtaining RGS10-null mice; Jonathan R. Weinstein and Thomas Moeller at the University of Washington for communicating unpublished data on the potential of RGS10 regulation in a microglia cell line in response to inflammatory stimuli; and Jeff Waugh in the Gold laboratory and members of the Tansey laboratory for useful discussions.
References
- Akiyama H, McGeer PL. Microglial response to 6-hydroxydopamine-induced substantia nigra lesions. Brain Res. 1989;489:247–253. doi: 10.1016/0006-8993(89)90857-3. [DOI] [PubMed] [Google Scholar]
- Berman DM, Wilkie TM, Gilman AG. GAIP and RGS4 are GTPase-activating proteins for the Gi subfamily of G protein alpha subunits. Cell. 1996;86:445–452. doi: 10.1016/s0092-8674(00)80117-8. [DOI] [PubMed] [Google Scholar]
- Block ML, Hong JS. Microglia and inflammation-mediated neurodegeneration: multiple triggers with a common mechanism. Prog Neurobiol. 2005;76:77–98. doi: 10.1016/j.pneurobio.2005.06.004. [DOI] [PubMed] [Google Scholar]
- Burgon PG, Lee WL, Nixon AB, Peralta EG, Casey PJ. Phosphorylation and nuclear translocation of a regulator of G protein signaling (RGS10) J Biol Chem. 2001;276:32828–32834. doi: 10.1074/jbc.M100960200. [DOI] [PubMed] [Google Scholar]
- Castaño A, Herrera AJ, Cano J, Machado A. The degenerative effect of a single intranigral injection of LPS on the dopaminergic system is prevented by dexamethasone, and not mimicked by rh-TNF-alpha, IL-1beta and IFN-gamma. J Neurochem. 2002;81:150–157. doi: 10.1046/j.1471-4159.2002.00799.x. [DOI] [PubMed] [Google Scholar]
- Chao CC, Hu S, Ehrlich L, Peterson PK. Interleukin-1 and tumor necrosis factor-alpha synergistically mediate neurotoxicity: involvement of nitric oxide and of N-methyl-d-aspartate receptors. Brain Behav Immun. 1995;9:355–365. doi: 10.1006/brbi.1995.1033. [DOI] [PubMed] [Google Scholar]
- Chatterjee TK, Fisher RA. Cytoplasmic, nuclear, and golgi localization of RGS proteins. Evidence for N-terminal and RGS domain sequences as intracellular targeting motifs. J Biol Chem. 2000;275:24013–24021. doi: 10.1074/jbc.M002082200. [DOI] [PubMed] [Google Scholar]
- De Pablos RM, Herrera AJ, Villarán RF, Cano J, Machado A. Dopamine-dependent neurotoxicity of lipopolysaccharide in substantia nigra. FASEB J. 2005;19:407–409. doi: 10.1096/fj.04-2153fje. [DOI] [PubMed] [Google Scholar]
- Depino AM, Earl C, Kaczmarczyk E, Ferrari C, Besedovsky H, del Rey A, Pitossi FJ, Oertel WH. Microglial activation with atypical proinflammatory cytokine expression in a rat model of Parkinson's disease. Eur J Neurosci. 2003;18:2731–2742. doi: 10.1111/j.1460-9568.2003.03014.x. [DOI] [PubMed] [Google Scholar]
- Ferger B, Leng A, Mura A, Hengerer B, Feldon J. Genetic ablation of tumor necrosis factor-alpha (TNF-alpha) and pharmacological inhibition of TNF-synthesis attenuates MPTP toxicity in mouse striatum. J Neurochem. 2004;89:822–833. doi: 10.1111/j.1471-4159.2004.02399.x. [DOI] [PubMed] [Google Scholar]
- Gao HM, Jiang J, Wilson B, Zhang W, Hong JS, Liu B. Microglial activation-mediated delayed and progressive degeneration of rat nigral dopaminergic neurons: relevance to Parkinson's disease. J Neurochem. 2002;81:1285–1297. doi: 10.1046/j.1471-4159.2002.00928.x. [DOI] [PubMed] [Google Scholar]
- Gibbons HM, Dragunow M. Microglia induce neural cell death via a proximity-dependent mechanism involving nitric oxide. Brain Res. 2006;1084:1–15. doi: 10.1016/j.brainres.2006.02.032. [DOI] [PubMed] [Google Scholar]
- Gold SJ, Ni YG, Dohlman HG, Nestler EJ. Regulators of G-protein signaling (RGS) proteins: region-specific expression of nine subtypes in rat brain. J Neurosci. 1997;17:8024–8037. doi: 10.1523/JNEUROSCI.17-20-08024.1997. [DOI] [PMC free article] [PubMed] [Google Scholar]
- Gold SJ, Hoang CV, Potts BW, Porras G, Pioli E, Kim KW, Nadjar A, Qin C, LaHoste GJ, Li Q, Bioulac BH, Waugh JL, Gurevich E, Neve RL, Bezard E. RGS9-2 negatively modulates l-3,4-dihydroxyphenylalanine-induced dyskinesia in experimental Parkinson's disease. J Neurosci. 2007;27:14338–14348. doi: 10.1523/JNEUROSCI.4223-07.2007. [DOI] [PMC free article] [PubMed] [Google Scholar]
- He Y, Appel S, Le W. Minocycline inhibits microglial activation and protects nigral cells after 6-hydroxydopamine injection into mouse striatum. Brain Res. 2001;909:187–193. doi: 10.1016/s0006-8993(01)02681-6. [DOI] [PubMed] [Google Scholar]
- Herrera AJ, Castaño A, Venero JL, Cano J, Machado A. The single intranigral injection of LPS as a new model for studying the selective effects of inflammatory reactions on dopaminergic system. Neurobiol Dis. 2000;7:429–447. doi: 10.1006/nbdi.2000.0289. [DOI] [PubMed] [Google Scholar]
- Hunt TW, Fields TA, Casey PJ, Peralta EG. RGS10 is a selective activator of G alpha i GTPase activity. Nature. 1996;383:175–177. doi: 10.1038/383175a0. [DOI] [PubMed] [Google Scholar]
- Jakobsdottir J, Conley YP, Weeks DE, Mah TS, Ferrell RE, Gorin MB. Susceptibility genes for age-related maculopathy on chromosome 10q26. Am J Hum Genet. 2005;77:389–407. doi: 10.1086/444437. [DOI] [PMC free article] [PubMed] [Google Scholar]
- Kitazawa M, Oddo S, Yamasaki TR, Green KN, LaFerla FM. Lipopolysaccharide-induced inflammation exacerbates tau pathology by a cyclin-dependent kinase 5-mediated pathway in a transgenic model of Alzheimer's disease. J Neurosci. 2005;25:8843–8853. doi: 10.1523/JNEUROSCI.2868-05.2005. [DOI] [PMC free article] [PubMed] [Google Scholar]
- Lawson LJ, Perry VH, Dri P, Gordon S. Heterogeneity in the distribution and morphology of microglia in the normal adult mouse brain. Neuroscience. 1990;39:151–170. doi: 10.1016/0306-4522(90)90229-w. [DOI] [PubMed] [Google Scholar]
- Ling Z, Gayle DA, Ma SY, Lipton JW, Tong CW, Hong JS, Carvey PM. In utero bacterial endotoxin exposure causes loss of tyrosine hydroxylase neurons in the postnatal rat midbrain. Mov Disord. 2002;17:116–124. doi: 10.1002/mds.10078. [DOI] [PubMed] [Google Scholar]
- Ling Z, Zhu Y, Tong C, Snyder JA, Lipton JW, Carvey PM. Progressive dopamine neuron loss following supra-nigral lipopolysaccharide (LPS) infusion into rats exposed to LPS prenatally. Exp Neurol. 2006;199:499–512. doi: 10.1016/j.expneurol.2006.01.010. [DOI] [PubMed] [Google Scholar]
- Liu B, Gao HM, Wang JY, Jeohn GH, Cooper CL, Hong JS. Role of nitric oxide in inflammation-mediated neurodegeneration. Ann N Y Acad Sci. 2002;962:318–331. doi: 10.1111/j.1749-6632.2002.tb04077.x. [DOI] [PubMed] [Google Scholar]
- McCoy MK, Martinez TN, Ruhn KA, Szymkowski DE, Smith CG, Botterman BR, Tansey KE, Tansey MG. Blocking soluble tumor necrosis factor signaling with dominant-negative tumor necrosis factor inhibitor attenuates loss of dopaminergic neurons in models of Parkinson's disease. J Neurosci. 2006;26:9365–9375. doi: 10.1523/JNEUROSCI.1504-06.2006. [DOI] [PMC free article] [PubMed] [Google Scholar]
- McGeer PL, McGeer EG. Glial reactions in Parkinson's disease. Mov Disord. 2008;23:474–483. doi: 10.1002/mds.21751. [DOI] [PubMed] [Google Scholar]
- McGeer EG, Klegeris A, McGeer PL. Inflammation, the complement system and the diseases of aging. Neurobiol Aging. 2005;26(Suppl 1):94–97. doi: 10.1016/j.neurobiolaging.2005.08.008. [DOI] [PubMed] [Google Scholar]
- Moss DW, Bates TE. Activation of murine microglial cell lines by lipopolysaccharide and interferon-gamma causes NO-mediated decreases in mitochondrial and cellular function. Eur J Neurosci. 2001;13:529–538. doi: 10.1046/j.1460-9568.2001.01418.x. [DOI] [PubMed] [Google Scholar]
- Mrak RE, Griffin WS. Glia and their cytokines in progression of neurodegeneration. Neurobiol Aging. 2005;26:349–354. doi: 10.1016/j.neurobiolaging.2004.05.010. [DOI] [PubMed] [Google Scholar]
- Mrak RE, Griffin WS. Common inflammatory mechanisms in Lewy body disease and Alzheimer disease. J Neuropathol Exp Neurol. 2007;66:683–686. doi: 10.1097/nen.0b013e31812503e1. [DOI] [PubMed] [Google Scholar]
- Olanow CW. The pathogenesis of cell death in Parkinson's disease-2007. Mov Disord. 2007;22:S335–S342. doi: 10.1002/mds.21675. [DOI] [PubMed] [Google Scholar]
- Przedborski S. Pathogenesis of nigral cell death in Parkinson's disease. Parkinsonism Relat Disord. 2005;11(Suppl 1):S3–S7. doi: 10.1016/j.parkreldis.2004.10.012. [DOI] [PubMed] [Google Scholar]
- Puntambekar SS, Doose JM, Carson MJ. Microglia: a CNS-specific tissue macrophage. In: Lane TE, Carson M, Bergmann C, Wyss-Coray T, editors. Central nervous system diseases and inflammation. Ed 1. New York: Springer; 2008. pp. 1–12. [Google Scholar]
- Qin L, Wu X, Block ML, Liu Y, Breese GR, Hong JS, Knapp DJ, Crews FT. Systemic LPS causes chronic neuroinflammation and progressive neurodegeneration. Glia. 2007;55:453–462. doi: 10.1002/glia.20467. [DOI] [PMC free article] [PubMed] [Google Scholar]
- Ross EM, Wilkie TM. GTPase-activating proteins for heterotrimeric G proteins: regulators of G protein signaling (RGS) and RGS-like proteins. Annu Rev Biochem. 2000;69:795–827. doi: 10.1146/annurev.biochem.69.1.795. [DOI] [PubMed] [Google Scholar]
- Sawada M, Imamura K, Nagatsu T. Role of cytokines in inflammatory process in Parkinson's disease. J Neural Transm. 2006;(Suppl):373–381. doi: 10.1007/978-3-211-45295-0_57. [DOI] [PubMed] [Google Scholar]
- Schmidt S, Hauser MA, Scott WK, Postel EA, Agarwal A, Gallins P, Wong F, Chen YS, Spencer K, Schnetz-Boutaud N, Haines JL, Pericak-Vance MA. Cigarette smoking strongly modifies the association of LOC387715 and age-related macular degeneration. Am J Hum Genet. 2006;78:852–864. doi: 10.1086/503822. [DOI] [PMC free article] [PubMed] [Google Scholar]
- Siderovski DP, Diversé-Pierluissi M, De Vries L. The GoLoco motif: a Galphai/o binding motif and potential guanine-nucleotide exchange factor. Trends Biochem Sci. 1999;24:340–341. doi: 10.1016/s0968-0004(99)01441-3. [DOI] [PubMed] [Google Scholar]
- Skaper SD. The brain as a target for inflammatory processes and neuroprotective strategies. Ann N Y Acad Sci. 2007;1122:23–34. doi: 10.1196/annals.1403.002. [DOI] [PubMed] [Google Scholar]
- Sriram K, Matheson JM, Benkovic SA, Miller DB, Luster MI, O'Callaghan JP. Mice deficient in TNF receptors are protected against dopaminergic neurotoxicity: implications for Parkinson's disease. FASEB J. 2002;16:1474–1476. doi: 10.1096/fj.02-0216fje. [DOI] [PubMed] [Google Scholar]
- Sriram K, Miller DB, O'Callaghan JP. Minocycline attenuates microglial activation but fails to mitigate striatal dopaminergic neurotoxicity: role of tumor necrosis factor-alpha. J Neurochem. 2006a;96:706–718. doi: 10.1111/j.1471-4159.2005.03566.x. [DOI] [PubMed] [Google Scholar]
- Sriram K, Matheson JM, Benkovic SA, Miller DB, Luster MI, O'Callaghan JP. Deficiency of TNF receptors suppresses microglial activation and alters the susceptibility of brain regions to MPTP-induced neurotoxicity: role of TNF-alpha. FASEB J. 2006b;20:670–682. doi: 10.1096/fj.05-5106com. [DOI] [PubMed] [Google Scholar]
- Tansey MG, McCoy MK, Frank-Cannon TC. Neuroinflammatory mechanisms in Parkinson's disease: potential environmental triggers, pathways, and targets for early therapeutic intervention. Exp Neurol. 2007;208:1–25. doi: 10.1016/j.expneurol.2007.07.004. [DOI] [PMC free article] [PubMed] [Google Scholar]
- Tansey MG, Wyss-Coray T. Cytokines in CNS inflammation and disease. In: Lane TE, Carson M, Bergmann C, Wyss-Coray T, editors. Central nervous system diseases and inflammation. Ed 1. New York: Springer; 2008. pp. 59–106. [Google Scholar]
- Waugh JL, Lou AC, Eisch AJ, Monteggia LM, Muly EC, Gold SJ. Regional, cellular, and subcellular localization of RGS10 in rodent brain. J Comp Neurol. 2005;481:299–313. doi: 10.1002/cne.20372. [DOI] [PubMed] [Google Scholar]
- West MJ, Slomianka L, Gundersen HJ. Unbiased stereological estimation of the total number of neurons in the subdivisions of the rat hippocampus using the optical fractionator. Anat Rec. 1991;231:482–497. doi: 10.1002/ar.1092310411. [DOI] [PubMed] [Google Scholar]
- Wyss-Coray T. Inflammation in Alzheimer disease: driving force, bystander or beneficial response? Nat Med. 2006;12:1005–1015. doi: 10.1038/nm1484. [DOI] [PubMed] [Google Scholar]
- Yang S, Li YP. RGS10-null mutation impairs osteoclast differentiation resulting from the loss of [Ca2+]i oscillation regulation. Genes Dev. 2007;21:1803–1816. doi: 10.1101/gad.1544107. [DOI] [PMC free article] [PubMed] [Google Scholar]
- Zambrowicz BP, Friedrich GA, Buxton EC, Lilleberg SL, Person C, Sands AT. Disruption and sequence identification of 2,000 genes in mouse embryonic stem cells. Nature. 1998;392:608–611. doi: 10.1038/33423. [DOI] [PubMed] [Google Scholar]
- Zheng B, De Vries L, Gist Farquhar M. Divergence of RGS proteins: evidence for the existence of six mammalian RGS subfamilies. Trends Biochem Sci. 1999;24:411–414. doi: 10.1016/s0968-0004(99)01474-7. [DOI] [PubMed] [Google Scholar]