
Figure 4.
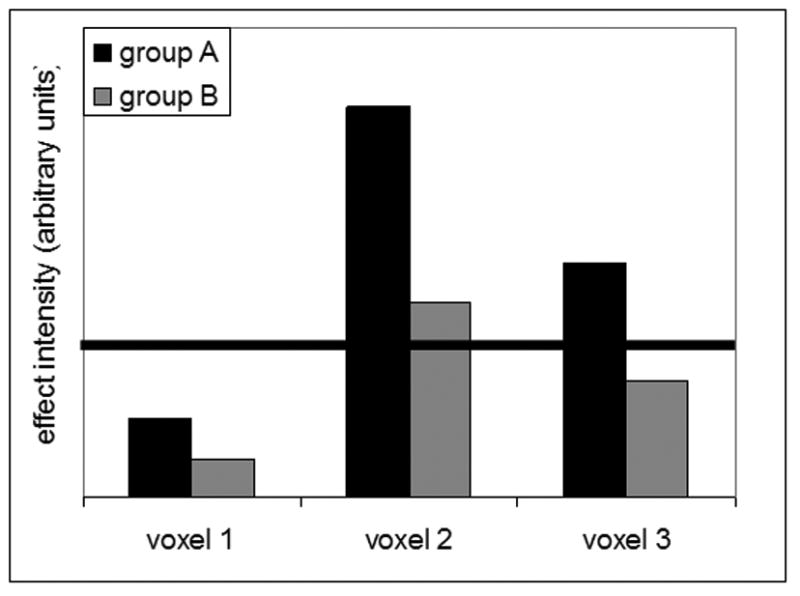
Example of two groups expressing the same pattern of activation across three voxels (or brain areas) but to different degrees. When comparing thresholded maps between groups, as in standard voxel-wise GLM analyses, one would not appreciate the fact that both groups express the same pattern of activation. Further, one might incorrectly conclude activation of voxel 3 is unique to group A. Specific covariance analyses such as MLM and OrT CVA are designed to identify patterns such as these and compare their expression across groups.