Abstract
Non-alcoholic fatty liver disease (NAFLD) encompasses a spectrum of diagnoses ranging from simple fatty liver (SFL), to non-alcoholic steatohepatitis (NASH). This study aimed to determine the effect of moderate and severe NAFLD on hepatic transporter expression and function in vivo. Rats were fed a high-fat diet (SFL model) or a methionine-choline-deficient diet (NASH model) for eight weeks. Hepatic uptake transporter function was determined by bromosulfophthalein (BSP) disposition. Transporter expression was determined by branched DNA signal amplification assay and western blotting; inflammation was identified by immunostaining of liver slices for interleukin 1 beta (IL-1β). MC- rats showed significant retention of BSP in the plasma when compared to control rats. Hepatic NTCP, OATP1a1, 1a4, 1b2 and 2b1; and OAT 2 and 3 mRNA levels were significantly decreased in high-fat and MC- diet rats when compared to control. Protein expression of OATP1a1 was significantly decreased in high-fat animals, while OATP1a1 and OATP1b2 expression was significantly lower in MC- rats when compared to control. Liver tissue from high-fat and MC- rats stained positive for IL-1β, a pro-inflammatory cytokine known to decrease expression of NTCP, OATP and OAT transporters, suggesting a plausible mechanism for the observed transporter alterations. These data suggest that different stages of NAFLD result in altered hepatic uptake transporter expression that can lead to a functional impairment of xenobiotic uptake from the blood. Furthermore, NAFLD may alter the plasma retention time of clinically relevant drugs that are reliant on these transporters and may increase the potential drug toxicity.
Index Words: Fatty liver disease, Hepatic uptake transport, Inflammation
1. Introduction
The liver plays a crucial role in the elimination of many clinically relevant drugs from the body. While drug-metabolizing enzymes are critical in hepatic drug clearance, often, hepatic transport is required to initiate and complete this process. Several basolateral transmembrane proteins are capable of transporting organic ions from plasma into the hepatocyte, including the organic anion transporting polypeptides (OATP), organic anion transporters (OAT); organic cation transporters (OCT); and the sodium-dependent bile salt uptake transporter Na+-taurocholate co-transporting polypeptide (NTCP). Coordinately, the overlapping affinities of these transporters provide an efficient means of extracting ionic xenobiotics from the sinusoidal blood (Kullak-Ublick and Meier, 2000).
Variations in patient response to drug therapy are a significant safety issue. Severe adverse drug effects among hospitalized patients in the United States may number as high as two million per year and as many as 100,000 of them prove fatal (Lazarou, Pomeranz et al., 1998). Remarkably, the majority of these adverse reactions are in patients given the correct drug and proper dosage. It is estimated that less than 20% of these cases are due to genetic polymorphisms that result in altered metabolism: the vast majority of the adverse reactions are due to individual host or environmental factors such as age, nutrition, or disease state (Ingelman-Sundberg and Rodriguez-Antona, 2005). Both pre-clinical and clinical studies have indicated that hepatic disease may result in alterations in the pharmacokinetics and elimination of a drug (Williams and Mamelok, 1980;Westphal and Brogard, 1997). Alterations in drug disposition have been well documented for liver conditions such as sepsis (Pea, Viale et al., 2005;Kim, Chen et al., 2000) and primary biliary cirrhosis (Jorquera, Almar et al., 2001). In addition, altered expression of cytochrome P450 enzymes and hepatic transporters observed in viral and alcoholic hepatitis patients have been associated with variability in drug response, resulting in either drug toxicity or decreased therapeutic effectiveness (Morgan, 2001;Heinrich, Castell et al., 1990;Renton, 2005). In contrast, relatively little data has been reported with respect to the effect of non-alcoholic fatty liver disease (NAFLD) on hepatic drug transporter.
NAFLD encompasses a spectrum of symptoms ranging from steatosis (simple fatty liver, SFL), to steatohepatitis (fatty liver with liver cell damage, inflammation and progressive fibrosis) (Reynaert, Geerts et al., 2005). The prevalence of NAFLD is estimated to be between 14% and 24% in the world population, and though once thought an adult disease, it is now known to afflict children as well (Browning and Horton, 2004). Simple steatosis is characterized by micro and macrovesicular steatosis and predisposes the liver to the more severe non-alcoholic steatohepatitis (NASH) (Koteish and Mae, 2002). NASH is histologically characterized by micro and macrovesicular steatosis, lobular inflammation, and hepatocellular damage, including accumulation of Mallory’s hyaline, ballooning degeneration, necrosis, and fibrosis (zone 1 and zone 3) (Peters, Gay et al., 1975). NASH occurs in 2 – 3% of all patients with excess fat accumulation in the liver, and accounts for approximately 10% of all newly diagnosed cases of chronic liver disease.
The classic rodent model of NASH involves inducing steatohepatitis through a methionine-choline-deficient (MC-) diet. This model of “fibrosing steatohepatitis” is characterized by the development of fibrotic strands that surround hepatocytes in a fashion identical to those in human disorders of lipid-associated hepatic fibrosis. Additionally, steatosis, chronic hepatocyte injury, and hepatic inflammation precede activation of stellate cells and fibrosis by several weeks, a sequence of events that is analogous to that which occurs in NASH (George, Pera et al., 2003).
Previous studies have demonstrated that this model causes significant changes in hepatic efflux transporters resulting in a significant shift in the disposition of acetaminophen metabolites from the bile to the plasma (Lickteig, Fisher et al., 2007a). In the current study, high-fat (SFL model) and MC- (NASH model) diets were used as models to determine the effect of SFL and NASH on hepatic uptake transporter expression and whether the resulting change in expression causes a functional alteration of xenobiotic pharmacokinetics.
2. Materials and Methods
2.1 Chemicals
Urethane, bromosulfophthalien (BSP), and NaOH were purchased from Sigma (St. Louis, MO). Heparin and sterile 0.9% sodium chloride solution (w/v) were obtained from Baxter Healthcare Corporation (Deerfield, IL). PE-10 and PE-50 polyethylene tubing were purchased from Braintree Scientific Inc. (Braintree, MA).
2.2 Animals
Male Sprague Dawley rats (8 – 9 weeks) were obtained from Harlan (Indianapolis, IN). All animals were acclimated in 12 h light and 12 h dark cycles in a University of Arizona AAALAC-certified animal facility for at least one week prior to experiments, and were allowed water and standard chow ad libitum. Housing and experimental procedures were in accordance with all applicable US laws and regulations. Rats (n = 5) were fed normal diet (Harlan Teklad, Indianapolis, IN), a low-fat isocaloric diet (high-fat diet control, #180820), a high-fat (SFL) diet (#112280 18% butter w/v, high cholesterol artherogenic), a methoinine-choline-deficient diet with methionine and choline re-supplemented (MC+, #518754) or a methionine-choline-deficient (MC-) diet (#518810) (Dyets Inc., Bethlehem, PA) for eight weeks.
2.3 Determination of BSP elimination
Following eight weeks on their respective diet, rats were anaesthetized with a single bolus dose of urethane (1.2 g/kg w/v, ip). The femoral artery and vein were cannulated with PE-50 polyethylene tubing and the common bile duct was cannulated with PE-10 polyethylene tubing distal to the bifurcation. Core temperature was maintained throughout bile collection with a TCAT-2V temperature monitor and heat pad (Physitemp Instruments Inc, Clifton, NJ). BSP (Sigma, St. Louis, MO) was administered via the femoral vein at 100 mg/kg (w/v) in a 2 ml/kg dose volume. Blood samples (100 µl) were taken at 0, 2, 5, 10, 20, 25, 30, 40, 50 and 60 minutes, via the femoral artery. Bile samples were collected in chilled pre-weighed tubes at 10-min intervals for 60 minutes following BSP administration. Immediately following 60-min blood collection, animals were euthanized while still under anesthesia and liver samples (∼200 mg) were snap frozen in Tissue-Tek® O.C.T. Compound (Electron Microscopy Sciences, Hatfield, PA). Remaining liver from each rat was snap-frozen in liquid nitrogen and stored at −80°C until cryosectioning and mRNA and protein analysis.
2.4 BSP concentration determination
Samples of plasma (10 µl, diluted 1:5) or bile (10 µl, diluted 1:20) were mixed with 1 ml 0.1 N NaOH. BSP concentration was determined by absorbance at 580 nm on a spectrophotometer (BioTek Instruments, Inc., Winooski, VT).
2.5 Liver sectioning and histological staining
Liver slices frozen in O.C.T (Sakura Finetek, Torrance, CA) were cut into 5-µm slices using a Microm HM 550 cryostat (Richard Allen Scientific, Kalamazzo, MI) and stained with hematoxylin and eosin. Histological slides were scored by a veterinary pathologist using a scoring system for human NAFLD (NASH Activity Score – NAS) as previously described (Kleiner, Brunt et al., 2005).
2.6 Plasma chemistry
Plasma levels of glucose, cholesterol, alanine amino- transferase and alkaline phosphatase were determined in control, high-fat and MC- rat plasma using an Endocheck Plus Chemistry Analyzer spectrophotometer (Hemagen Diagnostics, Inc., Colombia, MD). Individual assays were conducted with reagents from Hemagen Diagnostic, Inc. as per the manufacturer’s protocol. Alkaline phosphatase (ALP) levels were determined the absorbance of p-nitrophenol phosphate @ 405 nm and 505 nm. Glucose concentrations were determined by measuring via absorbance of Trinder-glucose oxidase @ 508 nm and 630 nm. Alanine amino-transferase (ALT) levels were assessed by measuring ALT/NADH absorbance at 340 nm and 450 nm. Cholesterol concentrations were determined by absorbance of Trinder-Cholesterol oxidase at 505 nm and 630 nm.
2.7 Total RNA isolation
Total RNA was isolated using RNAzol Bee reagent (Tel-Test Inc., Friendswood, TX) per the manufacturer’s protocol (Maher, Slitt et al., 2006). RNA concentration was determined by UV spectrophotometry, and its integrity examined by ethidium bromide staining after agarose gel electrophoresis.
2.8 Branched DNA assay
Specific oligonucleotide probes for hepatic NTCP, OATP1a1, 1a4, 1b2, and 2b1; OAT2 and 3; OCT 1 and 3 as well as Mrp2 were diluted in lysis buffer supplied in the Quantigene™ HV Signal Amplification Kit (Panomics, Inc., Freemont, CA) as previously published (Augustine, Markelewicz, Jr. et al., 2005;Cherrington, Slitt et al., 2004;Tanaka, Chen et al., 2008). Total RNA (1 µg/µl; 10 µl) was added to each well of a 96-well plate containing capture hybridization buffer and 50 µl of each diluted probe set. Total RNA was allowed to hybridize to each probe set overnight at 53 °C. Subsequent hybridization steps were carried out per the manufacturer’s protocol, and luminescence was measured with a Quantiplex™ 320 bDNA luminometer interfaced with Quantiplex™ Data Management Software Version 5.02.
2.9 Western blot analysis of hepatic OATP1a1, 1a4, 1b2 and Mrp2
Whole cell lysate proteins were isolated as previously described (Aleksunes, Scheffer et al., 2006). Protein concentrations were determined using a Bio-Rad protein Assay Reagent Kit (Bio-Rad laboratories, Inc., Hercules, CA) as described by the manufacturer (Hu, Xu et al., 2006). Hepatic protein levels of OATP1a1, 1a4, 1b2 and Mrp2 and GAPDH (loading control) were determined using polyclonal rabbit anti-rat OATP1,2 and 4 (Alpha Diagnostic International, San Antonio, TX), mouse anti-human M2III-6 (ID Labs Inc.; London, ON, Canada) and monoclonal anti-GAPDH mouse (Calbiochem, San Diego, CA) antibodies, respectively. 30 µg of protein per well were separated by SDS-PAGE and transferred to a PVDF membrane (Novex, San Diego, CA). Membranes were incubated with respective primary antibodies over night at 4ºC, followed by incubation in horseradish peroxidase-conjugated secondary antibodies (Santa Cruz Biotechnology, Inc., Santa Cruz, CA for 45 minutes at room temperature. Protein concentrations were visualized using enhanced chemiluminescence (ECL™) substrate reagent for horseradish peroxidase (Amersham Biosciences, Piscataway, NJ). Quantification of protein expression was determined using image processing and analysis in JAVA (Image J, NIH, Bethesda, MD).
2.10 Hepatic glutathione quantification
Glutathione levels in liver were quantified by change in absorbance @ 412 nm via spectrophotometric analysis as previously described (Tietze, 1969).
2.11 Immunohistochemistry
Formalin-fixed paraffin-embedded livers were deparaffinized in xylenes and rehydrated through a graded alcohol series. Following antigen retrieval by incubation in citrate buffer (10 mM) for 10 min in a Kenmore 1200 watt microwave set on defrost, endogenous peroxidase activity was blocked by incubation in 3% (v/v) H2O2 for 10 min at room temperature. Sections were then incubated overnight with a rabbit polyclonal IL-1β antibody (H-153, Santa Cruz Biotechnology, Santa Cruz, CA) diluted 1:50. IL-1β protein-antibody complexes were visualized using the Vectastain Elite ABC kit and developed with 3,3'-diaminobenzidine as per manufacturer's protocol (Vector Laboratories, Burlingame, CA). Liver sections were counterstained with hematoxylin, dehydrated in ethanol and cleared with xylenes. Negative control staining of human liver sections was performed by incubating without primary antibody.
2.12 Statistics
Statistical significance between normal, low-fat isocaloric, high-fat, MC+ and MC- diet rats was determined by one-way ANOVA followed by a Bonferroni post-hoc test (P < 0.05).
3. Results
3.1 Liver histology
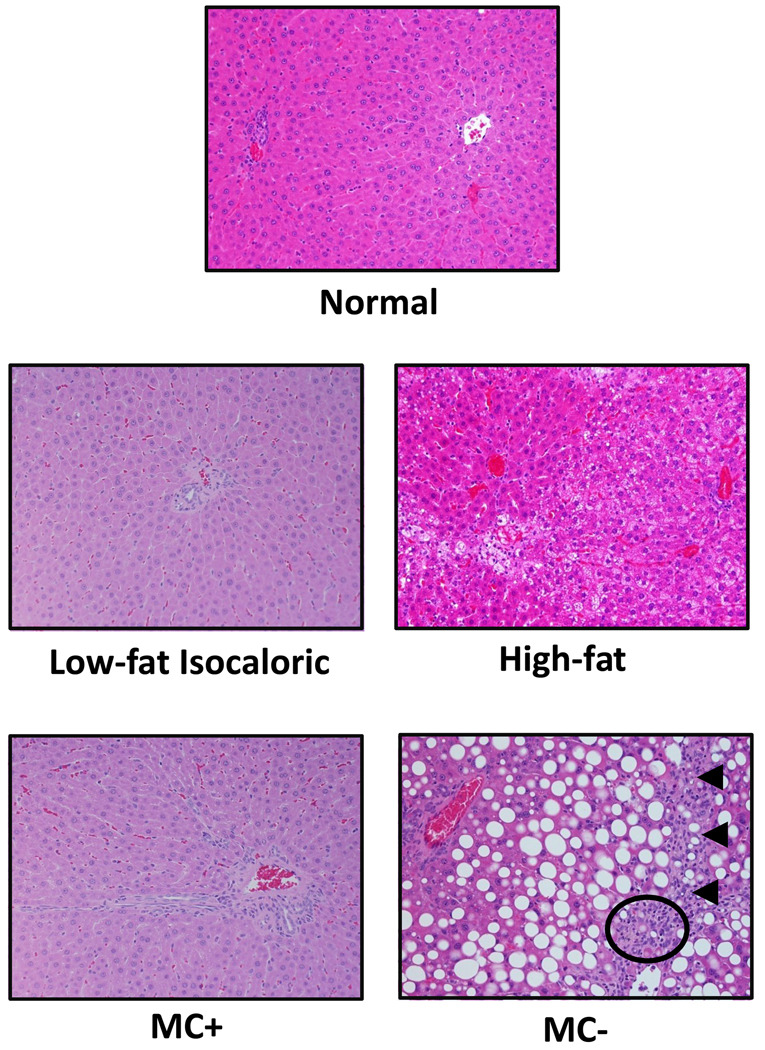
Control, low-fat isocaloric, and MC+ livers displayed no signs of steatosis or fibrosis (Fig. 1). High-fat livers showed primarily microvesicular steatosis with mild lobular inflammation, while MC- livers showed marked diffuse macrovesicular hepatic steatosis with mild lobular inflammation as well as early signs of bridging fibrosis. NAFLD Activity Scoring (NAS) for normal, low-fat isocaloric, high-fat, MC+ and MC- rat livers is summarized in Table 1. The histology and NAS scoring observed in the high-fat and MC- rat livers correlates with the pathology observed in humans with simple fatty liver and early stage NASH, respectively.
Fig. 1. Liver histology.
5 µm sections of normal, low-fat isocaloric, high-fat, MC+ and MC- diet livers were stained with hematoxylin and eosin. Images were generated using a standard light microscope at 20x magnification. Arrows indicate mild bridging fibrosis. Circle denotes inflammatory foci.
Table 1.
Non-alcoholic Fatty Liver Disease Activity Score (NAS) in normal, low-fat isocaloric, high-fat, MC+ and MC- diet fed rats. Total NAS score is the sum of values recorded for each category. NAS total score interpretation: 1–2 = not steatohepatitis; 3–4 = equivocal; 5–8 = steatohepatitis. Significance indicated from normal (a) and respective control diet (b) (P < 0.05).
| Diet | Steatosis (0–3) |
Lobular Inflammation (0–3) |
Ballooning Degeneration (0–2) |
Total NAS (0–8) |
|---|---|---|---|---|
| Normal | 0 ± 0.0 | 0 ± 0.0 | 0 ± 0.0 | 0 ± 0.0 |
|
Low-fat Isocaloric |
0 ± 0.0 | 0 ± 0.0 | 0 ± 0.0 | 0 ± 0.0 |
| MC+ | 0 ± 0.0 | 0 ± 0.0 | 0 ± 0.0 | 0 ± 0.0 |
| High-fat | 0.6 ± 0.2 a,b | 1.2 ± 0.5 a,b | 0 ± 0.0 | 1.8 ± 0.7a,b |
| MC- | 3.0 ±0.0 a,b | 1.8 ± 0.2 a,b | 0 ± 0.0 | 4.8 ± 0.2a,b |
3.2 Plasma uptake and biliary excretion of BSP in rats
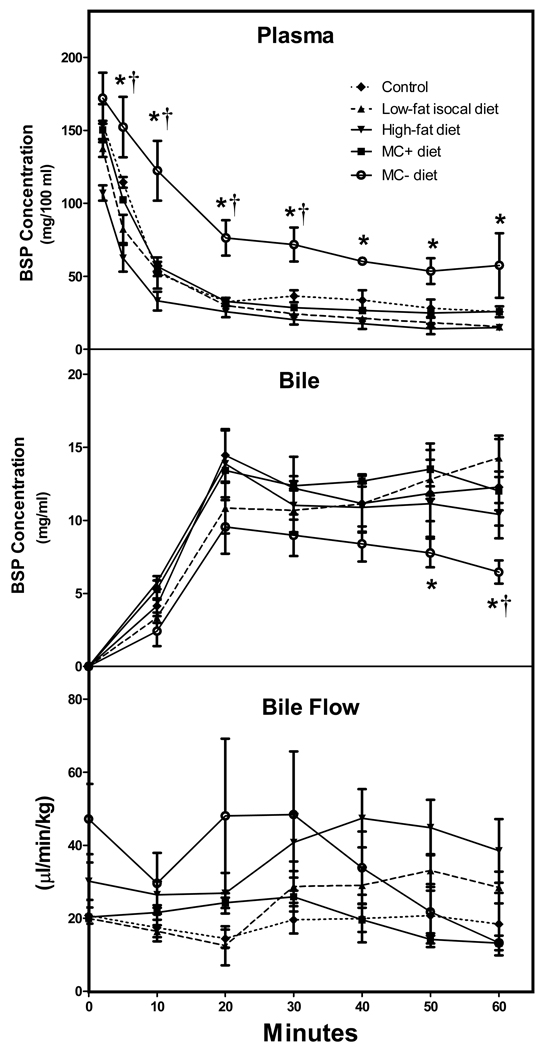
Fig.2 shows no difference between the plasma BSP levels of low-fat isocaloric, high-fat and normal diet rats. However, plasma BSP levels in MC- rats were significantly higher than MC+ rats at 5, 10, 20, 30, 40, 50 and 60 minutes post administration by (5min), 32.9%, 53.3%, 56.8%, 59.7%, (50min), and (60 min), respectively. Similarly, plasma BSP levels in MC- rats were significantly greater than normal diet rats at 5, 10, 20 and 30 minutes when compared to normal diet rats. Biliary excretion of BSP was not significantly different between normal, low-fat isocaloric, high-fat and MC+ diet groups. In contrast, biliary excretion of BSP in MC- rats was decreased significantly from MC+ rats at 50 and 60 minutes by 35.2% and 37%. A similar decreased was seen at 60 minutes in MC- rats bilary excretion compared to normal diet fed rats. Bile flow rate can also be seen in Fig. 2. Bile flow rate varied slightly between normal, low-fat isocaloric, high-fat, MC+ and MC- diets, however, there were no significant differences between groups. As shown in fig. 1 and fig. 2 there were no differences observed in liver histology or BSP disposition among rats fed the normal, isocaloric low-fat and MC+ diet. Additionally, differences between these groups were not observed in plasma chemistry, hepatic glutathione (GSH) levels or mRNA and protein levels of OATP1a1, OATP1b2 or Mrp2 (data not shown). As a result, the animals of normal, isocaloric low-fat and MC+ diet were combined into one group referred to as control throughout the manuscript.
Fig. 2. BSP disposition in low-fat isocaloric, high-fat, MC+ and MC- rats.
Animals were administered BSP (100 mg/kg, ip) and plasma and biliary BSP concentrations were determined over 1 h. BSP concentration was determined by light absorbance at 580 nm. BSP concentrations are expressed as mg/100 ml plasma and mg/ml bile ± standard error of mean, respectively. Bile flow is expressed as µl/min/kg. Asterisks indicate significance from MC+ control diet rats, while daggers indicate significant difference from normal diet rats (P < 0.05).
3.3 Plasma chemistry
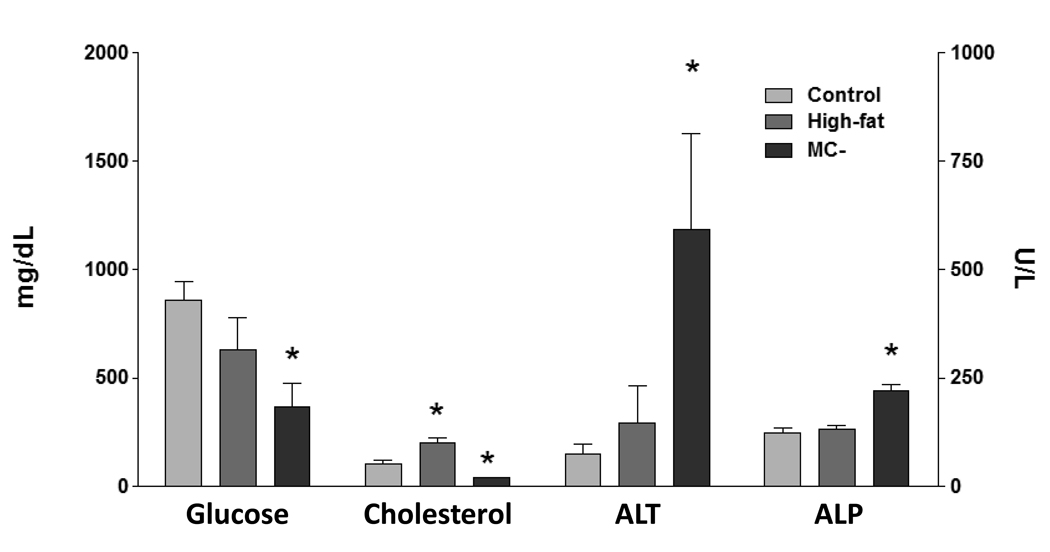
Alkaline phosphatase (ALP) levels were only significantly elevated in the plasma of MC- diet rats (Fig. 3). Plasma glucose concentrations were decreased 57% in MC- rats, whereas high-fat levels were similar to control. Alanine amino-tranferase (ALT) plasma levels were significantly elevated (87%) in MC- rats, suggesting hepatic damage. ALT levels were not altered in high-fat and control rats. High-fat plasma cholesterol levels were significantly elevated (50%), while MC-cholesterol levels were decreased (64%) compared to control.
Fig. 3. Plasma chemistry.
Plasma concentrations of alkaline phoshatase (ALP), alanine amino-transferase (ALT), glucose and cholesterol, were determined in control, high-fat and MC- rats. ALP and ALT levels expressed as U/L ± standard error of mean. Glucose and cholesterol levels expressed as mg/dL ± standard error of mean. Asterisk indicates significant difference from control (P < 0.05).
3.4 Hepatic transporter mRNA levels
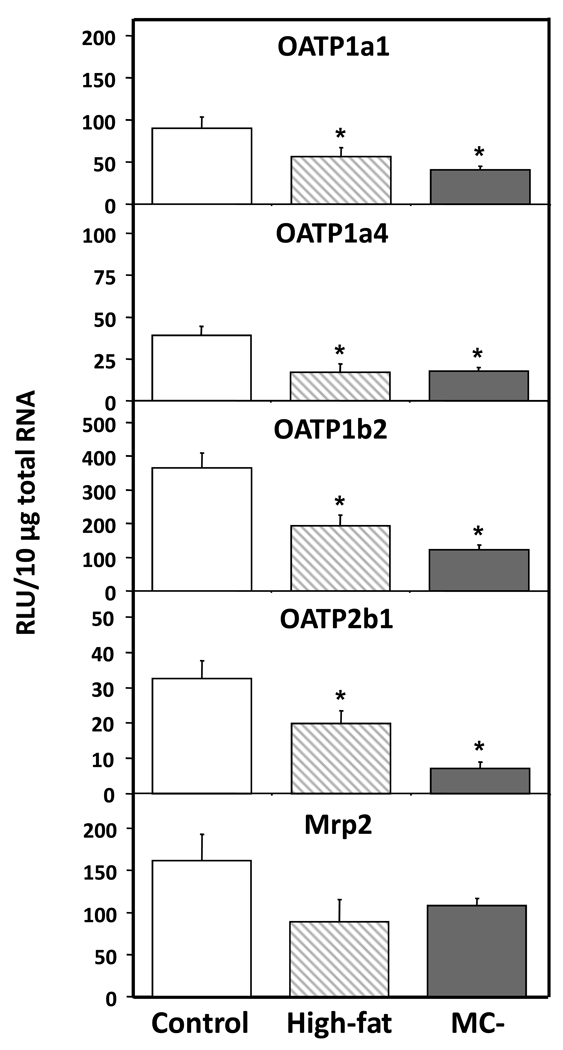
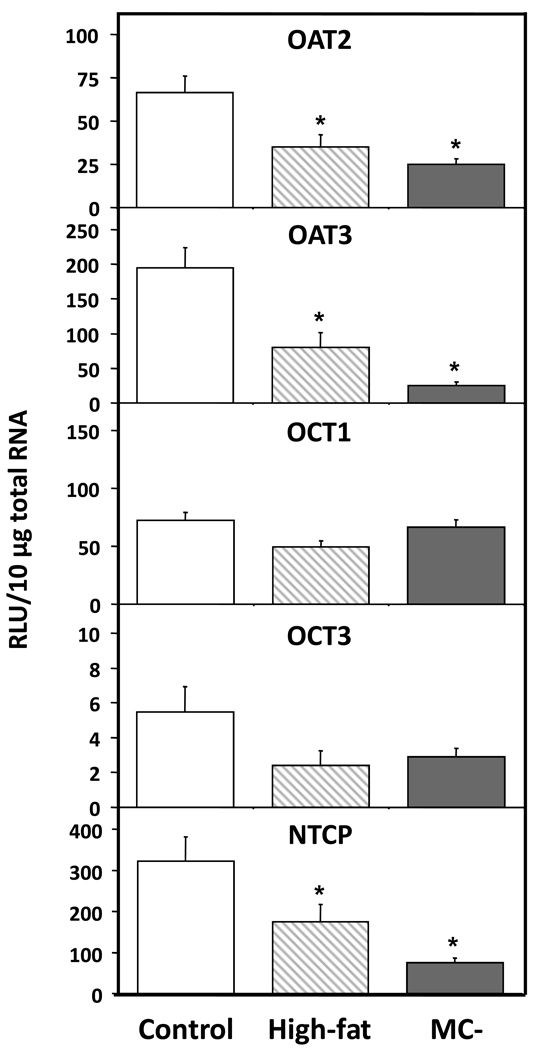
Hepatic OAT2 and OAT3 mRNA levels were significantly decreased in high-fat (48% and 59%) and MC- (62% and 87%) livers when compared to control (Fig. 5). Similarly, NTCP mRNA levels were significantly decreased in high-fat and MC- livers by 46% and 76%, respectively. OCT mRNA levels were not significantly altered by either diet model. Fig. 5 shows the mRNA levels of members of the OATP family—OATP1a1, 1a4, 1b2 and 2b1 - in control, high-fat and MC- livers. OATP1a1, 1a4, 1b2 and 2b1 mRNA levels were significantly decreased in high-fat (37%, 56%, 47% and 40%) and MC- livers (55%, 54%, 67% and 78%). Hepatic Mrp2 mRNA levels tended to be slightly decreased in high-fat and MC- rats, but these changes were not statistically significant (Fig. 5).
Fig. 5. Hepatic mRNA levels of OATP uptake transporters.
Total hepatic RNA from control, high-fat and MC- livers was analyzed for OATP mRNA levels by branched DNA assay. Data expressed as relative light units (RLU) ± standard error of mean. Asterisk indicates significant difference from control (P < 0.05).
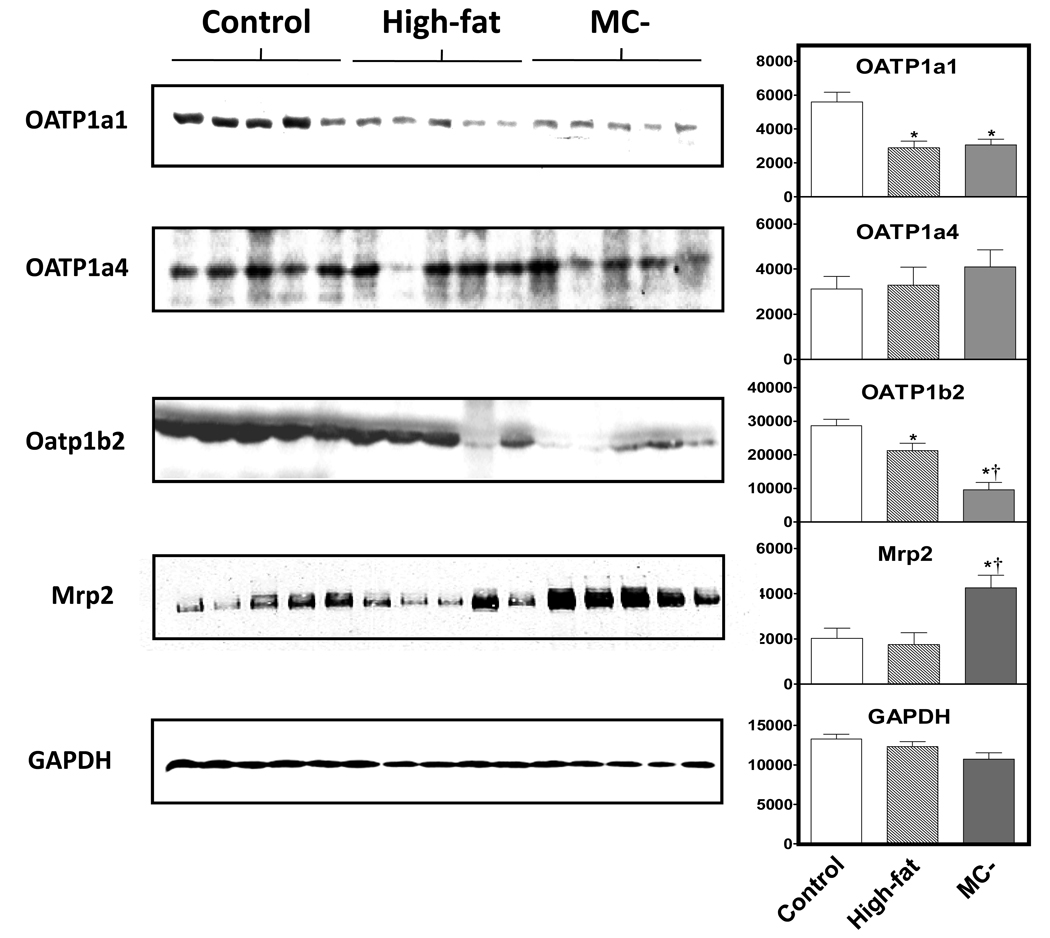
3.5 OATp1a1, 1a4, 1b2 and Mrp2 protein expression
Fig. 6 shows the protein expression of OATP1a1, OATP1b2 and Mrp2 in control (random representatives from normal, low-fat isocaloric and MC+ diet rats), high-fat and MC- diet animals as well as densitometry values normalized to GAPDH. Hepatic OATP1a1 protein levels were significantly decreased in both high-fat and MC- diet livers when compared to control. In contrast, there was little difference in the protein expression of OATp1a4 between groups. OATP1b2 expression was significantly decreased in high-fat diet when compared to control diet. OATP1b2 protein expression was further decreased in MC-diet livers and significantly different from both normal and high-fat diet animals. Hepatic Mrp2 protein expression was significantly increased in MC- rats when compared to control and high-fat animals.
Fig. 6. Hepatic protein levels of hepatic OATP1a1, 1a4, 1b2, Mrp2 and GAPDH.
30 µg of control, high-fat and MC- liver whole cell lysate protein was added to each well and resolved using SDS-PAGE. Antibodies specific for rat OATP1a1, 1a4, 1b2, Mrp2 and GAPDH were used to determine protein expression levels of each diet group. Graphs indicate relative protein expression normalized to respective GAPDH expression as determined by densitometry. Asterisks indicates significant difference from control rats and dagger indicates significant difference from high-fat rats (P < 0.05)
3.6 Hepatic glutathione levels
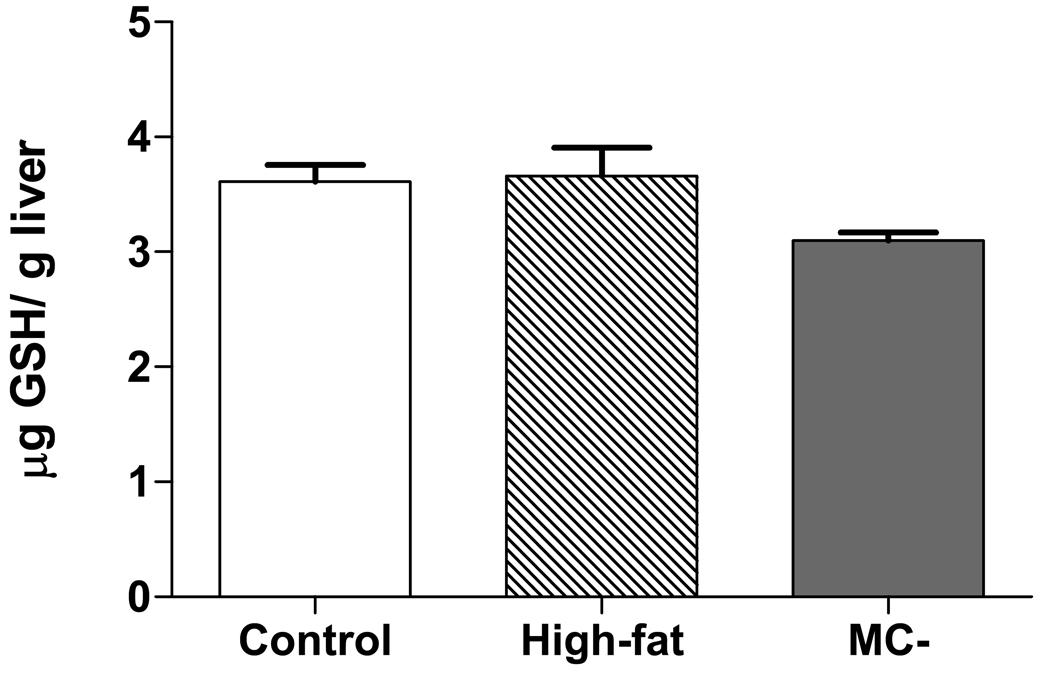
Hepatic GSH levels were not significantly different between control, high-fat and MC- livers Fig. 8.
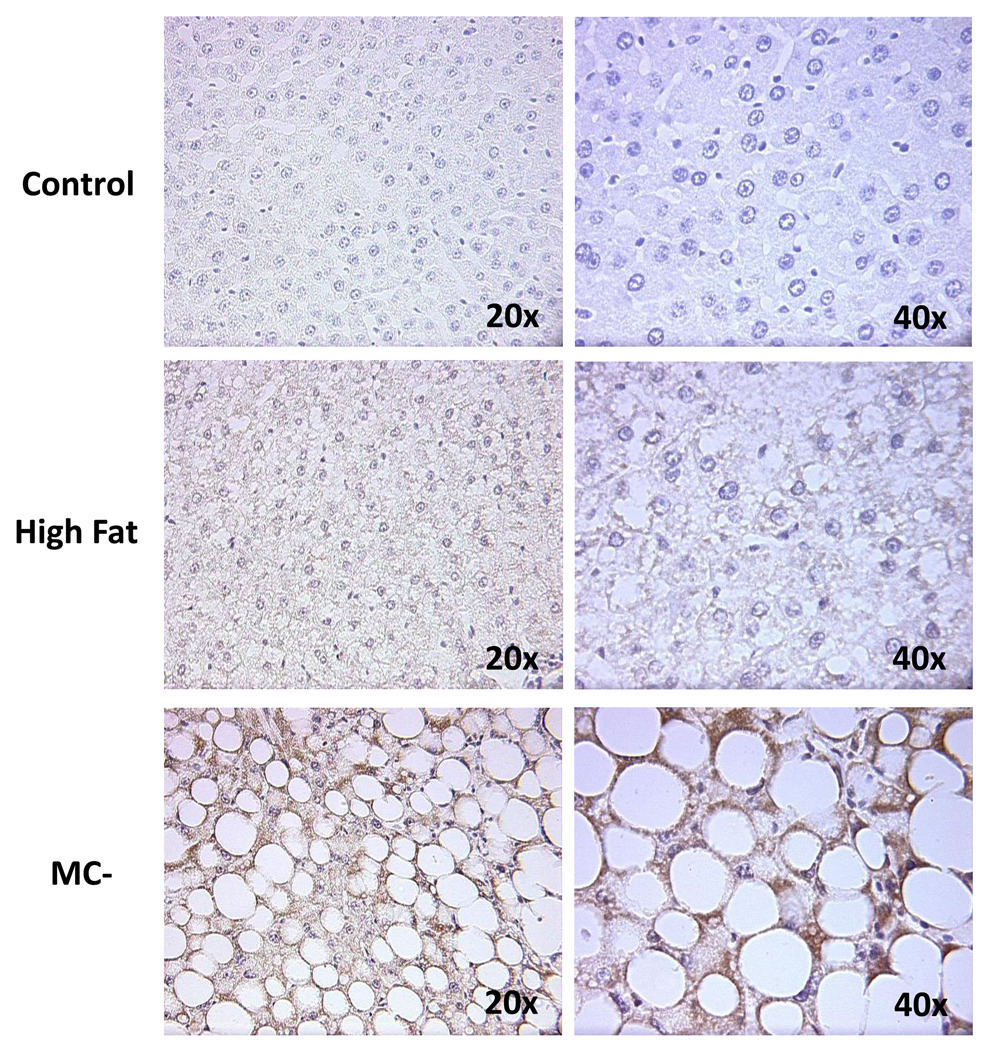
Fig. 8. Immunohistochemical staining of hepatic IL-1β.
Immunohistochemical staining was performed on paraffin sections of control, high-fat and MC- livers. Tissues were counterstained with hematoxylin and images of each group were taken at 20x and 40x magnification.
3.7 Immunostaining for IL-1β expression
As seen in Fig. 8, there is little to no IL-1β staining in control diet rat livers. However, there was moderate IL-1β staining observed in high-fat diet rat livers and considerable staining in MC- livers, indicating that experimental steatosis and NASH results in increasing levels of hepatocellular inflammation.
4. Discussion
Simple fatty liver (early stage NAFLD) is typically associated with obesity. In 1994, 22.5% of Americans were determined to be clinically obese, a statistic which is projected to reach almost 40% by 2025 (Kopelman, 2000). Due to this increase in obesity, information pertaining to liver function during the various stages of NAFLD is of increasing importance. In 2005, Geier et al. suggested that alterations in hepatic transporters may render fatty livers more vulnerable to various xenobiotics. Their study showed significantly decreased mRNA and protein levels of hepatic OATP1a4 and Mrp2 in obese Zucker rats, a model of steatosis but not NASH (Geier, Dietrich et al., 2005). In addition, Vander et al. showed increased levels of human breast cancer resistance protein (BCRP) in liver samples of patients diagnosed with NASH (Vander, Libbrecht et al., 2006). We have recently shown that experimental NASH causes significant changes in hepatic efflux transporters. Lickteig et al., 2007 demonstrated that rats fed the MC- diet showed increased protein levels of Mrp2, Mrp3, Mrp4 and Bcrp. Furthermore, alterations in Mrp3 and Mrp4 in MC- diet rats was correlated with a significant shift in the disposition of acetaminophen metabolites from the bile to the blood (Lickteig, Fisher et al., 2007a). The current study was designed to characterize hepatic uptake transporter expression in two different stages of NAFLD (simple fatty liver and the more severe NASH). Our results show sequential decreases in mRNA levels of hepatic uptake transporters in both high-fat and MC- diet groups, specifically hepatic NTCP, OATPs, and OATs. Furthermore, we demonstrate that BSP is retained in the plasma of MC- rats compared to MC+ rats suggesting an impaired function of hepatic OATP uptake transport.
In vivo models of inflammation, induced by lipopolysaccharide, result in decreased expression of a number of hepatobiliary transporters important in maintaining enterohepatic circulation (Green, Beier et al., 1996). In addition, administration of TNFα to rodents suppresses OATP1a1, OATP1a4, Mrp2 and bile salt excetory pump (Bsep) mRNA levels (Hartmann, Cheung et al., 2002), suggesting that pro-inflammatory cytokines can alter transporter expression. Downregulation of OATP1a1 and OATP1a4 has also been reported following injection of IL-1β in vivo (Geier, Wagner et al., 2007). NASH is characterized by increased serum levels of pro-inflammatory cytokines, which are thought to generate inflammatory and fibrogenic responses that contribute to the progression of NAFLD (Adams, Zein et al., 2004). Recently, the MC- diet has been shown to cause increased hepatic TNFα and IL-1β mRNA levels in rats (Yu, Ip et al., 2006;Oz, Im et al., 2006). In the current study we show that high-fat rats and MC- rats display increased levels of hepatocellular IL-1β. These results, while strictly correlative, may suggest a potential mechanism for decreased hepatic uptake transporter expression in these animals.
Because BSP undergoes almost exclusive hepatobiliary elimination, it is an ideal compound to test hepatic uptake function. In humans, BSP is efficiently removed from the blood via OATP1B1 and OATP1B3 (Ballatori, Hammond et al., 2005). Rats do not express orthologs of human OATP1B1 and 1B3, as a result, systemic clearance of BSP is primarily mediated via NTCP, OATP1a1, and 1b2 but not OATP1a4 (Hata, Wang et al., 2003;Cattori, van Montfoort et al., 2001;Meier, Eckhardt et al., 1997). Following glutathione conjugation in the hepatocyte, BSP is excreted into the bile via the canalicular efflux transporter Mrp2. Together these hepatic transporters are responsible for the efficient hepatic elimination of BSP in the rat. In the current study, we observed decreased expression of known BSP transporters, NTCP, OATP1a1 and 1b2 in the liver. In addition, there was significant retention of BSP in the plasma of MC- rats compared to normal, isocaloric low-fat, high-fat and MC+ rats suggesting functional impairment of hepatic elimination via decreased hepatic uptake transport. It should be noted that although hepatic NTCP, OATP1a1 and 1b2 mRNA and protein levels were decreased in high-fat rats, BSP retention in the plasma of these animals was not observed. BSP uptake into hepatocytes is accomplished by OATP1a1 (Km ∼1.5 – 3.3 µM/L) and OATP 1b2 (Km ∼1.1 µM/L) in rats (Meier, Eckhardt et al., 1997;Cattori, van Montfoort et al., 2001). While OATP1b2 protein expression in high-fat diet rats was significantly decreased from control, expression was still significantly higher than MC-rats. It is possible that the expression of OATP1b2 is suitable to compensate for the lack of OATP1a1 protein in high-fat diet rats, therefore, BSP plasma levels are not significantly altered in these animals.there is a threshold expression level at which OATP1b2 is able to compensate for decreased expression of OATP1a1. Perhaps there was an adequate level of OATP1b2 protein expressed in the high-fat diet rats to rescue these animals from BSP retention in the plasma. While plausible, this explanation of the difference in BSP disposition in high-fat and MC- diet rats is hypothetical and will require additional investigation.
The decreased concentrations of BSP in MC- rats at 50 and 60 minutes in MC- diet rats imply possible altered hepatic excretion of this compound by the canalicular transporter, Mrp2. However, similar to results from Lickteig et al., while hepatic Mrp2 mRNA levels were not significantly altered in MC- rats (Fig. 5), protein expression was markedly increased (Fig. 6) (Lickteig, Fisher et al., 2007a). It has been reported that Mrp2 expression can be increased by activation of the transcription factor nuclear factor E2– related factor-2 (Nrf2) (Maher, Dieter et al., 2007). Nrf2 is a transcription factor responsible for the activation of many antioxidant genes including NAD(P)H quinone oxidoreductase 1 (Nqo1). Previous studies in our lab have reported that Nqo1 levels are significantly increased in MC- diet rats and may explain the increased expression of Mrp2 in this study (Lickteig, Fisher et al., 2007b). Yet another possible reason for decreased BSP biliary excretion in MC- rats is depletion of glutathione (GSH) pools in hepatocytes. BSP is almost completely biotransformed into a BSP-GSH conjugate in the liver prior to excretion via the bile, while renal elimination of BSP-GSH after intravenous administration in the rat is negligible (Snel, Moons et al., 1995). Oxidative stress is thought to be a major contributor to the etiology of NASH, and NASH patients have been shown to have decreased GSH levels (Nobili, Pastore et al., 2005). However, analysis of hepatic GSH levels in high-fat and MC- rats did not differ from control rats in this study (Fig. 7). Given these data, it seems likely that the decreased biliary excretion in MC- rats is primarily due to decreased hepatic uptake transporter function and not alterations in either hepatic Mrp2 expression or GSH levels.
Fig. 7. Hepatic glutathione concentrations in control, high-fat and MC- rats.
Hepatic glutathione (GSH) levels were determined using an enzymatic method for quantification of total GSH. GSH levels are expressed as µM GSH/ gram liver tissue (wet weight).
Results reported in the current manuscript show that experimental NASH results in increased plasma concentrations of BSP, suggesting impaired function of hepatic transporters, specifically OATP1a1 and 1b2. Further, it can be anticipated that experimental NASH may similarly prolong the bioavailability of clinically relevant drugs that depend on these hepatic uptake transporters for systemic elimination. In humans, hepatic OATPs are responsible for the uptake of several statin drugs; antihypertensive medications like enalapril and valsartan; the antidiabetic drugs rosiglitazone and troglitazone as well as digoxin and methotrexate (Niemi, 2007). If patients with NASH develop a similar uptake transporter expression profile to experimental NASH rats, dosage of OATP substrate drugs may require adjustment to avoid elevated systemic levels and potential toxicity. The effect of NAFLD on human hepatic uptake transporters is the focus of ongoing research.
Fig. 4. Hepatic mRNA levels of OAT, OCT and NTCP uptake transporters.
Total hepatic RNA from control, high-fat and MC- livers was analyzed for OAT, OCT and NTCP mRNA levels by branched DNA assay. Data is expressed as relative light units (RLU) ± standard error of mean. Asterisk indicates significant difference from control livers (P < 0.05).
Acknowledgments
This work was supported by National Institutes of Health grants ES007091 (C.D.F), ES011646 and DK068039 (to N.J.C). This work has been presented in part at the International Society for the Study of Xenobiotics meeting, Maui, Hawaii 2005.
Footnotes
Publisher's Disclaimer: This is a PDF file of an unedited manuscript that has been accepted for publication. As a service to our customers we are providing this early version of the manuscript. The manuscript will undergo copyediting, typesetting, and review of the resulting proof before it is published in its final citable form. Please note that during the production process errors may be discovered which could affect the content, and all legal disclaimers that apply to the journal pertain.
References
- Adams LA, Zein CO, Angulo P, Lindor KD. A pilot trial of pentoxifylline in nonalcoholic steatohepatitis. Am.J.Gastroenterol. 2004;99:2365–2368. doi: 10.1111/j.1572-0241.2004.40064.x. [DOI] [PubMed] [Google Scholar]
- Aleksunes LM, Scheffer GL, Jakowski AB, Pruimboom-Brees IM, Manautou JE. Coordinated expression of multidrug resistance-associated proteins (Mrps) in mouse liver during toxicant-induced injury. Toxicol.Sci. 2006;89:370–379. doi: 10.1093/toxsci/kfi332. [DOI] [PubMed] [Google Scholar]
- Augustine LM, Markelewicz RJ, Jr, Boekelheide K, Cherrington NJ. Xenobiotic and endobiotic transporter mRNA expression in the blood-testis barrier. Drug Metab Dispos. 2005;33:182–189. doi: 10.1124/dmd.104.001024. [DOI] [PubMed] [Google Scholar]
- Ballatori N, Hammond CL, Cunningham JB, Krance SM, Marchan R. Molecular mechanisms of reduced glutathione transport: role of the MRP/CFTR/ABCC and OATP/SLC21A families of membrane proteins. Toxicol.Appl.Pharmacol. 2005;204:238–255. doi: 10.1016/j.taap.2004.09.008. [DOI] [PubMed] [Google Scholar]
- Browning JD, Horton JD. Molecular mediators of hepatic steatosis and liver injury. J.Clin.Invest. 2004;114:147–152. doi: 10.1172/JCI22422. [DOI] [PMC free article] [PubMed] [Google Scholar]
- Cattori V, van Montfoort JE, Stieger B, Landmann L, Meijer DK, Winterhalter KH, Meier PJ, Hagenbuch B. Localization of organic anion transporting polypeptide 4 (Oatp4) in rat liver and comparison of its substrate specificity with Oatp1, Oatp2 and Oatp3. Pflugers Arch. 2001b;443:188–195. doi: 10.1007/s004240100697. [DOI] [PubMed] [Google Scholar]
- Cherrington NJ, Slitt AL, Li N, Klaassen CD. Lipopolysaccharide-mediated regulation of hepatic transporter mRNA levels in rats. Drug Metab Dispos. 2004;32:734–741. doi: 10.1124/dmd.32.7.734. [DOI] [PubMed] [Google Scholar]
- Geier A, Dietrich CG, Grote T, Beuers U, Prufer T, Fraunberger P, Matern S, Gartung C, Gerbes AL, Bilzer M. Characterization of organic anion transporter regulation, glutathione metabolism and bile formation in the obese Zucker rat. J.Hepatol. 2005;43:1021–1030. doi: 10.1016/j.jhep.2005.05.031. [DOI] [PubMed] [Google Scholar]
- Geier A, Dietrich CG, Lammert F, Orth T, Mayet WJ, Matern S, Gartung C. Regulation of organic anion transporters in a new rat model of acute and chronic cholangitis resembling human primary sclerosing cholangitis. J.Hepatol. 2002;36:718–724. doi: 10.1016/s0168-8278(02)00052-1. [DOI] [PubMed] [Google Scholar]
- Geier A, Wagner M, Dietrich CG, Trauner M. Principles of hepatic organic anion transporter regulation during cholestasis, inflammation and liver regeneration. Biochim.Biophys.Acta. 2007;1773:283–308. doi: 10.1016/j.bbamcr.2006.04.014. [DOI] [PubMed] [Google Scholar]
- George J, Pera N, Phung N, Leclercq I, Yun HJ, Farrell G. Lipid peroxidation, stellate cell activation and hepatic fibrogenesis in a rat model of chronic steatohepatitis. J.Hepatol. 2003;39:756–764. doi: 10.1016/s0168-8278(03)00376-3. [DOI] [PubMed] [Google Scholar]
- Green RM, Beier D, Gollan JL. Regulation of hepatocyte bile salt transporters by endotoxin and inflammatory cytokines in rodents. Gastroenterology. 1996;111:193–198. doi: 10.1053/gast.1996.v111.pm8698199. [DOI] [PubMed] [Google Scholar]
- Hartmann G, Cheung AK, Piquette-Miller M. Inflammatory cytokines, but not bile acids, regulate expression of murine hepatic anion transporters in endotoxemia. J.Pharmacol.Exp.Ther. 2002;303:273–281. doi: 10.1124/jpet.102.039404. [DOI] [PubMed] [Google Scholar]
- Hata S, Wang P, Eftychiou N, Ananthanarayanan M, Batta A, Salen G, Pang KS, Wolkoff AW. Substrate specificities of rat oatp1 and ntcp: implications for hepatic organic anion uptake. Am.J.Physiol Gastrointest.Liver Physiol. 2003;285:G829–G839. doi: 10.1152/ajpgi.00352.2002. [DOI] [PubMed] [Google Scholar]
- Heinrich PC, Castell JV, Andus T. Interleukin-6 and the acute phase response. Biochem.J. 1990;265:621–636. doi: 10.1042/bj2650621. [DOI] [PMC free article] [PubMed] [Google Scholar]
- Hu TP, Xu FP, Li YJ, Luo JD. Simvastatin inhibits leptin-induced hypertrophy in cultured neonatal rat cardiomyocytes. Acta Pharmacol.Sin. 2006;27:419–422. doi: 10.1111/j.1745-7254.2006.00300.x. [DOI] [PubMed] [Google Scholar]
- Ingelman-Sundberg M, Rodriguez-Antona C. Pharmacogenetics of drug-metabolizing enzymes: implications for a safer and more effective drug therapy. Philos.Trans.R.Soc.Lond B Biol.Sci. 2005;360:1563–1570. doi: 10.1098/rstb.2005.1685. [DOI] [PMC free article] [PubMed] [Google Scholar]
- Jorquera F, Almar M, Linares A, Olcoz JL, Rodrigo L, Gonzalez-Gallego J. Antipyrine clearance and metabolite formation in primary biliary cirrhosis. Dig.Dis.Sci. 2001;46:352–359. doi: 10.1023/a:1005661117739. [DOI] [PubMed] [Google Scholar]
- Kim PK, Chen J, Andrejko KM, Deutschman CS. Intraabdominal sepsis down-regulates transcription of sodium taurocholate cotransporter and multidrug resistance-associated protein in rats. Shock. 2000;14:176–181. doi: 10.1097/00024382-200014020-00017. [DOI] [PubMed] [Google Scholar]
- Kleiner DE, Brunt EM, Van Natta M, Behling C, Contos MJ, Cummings OW, Ferrell LD, Liu YC, Torbenson MS, Unalp-Arida A, Yeh M, McCullough AJ, Sanyal AJ. Design and validation of a histological scoring system for nonalcoholic fatty liver disease. Hepatology. 2005a;41:1313–1321. doi: 10.1002/hep.20701. [DOI] [PubMed] [Google Scholar]
- Kopelman PG. Obesity as a medical problem. Nature. 2000;404:635–643. doi: 10.1038/35007508. [DOI] [PubMed] [Google Scholar]
- Koteish A, Mae DA. Animal models of steatohepatitis. Best.Pract.Res.Clin.Gastroenterol. 2002;16:679–690. doi: 10.1053/bega.2002.0332. [DOI] [PubMed] [Google Scholar]
- Kullak-Ublick GA, Meier PJ. Mechanisms of cholestasis. Clin.Liver Dis. 2000;4:357–385. doi: 10.1016/s1089-3261(05)70114-8. [DOI] [PubMed] [Google Scholar]
- Lazarou J, Pomeranz BH, Corey PN. Incidence of adverse drug reactions in hospitalized patients: a meta-analysis of prospective studies. JAMA. 1998;279:1200–1205. doi: 10.1001/jama.279.15.1200. [DOI] [PubMed] [Google Scholar]
- Lickteig AJ, Fisher CD, Augustine LM, Aleksunes LM, Besselsen DG, Slitt AL, Manautou JE, Cherrington NJ. Efflux transporter expression and acetaminophen metabolite excretion are altered in rodent models of nonalcoholic fatty liver disease. Drug Metab Dispos. 2007a;35:1970–1978. doi: 10.1124/dmd.107.015107. [DOI] [PubMed] [Google Scholar]
- Lickteig AJ, Fisher CD, Augustine LM, Cherrington NJ. Genes of the antioxidant response undergo upregulation in a rodent model of nonalcoholic steatohepatitis. J.Biochem.Mol.Toxicol. 2007b;21:216–220. doi: 10.1002/jbt.20177. [DOI] [PubMed] [Google Scholar]
- Maher JM, Dieter MZ, Aleksunes LM, Slitt AL, Guo G, Tanaka Y, Scheffer GL, Chan JY, Manautou JE, Chen Y, Dalton TP, Yamamoto M, Klaassen CD. Oxidative and electrophilic stress induces multidrug resistance-associated protein transporters via the nuclear factor-E2-related factor-2 transcriptional pathway. Hepatology. 2007;46:1597–1610. doi: 10.1002/hep.21831. [DOI] [PubMed] [Google Scholar]
- Maher JM, Slitt AL, Callaghan TN, Cheng X, Cheung C, Gonzalez FJ, Klaassen CD. Alterations in transporter expression in liver, kidney, and duodenum after targeted disruption of the transcription factor HNF1alpha. Biochem.Pharmacol. 2006;72:512–522. doi: 10.1016/j.bcp.2006.03.016. [DOI] [PubMed] [Google Scholar]
- Meier PJ, Eckhardt U, Schroeder A, Hagenbuch B, Stieger B. Substrate specificity of sinusoidal bile acid and organic anion uptake systems in rat and human liver. Hepatology. 1997a;26:1667–1677. doi: 10.1002/hep.510260641. [DOI] [PubMed] [Google Scholar]
- Morgan ET. Regulation of cytochrome p450 by inflammatory mediators: why and how? Drug Metab Dispos. 2001;29:207–212. [PubMed] [Google Scholar]
- Niemi ET. Role of OATP Transporters in the Disposition of Drugs. Pharmacogenomics. 2007;8:787–802. doi: 10.2217/14622416.8.7.787. [DOI] [PubMed] [Google Scholar]
- Nobili V, Pastore A, Gaeta LM, Tozzi G, Comparcola D, Sartorelli MR, Marcellini M, Bertini E, Piemonte F. Glutathione metabolism and antioxidant enzymes in patients affected by nonalcoholic steatohepatitis. Clin.Chim.Acta. 2005;355:105–111. doi: 10.1016/j.cccn.2004.12.022. [DOI] [PubMed] [Google Scholar]
- Oz HS, Im HJ, Chen TS, de Villiers WJ, McClain CJ. Glutathione-enhancing agents protect against steatohepatitis in a dietary model. J.Biochem.Mol.Toxicol. 2006;20:39–47. doi: 10.1002/jbt.20109. [DOI] [PMC free article] [PubMed] [Google Scholar]
- Pea F, Viale P, Furlanut M. Antimicrobial therapy in critically ill patients: a review of pathophysiological conditions responsible for altered disposition and pharmacokinetic variability. Clin.Pharmacokinet. 2005;44:1009–1034. doi: 10.2165/00003088-200544100-00002. [DOI] [PubMed] [Google Scholar]
- Peters RL, Gay T, Reynolds TB. Post-jejunoileal-bypass hepatic disease. Its similarity to alcoholic hepatic disease. Am.J.Clin.Pathol. 1975;63:318–331. doi: 10.1093/ajcp/63.3.318. [DOI] [PubMed] [Google Scholar]
- Renton KW. Regulation of drug metabolism and disposition during inflammation and infection. Expert.Opin.Drug Metab Toxicol. 2005;1:629–640. doi: 10.1517/17425255.1.4.629. [DOI] [PubMed] [Google Scholar]
- Reynaert H, Geerts A, Henrion J. Review article: the treatment of non-alcoholic steatohepatitis with thiazolidinediones. Aliment.Pharmacol.Ther. 2005;22:897–905. doi: 10.1111/j.1365-2036.2005.02682.x. [DOI] [PubMed] [Google Scholar]
- Snel CA, Moons MM, Russel FG, Mulder GJ. Disposition of the bromosulfophthalein-glutathione conjugate in the isolated perfused rat kidney. J.Pharmacol.Exp.Ther. 1995;273:1300–1306. [PubMed] [Google Scholar]
- Tanaka Y, Chen C, Maher JM, Klaassen CD. Ischemia-reperfusion of rat livers decreases liver and increases kidney multidrug resistance associated protein 2 (Mrp2) Toxicol.Sci. 2008;101:171–178. doi: 10.1093/toxsci/kfm261. [DOI] [PubMed] [Google Scholar]
- Tietze F. Enzymic method for quantitative determination of nanogram amounts of total and oxidized glutathione: applications to mammalian blood and other tissues. Anal.Biochem. 1969;27:502–522. doi: 10.1016/0003-2697(69)90064-5. [DOI] [PubMed] [Google Scholar]
- Vander BS, Libbrecht L, Katoonizadeh A, van Pelt J, Cassiman D, Nevens F, Van Lommel A, Petersen BE, Fevery J, Jansen PL, Roskams TA. Breast cancer resistance protein (BCRP/ABCG2) is expressed by progenitor cells/reactive ductules and hepatocytes and its expression pattern is influenced by disease etiology and species type: possible functional consequences. J.Histochem.Cytochem. 2006;54(9):1051–1059. doi: 10.1369/jhc.5A6912.2006. [DOI] [PubMed] [Google Scholar]
- Westphal JF, Brogard JM. Drug administration in chronic liver disease. Drug Saf. 1997;17:47–73. doi: 10.2165/00002018-199717010-00004. [DOI] [PubMed] [Google Scholar]
- Williams RL, Mamelok RD. Hepatic disease and drug pharmacokinetics. Clin.Pharmacokinet. 1980;5:528–547. doi: 10.2165/00003088-198005060-00002. [DOI] [PubMed] [Google Scholar]
- Yu J, Ip E, Dela PA, Hou JY, Sesha J, Pera N, Hall P, Kirsch R, Leclercq I, Farrell GC. COX-2 induction in mice with experimental nutritional steatohepatitis: Role as pro-inflammatory mediator. Hepatology. 2006;43:826–836. doi: 10.1002/hep.21108. [DOI] [PubMed] [Google Scholar]


