Abstract
Induction of heme oxygenase (HO)-1 is a key defense mechanism against oxidative stress. Compared with tubules, glomeruli are refractory to HO-1 upregulation in response to injury. This can be a disadvantage as it may be associated with insufficient production of cytoprotective heme-degradation metabolites. We, therefore, explored whether 1) targeted HO-1 expression can be achieved in glomeruli without altering their physiological integrity and 2) this expression reduces proteinuria in immune injury induced by an anti-glomerular basement membrane (GBM) antibody (Ab). We employed a 4.125-kb fragment of a mouse nephrin promoter downstream to which a FLAG-tagged hHO-1 cDNA sequence was inserted and subsequently generated transgenic mice from the FVB/N parental strain. There was a 16-fold higher transgene expression in the kidney than nonspecific background (liver) while the transprotein immunolocalized in glomerular epithelial cells (GEC). There was no change in urinary protein excretion, indicating that GEC-targeted HO-1 expression had no effect on glomerular protein permeability. Urinary protein excretion in transgenic mice with anti-GBM Ab injury (days 3 and 6) was significantly lower compared with wild-type controls. There was no significant change in renal expression levels of profibrotic (TGF-β1) or anti-inflammatory (IL-10) cytokines in transgenic mice with anti-GBM Ab injury. These observations indicate that GEC-targeted HO-1 expression does not alter glomerular physiological integrity and reduces proteinuria in glomerular immune injury.
Keywords: glomerular epithelial cells, anti-GBM disease, heme oxygenase 1, glomerulonephritis
in various forms of glomerular immune injury, there is excessive production of reactive oxygen species (ROS) by intrinsic glomerular cells or infiltrating leukocytes (20, 21). ROS induce expression of heme oxygenase (HO), which is the rate-limiting enzyme in heme catabolism. It catalyzes the NADPH-, O2−, and cytochrome P-450 reductase-dependent oxidation of heme to carbon monoxide (CO), reactive iron (Fe2+), and biliverdin, which is reduced to bilirubin by biliverdin reductase (25). Three HO isoforms have been identified, HO-1, HO-2, and HO-3, of which HO-1 is the inducible isoform (18) while HO-2 is constitutively expressed. In the kidney, expression of HO-1 is relatively low and becomes apparent only under pathological conditions, causing its induction. Most evidence indicates that HO-1 attenuates oxidant stress, occurring in various forms of renal injury or inflammation by 1) generation of biliverdin and bilirubin, which can scavenge reactive oxygen species; 2) upregulation of ferritin, which sequesters iron thereby attenuating iron-dependent oxidant reactions; and 3) upregulation of manganese (Mn) superoxide (MnSOD) (11).
We previously observed that, compared with other nephron segments, the ability of glomeruli to upregulate HO-1 expression in response to injury is limited. Thus systemic administration of established HO-1 inducers, including the natural inducer hemin, causes a robust increase in HO-1 expression in tubules but not in glomeruli (30). Similarly, immune injury directed against the glomerular basement membrane (GBM) (6) or nonimmune injury directed against glomerular epithelial cells (GEC) (8) fails to cause a robust HO-1 induction in glomeruli despite the release of potent HO-1 inducers (i.e., O2−-derived oxidant radicals and cytokines) in these forms of injury. This can be a disadvantage because the heme degradation products (biliverdin, bilirubin, and CO) formed following HO-1 induction are cytoprotective (25).
GEC constitute a key component of the glomerular capillary permeability barrier to protein while in proteinuric forms of glomerular disease proteinuria has been mechanistically linked with GEC injury (24). The limited capability of podocytes to upregulate HO-1 expression in response to injury raises two questions: 1) can upregulation of HO-1 in the GEC be tolerated? and 2) can targeted HO-1 expression in GEC attenuate proteinuria following glomerular immune injury? The present study addressed these questions using transgenic mice with GEC-targeted HO-1 expression.
MATERIALS AND METHODS
Generation of pNeph-FLAG-hHO1 Expression Vector
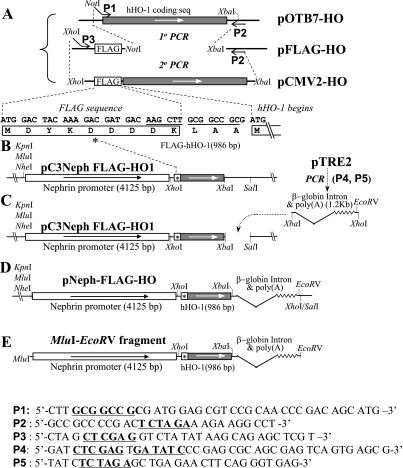
A 4.125-kb fragment of the mouse nephrin promoter (accession no. AF296764, source: Dr. S. Quaggin, University of Toronto) (10) was used to construct an expression vector (pNeph-FLAG-hHO1), which contained a tandem-arrayed nephrin promoter, a FLAG-tagged hHO-1 cDNA sequence, a β-globin intron, and a polyadenylation signal sequence (Fig. 1). The strategy of preparing this vector is shown in Fig. 2. We chose to add the FLAG tag sequence at the NH2 rather than the COOH terminal of the hHO-1 gene for two reasons: 1) both the hHO-1 catalytic center and the transmembrane domain localize near its COOH terminal (15); therefore, addition of the FLAG sequence to this terminal could interfere with catalytic activity; and 2) it was previously shown that tagging sequences larger than FLAG, for example a 19-amino acid (aa) transgene (6 X Histidine +TAT), to the hHO-1 NH2 terminal has no effect on HO catalytic activity, measured as biliverdin generation from heme (27).
Fig. 1.
Schematic plot of the pNeph-FLAG-human heme oxygenase 1 (hHO1) plasmid (9K). The FLAG-tagged human HO-1 was inserted between a murine nephrin promoter (4.125 kb) and human β-globin polyadenylation and intron sequences. Mlu1, XbaI, XhoI/SalI are key restriction sites used in ligation and construction. The fragment used for microinjection was released from the MluI to the EcoRV site of the plasmid. The thick band represents the EcoRI-EcoRI probe used for genotyping.
Fig. 2.
Schematic plot of the pNeph-FLAG-hHO1 plasmid construction strategy. Using a 2-step sequential PCR reaction, the tag sequence FLAG was linked in frame to the 5′-end of the hHO-1 coding sequence (A). The peptide sequence of FLAG and its 5′-joining region are shown in B. FLAG-hHO-1 was inserted to the 5′-end of the murine nephrin promoter (C). The polyadenylation and intron sequences of the human β-globin gene were obtained by PCR from pTRE2 and inserted at the 3′-end of the hHO-1-coding region (C). The final pNeph-FLAG-hHO1 plasmid construct is shown in D. A 6.5-kb MluI-EcoRV fragment (E) was released from the pNeph-FLAG-hHO1 plasmid for microinjection. P1-P5 are sequences of primers used in the PCR reactions shown. Underscoring indicates key restriction sites.
Briefly, a two-step PCR amplification of pOTB7-HO plasmid (Invitrogen), which contains the entire coding region of the hHO-1 gene, was performed. In the first PCR step, the forward primer (P1 in Fig. 2A) included a hanging NotI sequence (underlined) upstream of the ATG initiation site of the hHO-1 coding region, while the reverse primer (P2 in Fig. 2A) included a XbaI site (underlined) 158 bp downstream to the hHO-1 stop codon. The 1-kb PCR product was inserted between the NotI and XbaI cloning sites of the pFLAG-CMV2 vector (Sigma-Aldrich) to generate pFLAG-HO-1. In the second PCR step, a new forward primer (P3 in Fig. 2A) with a 5′ overhanging XhoI restriction sequence was annealed to a target sequence of 51 bp upstream to the FLAG translation start site and the Kozak Consensus Sequence. The reverse primer (P2 in Fig. 2A) remained identical to that used in the first PCR step. The product of the second PCR step was a 1.1-kb fragment containing a fusion sequence composed of the coding sequence for the NH2-terminal 10 aa of FLAG, the 3-aa linker, and the 288 aa of hHO-1. Subsequently, this sequence was inserted between the 4.125-kb nephrin promoter and a 782-bp fragment of a generic β-globin intron and the polyadenylation signal sequence (Fig. 2C). The final construct, pNeph-FLAG-HO (Fig. 2E), was sequence confirmed. A 7.02-kb fragment of the tandem-arrayed nephrin promoter, FLAG-tagged hHO-1 transgene, β-globin intron, and polyadenylation signal sequence were subsequently excised with MluI and EcoRV (Fig. 2E) from the cloning vector and used for microinjection into pronuclei of fertilized mouse oocytes to generate transgenic mice expressing hHO-1 in GEC (see below).
Generation of mNephrin-hHO1 Transgenic Mice
mNephrin-hHO1+/+, mNephrin-hHO1+/−, and wild-type mice were generated from a FVB/N parental strain obtained from Jackson Laboratories (Bar Harbor, ME) and handled according to protocols approved by the Institutional Animal Care and Use Committee. Briefly, a MluI-EcoRV fragment was excised from the pNeph-FLAG-hHO1, shown in Fig. 2, and used for microinjection into oocytes obtained from superovulating FVB/N female mice. The FVB/N strain was chosen because of its superior reproductive performance and prominent pronuclei, which facilitate microinjection of DNA (32). Following microinjection of the DNA, oocytes were transferred to the oviduct of pseudopregnant females. Pups were born 19 days later. Genomic DNA was extracted from mouse tail and isolated by proteinase K digestion, phenol/chloroform (24:1) extraction, and precipitation with isopropyl alcohol. It was used for Southern blot-based or PCR-based genotyping.
To perform Southern blot-based genotyping, genomic DNA (∼15 μg) was subjected to EcoRI digestion, electrophoresed through 0.9% agarose gels, and transferred to an N+ nylon membrane (Amersham Biosciences). Blots were hybridized at 42°C for at least 16 h with DNA probes labeled with [32P]dCTP using a DNA labeling kit (Amersham Biosciences). A 1,428-bp EcoRI-EcoRI fragment, incorporated within the FLAG-hHO-1 sequence of the expression vector (Fig. 1) and spanning a 3′ segment of the nephrin promoter, the FLAG sequence, and the 5′-segment of hHO-1 (indicated by the bold bar in Fig. 1), was labeled with 32P and used as a screening probe.
To perform PCR-based genotyping, PCR primers were designed to amplify three distinct loci (amplicons) spanning the FLAG-tagged hHO-1 junction (Fig. 1). These were amplicon 1: (forward: 5′-AGC AGA GCT CGT TTA GTG AAC CGT-3′; reverse: 5′-CTT GAA CTT GGT GGC ACT GGC AAT-3′; product size: 615 bp); amplicon 2: (forward: 5′-TCC TGA GCT GGA GAT GGC CCT GAT CAG AAA-3′; reverse: 5′-ATG AAC TCA GCA TTC TCT GCC TGG GTG TGC-3′; product size: 737 bp); and amplicon 3: (forward: 5′-CTG CTT TGG GTT CGT GAA CCT GCT GGA CTT-3′; reverse: 5′-ATG AAC TCA GCA TTC TCT GCC TGG GTG TGC-3′; product size: 537 bp). The PCR amplification protocol was denaturing (94°C) for 45 s, annealing (65°C) for 1 min, and extension (72°C) for 40 s (40 thermo-cycles). Genomic DNA samples were considered as positive for the presence of the FLAG-hHO1 transgene if PCR reactions on all three amplicons yielded the anticipated products.
Assessment of Organ Specificity of FLAG-hHO1 Expression
Organ distribution of transgene.
Total RNA was isolated from the brain, heart, lung, stomach, liver, muscle, pancreas, intestine, and kidney by using a TRIzol reagent kit (Invitrogen) and the manufacturer's instructions. cDNA was synthesized from total RNA with reverse transcriptase (Roche, Indianapolis, IN) using oligo (dT) primers (Qiagen, Valencia, CA). Organ mRNA expression levels were quantified by real-time PCR using a ABI PRISM 7100 sequence detection system (SDS; Applied Biosystems, Foster City, CA) and the TaqMan PCR Master Mix (Qiagen) in a one-step reaction according to the manufacturer's instructions. Primers were designed using the Primer Express V2.0 software program (Applied Biosystems). The following primers and probes were used.
Murine HO-1: forward primer: 5′-CAA AGA CGA TGA CGA CAA GCT T-3′; reverse primer: 5′-TCA GGG CCT CTG ACA AAT CC-3′; double-dye oligonucleotide probe: FAM-CGG CCG CGA TGG AGC GT-BHQ1, product size: 70 bp.
FLAG-hHO-1: forward primer: 5′-CAA AGA CGA TGA CGA CAA GCT T-3′; reverse primer: 5′-TCA GGG CCT CTG ACA AAT CC-3′; double-dye oligonucleotide probe: FAM-CGG CCG CGA TGG AGC GT-BHQI, product size: 78 bp.
Murine glucagon (GLCOE4F, endogenous control gene): forward primer: 5′-AAC ATT GCC AAA CGT CAT GAT G-3′; reverse primer: 5′-GCC TTC CTC GGC CTT TCA-3′; double-dye oligonucleotide probe: FAM-ACA TGC TGA AGG GAC C-BHQ1, product size: 129 bp.
The following PCR protocol was used: denaturation (95°C for 10 min) followed by an amplification and quantification program (95°C for 15 s, 55°C for 30 s, 72°C for 35 s), repeated for 40 cycles.
Detection of FLAG-hHO-1 protein in GEC.
Following euthanasia, mice were systemically perfused with heparin-supplemented PBS (pH 7.4, 200 ml), followed by 2% paraformaldehyde in 200 ml PBS. Infusion was maintained by an infusion pump (Harvard Apparatus) set at a constant pressure to achieve a rate of 50 ml/min. Kidneys or other organs were harvested, embedded in OCT-Tissue Tek (Sakura, Northbrook, IL) medium, and snap-frozen by immersion in an isopentane bath at −80°C. Six-micrometer-thick cryosections were mounted on Superfrost Plus microscope slides (Fisher Scientific, Pittsburgh, PA), air dried for 10–15 min, fixed in cold (4°C) freshly prepared 4% paraformaldehyde in PBS for 10 min, and then rinsed in cold PBS. Sections were then equilibrated in Tris-buffered saline (TBS; pH 7.4) at room temperature for 5 min. Double immunofluorescence was carried out by incubating sections with a monoclonal anti-FLAG antibody (M2; Sigma-Aldrich, St. Louis, MO) and a rabbit anti-WT1 antibody (sc-192; Santa Cruz Biotechnology, Santa Cruz, CA). These antibodies were dissolved in TBS supplemented with 0.6% Triton X-100, pH 8.0, at final dilutions of 1: 250 and 1:400, respectively. After washing, sections were incubated with two secondary antibodies: a FITC-conjugated chicken anti-sheep IgG (1:400, Jackson ImmunoResearch Laboratories) and a Cy3-conjugated goat anti-rabbit IgG (1:400, Jackson ImmunoResearch Laboratories). Colocalization of FLAG-hHO-1 and WT-1 immunoreactivities was examined with a darkfield microscope (Nikon Eclipse TE2000-U) interfaced with an image-analysis software system (MetaVue imaging series, version 6.2r4; Universal Imaging, Downingtown, PA).
Assessment of GEC morphology.
Electron microscopy studies were done as previously described (19). Briefly, kidneys from control and mNephrin-FLAG-hHO1 mice were minced into 1-mm2 pieces and fixed in 2.5% glutaraldehyde/4% paraformaldehyde in 0.1 M cacodylate buffer (pH 7.4) for 2 h followed by postfixation in 1% osmium tetroxide in 0.1 M cacodylate buffer for 1 h. Subsequently, the tissues were dehydrated in a graded series of acetone and embedded in Embed 812 Resin (Electron Microscopy Science, Hatfield, PA). Tissue sections were cut at 90-nm thickness using a Leica UC6 Ultramicrotome (Leica Microsystems, Vienna, Austria) and stained with uranyl acetate and lead citrate. Images were captured at 80 Kv using a Phillips CM-12 electron microscope equipped with an AMT XR41 CCD camera.
Determination of Zygosity of mNephrin-FLAG-hHO1 Transgenic Mice
Zygosity in the mice was determined using real-time quantitative PCR (Q-PCR) and the comparative CT (2−ΔΔCt) method (17). This method is based on the principle that, if all amplicons are amplified with the same efficiency, the target gene (FLAG-hHO-1) and the endogenous control gene products generated by the Q-PCR reaction will remain at a constant ratio regardless of the starting concentration of the template. Therefore, the ratio of these products rather than quantification of the physical amount of transgene copies can be used to determine zygosity. The ratio between the Q-PCR products of target gene and an endogenous control gene (in these experiments the murine glucagon gene was chosen because it is highly conserved between species and amplifies with the same efficiency and sensitivity by the TaqMan method) (14) was derived by the Ct value of each amplicon [Ct: the cycle number (C) at which the detected fluorescence (originating from the double-dye oligonucleotide probe-TaqMan probe) crosses a threshold (t)]. All Q-PCR values were derived from the mean of triplicates that had a standard variation of <0.2 within each sample group. In addition to an endogenous control gene (murine glucagon), determination of zygosity by the comparative Ct (2−ΔΔCt) method also requires a calibrator. The value of the ratio (2−ΔΔCt) sample/(2−ΔΔCt) calibrator is then used as the quantitative index of the amount of transgene. One of the hemizygote mice was arbitrarily chosen as the calibrator, and the value of (2−ΔΔCt) sample/(2−ΔΔCt) calibrator obtained in this mouse was taken as 1. Zygosity was determined using established methods and calculations. (3, 12, 14, 26, 33).
Anti-GBM Nephritis
The accelerated variant of this model was induced as previously described (22). Briefly, mice were immunized with 100 μg of sheep IgG mixed in Complete Freud's Adjuvant (Sigma-Aldrich) and given intraperitoneally 3 days before a single intravenous injection of 150 μl of sheep anti-mouse GBM antibody (generous gift of Dr. M. Madaio, University of Pennsylvania). Mice were placed in metabolic cages fitted with a system capable of freezing the urine while it is being collected (NuGEN, San Carlos, CA). Twenty-hour urine collections were performed. Urine was collected 4 days before administration of the anti-GBM antibody and on days 3 and 6 thereafter. Urine protein was measured colorimetrically using a protein-assay kit (Bio-Rad DC Protein Assay, Bio-Rad, San Diego, CA) according to the manufacturer's instructions. Urine and plasma creatinine were measured by the Jaffé colorimetric method using a creatinine assay kit (BioQuant, San Diego, CA).
Assessment of inflammatory cell infiltration.
In the accelerated anti-GBM glomerulonephritis model, there is macrophage infiltration in glomeruli (22). We assessed changes in glomerular macrophage infiltration by immunohistochemistry and Western blotting using an anti-mouse macrophage (F4/80) antibody. Immunohistochemical analysis was performed on renal cortical cryosections. Five micrometer-thick sections were fixed with methanol for 5 min followed by 4% paraformaldehyde for 5 min and then stained with FITC-conjugated rat monoclonal antibody to the mouse macrophage marker F4/80 (1:200; Abcam, Cambridge, MA). Nonspecific florescence was blocked by preincubating sections with nonimmune rat serum (1:200; Pierce, Rockford, IL) in TBS. For comparison purposes, kidney sections from control and transgenic mice littermates were fixed on the same slide to permit immunostaining under identical conditions, thus avoiding differences in staining intensity.
Western blot analysis was performed in protein lysates prepared from kidney cortices obtained from transgenic mice 4 days before injection of the anti-GBM antibody and on days 1, 2, and 3 thereafter. Levels of the murine macrophage marker F4/80 in each lysate were assessed using a polyclonal rat anti-F4/80 antibody (1:1,000; Abcam). Following protein transfer to polyvinylidene difluoride membranes, nonspecific binding of this antibody was blocked by incubating the membranes for 1 h with 1% nonimmune rat serum in TBS.
Changes in IL-10 and TGF-β1 expression.
As glomerular inflammation and proteinuria in this model is cytokine regulated, expression of two cytokines known to regulate the inflammatory response to an anti-GBM antibody-mediated injury was assessed. These were IL-10, whose anti-inflammatory effects were shown to be mediated by HO-1 (16), and TGF-β1, a profibrotic cytokine (2).
Total kidney RNA was isolated using an RNAeasy kit (Qiagen, Valencia, CA), and cDNA was reverse transcribed and synthesized using an iScript cDNA synthesis kit (Bio-Rad, Hercules, CA) according to manufacturers' instructions. Real-time PCR was performed using the SYBR Green Master Mix Kit (Bio-Rad) and the ABI 7000 thermal cycler (Applied Biosystems). Product size was validated by routine agarose gel electrophoresis. The GAPDH gene was used as an internal standard. The primers used in this study were TGF-β1: forward 5′-CAA CAA TTC CTG GEC GTT ACC TTG G and reverse 5′-GAA AGC CCT GTA TTC CGT CTC CTT; IL-10: forward 5′- GGC CCT TTG CTA TGG TGT CC and reverse 5′-AAG CGG CTG GGG GAT GAC; and GAPDH: forward 5′- GCC AAA AGG GTC ATC ATC TC and reverse 5′- GGC CAT CCA CAG TCT TCT.
Statistical Analysis
All data are expressed as means ± SE. Differences across multiple conditions were tested by one-way ANOVA for repeated measures. Comparisons between conditions were tested by Student's unpaired t-test using the Bonferroni correction for multiple comparisons. P values <0.05 were taken to indicate statistically significant differences.
RESULTS
NH2-Terminal Tagging of hHO-1 Has No Effect on Its Antigenicity
The 4.125-kb murine nephrin promoter was previously used to achieve GEC-specific expression of Cre-recombinase (10). We used this promoter to achieve GEC-targeted expression of hHO-1. The human HO-1 gene (Hmox1, Homo sapiens, Gene ID 3162) is a very conserved gene sharing a 89.62% amino acid sequence homology to mouse or rat HO-1 (Hmoxl, Mus musculus, gene ID: 15368; Hmox 1, Rattus norvegicus, gene ID 24451). hHO-1 (288 aa), mouse HO-1 (289 aa), and rat HO-1 (289 aa) share an identical 259-aa sequence and a conserved 29-aa sequence. Therefore, distinguishing endogenous mouse HO-1 from hHO-1 in transgenic mice expressing hHO-1 in GEC could be problematic. To circumvent this problem, we employed an epitope (FLAG)-tagging approach to generate a FLAG-hHO-1 chimera. We constructed a pNeph-FLAG-hHO1 plasmid (Fig. 1) consisting of a tandem-arrayed nephrin promoter, a FLAG-tagged hHO-1 cDNA sequence, a β-globin intron, and a polyadenylation signal sequence. We then examined whether the FLAG-hHO-1 sequence can encode a chimeric protein which retains the immunogenicity of both FLAG and HO-1. Achieving this is important as the highly specific anti-FLAG antibodies available would allow distinguishing between FLAG-hHO-1 transprotein and endogenous HO-1 protein in transgenic mice.
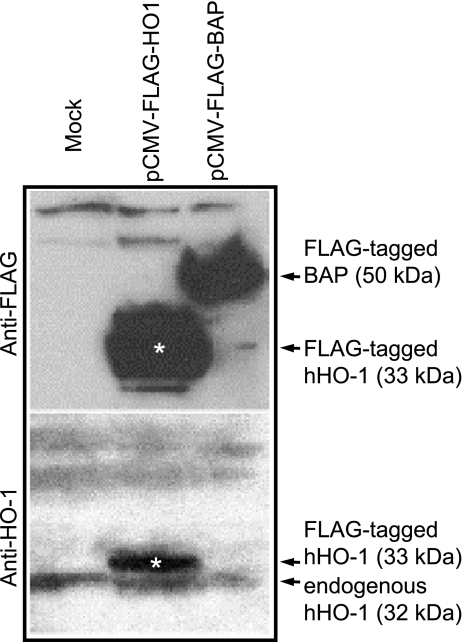
To examine whether FLAG tagging alters antigenicity of the hHO-1 protein, HeLa cells, chosen in these experiments due to their high transfection efficiency, were mock transfected or transfected with either 1 μg pCMV-FLAG-hHO1 construct or with pCMV-FLAG-bacterial alkaline phosphatase (BAP) used as a positive control. Protein lysates were separated on 4–12% NuPAGE gels (Invitrogen), and transferred to a polyvinylidene difluoride membrane (Bio-Rad). The membrane was first probed with an anti-FLAG monoclonal antibody (1:1,000, Sigma-Aldrich) (Fig. 3, top). The membrane was then stripped and reprobed with an anti-HO-1 polyclonal antibody (1:500, Stressgen) (Fig. 3, bottom). The anti-FLAG antibody detected FLAG-hHO-1 (33 kDa, white asterisk) and FLAG-tagged BAP (50 kDa). The anti-HO-1 antibody detected both endogenous hHO-1 (32 kDa, 288 aa) and FLAG-hHO-1 (33 kDa, 301 aa). These results indicate that FLAG tagging of the hHO-1 gene does not alter antigenicity of the hHO-1 protein.
Fig. 3.
Antigenicity of FLAG-tagged hHO-1. Protein lysates extracted from HeLa cells transfected with pCMV-FLAG-hHO1 or pCMV-FLAG-BAP (bacterial alkaline phosphatase; BAP) were analyzed by Western blotting using an anti-FLAG antibody (top) or anti-HO1 antibody (bottom). The anti-FLAG antibody detected FLAG-tagged hHO-1 (33 kDa; white asterisk) and FLAG-tagged BAP (50 kDa). The anti-HO-1 antibody detected both endogenously expressed HO-1 (32 kDa, 288 amino acids) and FLAG-tagged HO-1 (33 kDa, 301 amino acids).
Characteristics of Founders
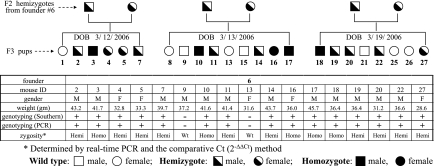
Having shown that the dual immunogenicity of the FLAG-hHO-1 protein is preserved, we next proceeded to generate transgenic mice expressing FLAG-hHO-1 in GEC as described in materials and methods. Four distinct founders were established. Their offspring were apparently healthy compared with their wild-type littermates with respect to fur color, body weight, and motility. Intercross breeding of the (mNephrin-hHO1) hemizygotes yielded the expected Mendelian ratio. Figure 4 summarizes characteristics of mice that originated from one of the founders. F2 hemizygotes from this founder (founder 6) generated 23 F3 pups shown in the table in Fig. 4 as 3 separate litter groups based on date of birth. The table in Fig. 4 summarizes gender, weight, and genotype assessed by Southern blot analysis and PCR (designated as + or − to indicate the presence or absence of the FLAG-hHO-1 transgene). Zygosity in these mice was determined using real-time Q-PCR and the comparative 2−ΔΔCt method (17) (see materials and methods for details).
Fig. 4.
Summary of characteristics of mice that originated from one of the founders (founder 6). In the table, F2 hemizygotes from founder 6 generated 23 F3 pups, shown as 3 separate litter groups based on their dates of birth (DOB). The table summarizes gender, weight, genotype assessed by Southern blot analysis and PCR (+ or − indicates the presence or absence of the FLAG-hHO-1 transgene), and urine albumin (Ualb) excretion factored by that of urine creatinine (Uc). Zygosity was determined using real-time quantitative PCR (Q-PCR) and 2−ΔΔCt method (described in materials and methods).
Organ Distribution of Transgene and Validation of GEC-Targeted hHO-1 Expression
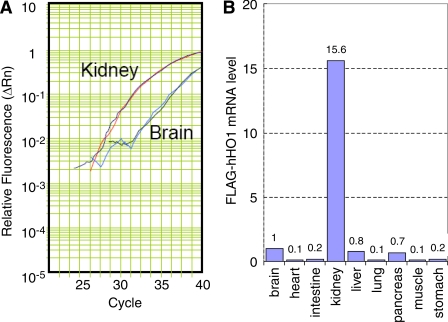
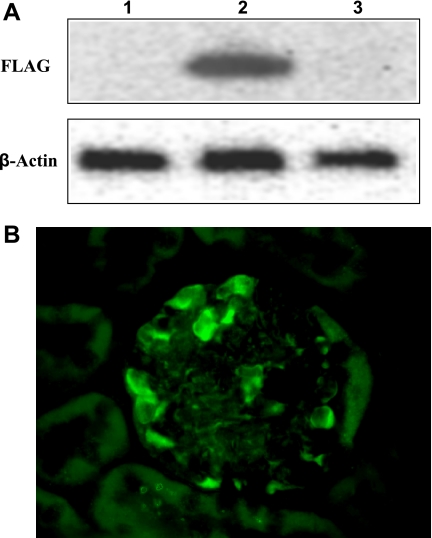
To confirm kidney-specific expression of FLAG-hHO1, we screened RNAs extracted from the brain, heart, intestine, kidney, liver, lung, pancreas, muscle and stomach by Q-PCR. Levels of FLAG-hHO-1 and GAPDH cDNA were quantified by measuring increases in fluorescence occurring due to the cleavage of the reporter dye as the PCR reaction proceeded relative to the starting values of normalized reporter fluorescence. Normalized reporter fluorescence (Rn) values (Rn is the cycle-by-cycle ratio of fluorescence of the reporter dye and the fluorescence of the internal passive reference dye in any given well) was determined and plotted against cycle number. In Fig. 5A, an amplification plot for FLAG-hHO-1 in total RNA obtained from the kidney and brain is shown. It was derived by plotting the Rn values against the PCR cycle number. Figure 5B demonstrates the abundance of FLAG-hHO-1 mRNA level in kidney tissue relative to that in the brain, heart, intestine, liver, lung, pancreas, muscle, and stomach based on Ct values derived from plots similar to that shown in Fig. 5A {Ct is the cycle number (C) at which detected fluorescence [originating from the double-dye oligonucleotide probe TaqMan crosses a threshold (t)]}. There was a 15.6-fold higher transgene expression in kidney extract compared with that of the brain. FLAG-hHO1 transprotein level (Western blot) and immunolocalization in glomeruli using an anti-FLAG antibody are shown in Fig. 6, A and B. The transprotein was detectable in lysates of whole kidney but not brain obtained from transgenic mice (Fig. 6A, top, lanes 2 and 3). Furthermore, it was undetectable in kidneys obtained from wild-type mice (Fig. 6A, top, lane 1). The FLAG-hHO1 transprotein immunolocalized in glomerular epithelial cells (Fig. 6B).
Fig. 5.
Differential expression of the transgene FLAG-hHO-1 in various organs of mNephrin-hHO1 transgenic mice. Total RNA was extracted from brain, lung, heart, liver, stomach, muscle, intestine and kidney, and analyzed by Q-PCR using GAPDH as an internal control. FLAG-hHO-1 mRNA level detected in the brain sample was arbitrarily set as 1 (B). Each data point in this panel is the average of 3 independent Q-PCR reactions. A: amplification plot of Q-PCR reaction in total RNA extracted from kidney and brain. Normalized reporter fluorescence (Rn) values of FLAG-hHO-1 mRNA levels in kidney and brain were determined by the comparative Ct (2−ΔΔCt) method and plotted against the Q-PCR cycle number. There was a 15.6-fold higher transgene expression in kidney extract compared with that from the brain.
Fig. 6.
A: expression of transprotein FLAG-hHO-1. Protein lysates prepared from transgenic mouse kidney (top, lane 2), liver (top, lane 3), and wild-type mouse kidney (top, lane 1) were analyzed by Western blotting using an anti-FLAG antibody (top) or anti-β-actin antibody (bottom). B: immunolocalization of transprotein FLAG-hHO-1 in the glomerulus. The renal cortical section shown was obtained from a mNephrin-hHO1 transgenic mouse and was immunolabeled with FITC-conjugated sheep anti-FLAG antibody. Staining is apparent in glomerular epithelial cells.
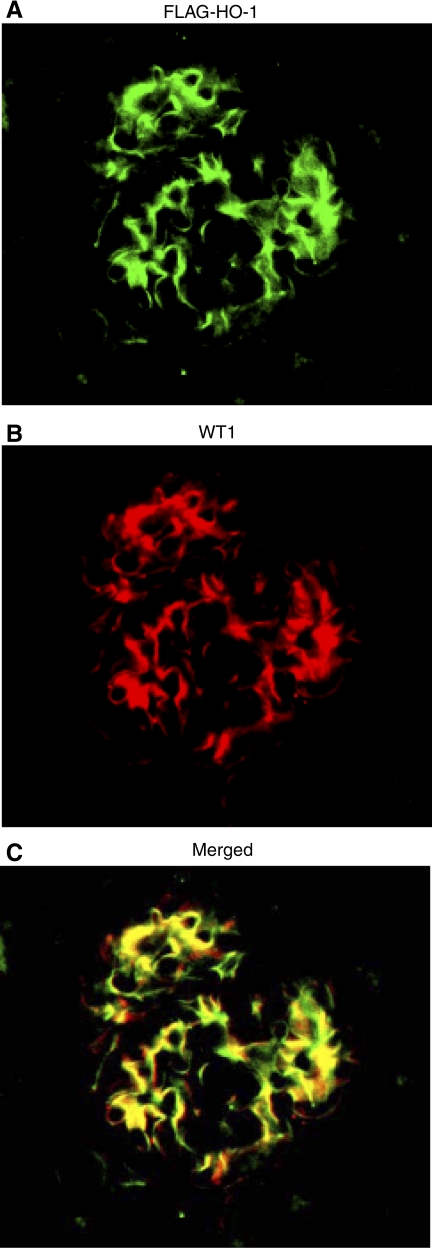
To further validate GEC specific expression of the FLAG-hHO1 protein in transgenic mice, we examined whether this protein colocalized with the GEC marker WT1 using dual-color immunohistochemistry. Figure 7A shows localization of FLAG, localization of WT-1 is in Fig. 7B, and merging of the two images is in Fig 7C.
Fig. 7.
Colocalization of transprotein FLAG-hHO1 with the podocyte marker WT1. A renal cortical section of a mNephrin-hHO1 transgenic mouse was double immunolabeled with FITC-conjugated sheep anti-FLAG antibody (A) and Cy3-conjugated anti-WT1 antibody (B). Superimposed FITC and Cy3 signals are shown in C.
Effect of GEC-Targeted hHO-1 Expression on Glomerular Morphology
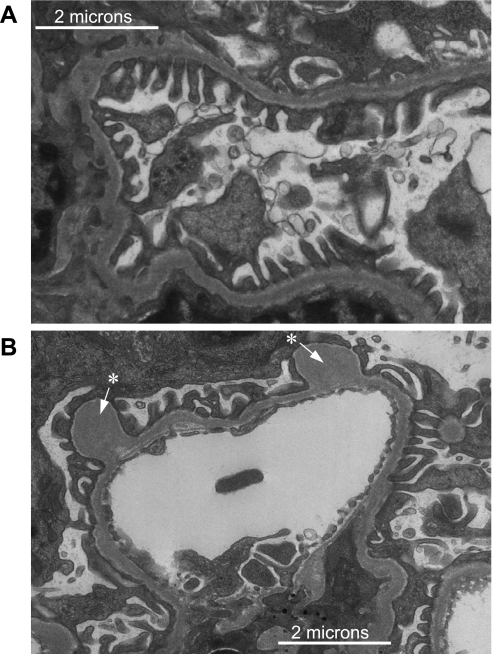
GEC morphology in transgenic mice was assessed by electron microscopy with particular attention paid to the structure of foot processes. These were well preserved without apparent changes such as flattening or effacement (Fig. 8A). Also, there was no microvillus transformation of GEC. The presence of “outpockets” or “humps” (arrows in Fig. 8B) was apparent on the podocyte side of the GBM.
Fig. 8.
Electron micrograph of glomeruli from a mNephrin-hHO1 transgenic mouse. Glomerular epithelial cell foot processes are clearly visible with no apparent effacement or microvillus transformation (A). Occasional “pockets” or “humps” (white arrow with asterisk) were present on the podocyte side of the glomerular basement membrane (GBM; B).
GEC-Targeted hHO-1 Expression Reduces Proteinuria in Glomerular Immune Injury
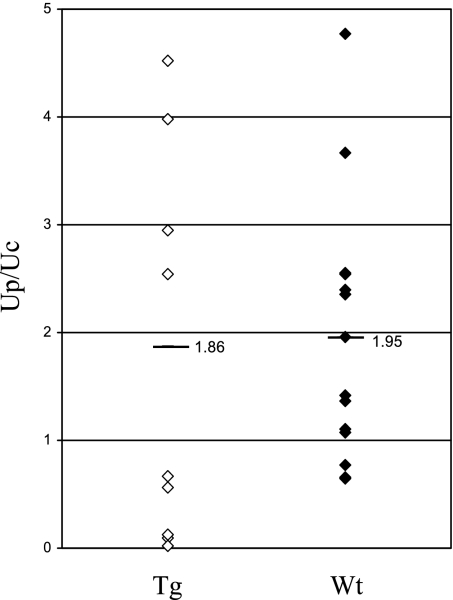
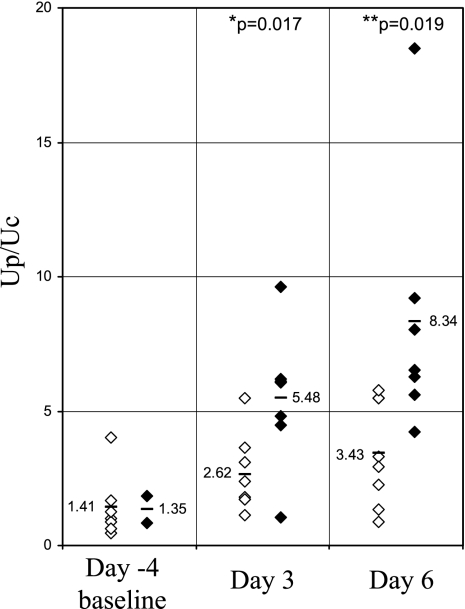
Urine protein excretion (urine protein/urine creatine; Up/Uc; mg protein/mg creatinine) values in individual wild-type and transgenic mice at 10 wk of age are shown in Fig. 9. There was no statistically significant difference in Up/Uc values in transgenic compared with wild-type mice. Values (means ± SD) were 1.86 ± 0.93 (transgenic) and 1.95 ± 1.06 (wild-type). In Fig. 10, urine protein Up/Uc values in individual transgenic (originated from founder 6) and wild-type mice as well as the mean ± SD are shown on days 3 and 6 following administration of anti-GBM antibody. At both time points, Up/Uc in transgenic mice was significantly lower than in wild-type controls. Values (means ± SD) in wild-type mice were 5.48 ± 2.56 on day 3 and 8.34 ± 4.76 on day 6 Values in transgenic mice were 2.62 ± 1.41 on day 3 and 3.43 ± 1.94 on day 6; P values were 0.017 and 0.019 for days 3 and 6, respectively. There was no difference in serum creatinine levels in transgenic mice (0.164 ± 0.008 mg/dl) compared with the levels in the wild-type control mice (0.183 ± 0.008 mg/dl) following onset of anti-GBM injury. Attenuation of proteinuria was also observed in mice with anti-GBM disease originating from a different founder (founder 16) and studied on days 9 and 12 following administration of anti-GBM antibody. [Up/Uc values (means ± SD) in transgenic mice on days 9 and 12 were 10.42 ± 3.77 and 12.44 ± 3.49, respectively. Up/Uc values in wild-type mice on days 9 and 12 were 12.44 ± 2.74 and 27.13 ± 9.41, respectively. P values were 0.035 and 0.00024 for days 9 and 12, respectively]. The reproducibility of this observation (attenuation of proteinuria) in mice originating from two different founders (founders 6 and 16) argues against the possibility that the antiproteinuric effect observed was due to random gene targeting following insertion of the FLAG-hHO1 transgene to achieve GEC targeted HO-1 expression.
Fig. 9.
Up/Uc values (mg protein/mg creatinine) in individual wild-type (Wt, ⧫) and transgenic (Tg; ◊) mice. Mean values are also shown.
Fig. 10.
Proteinuria in mNephrin-hHO1 transgenic mice and their wild-type littermates in accelerated anti-GBM antibody-mediated injury. Shown are individual Up/Uc values (mg protein/mg creatinine) in Wt (⧫) and Tg (◊) mice 4 days before (−4) and on days 3 and 6 after administration of anti-GBM antibody. *P = 0.017 Tg vs. Wt on day 3. **P = 0.019 Tg vs. Wt on day 6.
Effect of GEC-Targeted hHO-1 Expression on IL-10, TGF-β1, and Macrophage Infiltration
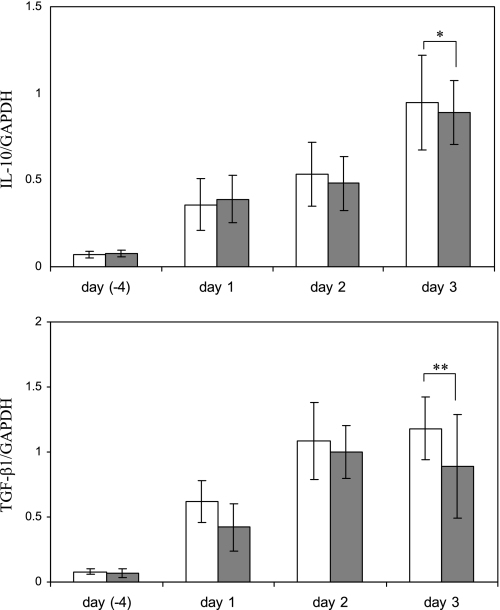
Levels of both IL-10 and TGF-β1 mRNA (assessed by real-time PCR) were increased following anti-GBM antibody-mediated injury. However, differences in these levels did not reach statistical significance in transgenic mice compared with wild-type controls (Fig. 11, top and bottom). Assessment of glomerular infiltration by macrophages (changes in levels of the mouse macrophage marker F4/80 measured by immunohistochemistry and Western blotting) revealed no apparent difference in transgenic vs. wild-type mice with anti-GBM injury (data not shown).
Fig. 11.
IL-10 and transforming growth factor (TGF)-β1 mRNA levels in Tg or control mice with anti-GBM nephritis assessed by RT-PCR. Total RNA was extracted from kidneys of Tg (grey bars) or Wt (white bars) mice 4 days before and on days 1, 2, and 3 after injection of anti-GBM antibody. Values are means ± SE of 5 mice. *P = 0.336, **P = 0.367 compared with Wt control mice on day 3.
DISCUSSION
Studies on compartmentalization of HO-1 induction in the nephron in response to potent HO-1 inducers or in various forms of glomerular injury indicate that robust induction of this enzyme occurs at sites that are located primarily “downstream” of the glomerular tuft rather than within resident glomerular cells. Thus systemic administration of HO-1 inducers, including hemin, stannous chloride, and cobalt chloride, causes a robust HO-1 induction in tubular epithelial cells but not in resident glomerular cells (30). Similarly, in glomerular immune injury developing following administration of anti-GBM antibody or in nonimmune injury developing following administration of the GEC toxin, aminonucleoside of puromycin (PAN), induction of HO-1 immunolocalized primarily in infiltrating leukocytes (5), in parietal glomerular epithelial cells, and in proximal tubules (8). In marked contrast, HO-1 induction in resident glomerular cells was weak or absent (5, 8) despite the robust prooxidant environment generated within glomeruli in both of these models of injury (28). These observations prompted us to ask two questions: 1) can HO-1 induction in glomerular cells be tolerated so far as their functional integrity is concerned? and 2) can targeting of HO-1 expression to glomerular cells attenuate the severity of injury?
To address the first question, we employed the 4.125-kb mouse nephrin promoter to achieve constitutive hHO-1 expression in GEC. FLAG tagging the hHO-1 sequence provided a useful marker of transprotein detection in GEC (Fig. 3), as distinguishing mHO-1 from hHO-1 in transgenic mice using available antibodies could be problematic given their 89.6% amino acid sequence homology. In cultured cells, constitutive HO-1 overexpression can have beneficial or detrimental effects depending on levels of ferrous (Fe2+) iron released from the HO-1 substrate (free cellular heme) (31). In the presence of reactive oxygen species, Fe2+ can promote Fenton-type prooxidant reactions and cell injury. In normal glomeruli, there is constitutive production of superoxide and superoxide-derived highly reactive species, i.e., H2O2 (28), which, if unopposed, can increase permeability of the glomerular capillary barrier to protein (29). It is, therefore, possible that targeting HO-1 to GEC may result in Fe2+ production sufficient to promote prooxidant reactions that could perturb integrity of this barrier. Our results argue against this possibility as urine protein excretion in transgenic mice was not different than that in wild-type controls (Fig. 9). These observations indicate that HO-1 targeting to GEC did not perturb functional integrity of these cells. Expression of hHO-1, a protein that is not natively expressed in GEC, did not cause morphological changes such as microvillus formation or effacement of foot processes (Fig. 8A). The apparent formation of “outpockets” or “humps,” as shown in Fig. 8B, has previously been described in knockout mice in which GEC lack the Ext1 gene, thereby being unable to polymerize heparin sulfate glycosaminoglycans (4). It was proposed that this phenomenon is indicative of regions of the GBM where newly synthesized matrix is being spliced into existing GBM (1).
We next examined whether GEC-targeted HO-1 expression attenuates proteinuria in a model of glomerular immune injury known as the accelerated variant of experimental anti-GBM glomerulonephritis. In this model, GEC injury is a prominent feature and its extent plays a major role in preserving integrity of the glomerular capillary permeability barrier to protein (24). We chose to examine the effect of GEC-targeted HO-1 expression on proteinuria at early stages of anti-GBM antibody-mediated injury (days 3 and 6) because, at these stages, a robust prooxidant environment develops within glomeruli due to production of reactive oxygen and nitrogen species, including superoxide (9) and peroxynitrite (13), which are potent HO-1 inducers. As shown in Fig. 10, proteinuria was significantly attenuated in transgenic mice with anti-GBM antibody-induced injury compared with wild-type controls with the same form of injury.
Previous studies attempted to increase glomerular HO-1 expression using systemic administration of the HO-1 inducer hemin before administration of an anti-GBM antibody. In these studies, proteinuria at early stages of immune injury was also reduced (7). However, induction of HO-1 in hemin-treated animals occurred mainly in leukocytes (macrophages) infiltrating nephritic glomeruli and in tubular epithelial cells (5). Induction of HO-1 in the former could reduce their ability to cause glomerular injury (23) while induction in the tubular epithelial cells could alter their capacity to reabsorb filtered protein. Both effects could account for the reduction of proteinuria. Thus the question of whether HO-1 expression targeted to resident glomerular cells has salutary (or detrimental) effects remained unanswered. By achieving GEC-targeted HO-1 expression, the present studies directly addressed this question. The mechanism for the salutary effect observed is probably multifactorial and apparently does not involve changes in pro- or anti-inflammatory cytokine expression (Fig. 11) or in the extent of inflammatory cell (macrophage) infiltration. Augmented production of heme-derived metabolites is a likely mechanism. For example, heme-derived CO can stimulate soluble guanylate cyclase, activation of which was shown to reduce proteinuria in other models of glomerular immune injury (34).
In summary, our observations indicate that GEC-targeted HO-1 expression can be achieved using a nephrin promoter without an apparent adverse effect on glomerular permeability to protein. Furthermore, it can attenuate proteinuria at early stages of anti-GBM antibody-induced injury via a mechanism apparently independent of TGF-β or IL-10.
GRANTS
This work was supported by a Paul Teschan Research Fund Grant and an American Heart Association Scientist Development Grant to P. Duann.
Present address of E. A. Lianos: University of Athens, School of Health Sciences, Dept. of Medicine, Athens 10675, Greece.
REFERENCES
- 1.Abrahamson DR, Perry EW. Evidence for splicing new basement membrane into old during glomerular development in newborn rat kidneys. J Cell Biol 103: 2489–2498, 1986. [DOI] [PMC free article] [PubMed] [Google Scholar]
- 2.Border WA, Noble NA. TGF-beta in kidney fibrosis: a target for gene therapy. Kidney Int 51: 1388–1396, 1997. [DOI] [PubMed] [Google Scholar]
- 3.Bubner B, Baldwin IT. Use of real-time PCR for determining copy number and zygosity in transgenic plants. Plant Cell Rep 23: 263–271, 2004. [DOI] [PubMed] [Google Scholar]
- 4.Chen S, Wassenhove-McCarthy DJ, Yamaguchi Y, Holzman LB, van Kuppevelt TH, Jenniskens GJ, Wijnhoven TJ, Woods AC, McCarthy KJ. Loss of heparan sulfate glycosaminoglycan assembly in podocytes does not lead to proteinuria. Kidney Int 74: 289–299, 2008. [DOI] [PMC free article] [PubMed] [Google Scholar]
- 5.Datta PK, Duann P, Lianos EA. Long-term effect of heme oxygenase (HO)-1 induction in glomerular immune injury. J Lab Clin Med 147: 150–155, 2006. [DOI] [PubMed] [Google Scholar]
- 6.Datta PK, Gross EJ, Lianos EA. Interactions between inducible nitric oxide synthase and heme oxygenase-1 in glomerulonephritis. Kidney Int 61: 847–850, 2002. [DOI] [PubMed] [Google Scholar]
- 7.Datta PK, Koukouritaki SB, Hopp KA, Lianos EA. Heme oxygenase-1 induction attenuates inducible nitric oxide synthase expression and proteinuria in glomerulonephritis. J Am Soc Nephrol 10: 2540–2550, 1999. [DOI] [PubMed] [Google Scholar]
- 8.Datta PK, Reddy S, Sharma M, Lianos EA. Differential nephron HO-1 expression following glomerular epithelial cell injury. Nephron Exp Nephrol 103: e131–138, 2006. [DOI] [PubMed] [Google Scholar]
- 9.Duann P, Datta PK, Pan C, Blumberg J, Sharma M, Lianos EA. Superoxide dismutase mimetic preserves the glomerular capillary permeability barrier to protein. J Pharm Exp Ther 316: 1249–1254, 2006. [DOI] [PubMed] [Google Scholar]
- 10.Eremina V, Wong MA, Cui S, Schwartz L, Quaggin SE. Glomerular-specific gene excision in vivo. J Am Soc Nephrol 13: 788–793, 2002. [DOI] [PubMed] [Google Scholar]
- 11.Frankel D, Mehindate K, Schipper HM. Role of heme oxygenase-1 in the regulation of manganese superoxide dismutase gene expression in oxidatively-challenged astroglia. J Cell Physiol 185: 80–86, 2000. [DOI] [PubMed] [Google Scholar]
- 12.Haurogne K, Bach JM, Lieubeau B. Easy and rapid method of zygosity determination in transgenic mice by SYBR Green real-time quantitative PCR with a simple data analysis. Transgenic Res 16: 127–131, 2007. [DOI] [PubMed] [Google Scholar]
- 13.Heeringa P, van Goor H, Moshage H, Klok PA, Huitema MG, de Jager A, Schep AJ, Kallenberg CG. Expression of iNOS, eNOS, and peroxynitrite-modified proteins in experimental anti-myeloperoxidase associated crescentic glomerulonephritis. Kidney Int 53: 382–393, 1998. [DOI] [PubMed] [Google Scholar]
- 14.Ji W, Zhou W, Abruzzese R, Guo W, Blake A, Davis S, Davis S, Polejaeva I. A method for determining zygosity of transgenic zebrafish by TaqMan real-time PCR. Anal Biochem 344: 240–246, 2005. [DOI] [PubMed] [Google Scholar]
- 15.Lad L, Schuller DJ, Shimizu H, Friedman J, Li H, Ortiz de Montellano PR, Poulos TL. Comparison of the heme-free and -bound crystal structures of human heme oxygenase-1. J Biol Chem 278: 7834–7843, 2003. [DOI] [PubMed] [Google Scholar]
- 16.Lee TS, Chau LY. Heme oxygenase-1 mediates the anti-inflammatory effect of interleukin-10 in mice. Nat Med 8: 240–246, 2002. [DOI] [PubMed] [Google Scholar]
- 17.Livak KJ, Schmittgen TD. Analysis of relative gene expression data using real-time quantitative PCR and the 2(-Delta Delta C(T)) method. Methods 25: 402–408, 2001. [DOI] [PubMed] [Google Scholar]
- 18.Maines MD The heme oxygenase system: a regulator of second messenger gases. Annu Rev Pharmacol Toxicol 37: 517–554, 1997. [DOI] [PubMed] [Google Scholar]
- 19.McCarthy KJ, Abrahamson DR, Bynum KR, St John PL, Couchman JR. Basement membrane-specific chondroitin sulfate proteoglycan is abnormally associated with the glomerular capillary basement membrane of diabetic rats. J Histochem Cytochem 42: 473–484, 1994. [DOI] [PubMed] [Google Scholar]
- 20.Nakamura K [Production of reactive oxygen species and scavenger treatment in nephrotoxic nephritis]. Nippon Jinzo Gakkai Shi 34: 761–772, 1992. [PubMed] [Google Scholar]
- 21.Nakamura K, Oka M, Shirai M, Igarashi Y, Kojima K, Kaneko O, Hamada N, Mera J, Masaoka H, Nagase M. Source of reactive oxygen species in anti-Thy1 nephritis. Ren Fail 20: 399–405, 1998. [DOI] [PubMed] [Google Scholar]
- 22.Neugarten J, Feith GW, Assmann KJ, Shan Z, Stanley ER, Schlondorff D. Role of macrophages and colony-stimulating factor-1 in murine antiglomerular basement membrane glomerulonephritis. J Am Soc Nephrol 5: 1903–1909, 1995. [DOI] [PubMed] [Google Scholar]
- 23.Orozco LD, Kapturczak MH, Barajas B, Wang X, Weinstein MM, Wong J, Deshane J, Bolisetty S, Shaposhnik Z, Shih DM, Agarwal A, Lusis AJ, Araujo JA. Heme oxygenase-1 expression in macrophages plays a beneficial role in atherosclerosis. Circ Res 100: 1703–1711, 2007. [DOI] [PubMed] [Google Scholar]
- 24.Pavenstadt H, Kriz W, Kretzler M. Cell biology of the glomerular podocyte. Physiol Rev 83: 253–307, 2003. [DOI] [PubMed] [Google Scholar]
- 25.Platt JL, Nath KA. Heme oxygenase: protective gene or Trojan horse. Nat Med 4: 1364–1365, 1998. [DOI] [PubMed] [Google Scholar]
- 26.Prior FA, Tackaberry ES, Aubin RA, Casley WL. Accurate determination of zygosity in transgenic rice by real-time PCR does not require standard curves or efficiency correction. Transgenic Res 15: 261–265, 2006. [DOI] [PubMed] [Google Scholar]
- 27.Ribeiro MM, Klein D, Pileggi A, Molano RD, Fraker C, Ricordi C, Inverardi L, Pastori RL. Heme oxygenase-1 fused to a TAT peptide transduces and protects pancreatic beta-cells. Biochem Biophys Res Commun 305: 876–881, 2003. [DOI] [PubMed] [Google Scholar]
- 28.Shah SV The role of reactive oxygen metabolites in glomerular disease. Annu Rev Physiol 57: 245–262, 1995. [DOI] [PubMed] [Google Scholar]
- 29.Sharma M, McCarthy ET, Savin VJ, Lianos EA. Nitric oxide preserves the glomerular protein permeability barrier by antagonizing superoxide. Kidney Int 68: 2735–2744, 2005. [DOI] [PubMed] [Google Scholar]
- 30.Shepard M, Dhulipala P, Kabaria S, Abraham NG, Lianos EA. Heme oxygenase-1 localization in the rat nephron. Nephron 92: 660–664, 2002. [DOI] [PubMed] [Google Scholar]
- 31.Suttner DM, Dennery PA. Reversal of HO-1 related cytoprotection with increased expression is due to reactive iron. FASEB J 13: 1800–1809, 1999. [DOI] [PubMed] [Google Scholar]
- 32.Taketo M, Schroeder AC, Mobraaten LE, Gunning KB, Hanten G, Fox RR, Roderick TH, Stewart CL, Lilly F, Hansen CT. FVB/N: an inbred mouse strain preferable for transgenic analyses. Proc Natl Acad Sci USA 88: 2065–2069, 1991. [DOI] [PMC free article] [PubMed] [Google Scholar]
- 33.Tesson L, Heslan JM, Menoret S, Anegon I. Rapid and accurate determination of zygosity in transgenic animals by real-time quantitative PCR. Transgenic Res 11: 43–48, 2002. [DOI] [PubMed] [Google Scholar]
- 34.Wang Y, Kramer S, Loof T, Martini S, Kron S, Kawachi H, Shimizu F, Neumayer HH, Peters H. Enhancing cGMP in experimental progressive renal fibrosis: soluble guanylate cyclase stimulation vs. phosphodiesterase inhibition. Am J Physiol Renal Physiol 290: F167–F176, 2006. [DOI] [PubMed] [Google Scholar]


