Abstract
We describe a new sensitive and specific method for the quantification of serum malonate (malonic acid, MA), which could be a new biomarker for de novo lipogenesis (fatty acid synthesis). This method is based upon a stable isotope-dilution technique using LC-MS/MS. MA from 50 μl of serum was derivatized into di-(1-methyl-3-piperidinyl)malonate (DMP-MA) and quantified by LC-MS/MS using the positive electrospray ionization mode. The detection limit of the DMP-MA was approximately 4.8 fmol (500 fg) (signal-to-noise ratio = 10), which was more than 100 times more sensitive compared with that of MA by LC-MS/MS using the negative electrospray ionization mode. The relative standard deviations between sample preparations and measurements made using the present method were 4.4% and 3.2%, respectively, by one-way ANOVA. Recovery experiments were performed using 50 μl aliquots of normal human serum spiked with 9.6 pmol (1 ng) to 28.8 pmol (3 ng) of MA and were validated by orthogonal regression analysis. The results showed that the estimated amount within a 95% confidence limit was 14.1 ± 1.1 pmol, which was in complete agreement with the observed 0 = 15.0 ± 0.6 pmol, with a mean recovery of 96.0%. This method provides reliable and reproducible results for the quantification of MA in human serum.
Keywords: acetyl-CoA carboxylase, carnitine palmitoyl transferase 1, fatty acid synthase, liquid chromatography-electrospray ionization-tandem mass spectrometry, malonic acid, malonyl-CoA, malonyl-CoA decarboxylase
Acetyl-CoA carboxylase (ACC) is the rate-controlling enzyme in the fatty acid biosynthetic pathway, and catalyzes the formation of malonyl-CoA from acetyl-CoA plus bicarbonate. Malonyl-CoA is not only substrate for fatty acid synthase (FAS) but is also a potent inhibitor of carnitine palmitoyl transferase 1 (1), the rate-limiting enzyme of fatty acid β-oxidation. Therefore, malonyl-CoA is a key molecule that controls fatty acid metabolism in the body. In addition, recent studies have shown that the level of hypothalamic malonyl-CoA is dynamically regulated by fasting and feeding and that it alters subsequent feeding behavior (2).
To determine ACC activity in tissues, an invasive tissue biopsy is necessary. However, whole body synthesis of fatty acid may be evaluated by the quantification of serum malonyl-CoA metabolites. This concept originates from our previous studies, which showed that serum concentrations of the immediate products of the rate-controlling enzymes in cholesterol and bile acid biosynthetic pathways reflected the activities of the rate-controlling enzymes and whole body cholesterol and bile acid biosynthesis (3). Furthermore, patients with malonyl-CoA decarboxylase (MCD) deficiency, who must have increased tissue malonyl-CoA concentrations, are characterized by markedly elevated urinary malonic acid (MA), called “malonic aciduria” (4). This phenomenon suggests that malonyl-CoA is easily hydrolyzed into MA by an unidentified tissue thioesterase(s). Therefore, we thought that serum MA concentrations might well reflect total body FAS.
Although methodological reports for the quantification of serum MA are not available, there have been some reports that describe the methods for the determination of urinary MA levels in patients with MCD deficiency by gas chromatography (5, 6) or gas chromatography-mass spectrometry (7). In these methods, urinary organic acids were extracted with ethyl acetate and converted into trimethylsilyl derivatives before analysis. Alternatively, blood malonylcarnitine has been measured for the diagnosis of MCD deficiency using liquid chromatography-tandem mass spectrometry coupled with electrospray ionization mode (LC-ESI-MS/MS) (8). However, because all of these methods were developed to diagnose markedly elevated MA levels in patients with MCD deficiency, the authors did not pay significant attention to the sensitivities of the methods.
The aim of this study was to measure serum MA concentrations in normal human subjects with sufficient sensitivity and specificity. For this purpose, serum MA was derivatized into di-(1-methyl-3-piperidinyl)malonate (DMP-MA) and quantified using positive LC-ESI-MS/MS (LC-P-ESI-MS/MS).
MATERIALS AND METHODS
Chemicals
MA and [13C3]MA were purchased from Sigma-Aldrich Chemical Co. (St. Louis, MO). 3-Hydroxy-1-methylpiperidine and 2-methyl-6-nitrobenzoic anhydride were purchased from Tokyo Kasei Kogyo (Tokyo, Japan) and 4-dimethylaminopyridine and formic acid were obtained from Wako Pure Chemical Industries (Osaka, Japan). Additional reagents and solvents were of analytical grade.
Sample collection
Blood samples were collected from healthy human volunteers. After coagulation and centrifugation at 1,500 g for 10 min, serum samples were stored at −20°C until analysis. Informed consent was obtained from all subjects, and the experimental procedures were conducted in accordance with the ethical standards of the Helsinki Declaration. Rat serum was prepared in our previous study (9) and had been stored at −20°C until it was used in the present experiments.
Sample preparation
Fifty μl of serum was placed in a microcentrifuge tube (1.5 ml, Eppendorf, Hamburg, Germany), and 19.2 pmol (2 ng) of [13C3]MA in 100 μl of acetonitrile as an internal standard. The sample tube was vortexed for 1 min and centrifuged at 2,000 g for 1 min. The solution of internal standard in acetonitrile led to deproteinization of the sample and the liquid phase was collected and evaporated to dryness at 80°C under a nitrogen stream. Derivatization of MA into DMP-MA was performed according to the Shiina method for the synthesis of carboxylic esters (10) with some modifications. The reagent mixture for derivatization consisted of 2-methyl-6-nitrobenzoic anhydride (67 mg), 4-dimethylaminopyridine (20 mg), pyridine (900 μl), and 3-hydroxy-1-methylpiperidine (100 μl). The freshly prepared reagent mixture (100 μl) was added to the serum extract and the reaction mixture was allowed to stand at room temperature for 30 min. After the addition of 2 ml of n-hexane, the mixture was vortexed for 30 s and centrifuged at 700 g for 2 min. The clear supernatant was collected and evaporated at 80°C under nitrogen. The residue was redissolved in 50 μl of 1% formic acid in water and an aliquot (1 μl) was injected into the following LC-MS/MS system.
Determination of DMP-MA by LC-P-ESI-MS/MS
The LC-MS/MS system consisted of a TSQ Quantum Ultra quadrupole mass spectrometer (Thermo Fisher Scientific, San Jose, CA) equipped with an H-ESI probe and a Nanospace SI-2 HPLC system (Shiseido, Tokyo, Japan). Chromatographic separation was performed using a Hypersil GOLD aQ column (150 × 2.1 mm, 3 μm, Thermo Fisher Scientific) at 40°C. Initially, the mobile phase was comprised of 0.2% formic acid in water and was used at a flow rate of 200 μl/min for 5 min, and it was then switched to 0.2% formic acid in acetonitrile at a flow rate of 300 μl/min for an additional 3.5 min. The general LC-MS/MS conditions were as follows: spray voltage, 1000 V; vaporizer temperature, 350°C; sheath gas (nitrogen) pressure, 50 psi; auxiliary gas (nitrogen) flow, 40 arbitrary units; ion transfer capillary temperature, 350°C; collision gas (argon) pressure, 1.5 mTorr; collision energy, 15 V; and ion polarity, positive.
Determination of MA by LC-N-ESI-MS/MS
LC-negative (N)-ESI-MS/MS analysis of MA was carried out using the same LC-MS/MS instrument described above. Hypersil GOLD column (150 × 2.1 mm, 3 μm, Thermo Fisher Scientific) was used at 40°C. The mobile phase consisted of methanol-water (5:95, v/v) containing 0.2% formic acid and was used at a flow rate of 200 μl/min. The general LC-MS/MS conditions were as follows: spray voltage, 4000 V; vaporizer temperature, 350°C; sheath gas (nitrogen) pressure, 50 psi; auxiliary gas (nitrogen) flow, 30 arbitrary units; ion transfer capillary temperature, 300°C; collision gas (argon) pressure, 1.5 mTorr; collision energy, 15 V; and ion polarity, negative.
Statistics
Data are reported as the mean ± SD. Linearity of the calibration curve was analyzed by simple linear regression. Reproducibility was analyzed by one-way ANOVA (JMP software, SAS Institute, Inc., Cary, NC). The estimated amount ± 95% confidence limit was obtained as an index of precision (11). To calculate the values, orthogonal regression analysis was performed in the recovery study by using JMP software. For all analyses, significance was accepted at the level of P < 0.05.
RESULTS
Selected reaction monitoring
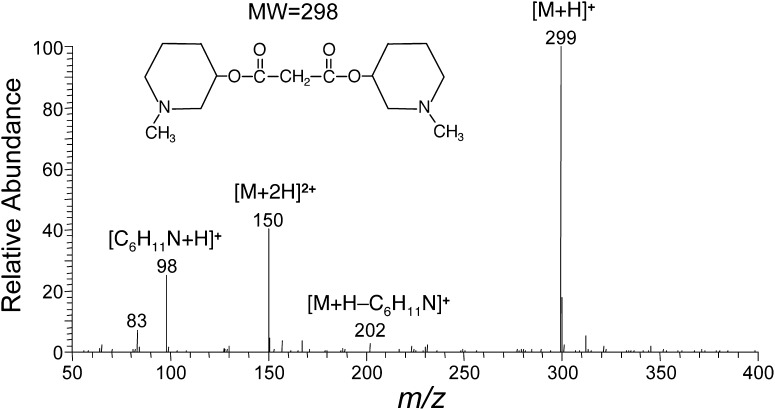
A typical ESI positive mass spectrum of the DMP-MA is shown in Fig. 1. This DMP ester derivative exhibited [M+H]+ ion at m/z 299 as the base peak. In the MS/MS spectrum using m/z 299 as a precursor ion, the [C6H11N+H]+ ion was observed at m/z 98 as the most prominent peak. The selected reaction monitoring (SRM) was conducted using m/z 299 → m/z 98 for the DMP-MA and m/z 302 → m/z 98 for the [13C3] variant. We also monitored m/z 299 → m/z 202, a product ion containing the MA molecule but the former showed much better signal-to-noise ratio than the latter.
Fig. 1.
Typical P-ESI mass spectrum of the DMP-MA. The general LC-MS/MS conditions were as described in Materials and Methods.
By N-ESI mode, authentic MA exhibited [M–H]− ion at m/z 103 as the base peak. In the MS/MS spectrum, the CH3COO− ion was observed at m/z 59 as the most prominent peak. The SRM was conducted using m/z 103 → m/z 59 for the MA.
Comparison of the sensitivities between P-ESI and N-ESI methods
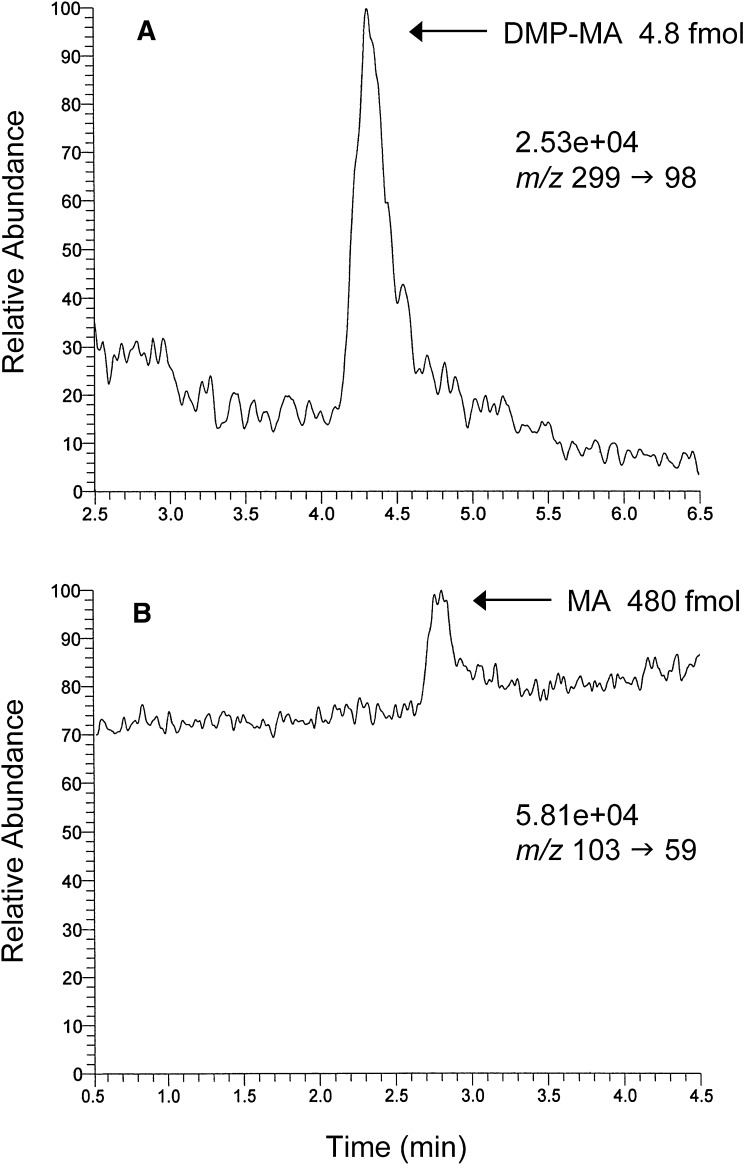
To compare the sensitivity of DMP-MA by LC-P-ESI-MS/MS with that of MA by LC-N-ESI-MS/MS, the standard DMP-MA or MA solution was diluted and injected into the LC-MS/MS system. As shown in Fig. 2A, the DMP-MA was easily detected to 4.8 fmol by LC-P-ESI-MS/MS, with a signal-to-noise ratio of 10, whereas the conventional LC-N-ESI-MS/MS was barely able to detect 480 fmol of MA (Fig. 2B).
Fig. 2.
Comparison of the detection limit of DMP-MA by LC-P-ESI-MS/MS at m/z 299 → m/z 98 (A) with that of MA by LC-N-ESI-MS/MS at m/z 103 → m/z 59 (B). Authentic standard of DMP-MA (4.8 fmol) or MA (480 fmol) was injected into the HPLC. The numbers written above the SRM ion pair represent the full scale of the chromatogram.
Calibration curve
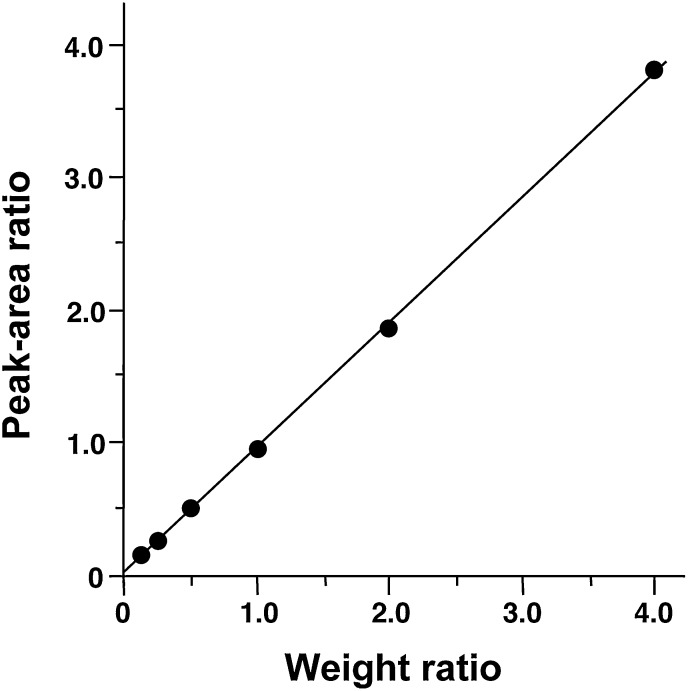
A calibration curve was established for MA (Fig. 3). Each of different amounts (2.4, 4.8, 9.6, 19.2, 38.5, and 76.9 pmol) of authentic MA was mixed with 19.2 pmol of [13C3]MA, derivatized to the DMP ester and quantified as described in the Materials and Methods. The weight ratio of MA, relative to the corresponding 13C-labeled internal standard, was plotted on the abscissa and the peak-area ratio of the DMP-MA to the [13C3] variant measured by LC-P-ESI-MS/MS was plotted on the ordinate. The linearity of the standard curve, as determined by simple linear regression, was excellent for weight ratios between 0.125 and 4.0 (n = 6; r = 1.000; P < 0.0001).
Fig. 3.
Calibration curve for the weight ratio of MA to the corresponding deuterated internal standard. Linearity was checked by simple linear regression and the equation for the line of best fit was y = 0.948× + 0.021 (n = 6; r = 1.000; P < 0.0001).
Representative SRM
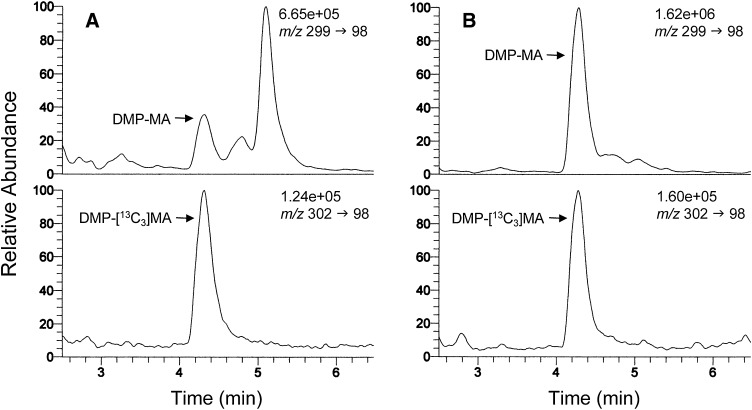
Figure 4 shows typical SRM chromatograms for DMP-MA and the [13C3] variant obtained with 50 μl sera from a normal human (A) and a control rat (B). The peak-area ratio of the DMP-MA to the [13C3] variant was calculated from the chromatograms, and MA amount was determined by applying the ratio to the calibration curve. The peaks of DMP-MA in chromatograms A and B correspond to ∼0.66 pmol (0.66 μM) and ∼4.43 pmol (4.43 μM), respectively.
Fig. 4.
Representative SRM chromatograms of DMP-MA and its 13C3 variant (internal standard) obtained from 50 μl sera of a normal human (A) and a rat (B). The peaks of DMP-MA in chromatograms A and B correspond to ∼0.66 pmol (0.66 μM) and ∼4.43 pmol (4.43 μM), respectively. The numbers written above the SRM ion pair represent the full scale of the chromatogram.
Precision and accuracy of the LC-P-ESI-MS/MS method
The following studies were performed to determine the precision and accuracy of the present method using the same serum obtained from a normal human subject. Reproducibility was investigated by analyzing four samples in triplicate by LC-P-ESI-MS/MS (Table 1). The results were analyzed by a one-way ANOVA in which the analytical errors were divided into two sources, sample preparation and SRM measurement. The variances were not considered to be attributable to the sample preparation because the errors during sample preparation were not significantly larger than those between the measurements (Table 2). The inter-assay coefficients of variation for the between- and within-sample variations were 4.4% and 3.2%, respectively.
TABLE 1.
Reproducibility in the quantification of MA in human serum: analytical data
| Sample | Individual Values | Mean ± SD | ||
|---|---|---|---|---|
| pmol | ||||
| A | 15.0 | 15.7 | 15.0 | 15.2 ± 0.38 |
| B | 14.4 | 15.6 | 15.5 | 15.2 ± 0.67 |
| C | 14.7 | 14.4 | 14.2 | 14.5 ± 0.29 |
| D | 15.6 | 15.6 | 14.7 | 15.3 ± 0.48 |
| Mean ± SD | 15.0 ± 0.58 | |||
MA was quantified in 50 μl of normal human serum.
TABLE 2.
Reproducibility in the quantification of MA in human serum: ANOVA
| Source | S | f | V | F0 | Relative SD |
|---|---|---|---|---|---|
| % | |||||
| Sample preparation | 1.293 | 3 | 0.431 | 1.89 | 4.4 |
| Error (SRM) | 1.820 | 8 | 0.228 | 3.2 | |
| Total | 3.113 | 11 | |||
| F(3,8,0.05) = 4.07 | |||||
S, residual sum of squares; f, number of degrees of freedom; f1, fsample preparation; f2, ferror; V, unbiased variance; F0, observed value following F distribution variance ratio (Vsample preparation/ Verror); F(f1, f2, α), density function of F distribution with f1 and f2 degrees of freedom.
For the recovery experiments, known amounts of MA (a, 2a, 3a; a = 9.6 pmol) were spiked into 50 μl aliquots of the serum samples (n = 2). After the clean-up and derivatization procedures, SRM was carried out in triplicate for each sample. The recoveries of the known spiked amounts of MA ranged from 94.5% to 99.0%, with a mean of 96.0% (Table 3). In addition, the amount of endogenous MA found in unspiked 50 μl serum aliquots was within the 95% confidence limit for the estimated amount of MA calculated by orthogonal regression analysis, which also constituted an index for the precision and accuracy of the present method.
TABLE 3.
Recovery of MA from human serum
| Sample (X0 + na) (n = 0,1,2,3) | Amount Added | Amount Found | Recoveryb (Mean ± SD) | Estimated Amount ± 95% Confidence Limitc | ||
|---|---|---|---|---|---|---|
| pmol | % | pmol | ||||
| X0 | 0 | 0 ± SD = 15.0 ± 0.6a | 14.1 ± 1.1 | |||
| X0 + a | 9.6 | 23.6 | 25.2 | 25.0 | ||
| X0 + a | 9.6 | 24.2 | 23.6 | 23.3 | 94.5 ± 8.2 | |
| X0 + 2a | 19.2 | 33.2 | 32.1 | 32.0 | ||
| X0 + 2a | 19.2 | 33.9 | 34.1 | 34.0 | 94.6 ± 5.1 | |
| X0 + 3a | 28.8 | 43.8 | 43.9 | 43.0 | ||
| X0 + 3a | 28.8 | 44.1 | 43.6 | 43.2 | 99.0 ± 1.5 | |
Known amounts of MA were spiked into 50 μl of normal human serum before sample preparation.
The value was obtained from Table 1.
Recovery (%) = (amount found – 0) / amount added × 100.
The estimated amount was calculated by orthogonal regression.
The circadian rhythm of MA levels in human sera
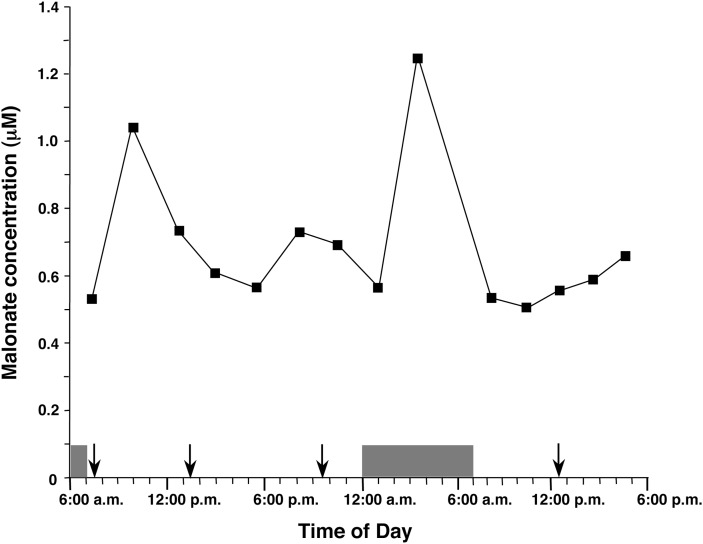
Figure 5 depicts the circadian rhythm of the serum concentrations of MA in a healthy male. Postprandial increases of MA concentrations (maximum 235% after dinner) were observed and the levels peaked between 2.5 and 6.5 h postmeal. The increase of MA concentration disappeared after skipping breakfast on the second day, which supports the idea that the diurnal pattern of serum MA concentrations is controlled mainly by food intake.
Fig. 5.
The circadian rhythm of the serum levels of MA in a healthy volunteer. Blood samples were taken every 2–3 h. On the first day the volunteer consumed a normal hospital diet at 7:30 AM, 1:30 PM, and 9:30 PM (indicated by the arrows), and slept from 12:00 AM to 7:00 AM (indicated by the shaded box). On the second day the volunteer did not eat breakfast but consumed a normal hospital diet at 12:30 PM.
DISCUSSION
We describe a sensitive new LC-P-ESI-MS/MS method for the quantification of MA in serum. LC-N-ESI-MS/MS may be more suitable for the determination of negatively charged compounds, such as organic acids because the method does not require a derivatization step. However, as shown in Fig. 2, the sensitivity of N-ESI was not sufficient to quantify MA concentrations in a small volume of normal human serum.
Recently, we derivatized another organic acid, mevalonate, into mevalonyl-(2-pyrrolidin-1-yl-ethyl)-amide and measured it using LC-P-ESI-MS/MS (12). In this method, mevalonate was lactonized into mevalonolactone and then a tertiary amine moiety was introduced by a characteristic amidation reaction with a primary alkylamine. As a result, the tertiary amine moiety markedly promoted protonation and attomole levels of mevalonate were detected. In the present study, tertiary amine moieties were successfully introduced to MA by esterification with 3-hydroxy-1-methylpiperidine. Thus, the reaction for the synthesis of carboxylic esters by Shiina et al. (10) appears to be useful not only for the derivatization of alcohols (13) but also for that of carboxylic acids. This derivative, DMP-MA, exhibited [M+H]+ as the base peak by P-ESI-MS and the detection limit by SRM was more than 100 times lower than that of underivatized MA by SRM with N-ESI mode.
The derivatization and purification steps in this method are very simple but it should be mentioned that there are two pitfalls to obtaining reliable and reproducible results. First, use of the anion exchange column cartridge gave unexpectedly high values of MA concentrations. Serum MA was extracted by this cartridge and interfering peaks on SRM chromatograms were markedly reduced by the addition of this purification step. However, the recoveries of known amounts of MA from this cartridge were always more than 100%, and additional experiments suggested that a significant amount of MA was produced from unknown substance(s) in organic solvents by this anion exchange column (data not shown). Plasma methylmalonic acid (MMA) and its isomer succinic acid (SA) are also known to be extracted by this column (14). We have derivatized MMA and SA into DMP-MMA and DMP-SA, respectively, and analyzed them by the same HPLC condition as that for DMP-MA. The SRM was conducted using m/z 313 → m/z 98 for both DMP-MMA and DMP-SA. The results showed that DMP-MMA and DMP-SA were much more hydrophobic than DMP-MA and both compounds were eluted during washout phase with 0.2% formic acid in acetonitrile (after 6 min).
Second, pH of the final sample solution should not be more than 7 because an alkaline condition easily hydrolyzes DMP-MA. After the derivatization step, most of the excess reagents and hydrophilic impurities were precipitated by the addition of n-hexane but significant amounts of 3-hydroxy-1-methylpiperidine and 4-dimethylaminopyridine were recovered with DMP-MA in the final residue of the extract. Therefore, it was necessary to dissolve the final residue in 1% formic acid in water to keep the pH of the solution less than 7. The mobile phase of the HPLC (0.2% formic acid in water) was not sufficient to neutralize the final extract.
The highly sensitive quantification of serum MA can be useful for monitoring of de novo FAS, also called de novo lipogenesis, in normal humans. The diurnal variation of serum MA levels in a healthy human (Fig. 5) was similar to the variation of de novo FAS determined in humans by continuous intravenous infusion of sodium [1-13C]acetate and mass isotopomer distribution analysis (15, 16). According to Timlin et al. (16), de novo FAS peaked 4.2 h after ingestion of a meal whereas lipoprotein-triacylglycerol concentrations peaked at 2.0 h postmeal. Another study, by Hudgins et al. (15), showed that the maximum values of de novo FAS occurred in the evening, 3.0–9.0 h after the last meal, although the peak after every meal was not detected because a limited number of postprandial data points were obtained. In our data, postprandial increases of MA concentrations peaked between 2.5 h and 6.5 h after meals and the maximum value was observed in the night 6.0 h after dinner. In addition, the increase of MA concentration disappeared after skipping the meal. Thus, serum MA concentrations are regulated by food intake and appear to be a good marker that reflects de novo FAS in normal humans.
Because serum MA concentrations correlate well with de novo FAS, the most important enzyme that determines serum MA concentration is thought to be ACC, the rate-limiting enzyme in the fatty acid biosynthesis. In mammals, two ACC isoforms exist. Cytosolic ACC1 synthesizes malonyl-CoA, which participates in both de novo FAS and negative regulation of β-oxidation. In contrast, malonyl-CoA synthesized by mitochondrial ACC2 acts mainly as an inhibitor of β-oxidation (17). We cannot clarify at present which ACC contributes to serum MA concentration but both ACCs regulate de novo lipogenesis in a coordinated and complementary manner (18).
Under special conditions, however, other enzymes, MCD, and FAS can also be determinants of tissue malonyl-CoA levels and serum MA concentrations. For example, when MCD activity is reduced, such as with MCD deficiency, serum MA concentrations are elevated. Alternatively, when FAS is blocked by any drugs, such as C75 and cerulenin (2), MA concentrations increase in spite of reduced de novo FAS. Therefore, it is important to rule out the presence of such special conditions when we use serum MA as a biomarker for de novo FAS.
In summary, we developed a new method for the quantification of MA in human serum, which can be a good marker for de novo FAS. Derivatization of MA into DMP-MA allowed it to be quantified by LC-P-ESI-MS/MS with excellent sensitivity. Recovery and reproducibility experiments verified that this method provided highly reliable and reproducible analytical results.
Acknowledgments
The authors wish to thank the late Dr. Hiroshi Miyazaki for his helpful advice regarding mass spectrometry.
Footnotes
Abbreviations:
- ACC
- acetyl-CoA carboxylase
- DMP-MA
- Di-(1-methyl-3-piperidinyl)malonate
- FAS
- fatty acid synthase
- MA
- malonic acid (malonate)
- MCD
- malonyl-CoA decarboxylase
- MMA
- methylmalonic acid (methylmalonate)
- N-ESI
- ESI in negative mode
- P-ESI
- ESI in positive mode
- SA
- succinic acid (succinate)
- SRM
- selected reaction monitoring
This work was supported in part by a Grant-in-Aid for Scientific Research (C20591309) from the Japan Society for the Promotion of Science and a grant from the Ministry of Education, Culture, Sports, Science and Technology of Japan.
REFERENCES
- 1.McGarry J. D., Mills S. E., Long C. S., Foster D. W. 1983. Observations on the affinity for carnitine, and malonyl-CoA sensitivity, of carnitine palmitoyltransferase I in animal and human tissues. Demonstration of the presence of malonyl-CoA in non-hepatic tissues of the rat. Biochem. J. 214: 21–28. [DOI] [PMC free article] [PubMed] [Google Scholar]
- 2.Wolfgang M. J., Lane M. D. 2006. The role of hypothalamic malonyl-CoA in energy homeostasis. J. Biol. Chem. 281: 37265–37269. [DOI] [PubMed] [Google Scholar]
- 3.Yoshida T., Honda A., Miyazaki H., Matsuzaki Y. 2008. Determination of key intermediates in cholesterol and bile acid biosynthesis by stable isotope dilution mass spectrometry. Anal. Chem. Insights. 3: 45–60. [DOI] [PMC free article] [PubMed] [Google Scholar]
- 4.Gao J., Waber L., Bennett M. J., Gibson K. M., Cohen J. C. 1999. Cloning and mutational analysis of human malonyl-coenzyme A decarboxylase. J. Lipid Res. 40: 178–182. [PubMed] [Google Scholar]
- 5.Tanaka K., Hine D. G., West-Dull A., Lynn T. B. 1980. Gas-chromatographic method of analysis for urinary organic acids. I. Retention indices of 155 metabolically important compounds. Clin. Chem. 26: 1839–1846. [PubMed] [Google Scholar]
- 6.Tanaka K., West-Dull A., Hine D. G., Lynn T. B., Lowe T. 1980. Gas-chromatographic method of analysis for urinary organic acids. II. Description of the procedure, and its application to diagnosis of patients with organic acidurias. Clin. Chem. 26: 1847–1853. [PubMed] [Google Scholar]
- 7.MacPhee G. B., Logan R. W., Mitchell J. S., Howells D. W., Tsotsis E., Thorburn D. R. 1993. Malonyl coenzyme A decarboxylase deficiency. Arch. Dis. Child. 69: 433–436. [DOI] [PMC free article] [PubMed] [Google Scholar]
- 8.Santer R., Fingerhut R., Lässker U., Wightman P. J., Fitzpatrick D. R., Olgemöller B., Roscher A. A. 2003. Tandem mass spectrometric determination of malonylcarnitine: diagnosis and neonatal screening of malonyl-CoA decarboxylase deficiency. Clin. Chem. 49: 660–662. [DOI] [PubMed] [Google Scholar]
- 9.Hirayama T., Honda A., Matsuzaki Y., Miyazaki T., Ikegami T., Doy M., Xu G., Lea M., Salen G. 2006. Hypercholesterolemia in rats with hepatomas: increased oxysterols accelerate efflux but do not inhibit biosynthesis of cholesterol. Hepatology. 44: 602–611. [DOI] [PubMed] [Google Scholar]
- 10.Shiina I., Ibuka R., Kubota M. 2002. A new condensation reaction for the synthesis of carboxylic esters from nearly equimolar amounts of carboxylic acids and alcohols using 2-methyl-6-nitrobenzoic anhydride. Chem. Lett. (Jpn.). 31: 286–287. [Google Scholar]
- 11.Taguchi G. 1986. Introduction to Quality Engineering—Designing Quality into Products and Process Asian Productivity Organization, Tokyo. [Google Scholar]
- 12.Honda A., Mizokami Y., Matsuzaki Y., Ikegami T., Doy M., Miyazaki H. 2007. Highly sensitive assay of HMG-CoA reductase activity by LC-ESI-MS/MS. J. Lipid Res. 48: 1212–1220. [DOI] [PubMed] [Google Scholar]
- 13.Yamashita K., Kobayashi S., Tsukamoto S., Numazawa M. 2007. Synthesis of pyridine-carboxylate derivatives of hydroxysteroids for liquid chromatography-electrospray ionization-mass spectrometry. Steroids. 72: 50–59. [DOI] [PubMed] [Google Scholar]
- 14.Schmedes A., Brandslund I. 2006. Analysis of methylmalonic acid in plasma by liquid chromatography-tandem mass spectrometry. Clin. Chem. 52: 754–757. [DOI] [PubMed] [Google Scholar]
- 15.Hudgins L. C., Hellerstein M. K., Seidman C. E., Neese R. A., Tremaroli J. D., Hirsch J. 2000. Relationship between carbohydrate-induced hypertriglyceridemia and fatty acid synthesis in lean and obese subjects. J. Lipid Res. 41: 595–604. [PubMed] [Google Scholar]
- 16.Timlin M. T., Parks E. J. 2005. Temporal pattern of de novo lipogenesis in the postprandial state in healthy men. Am. J. Clin. Nutr. 81: 35–42. [DOI] [PubMed] [Google Scholar]
- 17.Abu-Elheiga L., Brinkley W. R., Zhong L., Chirala S. S., Woldegiorgis G., Wakil S. J. 2000. The subcellular localization of acetyl-CoA carboxylase 2. Proc. Natl. Acad. Sci. USA. 97: 1444–1449. [DOI] [PMC free article] [PubMed] [Google Scholar]
- 18.Postic C., Girard J. 2008. Contribution of de novo fatty acid synthesis to hepatic steatosis and insulin resistance: lessons from genetically engineered mice. J. Clin. Invest. 118: 829–838. [DOI] [PMC free article] [PubMed] [Google Scholar]


