Abstract
Advances in magnetic resonance imaging (MRI) have contributed greatly to the study of neurodegenerative processes, psychiatric disorders, and normal human development, but the effect of such improvements on the reliability of downstream morphometric measures has not been extensively studied. We examined how MRI-derived neurostructural measures are affected by three technological advancements: parallel acceleration, increased spatial resolution, and the use of a high bandwidth multiecho sequence. Test-retest data were collected from 11 healthy participants during 2 imaging sessions occurring approximately 2 weeks apart. We acquired 4 T1-weighted MP-RAGE sequences during each session: a non-accelerated anisotropic sequence (MPR), a non-accelerated isotropic sequence (ISO), an accelerated isotropic sequence (ISH), and an accelerated isotropic high bandwidth multiecho sequence (MEM). Cortical thickness and volumetric measures were computed for each sequence to assess test-retest reliability and measurement bias. Reliability was extremely high for most measures and similar across imaging parameters. Significant measurement bias was observed, however, between MPR and all isotropic sequences for all cortical regions and some subcortical structures. These results suggest that these improvements in MRI acquisition technology do not compromise data reproducibility, but that consistency should be maintained in choosing imaging parameters for structural MRI studies.
Introduction
Rapid improvements in magnetic resonance imaging (MRI) technology continue to provide new opportunities to deepen our understanding of brain structure and function in health and disease. Technologic developments include methods for accelerating the acquisition of MRI data (Griswold et al., 2002; Katscher et al., 2003; McDougall and Wright, 2005; Pruessmann et al., 1999; Tsao et al., 2003), improving the spatial resolution of MRI data (Augustinack et al., 2005), and reducing spatial distortions within and between types of sequences (Fischl et al., 2004a; van der Kouwe et al., 2008). Although these new techniques may provide theoretical advantages for studies of patients with neurologic or psychiatric disorders, few studies have examined the impact of such techniques on the quantitative measures thus derived.
Because the growing number of tools used to perform computational analysis on MRI data rely upon subtle differences in image signal intensity and tissue contrast to determine neuroanatomical boundaries (Fischl and Dale, 2000), slight differences in imaging methods could have a considerable impact on the reproducibility of morphometric measures. In addition, reliability may differ across brain structures due to variability in tissue contrast profiles and divergent modeling algorithms (e.g., cortical surface-based or voxel-based segmentation methods). The goal of this study was to assess the impact of novel MRI technologic parameters on reliability, using a variety of morphometric measures as outcome variables.
The present study examined the effect of three elements of MRI data acquisition technology on the reliability of neuroanatomical measures: geometric reduction in voxel size (higher resolution), acceleration through parallel acquisition (Carlson and Minemura, 1993), and use of a high bandwidth, multiecho T1-weighted sequence (Fischl et al., 2004a; van der Kouwe et al., 2008). First, parallel acquisition (i.e., the use of phased array head coils to acquire data from multiple points in space simultaneously) can reduce scanning time, with relatively small decreases in the signal-to-noise ratio (SNR) (Griswold et al., 2002; Roemer et al., 1990). The use of parallel acquisition has become increasingly common with the proliferation of acceleration-capable MRI equipment, but its effect on reliability has not been thoroughly studied, particularly with respect to the quantitative morphometric measures of interest in clinical investigation. Second, voxel geometry is often manipulated to gain advantages in scanning time. Larger voxel volumes require less scanning time and provide increased image SNR over smaller volumes (Edelstein et al., 1986), but they also increase partial volume effects whereby the signal measured from a single voxel may consist of contributions from more than one type of tissue. Advances in head coil and parallel acquisition technology have led to the capacity to collect data of higher spatial resolution with minimal reductions in SNR, but the impact of voxel size on morphometric measures has not been quantified systematically. Third, high bandwidth multiecho sequences have emerged that promise decreased spatial distortion and motion sensitivity while retaining similar levels of gray matter (GM)-white matter (WM) contrast relative to single-echo acquisitions (Fischl et al., 2004a; van der Kouwe et al., 2008). While these sequences hold promise, it is unclear whether these sequences provide data that are truly comparable to and as reliable as traditional sequences.
In the present study, we investigated the effects of three variants of the T1-weighted MP-RAGE sequence on the test-retest reliability of a variety of morphometric measures. First, we explored the impact of voxel size, comparing an MP-RAGE sequence with isotropic voxel geometry (1.0×1.0×1.0 mm) with an MP-RAGE sequence with anisotropic geometry historically used at our center (1.3×1.0×1.3 mm). Second, we determined the effect of conservative parallel imaging acceleration by comparing an isotropic MP-RAGE sequence acquired with an acceleration factor of 2 to the other sequences. Third, we compared the reliability of measures obtained from a high bandwidth, multiecho MP-RAGE sequence to that of relatively low bandwidth single-echo MP-RAGE sequences.
Methods
Participants
Two separate groups of participants provided test-retest structural MRI data. We scanned 5 young (mean age 21.4; SD3.8; 1 male, 4 female) and 6 older (mean age 64.3; SD 12.2; 3 male, 3 female) healthy adults in two identical sessions occurring approximately 2 weeks apart. As in previous studies of MRI-based morphometric structural reliability (Dickerson et al., 2008; Han et al., 2006), the interval between sessions included sources of variability that cannot be practically excluded from cross-sectional or longitudinal studies, and that may not be apparent over shorter intervals: instrument drift and subtle physiological changes, such as hydration status or blood pressure.
Apparatus and parameters
All MRI data were acquired on a Siemens 3 T TIM Trio scanner with a 12-channel head coil. Each scanning session included two acquisitions for each of four permutations of a T1-weighted MP-RAGE sequence. The sequences shared the following parameters: flip angle = 7°, TR=2530 ms, and T1=1100 ms. One non-accelerated anisotropic (1.3×1.0×1.3 mm) sequence was obtained with TE=3.39 ms. This sequence has been used historically at our center and serves as the primary comparison sequence, since previous reliability studies have been performed with this sequence. Two isotropic (1.0×1.0×1.0 mm) sequences were obtained with TE=3.48 ms, one with GRAPPA (Siemens iPAT implementation, acceleration factor =2) and one without. A GRAPPA-accelerated, 1.0 mm isotropic multiecho MP-RAGE sequence was also obtained, consisting of four echoes with alternating readout directions collected at TE=1.58+(n×1.74) ms (n=0,⋯,3) with the final volume generated from a root mean squared (RMS) average of echoes (Table 1).
Table 1.
Pulse sequence parameters
| Sequence | TR (ms) | T1 (ms) | TE(ms) | Flip angle | Bandwidth (Hz/pixel) | Voxel size (mm) | Acceleration | Scan time |
|---|---|---|---|---|---|---|---|---|
| Anisotropic MP-RAGE (MPR) | 2530 | 1100 | 3.39 | 7° | 195 | 1.3×1.0×1.3 | No | 8:07 |
| Isotropic MP-RAGE (ISO) | 2530 | 1100 | 3.48 | 7° | 195 | 1.0×1.0×1.0 | No | 10:49 |
| Accelerated isotropic MP-RAGE (ISH) | 2530 | 1100 | 3.48 | 7° | 195 | 1.0×1.0×1.0 | Yes (×2) | 6:03 |
| Multiecho MP-RAGE (MEM) | 2530 | 1100 | 1.58+(n×1.74), n = 0,…,3 | 7° | 698 | 1.0×1.0×1.0 | Yes (×2) | 5:53 |
Data processing
All imaging data were processed using version 4.0.1 of the FreeSurfer software package (Athinoula A. Martinos Center at the Massachusetts General Hospital, Harvard Medical School; http://www.surfer.nmr.mgh.harvard.edu/). Two acquisitions were collected for each sequence per imaging session and subsequently motion corrected, averaged, and resampled to create a single volume with greater SNR than either single acquisition. Preprocessing of volumes included an affine registration to Talairach space, B1 bias field correction, and removal of skull and dura voxels surrounding the brain. Each reconstruction volume underwent minimal manual editing by a single investigator to ensure that surfaces were properly registered to Talairach space and free of skull and dura. All other processing steps were fully automated using default parameters.
The FreeSurfer processing pipeline includes both surface-based (Dale et al., 1999) and volume-based (Fischl et al., 2002; Fischl et al., 2004a) streams. After preprocessing, each hemisphere was processed independently. Voxels were classified as either WM or non-WM based upon local voxel intensity values. Surface tessellations for each hemisphere were created across designated WM voxels and smoothed on the basis of intensity gradients between WM and GM voxels through a deformable surface algorithm. Surface errors, typically manifested as false “holes” or “bridges” formed between adjacent WM surfaces, were removed to ensure a topographically correct surface. The pial surface was determined using a similar deformable surface algorithm to shift the original WM surface towards and along voxel intensity gradients between GM and cerebrospinal fluid (CSF). Cortical thickness was then measured as the average of the shortest distance from the WM surface to the pial surface and from the pial surface to the WM surface (Fischl and Dale, 2000). A spherical map of the WM surface was created to facilitate cross-subject comparisons, and curvature and spatial information from the pial surface were used to parcellate the cortex into 35 predefined subunits of interest (Desikan et al., 2006; Fischl et al., 2004b).
For subcortical segmentation, structures were determined by assigning each voxel of the preprocessed volume to one of 16 possible labels on the basis of voxel intensity, spatial comparisons with a probabilistic training atlas, and subsequent comparisons to neighboring voxel labels. The resulting labels were comparable in accuracy to manually delineated subcortical segmentations (Fischl et al., 2002).
Statistical analysis
Reliability was examined for automatically generated surface-based and volumetric measures between imaging sessions and between sequences. Surface-based measures included mean cortical thickness (global, regional, and local/vertex-wise), WM volume, and GM volume. Regional cortical thickness was explored by limiting cortical thickness measures to one of five major cortical regions: frontal, parietal, temporal, occipital, and cingulate. Each region represented an amalgamation of cortical parcellation labels generated by the FreeSurfer processing stream. Cortical thickness measures were averaged across hemispheres, while volumetric measures were summed across hemispheres. Volumetric measures were collected for six subcortical structures: amygdala, caudate, hippocampus, pallidum (encompassing both the internal and external globus pallidus), putamen, and thalamus.
We examined two aspects of variability: (a) systematic differences in the magnitude of morphometric measures as a function of sequence (“bias”), and (b) the magnitude of within-subject test-retest variability of morphometric measurements (“reliability”). We computed intra-class correlation coefficients (ICC) to assess session-to-session reliability for each sequence (Shrout and Fleiss, 1979). Because we expected that future applications and research studies would typically employ only one sequence per participant, we computed ICCs relevant to the reliability of individual scores rather than the more liberal version pertaining to reliability of means averaged across sessions or across different sequences.
A within-subject, 2×4 factorial repeated-measures analysis of variance (ANOVA) assessed a session factor (first session, second session), a sequence factor (MPR, ISO, 1SH, MEM), and their interactions. Huynh-Feldt methods were corrected for an auto-correlated error when necessary. Significant omnibus tests were followed by Bonferroni-corrected pair-wise post hoc contrasts. To evaluate the effect of participant demographic factors on reliability, a subsequent analysis of covariance (ANCOVA) introduced the linear component of age as a covariate, while sex was included as an additional between-subject factor crossed with session and sequence.
In addition, we performed a variance decomposition statistical analysis to determine what proportion of the total variance was attributable to each factor of interest. General linear model methods computed the percentage variance in dependent variables accounted for by each orthogonal term. Age and sex were subsequently introduced as subject-level covariates of interest to determine what subset of mean subject differences was attributable to each demographic variable. A relatively high percentage of variance explained by the main effect of subjects (including age and sex) would indicate good reliability. All other terms indexed different aspects of poor reliability (unreliability), including undesirable mean changes across factor levels or poor factor level-to-level correlation (all interactions with subjects).
To assess local cortical thickness reliability, vertex-wise statistical maps of the entire cortical surface were generated using Matlab version 7.1. The medial walls and corpus callosum (determined by cortical parcellation) were excluded. Individual cortical thickness maps were transformed onto an average surface prior to analysis, and all surface-based data were smoothed following statistical calculations using an iterative nearest-neighbor averaging procedure. We applied smoothing iterations equivalent to a surface-based Gaussian smoothing kernel of approximately 5–6 mm (Han et al., 2006). For test-retest comparisons, vertex-wise ICCs were computed for each sequence across scanning sessions. For intersequence comparisons, we computed surface maps of mean cortical thickness differences between each sequence type.
We performed a statistical power analysis to estimate the minimum detectable difference for each measure of interest. Using methods described by Han et al., 2006, the mean value of absolute differences between scanning sessions was used to estimate the standard deviation of measurement error. A two-tailed power analysis was then computed to determine the minimum effect size required for a power (1-β) of 0.9 at a significance level (α) of 0.05. Percent values are calculated using the mean structure values obtained within this study.
Results
Test-retest reliability of traditional T1 sequence
The traditional MP-RAGE sequence with anisotropic geometry (1.3×1.0×1.3 mm) served as a “gold standard” against which the new sequences were compared. Intra-class correlation analysis demonstrated a high level of reliability for all measures (Table 2). Surface-based measures were particularly reproducible, with all computed ICCs falling above 0.95. Subcortical volumes were typically reliable; only measures of the pallidum fell below 0.9.
Table 2.
Test-retest intra-class correlation coefficients (95% confidence interval) by sequence
| Measure | Brain area | MPR | ISO | ISH | MEM |
|---|---|---|---|---|---|
| Cortical thickness | Global | 0.994 (0.986–0.998) | 0.987 (0.975–0.996) | 0.960 (0.914–0.987) | 0.986 (0.969–0.995) |
| Frontal | 0.988 (0.973–0.996) | 0.983 (0.963–0.995) | 0.970 (0.935–0.990) | 0.979 (0.955–0.993) | |
| Temporal | 0.989 (0.915–0.987) | 0.975 (0.945–0.992) | 0.969 (0.933–0.990) | 0.975 (0.947–0.992) | |
| Parietal | 0.960 (0.975–0.996) | 0.985 (0.968–0.995) | 0.922 (0.838–0.975) | 0.979 (0.936–0.990) | |
| Occipital | 0.987 (0.973–0.996) | 0.982 (0.961–0.994) | 0.946 (0.886–0.983) | 0.959 (0.914–0.987) | |
| Cingulate | 0.972 (0.941–0.991) | 0.975 (0.947–0.992) | 0.926 (0.845–0.976) | 0.944 (0.882–0.982) | |
| Volume | White matter | 0.999 (0.998–1.000) | 0.999 (0.998–1.000) | 0.999 (0.997–1.000) | 0.999 (0.998–1.000) |
| Gray matter | 0.997 (0.994–0.999) | 0.996 (0.991–0.999) | 0.989 (0.977–0.997) | 0.996 (0.991–0.999) | |
| Whole brain | 0.999 (0.998–1.000) | 0.999 (0.999–1.000) | 0.999 (0.998–1.000) | 0.999 (0.998–1.000) | |
| Amygdala | 0.942 (0.877–0.981) | 0.874 (0.743–0.958) | 0.949 (0.893–0.984) | 0.856 (0.709–0.952) | |
| Caudate | 0.988 (0.974–0.996) | 0.991 (0.979–0.997) | 0.994 (0.988–0.998) | 0.994 (0.986–0.998) | |
| Hippocampus | 0.955 (0.906–0.986) | 0.969 (0.930–0.990) | 0.989 (0.976–0.997) | 0.979 (0.954–0.993) | |
| Pallidum | 0.876 (0.749–0.959) | 0.570 (0.246–0.841) | 0.706 (0.445–0.897) | 0.854 (0.709–0.951) | |
| Putamen | 0.956 (0.907–0.986) | 0.951 (0.897–0.984) | 0.971 (0.939–0.991) | 0.921 (0.836–0.974) | |
| Thalamus | 0.966 (0.928–0.989) | 0.964 (0.923–0.988) | 0.984 (0.965–0.995) | 0.981 (0.960–0.994) |
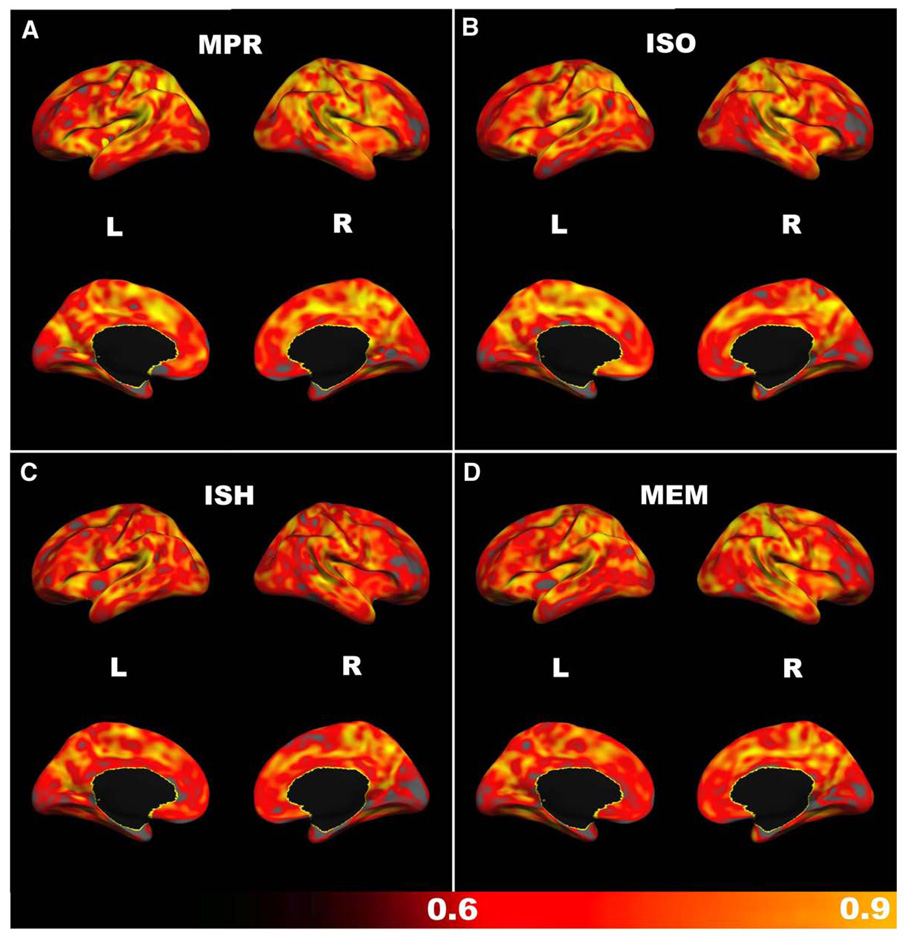
Surface maps of cortical thickness reliability reveal high local ICC values across most of the cortex (Fig. 1A). Areas of relatively low reliability include entorhinal, medial orbitofrontal, lingual, and right rostral middle frontal cortex.
Fig. 1.
Cortical thickness: intra-class correlation coefficients (ICCs) across scanning sessions, calculated for each vertex on the cortical surface. Gray areas represent ICC values of less than 0.6. (A) anisotropic MP-RAGE, (B) isotropic MP-RAGE, (C) accelerated MP-RAGE, (D) accelerated isotropic multiecho MP-RAGE.
Effects of voxel size
To explore the effects of voxel size on morphometric measures and their reliability, we compared the MP-RAGE sequence with isotropic voxel geometry (1.0×l.0×1.0 mm) against the standard anisotropic MP-RAGE. With respect to session-to-session (test-retest) reliability, voxel size had no obvious effect on most morphometric measures. An exception was measures of pallidum volume, where reliability was low for the isotropic sequence relative to the anisotropic sequence. Surface maps of cortical thickness reliability were similar between the anisotropic and isotropic MP-RAGE sequences (Fig. 1B).
Means for cortical measures (both thickness and volume) were higher for the isotropic sequence compared to the anisotropic MP-RAGE (p <0.01, Bonferroni corrected). Bias was observed in all cortical areas between these sequences, but was particularly strong in the frontal and parietal lobes (Table 3). All values were significant to p < 0.01, Bonferroni corrected.
Table 3.
Mean (SD) cortical thickness difference between isotropic and anisotropic sequences (mm)
| Brain region | ISO>MPR | ISH>MPR | MEM>MPR |
|---|---|---|---|
| Global | 0.087 (0.016) | 0.076 (0.019) | 0.095 (0.021) |
| Frontal | 0.085 (0.018) | 0.087 (0.022) | 0.115 (0.016) |
| Temporal | 0.078 (0.032) | 0.060 (0.026) | 0.099 (0.037) |
| Parietal | 0.105 (0.026) | 0.086 (0.035) | 0.097 (0.033) |
| Occipital | 0.066 (0.022) | 0.052 (0.015) | 0.036 (0.028) |
| Cingulate | 0.059 (0.037) | 0.052 (0.036) | 0.061 (0.045) |
Effects of parallel imaging acceleration
Second, we investigated the effect of conservative parallel imaging acceleration on morphometric measures by comparing an isotropic MP-RAGE sequence acquired with an acceleration factor of two to the anisotropic MP-RAGE. We found minimal effects of acceleration on the reliability of most morphometric measures (Table 2). Parietal and cingulate cortical thickness ICCs were noticeably lower in the accelerated sequence compared to the standard anisotropic MP-RAGE, but were still highly reliable. As with the non-accelerated isotropic MP-RAGE, putamen measures were the least reliable of all morphometric measures examined. Surface maps of cortical thickness reliability for the accelerated isotropic MP-RAGE were similar to that of the anisotropic sequence (Fig. 1C), with regions of relatively low reliability in entorhinal, lingual, and right rostral middle frontal cortex. In contrast to the anisotropic MP-RAGE, however, reliability was also low for insular cortex, cuneus, pericalcarine cortex, and superior parietal cortex.
With respect to measurement bias, cortical thickness means were significantly higher for the accelerated isotropic MP-RAGE compared to the anisotropic MP-RAGE (Table 3).
Effects of multiecho sequence
Third, we compared the reliability of measures obtained from a high bandwidth multiecho MP-RAGE sequence to that of the relatively low bandwidth single-echo anisotropic MP-RAGE. Reliability for multiecho morphometric measures was generally high and comparable to anisotropic MP-RAGE measures (Table 2). In particular, pallidum volume measures were more consistent than such measures from other isotropic sequences. Surface maps of cortical thickness reliability for the accelerated multiecho MP-RAGE were similar to those of the standard anisotropic sequence (Fig. 1D), with regions of relatively low reliability in entorhinal, lingual, medial orbitofrontal, and right rostral middle frontal cortex. Additionally, the multiecho sequence was less reliable than the anisotropic sequence for insular cortex and cuneus thickness.
As with other isotropic sequences, we found a significant bias towards higher cortical thickness measures using the multiecho MP-RAGE compared to the anisotropic MP-RAGE. This bias was consistent across the cortex and was particularly strong in frontal, parietal, and temporal regions (Table 3).
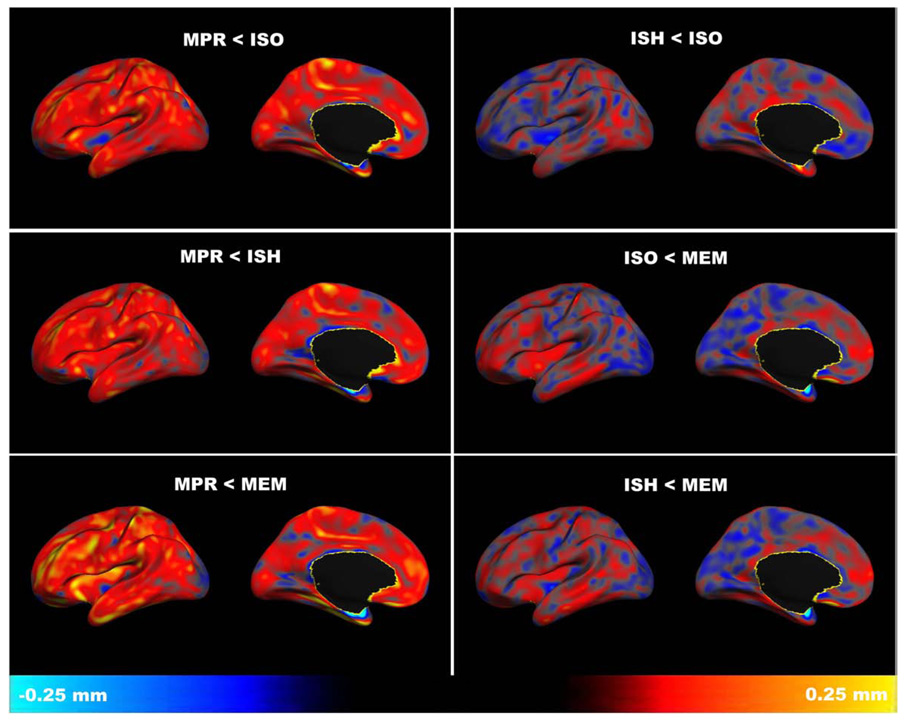
Voxel-wise maps of mean cortical thickness differences show the measurement bias between isotropic and anisotropic sequences to be pervasive across the cortex (Fig. 2). This bias is most evident between the anisotropic and multiecho MP-RAGE sequences, especially in frontal regions. Between isotropic sequences, cortical thickness differences are more limited with no perceptible bias towards one sequence or another.
Fig. 2.
Cortical thickness: mean difference between sequences, calculated for each vertex on the cortical surface (left hemisphere shown; right hemisphere is similar). Comparisons between anisotropic and isotropic sequences reveal a bias towards smaller measurements in the anisotropic MP-RAGE (MPR) relative to the isotropic single-echo MP-RAGE (ISO), accelerated isotropic single-echo MP-RAGE (ISH), and accelerated isotropic multiecho MP-RAGE (MEM) sequences. Cortical thickness differences tend to be smaller and more evenly distributed between isotropic sequences (ISO<ISH, ISO<MEM, ISH<MEM) than between anisotropic and isotropic sequences.
Comprehensive statistical analysis
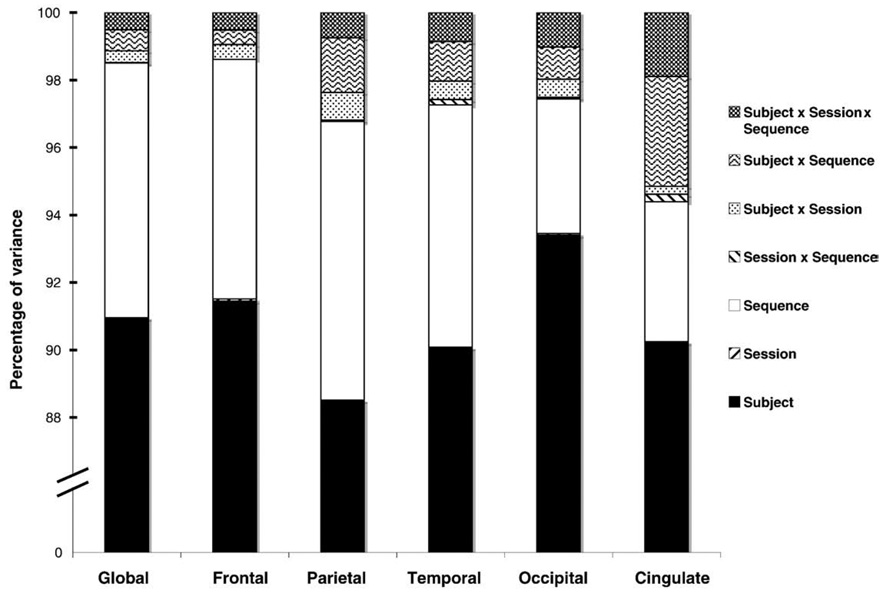
For cortical thickness measures, the percentage variance explained by differences between subject means is near or above 90% for all measures, indicating a high degree of overall reliability (Fig. 3). Differences between sequence means was the next largest contributor to variance behind that of subjects. Subject × sequence interactions also contributed some variance, particularly for the cingulate. The proportion of variance accounted for by mean differences between scanning sessions, an aspect of test-retest reliability, was below 0.01% of total variance for all measures. Other terms contributed little to negligible variance (below 2%).
Fig. 3.
Percentage of variance for cortical thickness measures by factor and interaction. Subject and sequence factors accounted for the majority (>90%) of variance in these measures, indicating a high degree of test-retest reliability.
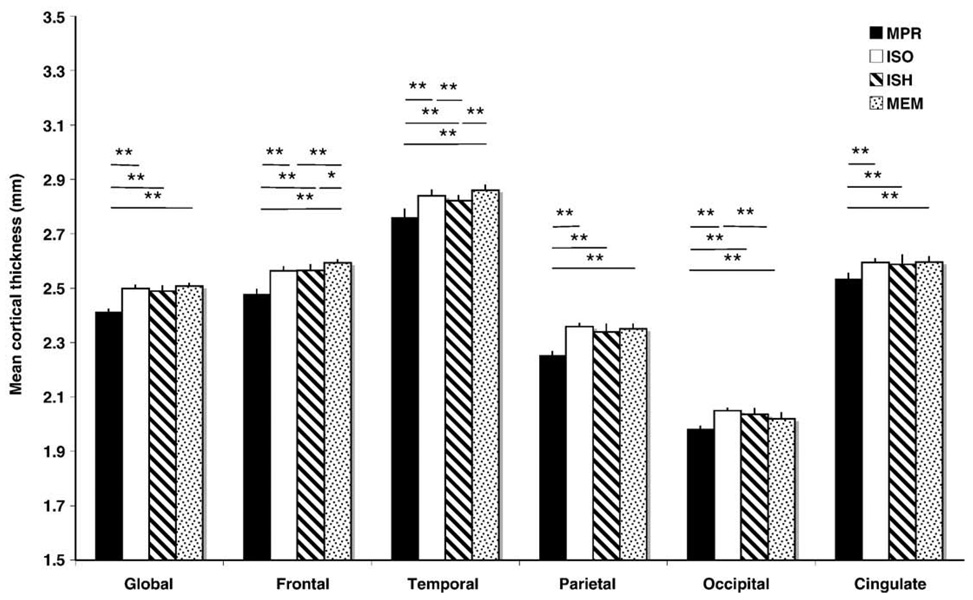
Consistent with the paired comparisons of sequences above, as well as the percentage variance accounted for by mean sequence differences, repeated measures ANOVAs revealed an effect of sequence for all cortical thickness measures. Bonferroni-corrected post hoc contrasts of mean differences found that the anisotropic MP-RAGE measures were lower in all cortical regions compared to all isotropic MP-RAGE measures (Fig. 4). In addition, the high-bandwidth multiecho MP-RAGE produced higher measures than other isotropic sequences in frontal cortex (p <0.05, corrected) and lower measures in occipital cortex compared to the non-accelerated isotropic MP-RAGE (p <0.01, corrected). The accelerated single-echo MP-RAGE produced lower measures of temporal cortical thickness than other isotropic sequences (p <0.01, corrected). The main effect of scanning session and the interaction between session × sequence were not significant in any cortical region.
Fig. 4.
Mean cortical thickness measures by sequence (*p<0.05, **p<0.01, Bonferroni corrected). Error bars indicate mean cortical thickness difference across sessions. Measures derived from the anisotropic MP-RAGE (MPR) were significantly lower compared to all other sequences for all cortical regions. Multiecho MP-RAGE (MEM) measures tended to be higher in frontal and temporal regions, but lower in the occipital lobe. In addition, the temporal cortical thickness metric was significantly decreased for accelerated isotropic MP-RAGE (ISH) measures compared to non-accelerated isotropic MP-RAGE (ISO).
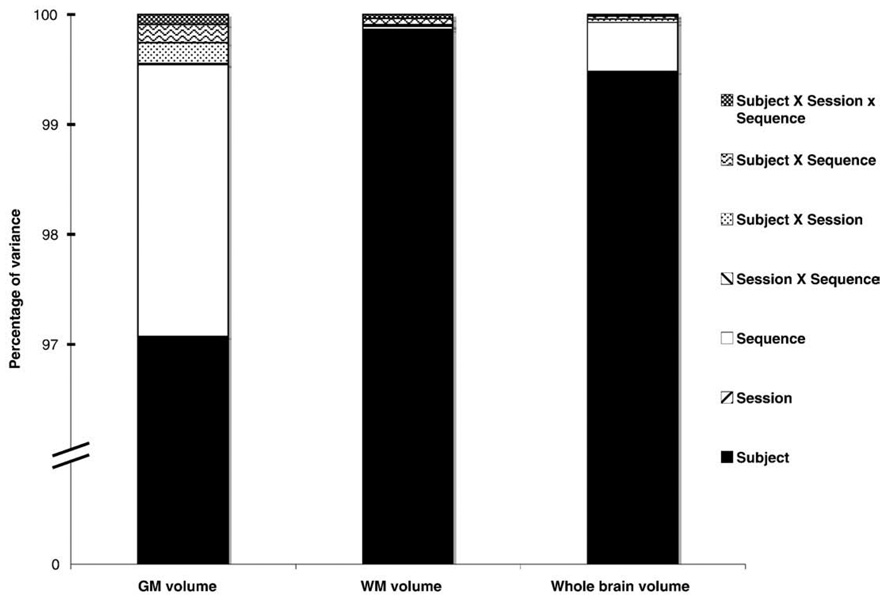
WM volume, with greater than 99.8% of variance explained by between-subject mean differences, was the most reliable measure examined in this study (Fig. 5). As with measures of cortical thickness, GM volume was significantly lower for the anisotropic MP-RAGE compared to all isotropic sequences (p <0.001, corrected). Between-subject differences accounted for greater than 97% of total variance in GM volume measures, however, with differences between sequences contributing only 2.5% to total variance. The main effect of scanning session and the interaction between session × sequence were not significant for either WM or GM volume measures.
Fig. 5.
Percentage of variance for brain volume measures by factor and interaction. Subject and sequence factors accounted for greater than 99.5% of total variance for surface-based measures of brain volume. For measures of WM volume, where a measurement bias between sequences was not observed, subject factors alone accounted for almost all variance.
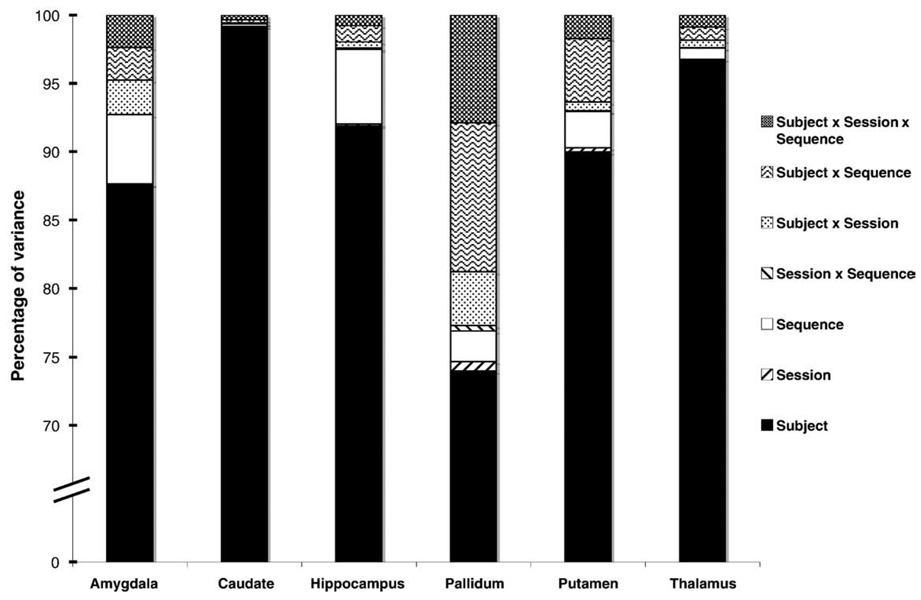
Subcortical volume measures were generally less precise than cortical or WM measures, although precision varied greatly by structure. Measures of the caudate and thalamus were among the most reliable with between-subject differences accounting for more than 98% and 95% of total variance, respectively (Fig. 6). Measures of the pallidum were the least reliable. The proportion of variance attributed to between-session mean differences was below 0.6% for all measures.
Fig. 6.
Percentage of variance in segmented measures of volume by structure. Subject factors contributed most to the variance (>70%) for all measures. For measures of caudate and thalamic volume, which were among the most reliable examined, variance consisted almost entirely of between-subject differences. Hippocampal and amygdalar measures were also highly reliable, with differences between sequences accounting for somewhat more variance than for the caudate or thalamus. Measures of pallidal volume were among the least reliable examined, with interactions between subject × sequence, subject × session, and subject × sequence × session contributing noticeably to overall variance.
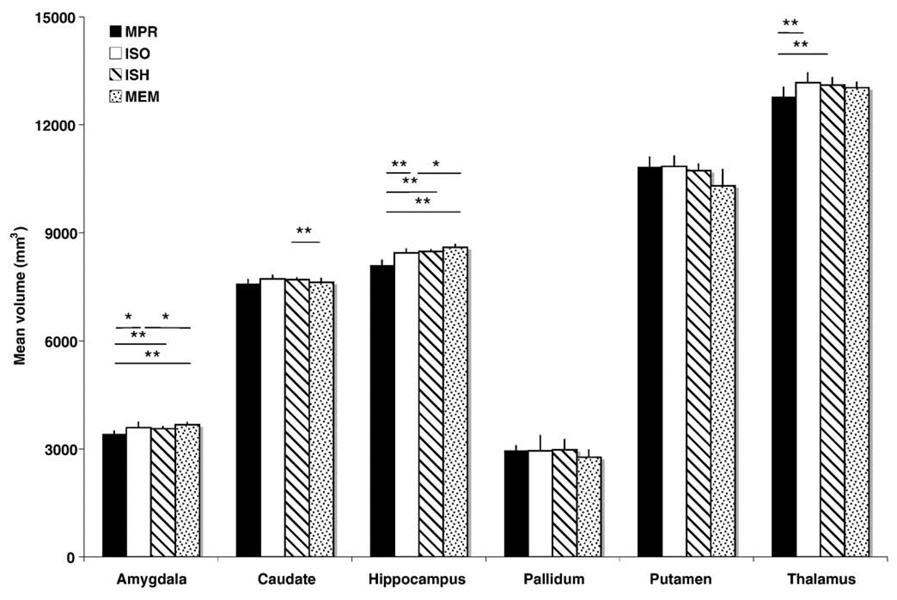
Repeated measures ANOVAs revealed a significant effect of sequence for all structures except the pallidum (Fig. 7). Measures of amygdalar and hippocampal volume were lower for the anisotropic MP-RAGE compared to all other sequences (p <0.05, Bonferroni corrected). In contrast, measures of amygdalar and hippocampal volume tended to be higher for the multiecho MP-RAGE compared to all other sequences, although this difference was only significant when comparing the multiecho MP-RAGE to non-accelerated (MPR, ISO) sequences (p <0.01, Bonferroni corrected). Measures of thalamus volume were also lower for the anisotropic MP-RAGE compared to both single echo isotropic (ISO, 1SH) sequences (p <0.05, Bonferroni corrected), while the multiecho sequence produced lower measures of caudate volume compared to the accelerated isotropic single-echo MP-RAGE (p <0.01, Bonferroni corrected). No main effect of session or interaction between session × sequence was significant among subcortical volume measures.
Fig. 7.
Mean segmented volume of structures by sequence (*p<0.05, **p<0.01, Bonferroni corrected). Error bars indicate mean volume differences across sessions. Anisotropic MP-RAGE (MPR) measures were significantly lower for the amygdala, hippocampus, and thalamus compared to all other sequences, whereas multiecho MPRAGE (MEM) measures were significantly higher compared to the non-accelerated isotropic MP-RAGE (ISO).
No mean differences were sufficient to reach the minimal threshold required to achieve a power of 0.9. Thus, it is impossible to reasonably conclude that non-significant results were not susceptible to type 11 error, and it is therefore possible that further measurement bias exists between sequences that is undetectable given our sample size. It is possible, however, to determine through power analysis the minimum difference at which reasonable power (1-β>0.9) remains for each measure of interest, and therefore establish a practical threshold of reliability for each structure (Table 4). For measures of cortical thickness, most differences greater than 2% of the mean can be reliably detected given our relatively small sample size; volumetric difference thresholds vary greatly by structure and sequence, from 0.5–1% for surfaced-based measures of white matter volume to 16.6% for the segmented pallidum.
Table 4.
Minimum detectable difference between groups by sequence; α = 0.5, 1-β = 0.9, two-tailed
| Measure | Brain area | MPR | ISO | ISH | MEM |
|---|---|---|---|---|---|
| Cortical thickness (mm) | Global | 0.015 (0.62%) | 0.024 (0.97%) | 0.049 (1.97%) | 0.029 (1.14%) |
| Frontal | 0.028 (1.14%) | 0.036 (1.42%) | 0.047 (1.84%) | 0.044 (1.70%) | |
| Temporal | 0.044 (1.61%) | 0.032 (1.14%) | 0.040 (1.43%) | 0.030 (1.05%) | |
| Parietal | 0.026 (1.15%) | 0.031 (1.33%) | 0.071 (3.02%) | 0.042 (1.79%) | |
| Occipital | 0.025 (1.91%) | 0.031 (1.52%) | 0.053 (2.59%) | 0.039 (1.91%) | |
| Cingulate | 0.035 (1.37%) | 0.033 (1.25%) | 0.046 (1.79%) | 0.054 (2.08%) | |
| Volume (mm3) | White matter | 4307 (0.80%) | 4476 (0.84%) | 5297 (0.99%) | 4139 (0.77%) |
| Gray matter | 4851 (1.08%) | 6616 (1.41%) | 10573 (2.26%) | 6753 (1.44%) | |
| Whole brain | 7177 (0.73%) | 5739 (0.57%) | 6346 (0.63%) | 5961 (0.59%) | |
| Amygdala | 152 (4.45%) | 221 (6.18%) | 144 (4.05%) | 274 (7.48%) | |
| Caudate | 247 (3.25%) | 209 (2.70%) | 175 (2.27%) | 125 (1.64%) | |
| Hippocampus | 278 (3.43%) | 249 (2.95%) | 134 (1.59%) | 192 (2.24%) | |
| Pallidum | 346 (11.7%) | 489 (16.6%) | 421 (14.2%) | 421 (15.2%) | |
| Putamen | 505 (4.66%) | 454 (4.19%) | 372 (3.47%) | 471 (4.57%) | |
| Thalamus | 505 (3.95%) | 540 (4.10%) | 314 (2.40%) | 409 (3.14%) |
A subsequent repeated measures ANCOVA introduced sex as an additional between-subjects factor and the linear effect of age as a covariate. After Bonferroni correction for multiple comparisons, putamen and pallidum volumes were found to be significantly and negatively correlated with age. No significant main effect of sex or significant interaction with sex or age was observed.
Discussion
The goal of this study was to investigate the effects of three variants of the T1-weighted MP-RAGE sequence on the test-retest reliability of a variety of morphometric measures. We found most MRI-derived neuroanatomical measures to be highly reliable, and the correlations were largely unaffected by voxel geometry, parallel imaging acceleration, or the use of high-bandwidth multiecho techniques. Age and sex had no discernable effect on morphometric reliability. While reliability was high when comparing measures within sequences, a significant measurement bias was observed between anisotropic and isotropic sequences in all cortical brain areas.
Surface-based measures, including cortical thickness, WM volume, and GM volume, were highly consistent for all sequences in test-retest analyses. Because the automated procedures used to produce these measures relied on WM and GM contrast to identify brain surfaces, and because T1-weighted sequences were particularly suited to providing this contrast (Deichmann et al., 2000; Mugler and Brooke-man, 1991), we expected that surface-based measures would perform well.
In contrast, the reliability of voxel-based segmentation measures varied greatly by structure. Volumetric measures of the caudate were often more reliable than surface-based measures, while the reliability of pallidum measures fell well below all other measures in a subset of sequences. It is likely that the precision of subcortical volumes was affected both by intrinsic tissue contrast properties as well as the contrast between surrounding tissue types. For example, both the caudate and thalamus, two of the most reliable subcortical measures examined, typically exhibit tissue contrast profiles reasonably distinct from that of WM (Fischl et al., 2002). In addition, both structures abut the lateral ventricle and thus benefit from the contrast provided by adjacent cerebrospinal fluid, which appears hypointense in T1-weighted images. In comparison, the T1 contrast profile of the pallidum is less distinct from that of neighboring WM, making differentiation of these tissues more challenging. This fact does not explain, however, why the reliability of pallidum measures is higher for anisotropic and multiecho sequences compared to the accelerated and non-accelerated isotropic single-echo MP-RAGE sequences.
Measurement bias was observed across voxel geometry. The anisotropic MP-RAGE sequence consistently underestimated measures of cortical thickness, GM volume, amygdalar volume, and hippocampal volume relative to all isotropic sequences. Because this bias was present in both surface-based and voxel-based measures, and because the hippocampus and amygdala share a similar T1 contrast profile to that of GM, it is unlikely that such bias is attributable to specific surface-based or voxel-based procedures. Due to the design of our study and the particular sequences employed, however, it is unclear what proportion of the observed error is due to voxel volume as opposed to voxel geometry, and further investigation is required to separate the effects of these two variables on measurement bias.
This study focused on the precision, not the accuracy, of MRI-derived neurostructural measures. While the accuracy of automated neuroanatomical measures has been addressed (Fischl and Dale, 2000; Fischl et al., 2004a), we know of no studies that explore the accuracy of automated cortical thickness measures as a function of imaging parameters. Previous reliability studies sought to understand reproducibility through artificial manipulation of cortical thickness in MRI images (Lerch and Evans, 2005), or through the use of a known phantom volume (Mori et al., 2002), but in vivo examinations of human brain structure such as ours have no absolute standard with which to establish the accuracy of measures across imaging sequences. It is therefore impossible to determine which of the sequences we examined produced the most accurate morphometric measures.
Between isotropic sequences, the multiecho MP-RAGE tended to overestimate frontal cortical thickness, hippocampal volume, and amygdalar volume and underestimate occipital cortical thickness relative to both single-echo isotropic sequences; these differences usually reached significance when compared with the non-accelerated isotropic sequence. Between isotropic single-echo sequences there was a slight tendency for imaging acceleration to produce lower cortical thickness measures in every region but the frontal cortex, although this bias was significant only in temporal cortex. All differences within and between isotropic sequences were extremely small due to the test-retest nature of the study, however, and suffer from reduced (l-β<0.9) statistical power. We therefore cannot conclude that bias does not exist in these non-significant findings, but only that instances of undetected bias are below the threshold of minimum detection (Table 4).
The use of parallel acceleration had a negligible effect on reliability of morphometric measures. In light of the conservative acceleration factor used, this result is in agreement with another study of cortical thickness reliability and acceleration employing sensitivity encoding (SENSE)-based (Pruessmann et al., 1999) techniques (Park et al., 2008); the present study extends these results to cortical and subcortical volumetric measures for GRAPPA-based acceleration. Scanning time is often a constraint in structural neuroimaging studies, either in practical terms for research subjects or financially for investigators. The present results provide compelling evidence that parallel imaging techniques, when implemented at conservative levels, are able to dramatically reduce scanning time with no considerable loss of precision.
The high degree of reproducibility among cortical thickness measures for all sequences suggests that subtle differences in thickness between groups of patients can be reliably detected using a variety of T1-weighted MP-RAGE sequence parameters, assuming that such parameters are kept consistent within any given structural neuroimaging study. The reliability of volumetric measures, however, varied by structure. The use of multispectral data (e.g., T2, T2*, proton density) may help improve current segmentation algorithms that rely heavily upon T1-weighted image contrasts, but co-registration of multiple images is made difficult by varying B0 distortions between sequences and by the additional scanning time typically required to acquire separate image contrasts. Multiecho sequences, however, can be bandwidth-matched to such contrasts, eliminating differences in B0 distortions and facilitating co-registration. In addition, multiecho MP-RAGE sequences provide inherent T2* contrast information with no additional scanning time. Such advantages have been shown to improve contrast between WM and GM (Han et al., 2006) and between dura and GM (van der Kouwe et al., 2008), and may provide a basis for improving volumetric segmentation algorithms, either through the acquisition and co-registration of multispectral data or through the interpolation of additional contrast data.
Conclusions
Reliability of morphometric measures was generally high and largely unaffected by small differences in voxel geometry, the use of conservative parallel acceleration factors, or the use of high-bandwidth multiecho techniques. Surface-based measures of cortical thickness, white matter volume, and gray matter volume tended to be more precise than segmentation-based measures of volume. Larger, anisotropic voxel sizes resulted in a significant measurement bias for surface-based brain measures and some volume-based measures compared to smaller, isotropic voxel sizes.
Acknowledgments
This study was supported by grants from the N1H AG021525 and T32 GM007484, NIA R01-AG29411 and R21-AG29840, and the Alzheimer's Association.
We would like to thank Steven Shannon, Sheeba Arnold Anteraper, and Nicholas Harrington for technical assistance during data collection.
The Athinoula A. Martinos Imaging Center at the McGovern Institute is supported in part by a generous gift from Pat and Lore McGovern.
The Athinoula A. Martinos Center for Biomedical Imaging at MGH is supported by the National Center for Research Resources (P41RR14075), the Mental Illness and Neuroscience Discovery (MIND) Institute, and the National Alliance for Medical Image Computing (NAM1C) (N1B1B U54 EB005149).
Footnotes
Disclosure statement
The authors have no actual or potential conflicts of interest.
References
- Augustinack JC, van der Kouwe AJ, Blackwell ML, Salat DH, Wiggins CJ, Frosch MP, Wiggins GC, Potthast A, Wald LL, Fischl BR. Detection of entorhinal layer II using 7 Tesla [corrected] magnetic resonance imaging. Ann. Neurol. 2005;57:489–494. doi: 10.1002/ana.20426. [DOI] [PMC free article] [PubMed] [Google Scholar]
- Carlson JW, Minemura T. Imaging time reduction through multiple receiver coil data acquisition and image reconstruction. Magn. Reson. Med. 1993;29:681–687. doi: 10.1002/mrm.1910290516. [DOI] [PubMed] [Google Scholar]
- Dale AM, Fischl B, Sereno MI. Cortical surface-based analysis. I. Segmentation and surface reconstruction. Neuroimage. 1999;9:179–194. doi: 10.1006/nimg.1998.0395. [DOI] [PubMed] [Google Scholar]
- Deichmann R, Good CD, Josephs O, Ashburner J, Turner R. Optimization of 3-D MP-RAGE sequences for structural brain imaging. Neuroimage. 2000;12:112–127. doi: 10.1006/nimg.2000.0601. [DOI] [PubMed] [Google Scholar]
- Desikan RS, Segonne F, Fischl B, Quinn BT, Dickerson BC, Blacker D, Buckner RL, Dale AM, Maguire RP, Hyman BT, Albert MS, Killiany RJ. An automated labeling system for subdividing the human cerebral cortex on MRI scans into gyral based regions of interest. Neuroimage. 2006;31:968–980. doi: 10.1016/j.neuroimage.2006.01.021. [DOI] [PubMed] [Google Scholar]
- Dickerson BC, Fenstermacher E, Salat DH, Wolk DA, Maguire RP, Desikan R, Pacheco J, Quinn BT, Van der Kouwe A, Greve DN, Blacker D, Albert MS, Killiany RJ, Fischl B. Detection of cortical thickness correlates of cognitive performance: reliability across MRI scan sessions, scanners, and field strengths. Neuroimage. 2008;39:10–18. doi: 10.1016/j.neuroimage.2007.08.042. [DOI] [PMC free article] [PubMed] [Google Scholar]
- Edelstein WA, Glover GH, Hardy CJ, Redington RW. The intrinsic signal-to-noise ratio in NMR imaging. Magn. Reson. Med. 1986;3:604–618. doi: 10.1002/mrm.1910030413. [DOI] [PubMed] [Google Scholar]
- Fischl B, Dale AM. Measuring the thickness of the human cerebral cortex from magnetic resonance images. Proc. Natl. Acad. Sci. U. S. A. 2000;97:11050–11055. doi: 10.1073/pnas.200033797. [DOI] [PMC free article] [PubMed] [Google Scholar]
- Fischl B, Salat DH, Busa E, Albert M, Dieterich M, Haselgrove C, van der Kouwe A, Killiany R, Kennedy D, Klaveness S, Montillo A, Makris N, Rosen B, Dale AM. Whole brain segmentation: automated labeling of neuroanatomical structures in the human brain. Neuron. 2002;33:341–355. doi: 10.1016/s0896-6273(02)00569-x. [DOI] [PubMed] [Google Scholar]
- Fischl B, Salat DH, van der Kouwe AJ, Makris N, Segonne F, Quinn BT, Dale AM. Sequence-independent segmentation of magnetic resonance images. Neuroimage. 2004a;23 (Suppl 1):S69–S84. doi: 10.1016/j.neuroimage.2004.07.016. [DOI] [PubMed] [Google Scholar]
- Fischl B, van der Kouwe A, Destrieux C, Halgren E, Segonne F, Salat DH, Busa E, Seidman LJ, Goldstein J, Kennedy D, Caviness V, Makris N, Rosen B, Dale AM. Automatically parcellating the human cerebral cortex. Cereb. Cortex. 2004b;14:11–22. doi: 10.1093/cercor/bhg087. [DOI] [PubMed] [Google Scholar]
- Griswold MA, Jakob PM, Heidemann RM, Nittka M, Jellus V, Wang J, Kiefer B, Haase A. Generalized autocalibrating partially parallel acquisitions (GRAPPA) Magn. Reson. Med. 2002;47:1202–1210. doi: 10.1002/mrm.10171. [DOI] [PubMed] [Google Scholar]
- Han X, Jovicich J, Salat D, van der Kouwe A, Quinn B, Czanner S, Busa E, Pacheco J, Albert M, Killiany R, Maguire P, Rosas D, Makris N, Dale A, Dickerson B, Fischl B. Reliability of MRI-derived measurements of human cerebral cortical thickness: the effects of field strength, scanner upgrade and manufacturer. Neuroimage. 2006;32:180–194. doi: 10.1016/j.neuroimage.2006.02.051. [DOI] [PubMed] [Google Scholar]
- Katscher U, Bornert P, Leussler C, van den Brink JS. Transmit SENSE. Magn. Reson. Med. 2003;49:144–150. doi: 10.1002/mrm.10353. [DOI] [PubMed] [Google Scholar]
- Lerch JP, Evans AC. Cortical thickness analysis examined through power analysis and a population simulation. Neuroimage. 2005;24:163–173. doi: 10.1016/j.neuroimage.2004.07.045. [DOI] [PubMed] [Google Scholar]
- McDougall MP, Wright SM. 64-channel array coil for single echo acquisition magnetic resonance imaging. Magn. Reson. Med. 2005;54:386–392. doi: 10.1002/mrm.20568. [DOI] [PubMed] [Google Scholar]
- Mori K, Hagino H, Saitou O, Yotsutsuji T, Tonami S, Nakamura M, Kuranishi M. [Effects of the volume and shape of voxels on the measurement of phantom volume using three-dimensional magnetic resonance imaging] Nippon Hoshasen Gijutsu Gakkai Zasshi. 2002;58:88–93. doi: 10.6009/jjrt.kj00003111355. [DOI] [PubMed] [Google Scholar]
- Mugler JP, 3rd, Brookeman JR. Rapid three-dimensional T1-weighted MR imaging with the MP-RAGE sequence. J. Magn. Reson. Imaging. 1991;1:561–567. doi: 10.1002/jmri.1880010509. [DOI] [PubMed] [Google Scholar]
- Park HJ, Youn T, Jeong SO, Oh MK, Kim SY, Kim EY. SENSE factors for reliable cortical thickness measurement. Neuroimage. 2008;40:187–196. doi: 10.1016/j.neuroimage.2007.11.013. [DOI] [PubMed] [Google Scholar]
- Pruessmann KP, Weiger M, Scheidegger MB, Boesiger P. SENSE: sensitivity encoding for fast MRI. Magn. Reson. Med. 1999;42:952–962. [PubMed] [Google Scholar]
- Roemer PB, Edelstein WA, Hayes CE, Souza SP, Mueller OM. The NMR phased array. Magn. Reson. Med. 1990;16:192–225. doi: 10.1002/mrm.1910160203. [DOI] [PubMed] [Google Scholar]
- Shrout PE, Fleiss JL. Intraclass correlations: uses in assessing rater reliability. Psychol. Bull. 1979;86:420–428. doi: 10.1037//0033-2909.86.2.420. [DOI] [PubMed] [Google Scholar]
- Tsao J, Boesiger P, Pruessmann KP. k-t BLAST and k-t SENSE: dynamic MRI with high frame rate exploiting spatiotemporal correlations. Magn. Reson. Med. 2003;50:1031–1042. doi: 10.1002/mrm.10611. [DOI] [PubMed] [Google Scholar]
- van der Kouwe AJ, Benner T, Salat DH, Fischl B. Brain morphometry with multiecho MPRAGE. Neuroimage. 2008;40:559–569. doi: 10.1016/j.neuroimage.2007.12.025. [DOI] [PMC free article] [PubMed] [Google Scholar]


