Abstract
The spectroscopic and proton- and Zn(II)-binding properties of two new members of the Zinpyr family of fluorescent sensors are reported. In ZP1B and ZP3B, a (2-picolyl)(4-picolyl)amine (2,4-DPA) moiety is installed in place of the di(2-picolyl)amine (2,2-DPA) ligand used in the parent sensors ZP1 and ZP3. This modification has the benefit of both lowering the proton-induced turn-on at physiological pH levels and altering the Zn(II) affinity so as to detect only the most concentrated stores of this ion in biological samples. Comparison of the proton affinities of all four sensors, as determined by potentiometric titrations, contributes to our understanding of the solution properties of this family of sensors.
The importance of zinc ions in biological systems, including its diverse roles in metalloproteins and structural motifs, has been well established.1 Of current research interest is to detect and understand the functions of mobile pools of zinc in vertebrate tissues and organs.2–6 Some resting stores and transient populations of Zn(II) are estimated to reach high micromolar or even millimolar levels.7–9 Methods for detecting such high concentrations of the ion over more tightly held stores are therefore highly desirable. One relatively non-invasive method of attaining the requisite spatial resolution of Zn(II) localization in vivo is microscopy using Zn(II)-responsive fluorescent sensors. Although a variety of fluorophores have been used to construct such sensors, the metal-binding motifs are less diverse owing to issues of ion selectivity.10 The di(2-picolyl)amine moiety (2,2-DPA),11 in particular, has been widely employed because of its specificity for Zn(II) over the physiologically abundant alkali and alkaline earth cations. The first such sensor developed in our laboratory, ZP1, contained 2,2-DPA and has proved to be a useful starting point for fluorescent sensor design.
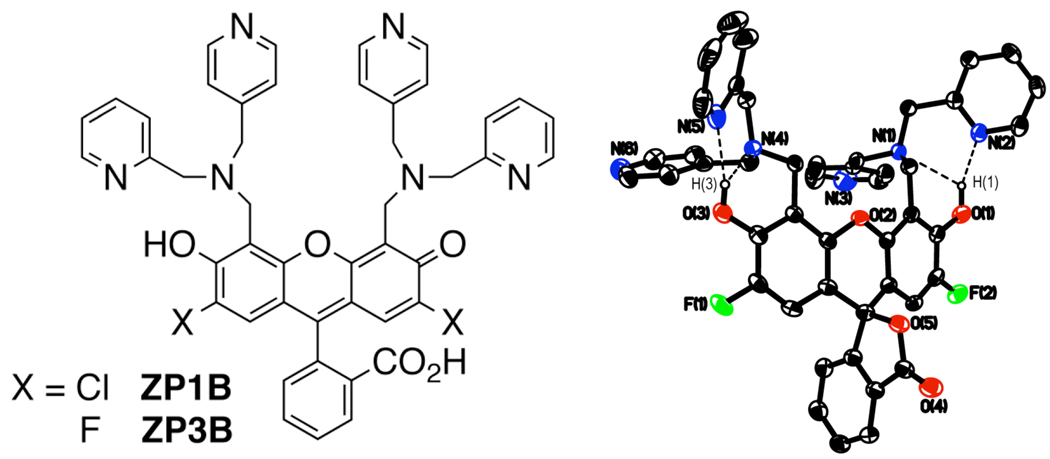
ZP1 has many favorable features, including intense absorption and emission profiles, water solubility, cell permeability, and reasonable selectivity for Zn2+ over other physiologically abundant metal species.12 This sensor displays limited fluorescence turn-on because of proton-induced background at pH 7, however, and its high affinity for Zn2+ makes it less valuable for measuring only the labile populations of this ion. One strategy for correcting these deficiencies while keeping the desirable properties is to modify the 2,2-DPA binding units. Previous efforts in this direction yielded sensors with mixed ligand arms, where one picolyl group is substituted by a methyl, benzyl,13 thioether,14 or thiophene15 group, effectively lowering the denticity of the receptor units. In each of these cases, the affinity for Zn(II) was significantly reduced but the pKa of the receptor unit was elevated, increasing proton-induced background fluorescence and diminishing the turn-on. These examples reveal that removal of a donor group from the binding pocket can increase its proton affinity due to electronic influences on the tertiary nitrogen atom. This problem is solved by a simple modification to the 2,2-DPA chelating moiety, namely, altering the connectivity of one pyridyl group to produce (2-picolyl)(4-picolyl)amine (2,4-DPA).16 Here we describe the replacement of 2,2-DPA units in our ZP1 and ZP317 sensors by 2,4-DPA to afford the new sensors ZP1B and ZP3B (Chart 1). The syntheses of both compounds apply standard Mannich reaction conditions to link 2,4-DPA to the appropriate fluorescein platform, yielding diffraction-quality crystals directly from the reaction solution (Supporting Information).
Chart 1.
2,4-DPA-based sensors (left) and the X-ray diffraction structure of ZP3B (right) displaying 50% thermal ellipsoids.
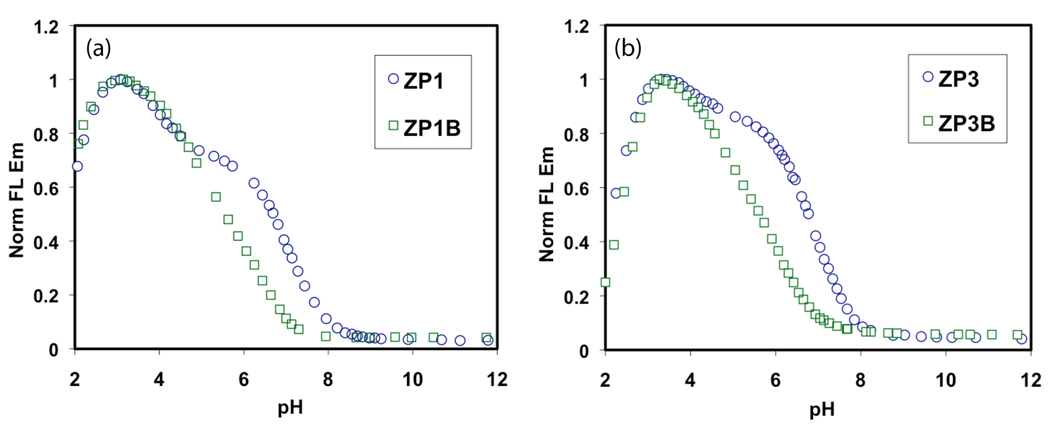
The first valuable property of the 2,4-DPA ligand is to lower the pKa values of the binding pockets of ZP1B and ZP3B, thereby minimizing the proton-induced turn-on. The result is a substantially lower fluorescence quantum yield (Φ) at pH 7 compared to ZP1 and ZP3 (Table 1). The quantum yields and pKa values of ZP1 were remeasured for purposes of comparison to the new sensors for reasons describe elsewhere.16 Representative fluorescence-based pH titrations for all four sensors are depicted in Figure 1. Unlike ZP1 and ZP3, which exhibit a two-step fluorescence turn-on as the pH is lowered, ZP1B and ZP3B display a nearly uniform increase in fluorescence between pH 7.0 and 3.5. This difference in behavior comes from a significant shift in the pKa values determined from potentiometric titrations (Table S3). For all of these compounds, the largest turn-on is caused by binding of the second proton, represented by pKa5; an additional turn-on occurs upon binding of two additional protons (Figure S2). The large differences between pKa5 and pKa4 for ZP1 and ZP3 are responsible for their two-step turn-on. The corresponding differences are much smaller for ZP1B and ZP3B, leading to both a shift in fluorescence pH response and the loss of the two-step feature. The practical result of this change in proton affinity is that the fluorescence of each of these new sensors exhibits virtually no turn-on at pH ≥ 7.
Table 1.
Spectroscopic Properties of Sensors Containing the 2,2-DPA and 2,4-DPA Binding Motifsa
Figure 1.
Fluorescence-based pH titrations comparing (a) ZP1 with ZP1B and (b) ZP3 with ZP3B. The basicity of the binding pockets is reduced in the compounds bearing 4-pyridyl arms, thereby shifting the fluorescence turn-on to lower pH values.
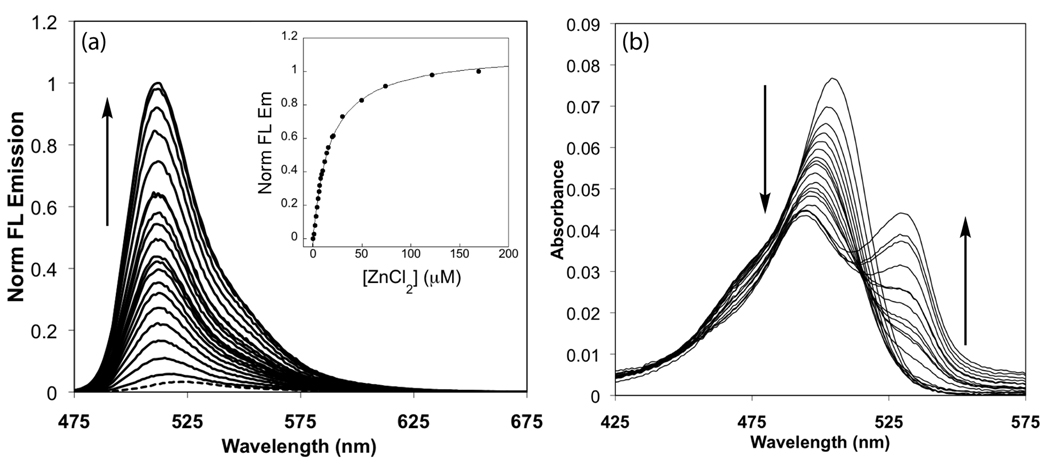
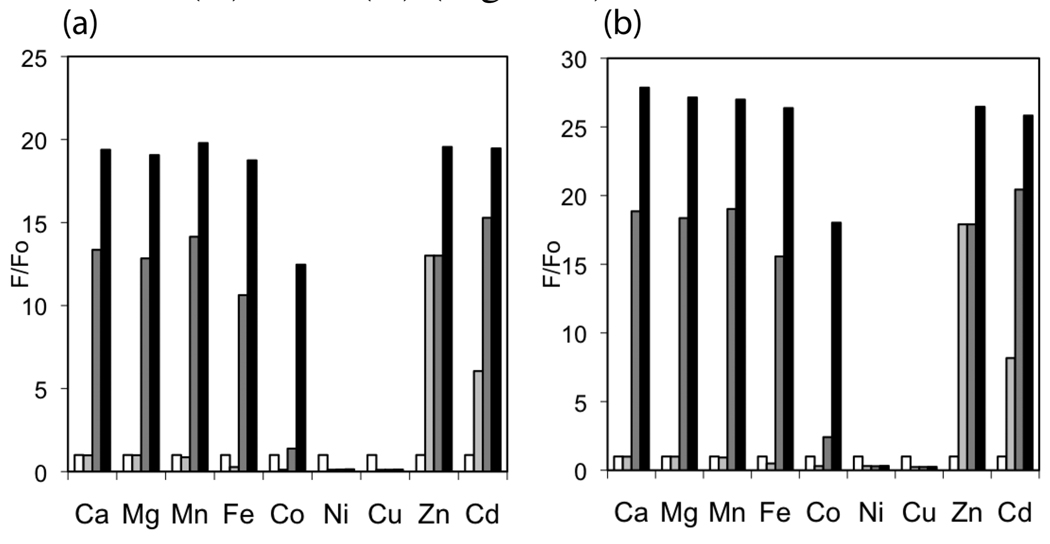
With little influence from protons at pH 7, ZP1B and ZP3B each display a large Zn(II)-induced turn-on. Fluorescence titrations with ZnCl2 yield dissociation constants (Kd) in the millimolar range and significantly improved dynamic ranges compared to ZP1 and ZP3 (Figure 2a and Figure S3a and Table 1). Zn(II)-induced changes to the absorption spectra differ from those of our previous sensors (Figure 2b and Figure S3b). The major peak displays a small hypsochromic shift, as expected from coordination of Zn(II) by the phenolic oxygen atoms, but the intensity of this absorption band is greatly reduced. Additionally, a second band grows in at higher wavelength after the addition of ~8 equiv of ZnCl2. The reason for this behavior is not yet known, but excitation at the peak of the new band yields virtually no fluorescence response and these bands do not appear following a single addition of excess ZnCl2. Furthermore, only Zn(II) binding and not protonation of the receptor units causes these new absorption bands to form. The metal selectivity of these sensors is similar to related compounds like ZS5,15 with an improved response over ZP1 to Zn(II) in the presence of Fe(II) or Co(II) (Figure 3).
Figure 2.
Fluorescence (a) and absorbance (b) titration of 1 µM ZP3B with increasing amounts of ZnCl2 at pH 7 (50 mM PIPES, 100 mM KCl). Emission increases from basal fluorescence (dashed line) in the presence of 1, 2, 3, 4, 5, 6, 7, 8, 9, 10, 12, 14, 16, 19, 20, 30, 50, 74, 122, and 170 µM total ZnCl2. The absorption band at 529 nm begins to emerge at 8 µM ZnCl2.
Figure 3.
Selectivity of (a) ZP1B and (b) ZP3B for Zn(II) in the presence of other metal ions, as measured by fluorescence turn-on. All measurements were normalized to the emission from a 1 mM solution of sensor (white bar) at pH 7 (50 mM PIPES, 100 mM KCl). The light gray bar represents the emission of each solution after addition of 50 equivalents of the divalent cation shown. The dark gray and black bars represent the emission after subsequent addition of 50 and 500 equivalents, respectively, of Zn2+ to the same solution of sensor and the cation of interest.
The relatively high Kd values of ZP1B and ZP3B are appropriate for the detection of labile zinc pools because these values approximate the transient populations of zinc that are estimated in some forms of physiological signaling. 8 Also, the large dynamic range of these new sensors makes them well suited for use in fluorescence microscopy. To highlight the utility of these compounds in a biological application, we examined the fluorescence signal from Min6, a line of pancreatic β-cells.19
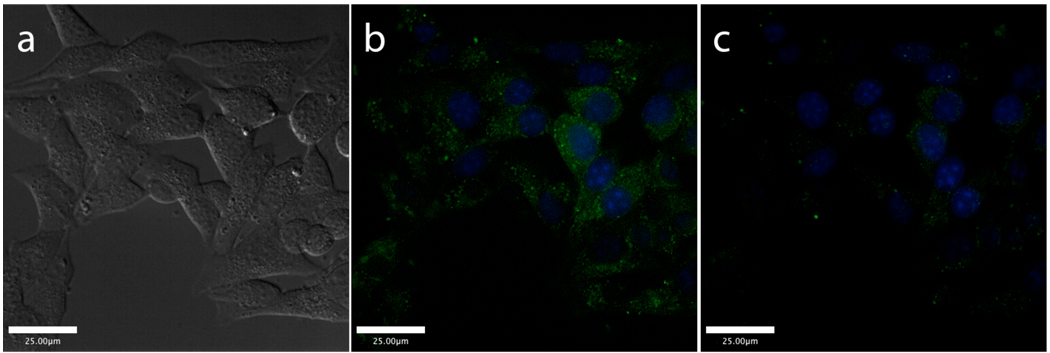
It is well established that Zn(II) co-localizes with insulin in β-cell secretory vesicles and plays a role in both the synthesis and final structure of the insulin hexamer.20 These β-cell vesicles exhibit some variability in Zn(II) content, but concentrations reach millimolar levels.21,22 Although many Zn(II) sensors are touted for their high sensitivity to low ion levels, a more weakly binding sensor will be able to distinguish the most labile Zn(II) populations from more tightly bound stores. Incubation of either ZP1B or ZP3B with Min6 cells yields staining patterns (Figure 4 and Figure S4) that are strikingly similar to those obtained by autometallography, a technique that visualizes only labile, granular Zn(II) in pancreatic cells.23 No staining is observed in the nuclei, demarcated with the blue dye Hoechst 33258, and the punctate staining of the cytosolic region is suggestive of the distribution of Zn(II)-containing secretory vesicles. Addition of the metal chelator N,N,N’,N’-tetra(2-picolyl)-ethylenediamine (TPEN) extinguishes the Zn(II)-induced fluorescence. This highly specific fluorescence labeling is an improvement over more diffuse staining patterns obtained with higher-affinity sensors.24,25
Figure 4.
Live cell images of Min6 cells after incubating with ZP3B (green) and Hoescht 33258 nuclear stain (blue) for 3 h. DIC image (a) and merged green and blue channels before (b) and after (c) the addition of TPEN. A false color image that better reveals the difference between the images in (b) and (c) may be found in Supporting Information.
The variety of receptor groups that have been appended to the fluorescein backbone has yielded Zn(II)-responsive sensors with a wide range of binding affinities, with Kd values from sub-nM to µM.26 ZP1B and ZP3B are useful additions to the higher end of this binding spectrum, having minimal proton-induced turn-on at physiological pH and large dynamic ranges. A subtle alteration to the widely-used 2,2-DPA ligand results in the 2,4-DPA receptor unit, which has a lower affinity for both protons and Zn(II) but retains specificity for Zn(II) over most physiologically relevant divalent metal ions. Other receptor unit designs provide low Zn(II) affinity with less pH sensitivity, but these constructs also exhibit much lower Φ values in their turned-on states.27,28 We suggest that introduction of the 2,4-DPA unit in any of the large number of existing fluorescent Zn(II) sensors incorporating 2,2-DPA would create a new sensor that would retain any favorable features of the original compound but also lower the Zn(II) affinity by several orders of magnitude, allowing for the preferential detection of only the most concentrated stores of Zn(II).
Supplementary Material
Full experimental details, tabulated X-ray crystallographic parameters (Tables S1 and S2), ORTEP for ZP3B (Figure S1), proton dissociation constants (Table S3), speciation plots for ZP3 and ZP3B (Figure S2), Zn(II) fluorescence and absorption titration spectra for ZP1B (Figure S3), and Min6 images using ZP1B (Figure S4). This material is available free of charge via the Internet at http://pubs.acs.org.
Acknowledgement
This work was supported by a grant from the National Institute of General Medical Sciences, GM065519. Spectroscopic instrumentation at the MIT DCIF is maintained with funding from NIH grant number 1S10RR13886-01.
References
- 1.Vallee BL, Falchuk KH. Physiol. Rev. 1993;73:79–118. doi: 10.1152/physrev.1993.73.1.79. [DOI] [PubMed] [Google Scholar]
- 2.Huang YZ, Pan E, Xiong Z-Q, McNamara JO. Neuron. 2008;57:546–558. doi: 10.1016/j.neuron.2007.11.026. [DOI] [PubMed] [Google Scholar]
- 3.Palmer BM, Vogt S, Chen Z, Lachapelle RR, LeWinter MM. J. Struct. Biol. 2006;155:12–21. doi: 10.1016/j.jsb.2005.11.017. [DOI] [PubMed] [Google Scholar]
- 4.Redenti S, Ripps H, Chappell RL. Exp. Eye Res. 2007;85:580–584. doi: 10.1016/j.exer.2007.07.017. [DOI] [PubMed] [Google Scholar]
- 5.Faa G, Nurchi VM, Ravarino A, Fanni D, Nemolato S, Gerosa C, Van Eyken P, Geboes K. Coord. Chem. Rev. 2008;252:1257–1269. [Google Scholar]
- 6.Gyulkhandanyan AV, Lee SC, Bikopoulos G, Dai F, Wheeler MB. J. Biol. Chem. 2006;281:9361–9372. doi: 10.1074/jbc.M508542200. [DOI] [PubMed] [Google Scholar]
- 7.Danscher G, Stoltenberg M. J. Histochem. Cytochem. 2005;53:141–153. doi: 10.1369/jhc.4R6460.2005. [DOI] [PubMed] [Google Scholar]
- 8.Frederickson CJ, Koh J-Y, Bush AI. Nat. Rev. Neurosci. 2005;6:449–462. doi: 10.1038/nrn1671. [DOI] [PubMed] [Google Scholar]
- 9.Costello LC, Franklin RB. Mol. Cancer. 2006;5:17. doi: 10.1186/1476-4598-5-17. [DOI] [PMC free article] [PubMed] [Google Scholar]
- 10.Que EL, Domaille DW, Chang CJ. Chem. Rev. 2008;108:1517–1549. doi: 10.1021/cr078203u. [DOI] [PubMed] [Google Scholar]
- 11.Romary JK, Barger JD, Bunds JE. Inorg. Chem. 1968;7:1142–1145. [Google Scholar]
- 12.Burdette SC, Walkup GK, Spingler B, Tsien RY, Lippard SJ. J. Am. Chem. Soc. 2001;123:7831–7841. doi: 10.1021/ja010059l. [DOI] [PubMed] [Google Scholar]
- 13.Goldsmith CR, Lippard SJ. Inorg. Chem. 2006;45:6474–6478. doi: 10.1021/ic060378j. [DOI] [PubMed] [Google Scholar]
- 14.Nolan EM, Lippard SJ. Inorg. Chem. 2004;43:8310–8317. doi: 10.1021/ic048778z. [DOI] [PubMed] [Google Scholar]
- 15.Nolan EM, Ryu JW, Jaworski J, Feazell RP, Sheng M, Lippard SJ. J. Am. Chem. Soc. 2006;128:15517–15528. doi: 10.1021/ja065759a. [DOI] [PMC free article] [PubMed] [Google Scholar]
- 16.Wong BA, Friedle S, Lippard SJ. J. Am. Chem. Soc. 2009;131:7142–7152. doi: 10.1021/ja900980u. [DOI] [PMC free article] [PubMed] [Google Scholar]
- 17.Chang CJ, Nolan EM, Jaworski J, Burdette SC, Sheng M, Lippard SJ. Chem. Biol. 2004;11:203–210. doi: 10.1016/j.chembiol.2004.01.017. [DOI] [PubMed] [Google Scholar]
- 18.Brannon JH, Magde D. J. Phys. Chem. 1978;82:705–709. [Google Scholar]
- 19.Miyazaki J-I, Araki K, Yamato E, Ikegami H, Asano T, Shibasaki Y, Oka Y, Yamamura K-I. Endocrinology. 1990;127:126–132. doi: 10.1210/endo-127-1-126. [DOI] [PubMed] [Google Scholar]
- 20.Dodson G, Steiner D. Curr. Opin. Struct. Biol. 1998;8:189–194. doi: 10.1016/s0959-440x(98)80037-7. [DOI] [PubMed] [Google Scholar]
- 21.Hutton JC, Penn EJ, Peshavaria M. Biochem. J. 1983;210:297–305. doi: 10.1042/bj2100297. [DOI] [PMC free article] [PubMed] [Google Scholar]
- 22.Foster MC, Leapman RD, Li MX, Atwater I. Biophys. J. 1993;64:525–532. doi: 10.1016/S0006-3495(93)81397-3. [DOI] [PMC free article] [PubMed] [Google Scholar]
- 23.Søndergaard LG, Brock B, Stoltenberg M, Flyvbjerg A, Schmitz O, Smidt K, Danscher G, Rungby J. Horm. Metab. Res. 2005;37:133–139. doi: 10.1055/s-2005-861290. [DOI] [PubMed] [Google Scholar]
- 24.Lukowiak B, Vandewalle B, Riachy R, Kerr-Conte J, Gmyr V, Belaich S, Lefebvre J, Pattou F. J. Histochem. Cytochem. 2001;49:519–527. doi: 10.1177/002215540104900412. [DOI] [PubMed] [Google Scholar]
- 25.Zhang X, Hayes D, Smith SJ, Friedle S, Lippard SJ. J. Am. Chem. Soc. 2008;130:15788–15789. doi: 10.1021/ja807156b. [DOI] [PMC free article] [PubMed] [Google Scholar]
- 26.Nolan EM, Lippard SJ. Acc. Chem. Res. 2009;42:193–203. doi: 10.1021/ar8001409. [DOI] [PMC free article] [PubMed] [Google Scholar]
- 27.Komatsu K, Kikuchi K, Kojima H, Urano Y, Nagano T. J. Am. Chem. Soc. 2005;127:10197–10204. doi: 10.1021/ja050301e. [DOI] [PubMed] [Google Scholar]
- 28.Parkesh R, Lee TC, Gunnlaugsson T. Org. Biomol. Chem. 2007;5:310–317. doi: 10.1039/b614529a. [DOI] [PubMed] [Google Scholar]
Associated Data
This section collects any data citations, data availability statements, or supplementary materials included in this article.
Supplementary Materials
Full experimental details, tabulated X-ray crystallographic parameters (Tables S1 and S2), ORTEP for ZP3B (Figure S1), proton dissociation constants (Table S3), speciation plots for ZP3 and ZP3B (Figure S2), Zn(II) fluorescence and absorption titration spectra for ZP1B (Figure S3), and Min6 images using ZP1B (Figure S4). This material is available free of charge via the Internet at http://pubs.acs.org.


