Abstract
Changes in expression levels of genes encoding for proteins that control metabolic pathways are essential to maintain nutrient and energy homeostasis in individual cells as well as in or ga nisms. An important regulated step in this process is accomplished through covalent chemical modifications of proteins that form complexes with the chromatin of gene promoters. The peroxisome proliferators γ co-activator 1 (PGC-1) family of transcriptional co-activators comprises important components of a number of these complexes and participates in a large array of glucose and lipid metabolic adaptations. Here, we show that PGC-1β is acetylated on at least 10 lysine residues distributed along the length of the protein by the acetyl transferase general control of amino-acid synthesis (GCN5) and that this acetylation reaction is reversed by the deacetylase sirtuin 1 (SIRT1). GCN5 strongly interacts with PGC-1β and represses its transcriptional activity associated with transcription factors such as ERRα, NRF-1, and HNF4α, however acetylation and transcriptional repression do not occur when a catalytically inactive GCN5 is co-expressed. Transcriptional repression coincides with PGC-1β redistribution to nuclear foci where it co-localizes with GCN5. Furthermore, knockdown of GCN5 ablates PGC-1β acetylation and increases transcriptional activity. In primary skeletal muscle cells, PGC-1β induction of endogenous target genes, including MCAD and GLUT4, is largely repressed by GCN5. Functionally, this translates to a blunted response to PGC-1β-induced insulin-mediated glucose transport. These results suggest that PGC-1β acetylation by GCN5 might be an important step in the control of glucose and lipid pathways and its dysregulation could contribute to metabolic diseases.
Transcriptional control of gene expression is a very dynamic and regulated process that involves assembly of protein complexes organized in space and time. Often this assembly is directed by covalent modification of transcriptional proteins dictating novel physical interactions, resulting in tightly controlled expression of genes. Among these modifications, protein acetylation at lysine residues has been implicated in control of gene expression (1, 2).
Cells, either individually or organized in tissues, respond to environmental cues through multiple adaptive responses to maintain homeostasis. An important part of this cellular response involves rapid changes in expression of genes encoding proteins that will functionally adapt the cell or organism to the new condition. In mammalian cells, the PGC-13 family of transcriptional co-activators has emerged as important regulators of gene expression in response to nutrient and hormonal fluctuations. The PGC-1 family is composed of three members, PGC-1α, PGC-1β, and PRC, which play important metabolic roles in various tissues. These proteins contain a similar architecture with an activation domain at the N terminus, a middle region associated with repression, and a C terminus with two domains involved in RNA processing. A main mechanism of control of the PGC-1s is through regulation of their own gene expression. For example, PGC-1α is rapidly induced in response to low temperatures in brown adipose tissue, fasting in liver or exercise in skeletal muscle (3–5). An increase of cAMP levels is one of the main signals involved in this transcriptional response, which leads to activation of PGC-1α function (6, 7). Among the targets, OXPHOS genes are strongly induced by the PGC-1s through interaction with transcription factors such as ERRα, NRFs, and ying yang 1 (8–11). Multiple covalent chemical modifications play a large role in controlling PGC-1α function as well. For example, PGC-1α is phosphorylated by p38 MAPK (12), glycogen synthase kinase 3β (13, 14), and Akt (15), it is methylated by PRMT1 (16), ubiquitinated by SCF(Cdc4) (14), O-GlcNAcylated by O-GlcNAc transferase (17), and, more related to this work, acetylated and de-acetylated by GCN5 (18) and SIRT1 (19, 20), respectively.
Our group has previously shown that PGC-1α acetylation is regulated through nutrient pathways controlled by changes in glucose concentrations (19, 21, 22). In high glucose concentrations PGC-1α is largely acetylated on at least 13 lysine residues, which in turn are deacetylated by SIRT1 in response to low glucose. In addition, SIRT1 activators are sufficient to deacetylate and activate PGC-1α leading to increases in energy expenditure (23, 24). The mechanism by which acetylated PGC-1α is less active is largely unknown but may involve altered subnuclear protein localization and reduced occupancy at gene promoters (18). Less is known about PGC-1β function, but like PGC-1α, it induces oxidative mitochondrial function, particularly in skeletal muscle (25, 26), and has been implicated in the hepatic feeding response, host innate response to bacterial pathogenesis and iron metabolism (25–29). Structurally, PGC-1β contains similar domains to PGC-1α along the protein, but with an extended middle region (30, 31).
Given the similarities between PGC-1α and PGC-1β and the regulatory role of PGC-1α acetylation, we investigated whether PGC-1β is acetylated by GCN5 and determined the functional consequences as it relates to gene expression and glucose transport. Here, we report that PGC-1β is a substrate for GCN5 and is acetylated on at least 10 lysine residues that are distributed along multiple domains of the protein. SIRT1 overexpression is sufficient to completely deacetylate PGC-1β. shRNA knockdown of GCN5 resulted in loss of basal acetylation and an induction of transcriptional activity. Moreover, wild-type GCN5 but not mutant, catalytically inactive GCN5 strongly repressed PGC-1β transcriptional activity. In primary skeletal muscle cells, GCN5 repressed expression of target genes involved in glucose and fatty acid utilization. Functionally, the effects of GCN5 on PGC-1β target gene expression correlated with a blockage of insulin-stimulated glucose uptake. These results indicate that acetylation of PGC-1β is sufficient to control its transcriptional co-activation activity and might have important consequences in metabolic diseases if dysregulated.
EXPERIMENTAL PROCEDURES
Constructs
pcDNA-PGC-1β construct was a gift from Bruce Spiegelman (Dana Farber Cancer Institute, Boston, MA). To generate GAL4-DBD and pAdTrack plasmids, PGC-1β was subcloned into the backbone of these plasmids. Constructs used in these studies for different transcription factors, wild-type and mutant GCN5, have already been described (19, 18). Plasmid maps and sequences of constructs used are available upon request.
Cell Culture and Treatments
HEK 293 cells were routinely cultured in Dulbecco's modified Eagle's medium with 10% fetal bovine serum. Primary skeletal muscle cells were isolated and cultured as previously described (32). 80% confluent myoblasts were switched to the differentiation medium, Dulbecco's modified Eagle's medium containing 5% horse serum. Myotubes were transduced with adenoviruses encoding for PGC-1β or GCN5 for a period of 48 h.
Immunofluorescence Microscopy
Immunofluorescence experiments were performed 48 h after transfection with plasmids encoding for HA-PGC-1β and FLAG-GCN5. Immunofluorescence was performed using mouse anti-HA antibody to detect PGC-1β and rabbit anti-GCN5 antibody as previously described (18).
Analysis of Protein Acetylation
FLAG- or HA-tagged PGC-1β were expressed in HEK 293 cells via transfection using PolyFect (Qiagen) or in primary skeletal muscle cells by adenoviral infection. Whole cell extracts were used to immunoprecipitate PGC-1β or GCN5 with anti-FLAG M2 or HA antibody linked to agarose beads. After extensive washing, immunoprecipitates were separated by SDS-PAGE and immunoblotted using the acetyllysine antibody (Cell Signaling) and the M2 FLAG antibody (Sigma) or HA (BabCO) to detect lysine acetylation and total protein levels, respectively.
Identification of Acetylated Lysine Residues by MS Analysis
Mapping of acetylation on lysine residues of PGC-1β was performed by nanoscale microcapillary reverse phase liquid chromatography electrospray ionization tandem mass spectrometry (LC-MS/MS) (33, 34). HEK 293 cells were infected with FLAG-HA-PGC-1β and FLAG-GCN5 and treated with 20 mm nicotinamide for a period of 12 h. Cells were harvested, and nuclear extracts were prepared as previously described (19). Immunoprecipitation with anti-FLAG M2 antibodies linked to agarose was performed in 300 mm NaCl, 1% Triton X-100. After extensive washes, proteins were eluted with 0.5 mg/ml FLAG peptide, and proteins were precipitated with trichloroacetic acid. Protein from Coomassie-stained gel bands was in-gel reduced with dithiothreitol, and cysteine residues were derivatized with iodoacetamide. In-gel digestion of the protein was performed using either trypsin or chymotrypsin (33), and the generated peptide mixtures were subjected to nanoscale microcapillary LC-MS/MS on a hybrid linear ion trap/FT-ICR mass spectrometer (LTQ FT, Thermo Electron) essentially as described previously (34). Briefly, peptides were separated on a 125-μm inner diameter microcapillary C18 column, and MS and MS/MS data were collected in an automated fashion. A high mass accuracy and high mass resolution FT-ICR MS survey scan was followed by ten linear ion trap MS/MS experiments on the ten most abundant ions detected in the survey scan before a consecutive experimental cycle was initiated with another FT-survey scan. MS/MS data were automatically assigned by searching them against the PGC-1β sequence using the SEQUEST (35) algorithm and allowing lysine residues to be acetylated. The precursor ion mass tolerance in the data base search was set to ±2 Da, and no enzyme specificity constraints were used. Search results were filtered for peptide assignments with high mass accuracy (−7 to 3 ppm), and both termini were consistent with the specificity of the proteases used for the digest of the protein. Additionally, a ΔCn filter of 0.1 and XCorr filters of 1.5 for doubly, 2 for triply, and 3 for quadruply charged peptides were applied and MS/MS spectra of acetylated peptides were validated manually.
Luciferase-based Transcriptional Co-activation Assays
HEK 293 cells were transfected using a ratio of DNA:PolyFect (Qiagen) 1:2. After transfection, cells were lysed and luciferase assays were performed. We normalized transfection efficiency using the Renilla system (Promega).
Gene Expression Analysis
mRNA expression levels were analyzed by quantitative real-time PCR. Total RNA was prepared from primary skeletal muscle cells via TRIzol extraction (Invitrogen). cDNA was generated by Superscript II enzyme (Invitrogen) and analyzed by quantitative reverse-transcriptase-mediated PCR using an iQ SYBR Green Supermix (Bio-Rad). All data were normalized to tubulin expression. The oligonucleotide primers can be provided upon request.
Glucose Uptake Assays
Primary muscle myotubes were infected with adenoviruses encoding for green fluorescent protein, PGC-1β, and GCN5 and incubated with 5% horse serum for 48 h. Cells were then incubated with Dulbecco's modified Eagle's medium supplemented with 0.5%bovine serum albumin for 6 h and 100 nm insulin was added during the last 20 min. Glucose uptake was measured by incubating with [3H]2-deoxyglucose for 6 min and corrected by protein content.
RESULTS
GCN5 Interacts with and Acetylates PGC-1β
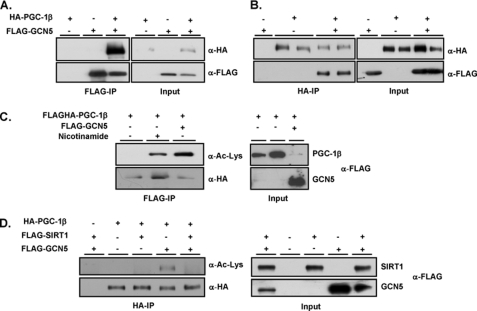
Based on our previous studies that PGC-1α is a substrate of the acetyl transferase GCN5 (18), we tested whether GCN5 might also interact with and acetylate PGC-1β. To this end, we infected primary skeletal myotubes with adenoviruses encoding for FLAG-GCN5 and HA-PGC-1β. Fig. 1A shows that immunoprecipitation of FLAG-GCN5 resulted in strong co-immunoprecipitation of HA-PGC-1β protein. Conversely, immunoprecipitated HA-PGC-1β was associated with FLAG-GCN5 suggesting physical interaction between both proteins (Fig. 1B). Similar to PGC-1α, ectopic expression of PGC-1β in cultured cells results in protein that is predominantly deacetylated, however, when co-expressed with GCN5, PGC-1β became strongly acetylated at lysine residues (Fig. 1C). In addition, two different types of experiments indicate that one of the PGC-1β deacetylases is the class III histone deacetylase sirtuin, SIRT1. First, PGC-1β acetylation is largely increased after treatment with nicotinamide (Fig. 1C) (a selective inhibitor of sirtuins). Second, expression of SIRT1 decreased GCN5-induced acetylation of PGC-1β (Fig. 1D). Taken together, these results indicate that PGC-1β is an acetylated protein and that its acetylation status is oppositely regulated by the enzymes GCN5 and SIRT1.
FIGURE 1.
GCN5 interacts with and acetylates the transcriptional co-activator PGC-1β. Primary skeletal muscle myotubes were infected with the indicated adenoviruses encoding for FLAG-GCN5 and HA-PGC-1β proteins. A and B, immunoprecipitation with FLAG or HA antibodies linked to agarose was performed followed by Western blot analysis using the indicated antibodies. C, HEK 293 cells were transfected with the indicated plasmids encoding for either FLAG or HA-tagged proteins. PGC-1β was immunoprecipitated from whole cell extracts, and lysine-acetylation was detected using Western blot analysis with the indicated antibodies. D, similar experiments as in C were performed but using the SIRT1 plasmid.
Identification of PGC-1β Lysine Residues Acetylated by GCN5
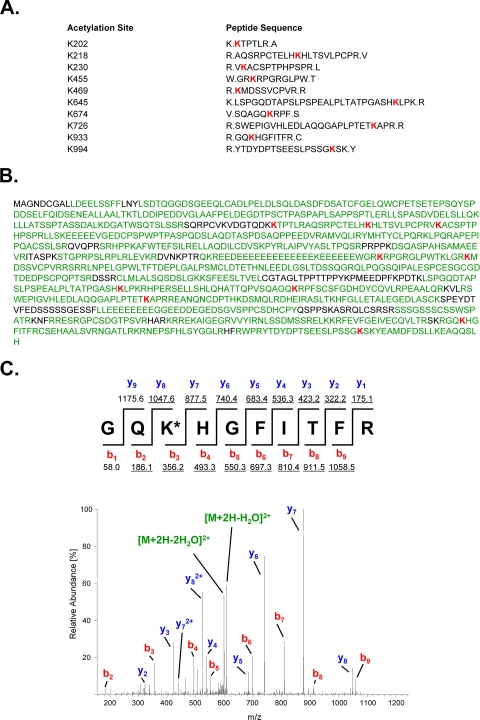
To map the PGC-1β lysines acetylated by GCN5, we initiated a large scale purification of PGC-1β expressed in HEK 293 cells double infected with adenoviruses encoding for FLAG-HA-PGC-1β and FLAG-GCN5 and treated with nicotinamide. Immunoprecipitated PGC-1β was analyzed by tandem mass spectrometry. We identified 10 acetylated lysines with 87% coverage of the full-length PGC-1β protein (Fig. 2). Interestingly, only one lysine site at the C terminus of PGC-1α and PGC-1β seems to be conserved (PGC-1α K778 and PGC-1β K994), although most of the lysine acetylation sites are in regions of homology between both co-activators (supplemental Fig. S1). These results indicate that, similar to PGC-1α, PGC-1β is acetylated in multiple lysine residues that are distributed across the major domains of the protein.
FIGURE 2.
Analysis and identification of PGC-1β lysine acetylation sites. HEK 293 cells were infected with adenoviruses encoding for FLAG-HA-PGC-1β and FLAG-GCN5 and treated with nicotinamide (20 mm) for 12 h. After immunoprecipitation, PGC-1β was separated by SDS-PAGE and analyzed by tandem mass spectrometry. Acetylation was determined by subjecting a tryptic and a chymotryptic digest of the protein to microcapillary LC-MS/MS on a hybrid linear ion trap/FT-ICR mass spectrometer and assigning the acquired MS/MS data using the SEQUEST algorithm as described under “Experimental Procedures.” A, sequences of identified acetylated peptides, including flanking amino acid residues. Acetylated lysine residues are shown in red. B, 87% of the amino acid sequence (74% of lysine residues) of PGC-1β was covered in the acetylation mapping experiment (covered residues are shown in green, acetylated lysine are residues in red). C, determination of acetylation on Lys-933. The lower panel shows the MS/MS of the doubly charged tryptic peptide Gly-931 to Arg-940 (m/z 616.82976, mass accuracy, −1.0 ppm) carrying an acetyl residue on Lyss-933 (red). The sequence of the peptide including m/z values for predicted fragment ions is shown above the spectrum. Detected fragment ions are underlined.
GCN5 Represses PGC-1β-mediated Transcriptional Coactivation
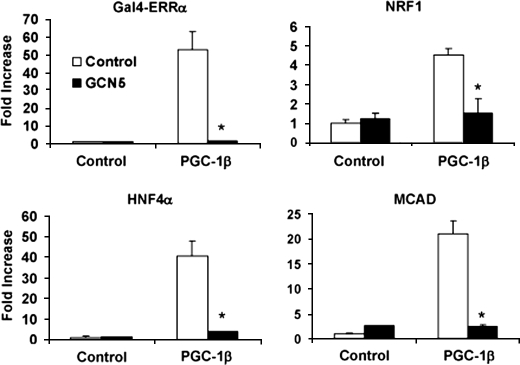
To determine the effects of GCN5 on PGC-1β transcriptional activity, we performed cell-based luciferase reporter assays using various transcription factors known to be co-activated by PGC-1β (30, 31). Fig. 3 shows that, as predicted, PGC-1β co-activated ERRα, NRF-1, as well as HNF4α transcription factors. Consistently, in all assays GCN5 potently repressed the ability of PGC-1β to activate these transcription factors. Similar repression effects were also observed in PGC-1β/ERRα-targeted promoters such as MCAD, an enzyme involved in mitochondrial fatty acid oxidation (Fig. 3). Together, these results indicate that GCN5 down-regulates the transcriptional activity of PGC-1β.
FIGURE 3.
Repression of PGC-1β transcriptional activity through GCN5. HEK 293 cells were transfected with the indicated plasmids. Luciferase activities were measured as described under “Experimental Procedures.” The luciferase reporters were either 5XUAS (for GAL4-ERRα), NRF-1 DNA-binding sites (NRF-1) (8), gAF1 of phosphoenolpyruvate carboxykinase promoter (HNF4α) (45), or the −375 MCAD promoter linked to luciferase as previously described (ERRα) (46). Values represent means ± S.E. of at least three independent experiments performed in duplicate. Statistical significance was determined by two-tailed unpaired Student's t test. *, p < 0.05 control versus GCN5.
GCN5 Translocates PGC-1β to Nuclear Foci
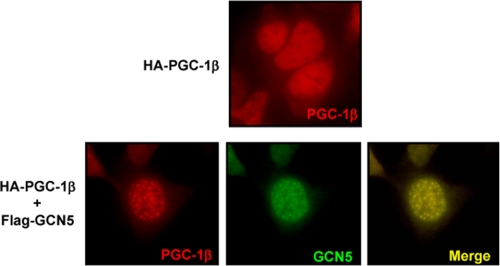
To determine possible mechanisms by which GCN5 might control PGC-1β we performed cellular immunolocalization experiments. Expression of PGC-1β alone resulted in diffuse protein nuclear localization. However, co-expression of GCN5 resulted in re-localization of PGC-1β to nuclear foci also containing GCN5 protein (Fig. 4). These experiments suggest that localization of PGC-1β to nuclear foci by GCN5-mediated acetylation correlates with repression of its transcriptional activity.
FIGURE 4.
PGC-1β nuclear redistribution induced by GCN5. HEK 293 cells were transfected with HA-PGC-1β and FLAG-GCN5. Cells were fixed 48 h after transfection and immunofluorescence was performed using mouse anti-HA antibodies (shown in “red”) and rabbit anti-GCN5 antibodies (shown in “green”).
GCN5 Repression of PGC-1β-mediated Transcription Requires Acetyltransferase Activity
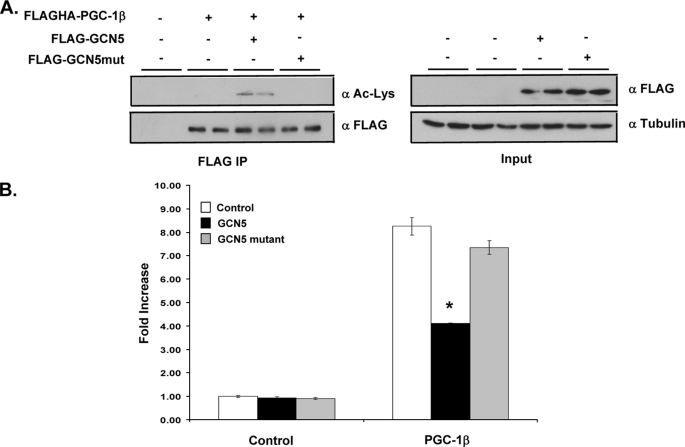
To further establish that PGC-1β transcriptional activity is altered by GCN5 mediated acetylation, a mutant GCN5 lacking acetyltransferase activity was tested in both cell-based acetylation and luciferase reporter assays. As shown previously with PGC-1α, overexpressed PGC-1β is not acetylated when co-expressed with inactive GCN5 (Fig. 5A). Furthermore, transcriptional co-activation of PGC-1β on GAL4-Errα was not significantly repressed by overexpressed catalytically inactive GCN5 mutant, unlike wild-type GCN5 (Fig. 5B). These data suggest that regulation of PGC-1β by GCN5 is due to increased lysine acetylation.
FIGURE 5.
Mutant GCN5 fails to acetylate PGC-1β and shows little impairment of transcriptional activity. A, HEK 293 cells were transfected with the indicated plasmids encoding either wild-type GCN5 or mutant GCN5. FLAGHA-PGC-1β was overexpressed and immunoprecipitated using FLAG antibody linked to agarose beads. Detection of protein and acetylation levels was completed with Western blot as previous. B, HEK 293 cells were transfected with 5XUAS as well as GAL4-Errα and other indicated plasmids. Luciferase activities were measured as described under “Experimental Procedures.” Values are representative of mean ± S.E. of two experiments each in triplicate Statistical significance was determined by two-tailed unpaired students t test. *, p < 0.05 PGC-1β versus PGC-1β plus GCN5.
Knockdown of GCN5 Results in Decreased Acetylation and an Increase in Transcriptional Activity
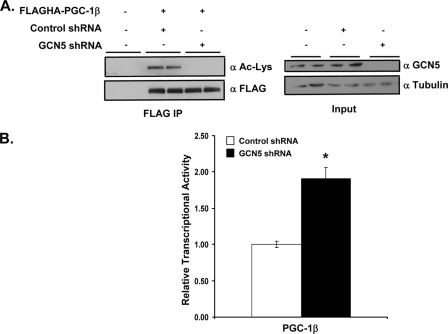
Knockdown of endogenous GCN5 by shRNA was used to probe the acetylation status and associated transcriptional activity of PGC-1β. 293HEK cells were transfected with either a control or GCN5-targeted shRNA and treated with nicotinamide to inhibit endogenous SIRT1 deacetylase activity. Overexpression and immunoprecipitation of PGC-1β revealed a reduction in acetylation to an undetectable level by Western blot, suggesting that endogenous GCN5 is a major PGC-1β acetyltransferase (Fig. 6A). Indeed, knockdown of GCN5 also resulted in a small but reproducible increase in transcriptional co-activation of PGC-1β on Errα at the MCAD promoter, as determined by luciferase activity (Fig. 6B). Taken together with the acetylation status of PGC-1β, these results suggest that GCN5 may regulate PGC-1β transcriptional activity by altering the acetylation status of the protein.
FIGURE 6.
Knockdown of GCN5 results in decreased acetylation and increased transcriptional activity of PGC-1β. A, HEK 293 cells were transfected with control or GCN5 shRNA plasmid for 72 h and treated with 10 mm nicotinamide for the final 12 h. Overexpressed FLAGHA-PGC-1β was immunoprecipitated using FLAG antibody linked agarose beads and acetylation status was determined by Western blot. B, HEK 293 cells were transfected with control or GCN5 shRNA plasmid for 72 h along with PGC-1β, Errα, and the −375 MCAD promoter linked to luciferase. Luciferase activities were measured as described under “Experimental Procedures.” Values represent relative means ± S.E. of three experiments each in triplicate. Statistical significance was determined by two-tailed unpaired Student's t test. *, p < 0.005 PGC-1β plus control shRNA versus PGC-1β plus GCN5 shRNA.
GCN5 Down-regulates Endogenous PGC-1β Target Genes
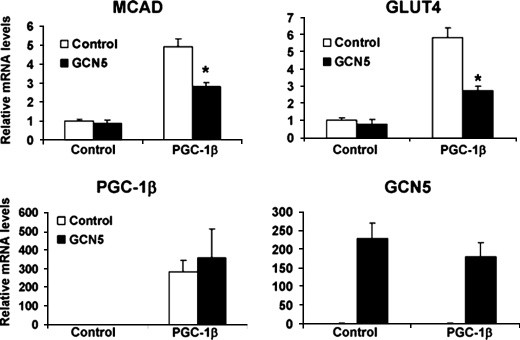
To further demonstrate the repressive effects of GCN5 on PGC-1β, endogenous expression of PGC-1β target genes were analyzed in primary skeletal muscle myotubes infected with adenoviruses encoding both proteins. PGC-1β expression alone was sufficient to induce mRNAs encoding for MCAD and GLUT4, two key enzymes involved in fatty acid and glucose utilization, respectively, ∼5-fold. Consistent with the effects on acetylation status and luciferase reporter assays, expression of GCN5 largely repressed the induction of these PGC-1β target genes (Fig. 7). Taken together, these results further suggest that GCN5 is a transcriptional repressor of PGC-1β.
FIGURE 7.
GCN5 inhibition of PGC-1β-induced endogenous gene expression in skeletal muscle cells. Primary skeletal muscle myotubes were infected with adenoviruses encoding the indicated proteins. Total RNA was analyzed by RT-PCR 2 days after infection. Values represent means ± S.E. of at least two independent experiments performed in duplicate. Statistical significance determined by two-tailed unpaired Student's t test. *, p < 0.05 PGC-1β versus PGC-1β plus GCN5.
GCN5 Decreases Insulin-stimulated Glucose Transport Mediated by PGC-1β
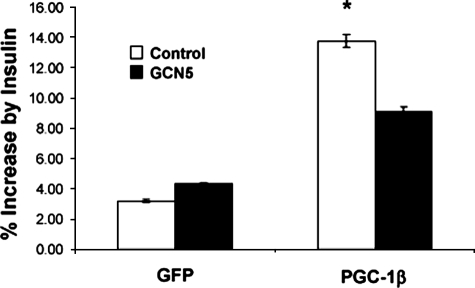
The fact that PGC-1β strongly increased expression of the insulin-sensitive glucose transporter GLUT4, led us to test whether the effects of gene expression translated into glucose uptake. We therefore analyzed insulin-mediated 2-deoxyglucose transport in primary skeletal myotubes. Interestingly, in this system expression of PGC-1β did not affect basal glucose uptake (data not shown). However, the transcriptional co-activator significantly increased the induction of glucose uptake in response to insulin (Fig. 8). Again, and consistent with our previous results in these studies, expression of GCN5 largely repressed the effects of PGC-1β on insulin-induced glucose uptake. These results indicate that the effects of this transcriptional co-activator on insulin-stimulated glucose transport are inhibited by expression of GCN5.
FIGURE 8.
GCN5 blocks PGC-1β-induced insulin-mediated glucose transport. Primary skeletal muscle myotubes were infected with the indicated adenoviruses. Cells were incubated in Dulbecco's modified Eagle's medium with 0.5% bovine serum albumin, treated with 100 nm insulin for 20 min and incubated with [2-3H]deoxyglucose as described under “Experimental Procedures.” Values of % [2-3H]deoxyglucose uptake increased by insulin represent means ± S.E. of six independent experiments performed in triplicate. Statistical significance determined by two-tailed unpaired Student's t test. *, p < 0.05 control versus PGC-1β.
DISCUSSION
Fluxes of nutrients through the different metabolic pathways are largely determined by activities of enzymes and transporters. Although acute control of these proteins is via modulation of the catalytic or transport activity (e.g. post-translational modification, allosteric regulation, or translocation), in most metabolic pathways regulation of genes encoding for enzymes and transporters directly impact the rates and dynamics at which these pathways function (36, 37). Transcriptional regulation in response to fluctuation of nutrients or hormones is accomplished by changes in activities of transcriptional complexes that are bound to the promoters of genes as well as by alteration of promoter occupancy. In this metabolic regulatory context, we have described that the transcriptional co-activator PGC-1β, similarly to PGC-1α, is regulated by lysine acetylation through the acetyl transferase GCN5. Acetylation of PGC-1β coincides with a modified spatial subnuclear localization and repression of its transcriptional co-activation activity, while knockdown of GCN5 induces transcriptional co-activation activity. Functionally, the ability of PGC-1β to increase insulin-mediated glucose transport in skeletal muscle cells is blunted by GCN5.
PGC-1β-acetylated lysine residues are located in multiple domains suggesting that they might impact various binding partners and therefore activities of PGC-1β. For example, some of these lysines are close to the activation domain, whereas others are near nuclear localization signal sequences or in the proximity of the RNA processing motifs. Comparison of the identified acetylated lysines between PGC-1α and PGC-1β results in only one lysine at the C terminus that is conserved between both co-activators by BLAST analysis. However, most of the acetylated lysines are in regions of homology between PGC-1α and PGC-1β suggesting similar functions. It is possible that modification of specific lysines by acetylation could play specialized roles by defining interaction with particular sets of proteins. As a consequence, these interactions might lead to repression and translocation to nuclear foci. Moreover, binding affinities with specific transcription factors or other nuclear proteins that interact with different domains in PGC-1α or PGC-1β might change depending on the acetylation status. The specific function of these acetylation sites individually or in combination is currently under investigation. Another intriguing aspect of our studies is the fact that GCN5 acetylates histone 3 at lysine 9, which coincides with activation of gene expression (38). However, in our experiments GCN5 blocks induction of PGC-1β target genes. It is conceivable that GCN5 might initially acetylate histone H3 to promote gene expression, but then act in a negative feedback loop to acetylate and down-regulate PGC-1β transcriptional activity. In fact, similar molecular mechanisms have been proposed for nuclear hormone receptor co-activator ACTR (39). It is also possible be that other histone acetyltransferases such as CREB-binding protein or p300 play a role in acetylation of histones in PGC-1β target genes, similar to PGC-1α targets (40). Although we cannot completely rule out this possibility, initial chromatin immunoprecipitation studies expressing PGC-1β or co-expressing PGC-1β and GCN5 results in little change of histone H3 acetylation status at the MCAD promoter (data not shown), suggesting that acetylation of histone H3 plays little if any role in driving transcription in response to PGC-1β overexpression.
In these studies we have uncovered a new PGC-1β function associated with insulin-induced glucose uptake in skeletal muscle. The PGC-1β KO and hypomorphic allele transgenic mice present several metabolic abnormalities that include deficient adaptive thermogenesis, hepatic steatosis, and liver insulin resistance and impaired response to bacterial infection (26, 41, 27). Conversely, transgenic PGC-1β are resistant to obesity in response to high fat diet and display increased insulin sensitivity associated with an increase in oxidative metabolism (42, 43). In this context, we provide evidence in primary skeletal muscle cells that PGC-1β is sufficient to increase the response to insulin-mediated glucose transport and this correlates with increases in GLUT4 mRNA. Importantly, these effects were suppressed by GCN5. It is not clear how GCN5 might be modulated in skeletal muscle in response to insulin and in what metabolic context PGC-1β facilitates insulin action, at least in relation to glucose transport. In this regard, one of the acetylated PGC-1β lysine residues, Lys-202, precedes the A203P polymorphism that correlates with enhanced insulin-stimulated glucose metabolism in humans (44). It would be interesting to determine whether this amino acid substitution to proline can affect the Lys-202 acetylation and whether it might interfere with glucose transport.
In summary, the studies presented here illustrate that PGC-1β acetylation, regulated by the enzymatic activities of GCN5 and SIRT1, controls expression of metabolic genes involved in fatty acid oxidation and glucose transport. The fact that small molecules can regulate the catalytic activity of these two enzymes suggests that PGC-1β acetylation might be targeted in metabolic diseases to modulate its transcriptional activity.
Supplementary Material
Acknowledgment
We thank Tom Cunningham in the Puigserver laboratory for helpful discussions on the manuscript.
This work was supported, in whole or in part, by National Institutes of Health Grant RO1 DK069966 (to P. P.). This work was also supported by an Ellison Medical Foundation New Scholar Award, by the American Diabetes Association, and by the U.S. Dept. of Defense.

The on-line version of this article (available at http://www.jbc.org) contains supplemental Fig. S1.
- PGC-1
- peroxisome proliferators γ co-activator 1
- PRC
- PGC-1-related co-activator
- ERRα
- estrogen-related receptor alpha
- GCN5
- general control of amino-acid synthesis
- HNFα
- hepatocyte nuclear factor alpha
- GLUT4
- glucose transporter 4
- SIRT1
- sirtuin 1
- MCAD
- medium chain acyl CoA-dehydrogenase
- NRF1
- nuclear respiratory factor 1
- PRMT1
- protein arginine methyltransferase 1
- SCF
- Skp1/Cullin/F-box
- MAPK
- mitogen-activated protein kinase
- shRNA
- short hairpin RNA
- HA
- hemagglutinin
- MS
- mass spectrometry
- MS/MS
- tandem MS
- LC
- liquid chromatography
- FT
- Fourier transform
- ICR
- ion cyclotron resonance.
REFERENCES
- 1.Roth S. Y., Denu J. M., Allis C. D. (2001) Annu. Rev. Biochem. 70, 81–120 [DOI] [PubMed] [Google Scholar]
- 2.Kouzarides T. (2007) Cell 128, 693–705 [DOI] [PubMed] [Google Scholar]
- 3.Scarpulla R. C. (2002) Biochim. Biophys. Acta 1576, 1–14 [DOI] [PubMed] [Google Scholar]
- 4.Lin J., Handschin C., Spiegelman B. M. (2005) Cell Metab. 1, 361–370 [DOI] [PubMed] [Google Scholar]
- 5.Finck B. N., Kelly D. P. (2006) J. Clin. Invest. 116, 615–622 [DOI] [PMC free article] [PubMed] [Google Scholar]
- 6.Uldry M., Yang W., St-Pierre J., Lin J., Seale P., Spiegelman B. M. (2006) Cell Metab. 3, 333–341 [DOI] [PubMed] [Google Scholar]
- 7.Herzig S., Long F., Jhala U. S., Hedrick S., Quinn R., Bauer A., Rudolph D., Schutz G., Yoon C., Puigserver P., Spiegelman B., Montminy M. (2001) Nature 413, 179–183 [DOI] [PubMed] [Google Scholar]
- 8.Wu Z., Puigserver P., Andersson U., Zhang C., Adelmant G., Mootha V., Troy A., Cinti S., Lowell B., Scarpulla R. C., Spiegelman B. M. (1999) Cell 98, 115–124 [DOI] [PubMed] [Google Scholar]
- 9.Mootha V. K., Handschin C., Arlow D., Xie X., St Pierre J., Sihag S., Yang W., Altshuler D., Puigserver P., Patterson N., Willy P. J., Schulman I. G., Heyman R. A., Lander E. S., Spiegelman B. M. (2004) Proc. Natl. Acad. Sci. U.S.A. 101, 6570–6575 [DOI] [PMC free article] [PubMed] [Google Scholar]
- 10.Schreiber S. N., Emter R., Hock M. B., Knutti D., Cardenas J., Podvinec M., Oakeley E. J., Kralli A. (2004) Proc. Natl. Acad. Sci. U.S.A. 101, 6472–6477 [DOI] [PMC free article] [PubMed] [Google Scholar]
- 11.Cunningham J. T., Rodgers J. T., Arlow D. H., Vazquez F., Mootha V. K., Puigserver P. (2007) Nature 450, 736–740 [DOI] [PubMed] [Google Scholar]
- 12.Puigserver P., Rhee J., Lin J., Wu Z., Yoon J. C., Zhang C. Y., Krauss S., Mootha V. K., Lowell B. B., Spiegelman B. M. (2001) Mol Cell 8, 971–982 [DOI] [PubMed] [Google Scholar]
- 13.Anderson R. M., Barger J. L., Edwards M. G., Braun K. H., O'Connor C. E., Prolla T. A., Weindruch R. (2008) Aging Cell 7, 101–111 [DOI] [PMC free article] [PubMed] [Google Scholar]
- 14.Olson B. L., Hock M. B., Ekholm-Reed S., Wohlschlegel J. A., Dev K. K., Kralli A., Reed S. I. (2008) Genes Dev. 22, 252–264 [DOI] [PMC free article] [PubMed] [Google Scholar]
- 15.Li X., Monks B., Ge Q., Birnbaum M. J. (2007) Nature 447, 1012–1016 [DOI] [PubMed] [Google Scholar]
- 16.Teyssier C., Ma H., Emter R., Kralli A., Stallcup M. R. (2005) Genes Dev. 19, 1466–1473 [DOI] [PMC free article] [PubMed] [Google Scholar]
- 17.Housley M. P., Udeshi N. D., Rodgers J. T., Shabanowitz J., Puigserver P., Hunt D. F., Hart G. W. (2009) J. Biol. Chem. 284, 5148–5157 [DOI] [PMC free article] [PubMed] [Google Scholar]
- 18.Lerin C., Rodgers J. T., Kalume D. E., Kim S. H., Pandey A., Puigserver P. (2006) Cell Metab. 3, 429–438 [DOI] [PubMed] [Google Scholar]
- 19.Rodgers J. T., Lerin C., Haas W., Gygi S. P., Spiegelman B. M., Puigserver P. (2005) Nature 434, 113–118 [DOI] [PubMed] [Google Scholar]
- 20.Nemoto S., Fergusson M. M., Finkel T. (2005) J. Biol. Chem. 280, 16456–16460 [DOI] [PubMed] [Google Scholar]
- 21.Gerhart-Hines Z., Rodgers J. T., Bare O., Lerin C., Kim S. H., Mostoslavsky R., Alt F. W., Wu Z., Puigserver P. (2007) EMBO J. 26, 1913–1923 [DOI] [PMC free article] [PubMed] [Google Scholar]
- 22.Rodgers J. T., Puigserver P. (2007) Proc. Natl. Acad. Sci. U.S.A. 104, 12861–12866 [DOI] [PMC free article] [PubMed] [Google Scholar]
- 23.Baur J. A., Pearson K. J., Price N. L., Jamieson H. A., Lerin C., Kalra A., Prabhu V. V., Allard J. S., Lopez-Lluch G., Lewis K., Pistell P. J., Poosala S., Becker K. G., Boss O., Gwinn D., Wang M., Ramaswamy S., Fishbein K. W., Spencer R. G., Lakatta E. G., Le Couteur D., Shaw R. J., Navas P., Puigserver P., Ingram D. K., de Cabo R., Sinclair D. A. (2006) Nature 444, 337–342 [DOI] [PMC free article] [PubMed] [Google Scholar]
- 24.Lagouge M., Argmann C., Gerhart-Hines Z., Meziane H., Lerin C., Daussin F., Messadeq N., Milne J., Lambert P., Elliott P., Geny B., Laakso M., Puigserver P., Auwerx J. (2006) Cell 127, 1109–1122 [DOI] [PubMed] [Google Scholar]
- 25.Lin J., Yang R., Tarr P. T., Wu P. H., Handschin C., Li S., Yang W., Pei L., Uldry M., Tontonoz P., Newgard C. B., Spiegelman B. M. (2005) Cell 120, 261–273 [DOI] [PubMed] [Google Scholar]
- 26.Lelliott C. J., Medina-Gomez G., Petrovic N., Kis A., Feldmann H. M., Bjursell M., Parker N., Curtis K., Campbell M., Hu P., Zhang D., Litwin S. E., Zaha V. G., Fountain K. T., Boudina S., Jimenez-Linan M., Blount M., Lopez M., Meirhaeghe A., Bohlooly Y. M., Storlien L., Strömstedt M., Snaith M., Oresic M., Abel E. D., Cannon B., Vidal-Puig A. (2006) PLoS Biol. 4, e369. [DOI] [PMC free article] [PubMed] [Google Scholar]
- 27.Sonoda J., Laganière J., Mehl I. R., Barish G. D., Chong L. W., Li X., Scheffler I. E., Mock D. C., Bataille A. R., Robert F., Lee C. H., Giguère V., Evans R. M. (2007) Genes Dev. 21, 1909–1920 [DOI] [PMC free article] [PubMed] [Google Scholar]
- 28.Nagai Y., Yonemitsu S., Erion D. M., Iwasaki T., Stark R., Weismann D., Dong J., Zhang D., Jurczak M. J., Löffler M. G., Cresswell J., Yu X. X., Murray S. F., Bhanot S., Monia B. P., Bogan J. S., Samuel V., Shulman G. I. (2009) Cell Metab. 9, 252–264 [DOI] [PMC free article] [PubMed] [Google Scholar]
- 29.Ishii K. A., Fumoto T., Iwai K., Takeshita S., Ito M., Shimohata N., Aburatani H., Taketani S., Lelliott C. J., Vidal-Puig A., Ikeda K. (2009) Nat. Med. 15, 259–266 [DOI] [PubMed] [Google Scholar]
- 30.Lin J., Puigserver P., Donovan J., Tarr P., Spiegelman B. M. (2002) J. Biol. Chem. 277, 1645–1648 [DOI] [PubMed] [Google Scholar]
- 31.Kressler D., Schreiber S. N., Knutti D., Kralli A. (2002) J. Biol. Chem. 277, 13918–13925 [DOI] [PubMed] [Google Scholar]
- 32.Sabourin L. A., Girgis-Gabardo A., Seale P., Asakura A., Rudnicki M. A. (1999) J. Cell Biol. 144, 631–643 [DOI] [PMC free article] [PubMed] [Google Scholar]
- 33.Shevchenko A., Wilm M., Vorm O., Mann M. (1996) Anal Chem. 68, 850–858 [DOI] [PubMed] [Google Scholar]
- 34.Haas W., Faherty B. K., Gerber S. A., Elias J. E., Beausoleil S. A., Bakalarski C. E., Li X., Villén J., Gygi S. P. (2006) Mol. Cell Proteomics 5, 1326–1337 [DOI] [PubMed] [Google Scholar]
- 35.Eng J. K., McCormack A. L., Yates J. R., 3rd (1994) J. Am. Soc. Mass Spectrom. 5, 976–989 [DOI] [PubMed] [Google Scholar]
- 36.Owen O. E., Kalhan S. C., Hanson R. W. (2002) J. Biol. Chem. 277, 30409–30412 [DOI] [PubMed] [Google Scholar]
- 37.Lonard D. M., Lanz R. B., O'Malley B. W. (2007) Endocr. Rev. 28, 575–587 [DOI] [PubMed] [Google Scholar]
- 38.Imoberdorf R. M., Topalidou I., Strubin M. (2006) Mol. Cell. Biol. 26, 1610–1616 [DOI] [PMC free article] [PubMed] [Google Scholar]
- 39.Chen H., Lin R. J., Schiltz R. L., Chakravarti D., Nash A., Nagy L., Privalsky M. L., Nakatani Y., Evans R. M. (1997) Cell 90, 569–580 [DOI] [PubMed] [Google Scholar]
- 40.Puigserver P., Adelmant G., Wu Z., Fan M., Xu J., O'Malley B., Spiegelman B. M. (1999) Science 286, 1368–1371 [DOI] [PubMed] [Google Scholar]
- 41.Vianna C. R., Huntgeburth M., Coppari R., Choi C. S., Lin J., Krauss S., Barbatelli G., Tzameli I., Kim Y. B., Cinti S., Shulman G. I., Spiegelman B. M., Lowell B. B. (2006) Cell Metab. 4, 453–464 [DOI] [PMC free article] [PubMed] [Google Scholar]
- 42.Arany Z., Lebrasseur N., Morris C., Smith E., Yang W., Ma Y., Chin S., Spiegelman B. M. (2007) Cell Metab. 5, 35–46 [DOI] [PubMed] [Google Scholar]
- 43.Kamei Y., Ohizumi H., Fujitani Y., Nemoto T., Tanaka T., Takahashi N., Kawada T., Miyoshi M., Ezaki O., Kakizuka A. (2003) Proc. Natl. Acad. Sci. U.S.A. 100, 12378–12383 [DOI] [PMC free article] [PubMed] [Google Scholar]
- 44.Ling C., Wegner L., Andersen G., Almgren P., Hansen T., Pedersen O., Groop L., Vaag A., Poulsen P. (2007) Diabetologia 50, 1615–1620 [DOI] [PubMed] [Google Scholar]
- 45.Stafford J. M., Wilkinson J. C., Beechem J. M., Granner D. K. (2001) J. Biol. Chem. 276, 39885–39891 [DOI] [PubMed] [Google Scholar]
- 46.Vega R. B., Huss J. M., Kelly D. P. (2000) Mol. Cell. Biol. 20, 1868–1876 [DOI] [PMC free article] [PubMed] [Google Scholar]
Associated Data
This section collects any data citations, data availability statements, or supplementary materials included in this article.


