Abstract
Affymetrix GeneChip technology was employed to detect differentially expressed genes in inner medullary collecting duct (IMCD3) cells grown under isotonic and hypertonic conditions. A marked up-regulation was found for the zinc-finger protein ZAC1 under hypertonic stress (219-fold, p < 0.001). Changes in expression for ZAC1 were verified by quantitative PCR for message and Western blotting for protein. In mouse and human kidney tissues, ZAC1 expression was substantial in the papilla and was absent in the cortex. Furthermore, ZAC1 expression significantly increased in the papilla of mice following 36 h of fluid restriction and decreased in polyuric mice consuming sucrose in water. Because ZAC1 has been described to be a potential negative regulator of sorbitol dehydrogenase (SDH) in hippocampal cells, we examined whether this relationship also occurs in kidney cells under hypertonic stress. We found that stable IMCD3 clones silenced for ZAC1 to varying levels demonstrated an inverse effect on SDH expression. ZAC1 binds to a consensus repression site within the promoter of SDH, pointing to a mechanism whereby ZAC1 acts by repressing SDH transcriptional activity during hypertonic conditions. Taken together, these data strongly suggest that ZAC1 is up-regulated under hypertonic stress and negatively regulates expression of SDH, allowing for accumulation of sorbitol as a compatible organic osmolyte.
The cells that inhabit the hypertonic environment of the inner medulla, unlike most cells in mammals, possess a number of adaptive mechanisms that allow them to survive this harsh environment. This survival is mediated initially by the activation of acute cellular efflux of water, ion transport systems, and thereafter by the cellular accumulation of a number of compatible organic osmolytes (1–3). These osmolytes include sorbitol, betaine, myo-inositol, taurine, and glycerophosphocholine (1, 2). Among these, sorbitol is the major osmolyte that accumulates in the cells of the inner medulla to survive in the hypertonic environment (4).
Sorbitol accumulation under hypertonic stress in the kidney is mediated mainly by an increase in its production from glucose by aldose reductase (AR),3 a member of the monomeric, NADPH-dependent aldoketoreductase family (5, 6) that is markedly up-regulated by hypertonic stress (5). Accumulation of sorbitol also requires that its further conversion to fructose be attenuated. In this regard, the expression of message for sorbitol dehydrogenase (SDH), which oxidizes sorbitol to fructose, is down-regulated with hypertonicity (4). Although the mechanisms that lead to the up-regulation of AR under hypertonic stress have been well established (7, 8), the mechanisms leading to a decrease in SDH expression are poorly understood.
To elucidate as yet unrecognized genes involved in the osmotic stress response, our laboratory has employed discovery tools including gene arrays and proteomic techniques including two-dimensional difference gel electrophoresis and antibody arrays (9, 10). Here, we describe the up-regulation of ZAC1, a zinc-finger protein whose expression has been associated with inhibition of tumor cell proliferation both in vitro and in vivo (11, 12). Using an inducible Tet-off system for ZAC1 in the hippocampal cell line HW3-5, Barz et al. (13) recently published a list of genes that are up- and down-regulated by ZAC1 expression. Among these genes, SDH expression appeared to be substantially down-regulated when ZAC1 expression was increased.
Although ZAC1 has been shown to be present in kidney tissues (14), its renal localization has not been described to date. We therefore undertook the present study (a) to explore whether ZAC1 expression is regulated by tonicity, (b) to establish its renal and cellular localization, (c) to determine whether it plays a role in the hypertonicity-mediated accumulation of sorbitol, and (d) to elucidate the mechanism whereby it regulates SDH expression.
EXPERIMENTAL PROCEDURES
Materials
Cell culture medium, fetal calf serum, and antibiotics were from Invitrogen. Antibody to mouse ZAC1 was a kind gift from Dr. Dietmar Spengler from the Max Planck Institute of Psychiatry, Munich, Germany, and was generated in rabbit against fusion proteins of specific ZAC epitopes. Antibodies to β-actin were obtained from Cell Signaling (Danvers, MA). Antibody to SDH was purchased from Abcam (Cambridge, MA). All other chemicals were ultra high purity grade and purchased from Sigma.
Cell Culture
The established murine inner medullary collecting duct cell line (IMCD3) originally developed by Rauchman et al. (15) was provided by Dr. Steve Gullans (Boston, MA). Cell stocks were prepared and adapted to 600 and 900 mosmol/kg H2O in our laboratory as described previously (16, 17). In experiments involving hypertonic stress, the media in culture dishes were exchanged for that with added NaCl to the specified osmolality depending on the experiment. Osmolality was determined with a Micro-Osmometer (model 3300; Advanced Instruments, Norwood, MA).
Gene Arrays
We used the mouse gene array 430-2.0, containing 39,000 transcripts, from Affymetrix (Santa Clara, CA). RNA transcription to cDNA, biotinylation to cRNA, fragmentation, hybridization to the chip, and chip analysis using a HP GeneArray Scanner were done according to the manufacturer's recommendations and performed by the University of Colorado Gene Array Core. Gene array data were analyzed using both the Affymetrix Microarray Suite 5.0 and GeneSpring (Silicon Genetics) software analysis programs.
Cell Transfection
IMCD3 cultures were transfected with the pSM2 empty vector (v2MM_173061) or the stable small interfering RNA vector pSM2-ZAC1 (v2MM_58373; Open Biosystems, Huntsville, AL) using Lipofectamine 2000 (Invitrogen) as described by the manufacturer. Stable transfectants (clones) were selected from colonies growing in plates from a 10-fold dilution series in media prepared with 10 μg/ml puromycin antibiotic (Sigma). Clones were subjected to a second round of 10-fold dilutions and replated in puromycin medium, and a second colony selection was performed to provide clean clones for further analysis.
mZAC1- and hZAC1-overexpressing Clones
Mouse and human ZAC1 (mZAC1 and hZAC1, respectively) were generated by standard PCR amplification with primers harboring EcoRI and NotI sites from mouse and human kidney tissues, respectively: mZAC1, 5′-GAC GAA TTC ATG GCT CCA TTC CGC TGT CAA AAA TGT GGC AAG T-3′ (sense) and 5′-GAC GCG GCC GCT TAT CTA AAT GCG TGA TGG AAA TGG-3′ (antisense); hZAC1, 5′-GAC GAA TTC ATG GCT ACC CAT TCT CCC CAG AAA TCT-3′ (sense) and 5′-GAC GCG GCC GCT TAT CTG AAT GCA TGA TGG AAA TGA-3′ (antisense). The amplicons were purified, digested, and cloned directionally into the pIRES puro3 vector (Clontech). The recombinant vector obtained was analyzed and verified by sequencing at the University of Colorado Cancer Center DNA sequencing and analysis core at the University of Colorado Anschutz Medical Campus.
Sorbitol Determination
Cells kept at isotonic conditions or hypertonically stressed were harvested and extracted using the perchloric acid method as described previously (18), and 20 μl of extract was analyzed using a SDH-based enzymatic kit (Megazyme International Ireland Ltd., Wicklow, Ireland) according to the manufacturer's protocol.
Mouse Kidney Tissues
C57/B6 mice were obtained from The Jackson Laboratory (Bar Harbor, ME). Mice were subjected to food and ad libitum water, 2% sucrose/water for 2 weeks, or fluid-restricted for 36 h. Mice were harvested by cervical dislocation. Urine samples were collected from the bladder for osmolality analysis; kidneys were removed, and papilla and cortex tissues were dissected and snap frozen in liquid nitrogen. Tissues were homogenized using a glass tissue grinder on ice with mitogen-activated protein kinase (MAPK) lysis buffer and analyzed as described previously (17).
Human Kidney Tissues
Human kidney tissues from cortex, medulla, and papilla were obtained under Institutional Review Board COMIRB#05 and National Institutes of Health Program Project Grant U19 A10636030 from a kidney that was not suitable for transplantation. Tissues were processed as described above.
RNA Extraction, Analysis, and Message Quantification
Cytosolic RNA was isolated from confluent cultures in 100 × 20-mm tissue culture using the RNeasy kit (Qiagen, Valencia, CA). Prior to qPCR, RNA was converted to cDNA using the iScript reverse transcriptase kit (Bio-Rad) as described by the manufacturer. qPCR primers specific to ZAC1, AR, SDH, and β-actin were designed using Beacon Designer 5.0 software (Premier Biosoft International, Palo Alto, CA). qPCR was performed using ZAC1 forward primer 5′-GTCTGGGTTGGAGTCTGTG-3′ and ZAC1 reverse primer 5′-GCAAATACGAAGCCGATGG-3′ (70 nm each) and the SYBR Green JumpStart Taq Readymix qPCR kit (Sigma) on a Bio-Rad I-Cycler. qPCR runs were analyzed by agarose gel electrophoresis and melt curve to verify that the correct amplicon was produced. β-Actin RNA was used as internal control, and the amount of RNA was calculated by the comparative CT method as recommended by the manufacturer.
Chromatin Immunoprecipitation Assay
IMCD3 cells were resuspended in phosphate-buffered saline to 5 × 10⁵ cells/ml. DNA/protein interaction was cross-linked at room temperature for 10 min with paraformaldehyde to a final concentration of 1%. The cross-linking reaction was quenched by the addition of glycine, and cells were pelleted and resuspended in lysis buffer containing 5 mm PIPES, pH 8.0, 85 mm KCl supplemented with 0.5% Nonidet P-40 and mixture protease inhibitor (Roche Applied Science). The nuclear extract was pelleted by microcentrifugation at 2,000 rpm for 5 min, and genomic DNA was sheared into fragments of ∼500 bp by ultrasonic treatment (Branson 1200, Ventura, CA). Sheared products were analyzed in a 1.5% agarose gel. Genomic DNA was then precleared by the addition of protein A/G-agarose slurry and further centrifugation. ZAC1-DNA complexes were pulled down by overnight incubation at 4 °C with an anti-ZAC1 antibody and further addition of protein A/G-agarose slurry. Agarose beads were washed twice with phosphate-buffered saline supplemented with 1% Nonidet P-40, 0.5% sodium deoxycholate, and 0.1% SDS, followed by four washes in buffer containing 100 mm Tris pH 8.0, 500 mm LiCl supplemented with 1% Nonidet P-40 and 1% deoxycholate. Agarose beads were collected by centrifugation, and cross-linking was reversed by overnight incubation at 67 °C. DNA was then isolated from proteins with phenol/chloroform/isoamyl alcohol, and PCR analysis for the mouse SDH promoter sequence was performed for 30 cycles employing the following primers: forward, 5′-CCTGAGGACTTCTTTTAAGT3-′; and reverse, 5′-ATGTATGTGTGTGCACGACT-3′ (see supplemental Fig. 1). PCR products were separated using a 2% agarose gel and visualized by ethidium bromide staining.
Protein Extraction and Western Blotting
Cell protein lysates and Western blotting were performed from confluent cell cultures as described previously (16).
Confocal Fluorescence Microscopy
IMCD3 cells were grown to confluence in 8-well glass slides (177402; NUNC, Rochester, NY) and fixed with methanol at −20 °C for 2 min. Cells were then permeabilized with 0.3% Triton X-100 in phosphate-buffered saline and incubated overnight with ZAC1 antibody. Cells were rinsed and incubated with a goat anti-rabbit Alexa Fluor 568-conjugated secondary antibody (Molecular Probes, Eugene, OR). Preparations were imaged with a 40× water immersion objective using a laser scanning confocal microscope (model LSM510; Zeiss, Thornwood, NY). Data were analyzed using the LSM image analyzer postacquisition software (Zeiss).
Statistics and Data Analysis
All data are presented as the means ± S.E. Data graphics and statistical analysis were performed using Instat (version 3.0) and Prism 4 (both from GraphPad Software, San Diego, CA). Data were analyzed for normality tests and using the Tukey-Kramer multiple comparison test. Multiple group corrections were performed using the method of Bartlett. In most cases experiments were performed three times with independent replicates. Total independent replicates for each data point (n) are identified in the figure legends. p values <0.05 were recognized as statistically significant. Correlation between mRNA for SDH and ZAC1 expression was evaluated employing linear regression analysis (Prism 4 software).
RESULTS
Affymetrix GeneChip Analysis Identifies ZAC1 as Up-regulated with Hypertonic Stress
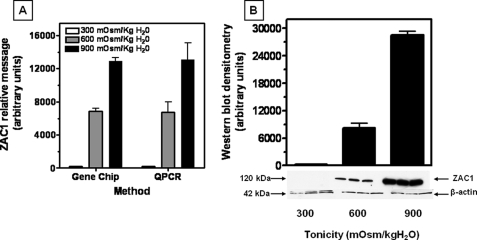
The mouse Affymetrix GeneChip array representing >39,000 transcripts was employed as a discovery tool to study changes in expression in IMCD3 cells chronically adapted to increasing levels of tonicity. IMCD3 cells originally developed by Rauchman et al. (15) were chronically adapted to 600 and 900 mosmol/kg H2O (16, 17) and were compared directly with cells grown at isotonic conditions. GeneChip data shown in Fig. 1A, left bars, reveal that ZAC1 mRNA is essentially absent in cells maintained at isotonic conditions but substantially up-regulated in cells chronically adapted to 600 mosmol/kg H2O (109-fold, p < 0.001) and 900 mosmol/kg H2O (219-fold, p < 0.001). Data shown in Fig. 1A, right bars, confirm by qPCR that ZAC1 mRNA is up-regulated under hypertonic stress in a pattern that mimics the GeneChip data. Western blot analysis (Fig. 1B) also demonstrates a similar pattern for ZAC1 protein expression with a 56-fold increase (p < 0.001) in expression at 600 mosmol/kg H2O and a 239-fold increase (p < 0.001) at 900 mosmol/kg H2O.
FIGURE 1.
Identification of ZAC1 as a protein up-regulated in response to osmotic stress. A, left bars, comparison of ZAC1 mRNA levels obtained from gene array data for IMCD3 cells at isotonic conditions (300 mosmol/kg H2O) and chronically adapted to 600 and 900 mosmol/kg H2O, indicating a substantial up-regulation with hypertonic stress. Right bars, validation of gene array data by qPCR performed using ZAC1-specific primers and demonstrating an increase in message in IMCD3 cells adapted to increasing tonicity. Data represent the average ± S.E. for three independent experiments performed in triplicate (n = 9). B, Western blot data reveal increased ZAC1 protein expression in IMCD3 cells under chronic exposure to hypertonicity. Data represent the average ± S.E. for three independent experiments performed in triplicate (n = 9). A representative Western blot including β-actin loading control is shown.
Expression of ZAC1 in Renal Cortex and Medulla from Rodents and Human Kidneys
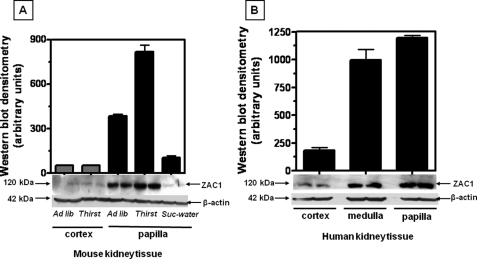
To assess whether the changes seen in cultured cells are also observed in renal tissues, protein expression was also examined in kidney tissues when mice were subjected to ad libitum water and fluid restriction for 36 h (urine osmolality increased from 1,424 ± 211 to 3,105 ± 524 mosmol/kg H2O, n = 6). Western blot data shown in Fig. 2A indicate a relative absence of ZAC1 protein expression in the cortex and substantial presence of the protein in the papilla (7.4-fold, p < 0.001). Furthermore, ZAC1 protein expression increased 2.2-fold (p < 0.01) in papilla tissues upon fluid restriction for 36 h, with no significant change in the cortex. When mice were subjected to 2% sucrose/water loading for 2 weeks (urine osmolality decreased from 1,312 ± 121 to 231 ± 53 mosmol/kg H2O, n = 3) to reduce the tonicity in the medulla, ZAC1 protein expression was substantially down-regulated (4.1-fold (p < 0.001) compared with ad libitum water in papilla) to those levels found in the cortex. Analysis of ZAC1 protein expression in normal human kidney is shown in Fig. 2B for comparison and demonstrates the greatest expression in the hypertonic papilla and medulla with little comparable expression in the isotonic cortex tissues.
FIGURE 2.
ZAC1 protein expression in kidney tissues. A, mouse kidney tissues (papilla and cortex) were harvested after 36 h of water restriction (Thirst), 2 weeks of 2% sucrose/water (Suc-water), or with ad libitum water (Ad lib), and protein homogenates were analyzed by Western blotting. Expression of ZAC1 was substantial in mouse kidney papilla compared with little or no expression in cortex tissues. Water restriction in mice led to a 2.2-fold increase in ZAC1 protein expression in papilla (p < 0.01). Papilla tissues from sucrose-treated mice showed a 4.1-fold decrease in ZAC1 expression (compared with ad libitum treatment). Data represent the mean ± S.E. from three independent Western blots in duplicate (50 μg of total protein per lane, n = 6). A representative Western blot is shown. B, ZAC1 protein expression was compared in human kidney sections showing substantial expression in the hypertonic papilla and medulla compared with the isotonic cortex. Data are from two independent Western blots performed in duplicate (n = 4). A representative Western blot including β-actin loading control using 50 μg of total protein per lane is shown.
Kinetics of ZAC1 Message and Protein Expression folowing Acute Exposure to Hypertonicity
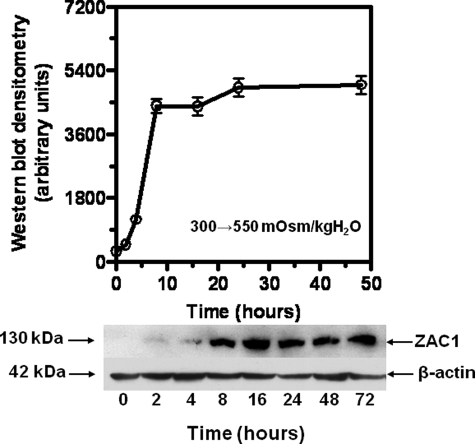
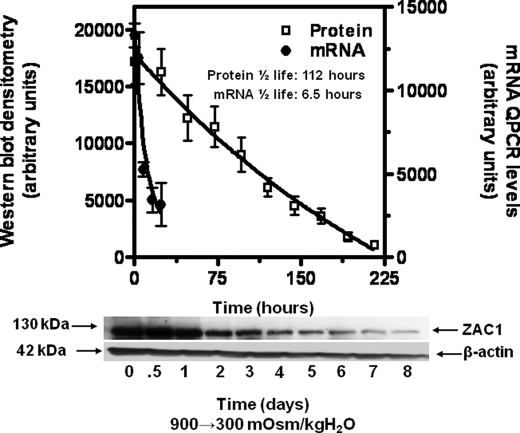
ZAC1 protein expression in IMCD3 cells subjected to acute sublethal osmotic stress was evaluated to determine the timing of the onset of expression. To this end we undertook Western blot analysis for protein at numerous time points following exposure to sublethal hypertonicity. Data shown in Fig. 3 demonstrate a significant increase in ZAC1 protein after 8 h of hypertonic stress (550 mosmol/kg H2O) with a maximum level of protein determined after 20–24 h. Analysis of half-life for ZAC1 message and protein in IMCD3 cells (treated with 0.5 μg/ml actinomycin D or cycloheximide for 72 h to avoid new synthesis of message and protein, respectively) is shown in Fig. 4. Data were curve fit for exponential decay, and the half-life was calculated to be 6.5 and 112 h for ZAC1 message and protein, respectively.
FIGURE 3.
Effect of acute sublethal osmotic stress (550 mosmol/kg H2O) on ZAC1 protein expression in IMCD3 cells. Cell lysates (0–72 h) were analyzed by Western blotting. Data depict the mean ± S.E. from three Western blots (50 μg of total protein per lane, n = 3). A representative Western blot including β-actin loading control is shown.
FIGURE 4.
Estimation of half-lives for ZAC1 mRNA and protein in IMCD3 cells. Cells chronically adapted to 900 mosmol/kg H2O were treated with 0.5 μg/ml actinomycin D or cycloheximide for 72 h to avoid new message and protein production in conjunction with a medium change to isotonic conditions. Replicate plates were harvested at different time points with analysis of message and protein by qPCR and Western blotting, respectively. Data were subjected to decay analysis (solid line) for message and protein. The half-life was calculated from the one-phase exponential decay equation. Results are from three independent experiments performed in duplicate (50 μg of total protein per lane, n = 3). A representative Western blot including β-actin loading control is shown.
Effect of Hypertonicity on SDH and AR Protein and Message Expression
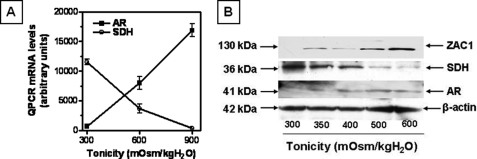
Because sorbitol is an important compatible osmolyte that accumulates during hypertonic stress and ZAC1 has been suggested as a negative regulator of the enzyme responsible for the breakdown of sorbitol (SDH) (13), we examined the effects of hypertonicity on SDH message and protein expression. Fig. 5A reveals that SDH message as assessed by qPCR progressively decreases in cells chronically exposed to 600 and 900 mosmol/kg H2O whereas the message of AR, which is responsible for the generation of sorbitol, is markedly up-regulated. Fig. 5B demonstrates that this change in message is accompanied by a decrement in SDH protein expression in cells exposed to increasing levels of tonicity for 24 h as ZAC1 and AR expression concomitantly increases.
FIGURE 5.
SDH and AR expression in IMCD3 cells under hypertonic stress. A, effect of chronic hypertonic stress (600 and 900 mosmol/kg H2O) on AR and SDH mRNA expression in IMCD3 cells. B, representative Western blot showing AR, SDH, and ZAC1 protein expression in IMCD3 cells exposed to increasing levels of tonicity both acutely (24 h) and chronically (600 mosmol/kg H2O).
Effects of Silencing ZAC1 in IMCD3 Cells on SDH Expression and Sorbitol Accumulation under Hypertonic Stress
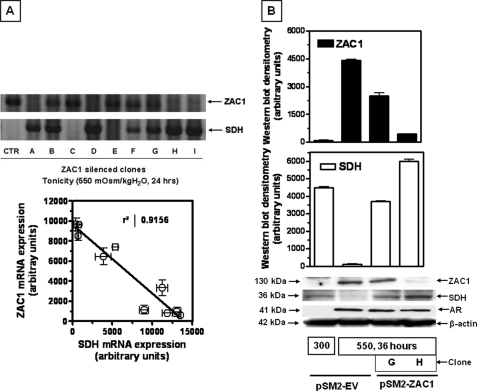
To assess the physiologic significance of the osmotic up-regulation of ZAC1, we undertook to silence protein expression and its impact on SDH expression. A plasmid-based system generating fold-back stem-loop structures that are processed into the specific small interfering RNA was used (pSM2-ZAC1). BLAST and alignment analyses were initially performed to ascertain the selectivity of the silencing sequence with other genes that may induce off-target responses. Analysis reveals <70% homology of the silencing sequence with other cDNAs reflecting the specificity of the target employed. The vector was lipid-transfected into IMCD3 cells, and stable clones were selected by growth in puromycin-containing medium. Expression of ZAC1 protein by Western blotting in silenced clones and the empty vector control cells was assessed following incubation under acute osmotic stress for 24 h. Because some clonal variation may occur by silencing ZAC1, we studied nine separate clones depicted in Fig. 6A. In general, inspection of the representative message by qPCR for these two proteins reveals an inverse relationship between ZAC1 and SDH expression. Specifically, clones fully silenced for ZAC1 such as A, D, H, and I show substantial SDH mRNA expression under hypertonic conditions. Clones partially silenced for ZAC1 expression (B, F, and G) demonstrate partial SDH expression. In contrast, clones not silenced for ZAC1 (C and E) and an empty vector control (CTR) show little or no signal of SDH mRNA expression. Fig. 6A, bottom, shows quantitatively the inverse correlation between ZAC1 and SDH in mRNA (R2 value of 0.9156) obtained from triplicate measurements. We then focused on the partially silenced clone (G) and the fully silenced clone (H) to study protein expression and the possible effect of silencing ZAC1 on AR. Fig. 6B shows little or no ZAC1 and AR protein expression at isotonic conditions (300 mosmol/kg H2O) with marked SDH expression. However, under acute hypertonic conditions, ZAC1 and AR are both up-regulated with a concomitant decrease in SDH levels in empty vector control cells. A comparison of ZAC1-silenced clones reveals that clone G demonstrates a partial reduction in ZAC1 protein levels (42.2%, p < 0.01) under acute hypertonic stress (550 mosmol/kg H2O), whereas clone H is fully silenced. Western blot data reveal that silencing ZAC1 expression does not substantially affect the up-regulation of AR under hypertonic conditions (Fig. 6B, middle). In contrast, ZAC1 silencing allows SDH expression to be maintained to corresponding degrees (30.8-fold (p < 0.001) increase for partially silenced clone G and 50.2-fold (p < 0.001) increase for totally silenced clone H) (Fig. 6B, bottom).
FIGURE 6.
Effect of ZAC1 silencing on SDH expression. A, upper, SDH mRNA analysis for nine ZAC1 clones silenced to varying degrees of expression and showing an inverse relation in expression between ZAC1 and SDH. A representative agarose gel for a single replicate per clone is shown. CTR, empty vector control. Lower, ZAC1-SDH mRNA plotted correlation for each clone (n = 3 replicates) demonstrating an R2 value of 0.9156. B, upper, validation of ZAC1 protein expression under acute hypertonic stress (550 mosmol/kg H2O for 36 h) in partially silenced clone G and fully silenced clone H compared with empty vector control cells. Lower, analysis for AR and SDH protein expression in the same clones depicting a substantial increase in SDH expression with lower levels of ZAC1 and without any change in AR expression. Western blot data were from three independent experiments (n = 9). A representative Western blot including β-actin loading control is shown. It is important to note that ZAC1 protein levels were absent in clones similar to empty vector control cells under isotonic conditions (data not shown).
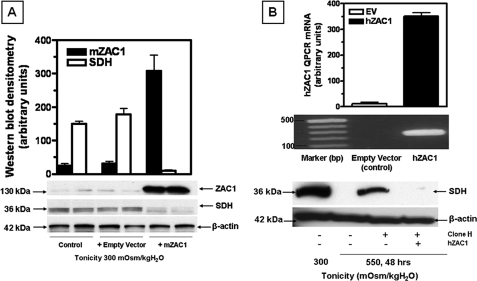
Because the blunted SDH response could be caused by a clonal selection rather than direct effects of ZAC1 knockdown, we performed ZAC1 overexpression and add-back experiments to evaluate whether we could restore SDH expression to those levels physiologically found at isotonic and hypertonic conditions. We first started by expressing ZAC1 in wild-type IMCD3 cells maintained at isotonic conditions. To this end, we cloned mZAC1 coding sequence into the overexpressing vector pIRES, and we transiently transfected IMCD3 cells with this construct. As shown in Fig. 7A, we obtained substantial ZAC1 expression at isotonic conditions in cells transfected with this construct. In contrast, no mZAC1 expression was found in either wild-type IMCD3 cells or in cells transfected with an empty pIRES vector. Levels of SDH expression were substantially down-regulated in pIRES-mZAC1-transfected cells with no difference in the empty vector control cells. Because employing a mZAC1 overexpressor construct would have no effect in cells stably expressing a mZAC1 silencer, we also cloned hZAC1 in pIRES as a mouse RNA interference-resistant ZAC1 to add back to IMCD3 silenced cells under hypertonic conditions. We transfected the IMCD3 totally silenced clone H with hZAC1, and we exposed the cells to acute hypertonicity for 48 h. As shown in Fig. 7B, upper, expression of hZAC1 in the silenced clone H was validated by qPCR using specific primers against hZAC1 that would not amplify mZAC1. As demonstrated in Fig. 7B, lower, expression of the resistant hZAC1 substantially down-regulated SDH expression under hypertonic conditions.
FIGURE 7.
Overexpression of ZAC1 induces SDH down-regulation. A, expression of mouse ZAC1 in IMCD3 cells maintained at isotonic conditions results in the down-regulation of SDH levels. A representative Western blot including β-actin loading control is shown. B, expression of human ZAC1 in mouse ZAC1-silenced cells leads to SDH down-regulation under hypertonic stress conditions. Upper, agarose/qPCR analysis showing hZAC1 expression in silenced clone H. Lower, representative Western blot including β-actin loading control showing down-regulation of SDH expression in clone H under hypertonic conditions compared with no human ZAC1 expression.
Mechanism of Down-regulation of SDH by ZAC1
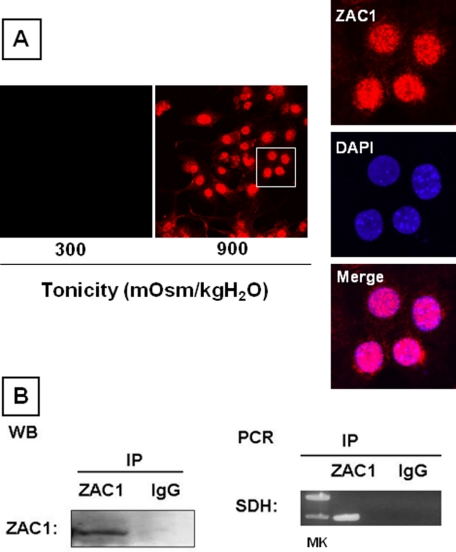
Because previous studies reported that ZAC1 may act as a transactivator or as a repressor of the transcription of different genes (19), we investigated whether this mechanism is operating in our studies. To regulate gene expression, ZAC1 has to be translocated to the nucleus. As shown in Fig. 8A, confocal immunofluorescence analysis demonstrates that ZAC1 (red) is located inside the nucleus of IMCD3 cells chronically exposed to hypertonicity (900 mosmol/kg H2O) where it colocalizes with the nuclear marker 4′,6-diamidino-2-phenylindole (blue). To determine whether ZAC1 has an effect on SDH mRNA transcription, different ZAC1-silenced clones were analyzed under hypertonic conditions by qPCR as shown in Fig. 6A, and the results strongly suggest that a transcriptional mechanism is involved.
FIGURE 8.
ZAC1 represses SDH transcription. A, immunofluorescence analysis showing that ZAC1 (red) is located in the nucleus (blue) in IMCD3 cells under hypertonic conditions. DAPI, 4′,6-diamidino-2-phenylindole. B, chromatin immunoprecipitation analysis reveals that immunoprecipitated (IP) ZAC1 (left, Western blot (WB)) precipitates the repressor binding region of SDH (right, PCR) compared with the IgG control. MK, molecular mass markers.
The transactivation or gene repression effect of ZAC1 depends on the ZAC1-DNA binding sequence located within the promoter region of the gene. Analysis of the proximal promoter region of mouse SDH (first 2.5 kb upstream from the transcription start) reveals complete absence of any of the well characterized DNA consensus sites for ZAC1 transactivation properties (supplemental Fig. 1A) (19). In contrast, we found a repressor consensus site at 1.4 kb upstream from the first exon. This consensus site, represented as a “half-part” binding site for monomeric ZAC1 (G4TTAGGCTG4), resembles the idealistic ZAC1 repression site G4N6G4 (19). To determine whether ZAC1 binds to this region within the SDH promoter under hypertonic stress, we performed chromatin immunoprecipitation analysis against ZAC1 in IMCD3 cells chronically exposed to 600 mosmol/kg H2O. As shown in Fig. 8B, left, a single band at ∼130 kDa was detected after immunoprecipitation and detection with ZAC1 antibodies. In contrast, no signal was found when the antibody was replaced by IgG. PCR analysis of the precipitated DNA using specific primers revealed that ZAC1 binds to the repressor region within the SDH promoter (Fig. 8B, right).
ZAC1 Is Necessary for Sorbitol Accumulation in IMCD3 Cells under Hypertonic Conditions
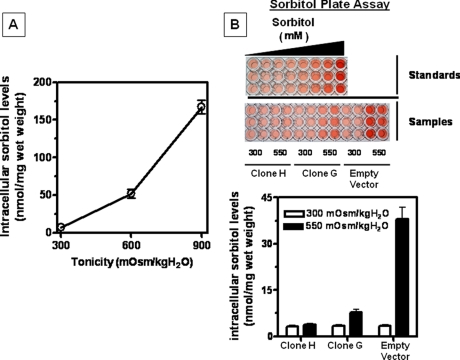
To determine whether the maintenance of SDH expression in ZAC1-silenced clones affects the overall accumulation of sorbitol in these cells, we measured intracellular sorbitol concentration after perchloric acid extraction as described previously (4). As shown in Fig. 9A and as a control, a significant increase in sorbitol accumulation is observed in IMCD3 cells in response to higher levels of tonicity (45.2-fold (p < 0.001) for 600 mosmol/kg H2O-adapted cells and 151.8-fold (p < 0.001) for 900 mosmol/kg H2O). In contrast, as shown in Fig. 9B, there is a substantial reduction in cellular sorbitol accumulation under acute hypertonic stress in clones silenced for ZAC1 expression (91.2% (p < 0.001) reduction for totally silenced clone H and 80.2% (p < 0.001) reduction for the partially silenced clone G compared with the empty vector control cells) with no significant change in sorbitol levels between both clones and the empty vector control cells at isotonic conditions.
FIGURE 9.
Effect of silencing ZAC1 expression on sorbitol accumulation under hypertonic stress. A, intracellular sorbitol concentration in IMCD3 cells chronically adapted to increasing levels of tonicity (600 and 900 mosmol/kg H2O) showing a substantial accumulation under hypertonic stress. B, intracellular sorbitol concentration (microtiter plate assay) in ZAC1-silenced clones compared with empty vector controls. No significant change is observed between clones and empty vector control cells at isotonic conditions (300 mosmol/kg H2O). However, under acute hypertonic stress (550 mosmol/kg H2O for 48 h), levels of intracellular sorbitol are dramatically reduced as a consequence of silencing ZAC1 expression.
DISCUSSION
Changes in the cellular genome and proteome are required for cells of the renal inner medulla to survive and adapt to extreme changes in hypertonicity. Although a large body of information already exists regarding the osmotic stress response involving organic osmolyte accumulation, ion transport, and DNA repair (3, 20–23), the survival of these cells under hypertonic stress requires substantial regulation by proteins that as yet have not been identified. The major osmolyte accumulated in the osmotic stress response in IMCD3 cells is sorbitol (4), which is an intermediate product in the polyol pathway produced by the reduction of glucose by AR (6). However, SDH, the second enzyme in the polyol pathway, metabolizes sorbitol into fructose, maintaining low intracellular levels of sorbitol under physiologic isotonic conditions. Under hypertonic conditions, we found previously that SDH mRNA expression is down-regulated in IMCD3 cells (4). In contrast, other groups have found little or no difference in SDH mRNA levels under acute hypertonic stress (24, 25). In these studies, the acute nature of the hypertonic stress may have minimized the changes determined for SDH mRNA. In the present study, we confirmed our previous observation regarding the down-regulation of message for SDH and complemented with parallel decrement in protein expression. Although it is well known that hypertonic stress activates AR expression through tonicity enhancer-binding protein (7, 8), a key transcription factor in the osmotic stress response (26–29), the mechanisms leading to a potential down-regulation of SDH remain unexplored.
In the present work, by using Affymetrix GeneChip, we found that the zinc-finger protein ZAC1 is one of the most robustly up-regulated genes in IMCD3 cells under hypertonic stress (219-fold (p < 0.001) between 900 and 300 mosmol/kg H2O). ZAC1 is a zinc-finger protein also known as LOT1 and PLAGL1 and is characterized by its potential role in tumor suppression (11, 12, 30). It has been reported that ZAC1 directly or through p53 (31, 32) decreases cell proliferation by regulation of apoptosis and cell cycle arrest (12, 33).
The up-regulation of ZAC1 in IMCD3 cells in response to hypertonicity as determined by GeneChip analysis was validated both by qPCR for message and Western blotting for protein. Under isotonic conditions, IMCD3 cells were found to express very low levels of ZAC1, which increased during acute or chronic exposure to hypertonicity. The expression of ZAC1 protein in response to hypertonicity was also demonstrated in kidney tissues of mice and human with substantial ZAC1 protein levels in the hypertonic papilla tissues and nearly absent in the isotonic cortex. Fluid-restricted mice were found to increase further expression of ZAC1 in papilla tissues, whereas ZAC1 expression was down-regulated in papilla tissues from water-loaded mice (sucrose/water).
Because ZAC1 has been suggested to function as a negative regulator of SDH in hippocampal cells (13), we assessed the role of ZAC1 up-regulation in our observed decrement in SDH expression in IMCD3 cells. Silencing ZAC1 expression by using a stable small hairpin RNA vector resulted in a variable loss of expression in IMCD3 clones under isotonic and hypertonic exposure, which inversely correlated (R2 = 0.9156) with SDH expression. However, changes in ZAC1 expression had no effect on AR expression. To determine whether the effect observed on SDH expression was caused by clonal variation rather than by knockdown of ZAC1, we performed ZAC1 overexpression in isotonic cells and in a clone fully silenced for ZAC1 to restore SDH expression. In both of these settings, the inverse relationship between ZAC1 and SDH was fully maintained, further supporting a direct role for ZAC1 in regulating SDH.
We further investigated the mechanism whereby ZAC1 down-regulates SDH. The above noted effect on SDH message suggested transcriptional regulation. Furthermore, we unveiled within the SDH promoter a consensus site for ZAC1-dependent gene transcriptional repression. Chromatin immunoprecipitation experiments revealed that ZAC1 binds to this consensus site. Finally, we measure the final product of the pathway, the intracellular levels of the osmolyte sorbitol. Silencing ZAC1 expression also led to a parallel decrease in cellular sorbitol accumulation, reflecting the important role of ZAC1 in the maintenance of sorbitol in the inner medulla by decreasing levels of SDH. Comparison of these data with previous studies on SDH in the laboratories of Beck (24) and Grunewald (25) may be reconciled relative to their determination of a doubling in SDH activity in the settings of hypertonic stress by considering that increasing AR expression and sorbitol substrate levels thereby enhance SDH enzyme activity, even in the face of diminished protein expression. Furthermore, we found previously that under chronic exposure to increased levels of tonicity, IMCD3 cells do not accumulate detectable levels of fructose (4), which could further enhance SDH enzymatic activity. Our studies suggest that the effects on SDH activity notwithstanding, the down-regulation of SDH expression is a vital component in the maintenance of cellular sorbitol levels.
It is of interest to postulate one potential application that emanates from these observations in which accumulation of sorbitol is implicated in complications of diabetes mellitus including diabetic nephropathy, neuropathy, and cataracts (34–36). ZAC1 could therefore become a potential target in the treatment of these complications related to diabetes, either alone or in combination with well established AR inhibitors. To this end, additional studies are currently under way to elucidate the signaling pathways responsible for ZAC1 expression.
In conclusion, this study is the first to identify ZAC1 as an osmotic response protein. We describe its nuclear localization in cultured IMCD3 cells as well as in the papilla (but not in the cortex) of mouse and human kidneys. We also demonstrated that this zinc-finger protein plays a central role in maintaining high levels of sorbitol during hypertonic conditions by a mechanism involving the transcriptional repression of SDH.
This work was supported, in whole or in part, by National Institutes of Health Grants DK-19928 and DK-66544 (to T. B.).

The on-line version of this article (available at http://www.jbc.org) contains supplemental Fig. 1.
- AR
- aldose reductase
- hZAC1
- human ZAC1
- mZAC1
- mouse ZAC1
- PIPES
- 1,4-piperazinediethanesulfonic acid
- qPCR
- quantitative PCR
- SDH
- sorbitol dehydrogenase.
REFERENCES
- 1.Beck F. X., Burger-Kentischer A., Müller E. (1998) Pfluegers Arch. 436, 814–827 [DOI] [PubMed] [Google Scholar]
- 2.Burg M. B., Ferraris J. D., Dmitrieva N. I. (2007) Physiol. Rev. 87, 1441–1474 [DOI] [PubMed] [Google Scholar]
- 3.Burg M. B., Kwon E. D., Kültz D. (1997) Annu. Rev. Physiol. 59, 437–455 [DOI] [PubMed] [Google Scholar]
- 4.Klawitter J., Rivard C. J., Brown L. M., Capasso J. M., Almeida N. E., Maunsbach A. B., Pihakaski-Maunsbach K., Berl T., Leibfritz D., Christians U., Chan L. (2008) Nephron Physiol. 109, p1–p10 [DOI] [PubMed] [Google Scholar]
- 5.Moriyama T., Garcia-Perez A., Burg M. B. (1989) J. Biol. Chem. 264, 16810–16814 [PubMed] [Google Scholar]
- 6.Petrash J. M. (2004) Cell. Mol. Life Sci. 61, 737–749 [DOI] [PMC free article] [PubMed] [Google Scholar]
- 7.Miyakawa H., Woo S. K., Dahl S. C., Handler J. S., Kwon H. M. (1999) Proc. Natl. Acad. Sci. U.S.A. 96, 2538–2542 [DOI] [PMC free article] [PubMed] [Google Scholar]
- 8.Woo S. K., Dahl S. C., Handler J. S., Kwon H. M. (2000) Am. J. Physiol. Renal Physiol. 278, F1006–F1012 [DOI] [PubMed] [Google Scholar]
- 9.Lanaspa M. A., Almeida N. E., Andres-Hernando A., Rivard C. J., Capasso J. M., Berl T. (2007) Proc. Natl. Acad. Sci. U.S.A. 104, 13672–13677 [DOI] [PMC free article] [PubMed] [Google Scholar]
- 10.Rivard C. J., Brown L. M., Almeida N. E., Maunsbach A. B., Pihakaski-Maunsbach K., Andres-Hernando A., Capasso J. M., Berl T. (2007) J. Biol. Chem. 282, 6644–6652 [DOI] [PMC free article] [PubMed] [Google Scholar]
- 11.Piras G., El Kharroubi A., Kozlov S., Escalante-Alcalde D., Hernandez L., Copeland N. G., Gilbert D. J., Jenkins N. A., Stewart C. L. (2000) Mol. Cell. Biol. 20, 3308–3315 [DOI] [PMC free article] [PubMed] [Google Scholar]
- 12.Spengler D., Villalba M., Hoffmann A., Pantaloni C., Houssami S., Bockaert J., Journot L. (1997) EMBO J. 16, 2814–2825 [DOI] [PMC free article] [PubMed] [Google Scholar]
- 13.Barz T., Hoffmann A., Panhuysen M., Spengler D. (2006) Cancer Res. 66, 11975–11982 [DOI] [PubMed] [Google Scholar]
- 14.Abdollahi A., Godwin A. K., Miller P. D., Getts L. A., Schultz D. C., Taguchi T., Testa J. R., Hamilton T. C. (1997) Cancer Res. 57, 2029–2034 [PubMed] [Google Scholar]
- 15.Rauchman M. I., Nigam S. K., Delpire E., Gullans S. R. (1993) Am. J. Physiol. Renal Physiol. 265, F416–F424 [DOI] [PubMed] [Google Scholar]
- 16.Capasso J. M., Rivard C. J., Enomoto L. M., Berl T. (2003) Ann. N.Y. Acad. Sci. 986, 410–415 [DOI] [PubMed] [Google Scholar]
- 17.Capasso J. M., Rivard C. J., Berl T. (2001) Am. J. Physiol. Renal Physiol. 280, F768–F776 [DOI] [PubMed] [Google Scholar]
- 18.Flögel U., Willker W., Engelmann J., Niendorf T., Leibfritz D. (1996) Dev. Neurosci. 18, 449–459 [DOI] [PubMed] [Google Scholar]
- 19.Hoffmann A., Ciani E., Boeckardt J., Holsboer F., Journot L., Spengler D. (2003) Mol. Cell. Biol. 23, 988–1003 [DOI] [PMC free article] [PubMed] [Google Scholar]
- 20.Berl T. (2000) Am. J. Kidney Dis. 35, xlvii–l [PubMed] [Google Scholar]
- 21.Dmitrieva N. I., Burg M. B. (2005) Mutat. Res. 569, 65–74 [DOI] [PubMed] [Google Scholar]
- 22.Handler J. S., Kwon H. M. (1996) Kidney Int. 49, 1682–1683 [DOI] [PubMed] [Google Scholar]
- 23.Handler J. S., Kwon H. M. (2001) Nephron 87, 106–110 [DOI] [PubMed] [Google Scholar]
- 24.Burger-Kentischer A., Müller E., März J., Fraek M. L., Thurau K., Beck F. X. (1999) Kidney Int. 55, 1417–1425 [DOI] [PubMed] [Google Scholar]
- 25.Grunewald R. W., Wagner M., Schubert I., Franz H. E., Müller G. A., Steffgen J. (1998) Cell Physiol. Biochem. 8, 293–303 [DOI] [PubMed] [Google Scholar]
- 26.Andres-Hernando A., Lanaspa M. A., Rivard C. J., Berl T. (2008) J. Biol. Chem. 283, 25082–25090 [DOI] [PMC free article] [PubMed] [Google Scholar]
- 27.Handler J. S., Kwon H. M. (2001) Kidney Int. 60, 408–411 [DOI] [PubMed] [Google Scholar]
- 28.Jeon U. S., Kim J. A., Sheen M. R., Kwon H. M. (2006) Acta Physiol. 187, 241–247 [DOI] [PubMed] [Google Scholar]
- 29.Woo S. K., Kwon H. M. (2002) Int. Rev. Cytol. 215, 189–202 [DOI] [PubMed] [Google Scholar]
- 30.Abdollahi A. (2007) J. Cell. Physiol. 210, 16–25 [DOI] [PubMed] [Google Scholar]
- 31.Hoffmann A., Ciani E., Houssami S., Brabet P., Journot L., Spengler D. (1998) Ann. N.Y. Acad. Sci. 865, 49–58 [DOI] [PubMed] [Google Scholar]
- 32.Huang S. M., Schönthal A. H., Stallcup M. R. (2001) Oncogene 20, 2134–2143 [DOI] [PubMed] [Google Scholar]
- 33.Pagotto U., Arzberger T., Ciani E., Lezoualc'h F., Pilon C., Journot L., Spengler D., Stalla G. K. (1999) Endocrinology 140, 987–996 [DOI] [PubMed] [Google Scholar]
- 34.Kador P. F., Inoue J., Secchi E. F., Lizak M. J., Rodriguez L., Mori K., Greentree W., Blessing K., Lackner P. A., Sato S. (1998) Exp. Eye Res. 67, 203–208 [DOI] [PubMed] [Google Scholar]
- 35.Lee A. Y., Chung S. K., Chung S. S. (1995) Proc. Natl. Acad. Sci. U.S.A. 92, 2780–2784 [DOI] [PMC free article] [PubMed] [Google Scholar]
- 36.Raccah D., Coste T., Cameron N. E., Dufayet D., Vague P., Hohman T. C. (1998) J. Diabetes Complications 12, 154–162 [DOI] [PubMed] [Google Scholar]


