

Abstract
Gyrase, an essential bacterial topoisomerase, is the target of several antibiotics (e.g. quinolones) as well as of bacterial toxin CcdB. This toxin, encoded by Escherichia coli toxin-antitoxin module ccd, poisons gyrase by causing inhibition of both transcription and replication. Because the molecular driving forces of gyrase unfolding and CcdB-gyrase binding were unknown, the nature of the CcdB-gyrase recognition remained elusive. Therefore, we performed a detailed thermodynamic analysis of CcdB binding to several fragments of gyrase A subunit (GyrA) that contain the CcdB-binding site. Binding of CcdB to the shorter fragments was studied directly by isothermal titration calorimetry. Its binding to the longer GyrA59 fragment in solution is kinetically limited and was therefore investigated via urea induced unfolding of the GyrA59-CcdB complex and unbound GyrA59 and CcdB, monitored by circular dichroism spectroscopy. Model analysis of experimental data, in combination with the relevant structural information, indicates that CcdB binding to gyrase is an enthalpic process driven mainly by specific interactions between CcdB and the highly stable dimerization domain of the GyrA. The dissection of binding energetics indicates that CcdB-gyrase recognition is accompanied by opening of the tower and catalytic domain of GyrA. Such extensive structural rearrangements appear to be crucial driving forces for the functioning of the ccd toxin-antitoxin module.
DNA gyrase, a type II topoisomerase, is one of the enzymes essential for the modulation of the topological state of DNA in bacteria (1, 2). In Escherichia coli gyrase exists as a heterotetramer consisting of two GyrA and two GyrB subunits. The GyrA subunit contains the catalytic domain (DNA breaking-resealing activity), whereas the ATP hydrolysis site is located on the GyrB subunit (3). Gyrase is a well validated target of several antibacterial agents (e.g. quinolones) (4). In recent years resistance to these antibiotics has become a major health concern, and therefore fundamental research on alternative antibiotic leads is necessary.
Certain bacterial toxins also target gyrase. One of them is the CcdB toxin encoded by the ccd operon from E. coli plasmid F (5, 6). The crystal structure of CcdB bound to the dimerization domain of the GyrA subunit of gyrase suggests that CcdB can bind only to the open conformation of GyrA (7). This structural information sets the basis for understanding gyrase poisoning at the molecular level. However, the key question as to the nature of the forces that drive the binding of CcdB to GyrA and how they are connected to the structural alterations of these proteins and to the function of the ccd toxin-antitoxin module (8) remains unanswered. An attempt to answer it requires combination of the structural information with the detailed thermodynamic analysis of CcdB binding to various GyrA fragments and unfolding of proteins involved in the binding process.
Therefore, we studied binding of CcdB to the fragments GyrA59, GyrA14, and GyrA12 (Fig. 1). GyrA59 is the functionally relevant fragment because it is, in the presence of GyrB, able to relax negative supercoils of DNA (9, 10). Unfortunately, the binding of CcdB to GyrA59 in solution cannot be followed directly, presumably because of the kinetically limited step of opening of tower and catalytic domains of GyrA59 (Fig. 1), which enables CcdB to access the binding site located on the GyrA59 dimerization domain (7). Because the thermal denaturation of GyrA59, CcdB, and their complex GyrA59-CcdB is irreversible and because it is known that efficient CcdB binding to GyrA59 at relatively low temperatures necessitates chemical denaturation and renaturation of GyrA59 (11), we attempted to investigate the CcdB binding to GyrA59 via the reversible urea denaturation of GyrA59-CcdB, GyrA59, and CcdB monitored by CD spectroscopy. Using these data, the thermodynamics of CcdB binding to GyrA59 was successfully described from the thermodynamic cycle in which the thermodynamic functions characterizing the GyrA59-CcdB denatured state were assumed to be equal to the sum of the corresponding functions characterizing the denatured states of free GyrA59 and CcdB.
FIGURE 1.

Structural representation of CcdB binding to gyrase A fragments GyrA12, GyrA14, and GyrA59 and their amino acid compositions. CcdB dimer (brown) binding to GyrA59 dimer consisting of dimerization (red), tower (blue), and catalytic (green) domains and connecting helices (yellow). GyrA12 consists of residues 372–482, whereas GyrA14 consists of residues 363–497.
By contrast, binding of CcdB to the shorter GyrA fragments GyrA12 and GyrA14 (Fig. 1) can be followed directly by isothermal titration calorimetry (ITC),2 which appears to be the most appropriate method for investigating binding energetics (12–18). The thermodynamic parameters of binding and unfolding obtained by global analysis of CD and ITC data were dissected into enthalpic and entropic contributions that were further discussed in terms of structural features of the bound (unbound) and folded (unfolded) states of CcdB and GyrA59 and functioning of the ccd toxin-antitoxin module.
EXPERIMENTAL PROCEDURES
Preparation of Protein Solutions
The preparation and purification of CcdB and gyrase fragments GyrA12, GyrA14, and GyrA59 has been described elsewhere (19–21). Their structure and the corresponding amino acid sequences are given in Fig. 1. The GyrA59-CcdB complex was formed by (urea) denaturation/renaturation and purified as described previously (11). CcdB and all gyrase fragments are dimers in solution at nondenaturing conditions. Therefore, molar concentrations of these proteins are expressed in moldimer liter−1. Prior to calorimetric and spectroscopic measurements, solutions of purified proteins were dialyzed extensively against phosphate buffer (0.02 m sodium phosphate, 0.15 m NaCl, 0.001 m EDTA, pH 7.5). All of the samples for the urea denaturation experiments were prepared by mixing 10 m urea and protein stock solutions to a final urea concentration between 0 and 8 m. The pH level of all solutions was checked and adjusted to 7.5 by the addition of NaOH. The concentrations of protein solutions were determined spectrophotometrically from the absorbance at 280 nm in 6 m GdmHCl at 25 °C. using extinction coefficients obtained from the method introduced by Gill and von Hippel (22).
CD Spectroscopy
CD spectroscopy measurements were performed with an AVIV Model 62A DS spectropolarimeter (Aviv Associates) at different temperatures lower than the one at which the proteins start to denature irreversibly. Changes in secondary structure at increasing urea concentrations (0–8 m) were followed by measuring the ellipticity at 225 nm in a 1-cm cuvette at a protein concentration of ∼0.7 μm (see Fig. 2). The reversibility of the urea-induced transitions was checked by diluting the protein solutions from the post-transition urea concentrations to the pretransition urea concentrations. By comparing the CD spectra measured for these diluted solutions with those obtained for the same solutions prepared directly from urea and buffer solutions, we estimated the extent of reversibility of the observed transitions to be higher than 80%.
FIGURE 2.

Urea induced denaturation profiles. a, ellipticity measured at 225 nm and 5 °C was recalculated to the same protein (CcdB-dimer, GyrA14-dimer, GyrA59-dimer, GyrA59-CcdB = heterotetramer) concentration (0.64 μm). The ellipticity characterizing the denatured state of GyrA59-CcdB is equal to the sum of the signals characterizing the denatured states of unbound GyrA59 and CcdB. The corresponding signal of the native GyrA59-CcdB complex is significantly lower than the GyrA59 + CcdB signal, which is in accordance with the proposed opening of GyrA59 tower and catalytic domains upon CcdB binding. The ellipticity of the GyrA14 dimer does not change with increasing urea concentration suggesting insignificant structural changes located in the GyrA dimerization domain. b, example of analysis of urea denaturation profiles (GyrA59-CcdB profile from a) to obtain normalized ellipticities (Equation 2) by using pre- and post-transitional base lines that define ellipticities of the native and denatured state over the whole range of urea concentrations, u. c, ellipticity as a function of urea concentration expressed as normalized ellipticity (Equation 2) measured for GyrA59 and CcdB at low concentrations (0.64 μm GyrA59 and 1.1 μm CcdB; presented as open symbols) and at ∼10 times higher concentrations (filled symbols). The lines represent the corresponding model unfolding curves calculated from the best fit parameter values presented in Table 1.
Isothermal Titration Calorimetry
Experiments were performed between 15 and 40 °C in a VP-ITC calorimeter from Microcal Inc. (Northampton, MA). Before each experiment the protein solutions were degassed for ∼20 min. A solution of GyrA12 or GyrA14 (c = ∼40 μm) was titrated into a solution of CcdB (c = ∼2 μm). The enthalpy of interaction (ΔHT) was obtained by integration of the raw signal, corrected for the corresponding heat of dilution, and expressed per mole of added GyrA12 or GyrA14 per injection (see Fig. 4, a and b). In addition we performed a competition titration of the GyrA59-CcdB complex (c = ∼2 μm) with GyrA14 (c = ∼80 μm) at 25 °C (see Fig. 4c).
FIGURE 4.

Binding events monitored by ITC. Enthalpies of CcdB binding to GyrA12 (a) and GyrA14 (b) GyrA fragments at various fragment/CcdB molar ratios (r) and temperatures (T) monitored by ITC. The lines represent the best global fits of the models (Equation 6; schematically presented as insets in panels a and b) from which the corresponding thermodynamic parameters were extracted (Table 1 and Fig. 6). c, competition ITC experiment: The GyrA59-CcdB complex was titrated with GyrA14 at T = 25 °C. The line represents the best fit of the displacement model (Equation 6) The obtained best fit thermodynamic parameters ΔG(T)o = 1 (± 1) kcal mol−1 and ΔH(T)o = 3 (± 2) kcal mol−1 corresponding to the GyrA59-CcdB + GyrA14 ↔ GyrA14-CcdB + GyrA59 process combined with those accompanying CcdB + GyrA14 ↔ GyrA14-CcdB association (Table 1) result in values of ΔG(T)o = −13 (±1) kcal mol−1 and ΔH(T)o = −10 (±2) kcal mol−1 for CcdB + GyrA59 ↔ CcdB:GyrA59 binding that are in accordance with the corresponding thermodynamic parameters estimated from urea denaturation experiments (Fig. 6). Because of very low heat effects accompanying the titration, we consider this experiment only as an additional support of the physical meaning of the thermodynamic binding parameters presented in Fig. 6.
Thermodynamic Analysis of Experimental Data
Global Model Analysis of Urea-induced Unfolding Curves Monitored by CD
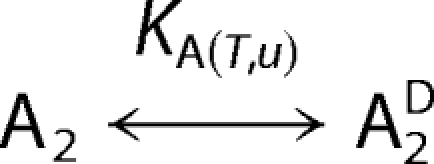
Urea denaturation of GyrA59, CcdB, and the GyrA59-CcdB complex can be successfully described in terms of a two-state or three-state model. The models can be defined as follows,
 |
 |
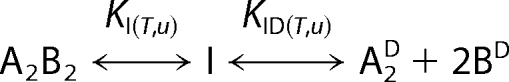 |
where A2, B2, and A2B2 represent GyrA59 dimer, CcdB dimer and GyrA59-CcdB heterotetramer in their native (N) sates, respectively, whereas superscript D denotes the proteins in their denatured (D) states. The transition to the intermediate state (I) accompanying the denaturation of A2B2 complex is assumed to be monomolecular. The apparent equilibrium constants in Models 1–3 are functions of temperature (T) and urea concentration (u) and can be defined as: KA(T,u) = [A2D]/[A2], KB(T,u) = [BD]2/[B2], KI(T,u) = [I]/[A2,B2], and KID(T,u) = [A2D][BD]2/[I]. The quantities in the square brackets represent the corresponding equilibrium molar concentrations that are dependent on T and u. According to the models the measured ellipticity (θ(T,u)) at a given wavelength, T and u can be expressed in terms of the corresponding contributions θN(T,u), θI(T,u), and θD(T,u) that characterize pure states N, I, and D as follows,
where αN(T,u), αI(T,u), and αD(T,u) represent fractions of proteins in states N, I, and D, respectively, at given T and u. In the case of A2 denaturation, the fractions are defined as αN(T,u) = αA2(T,u) = [A2]/[A2]t and αD(T,u) = αA2D(T,u) = [A2D]/[A2]t, in the case of B2 as αN(T,u) = αB2(T,u) = [B2]/[B2]t and αD(T,u) = αBD(T,u) = 1/2[BD]/[B2]t, and in the case of A2B2 denaturation αN(T,u) = αA2B2(T,u) = [A2B2]/[A2]t, whereas αD(T,u) and θD(T,u) are defined as αD(T,u) = αA2D(T,u) = αBD(T,u) and θD(T,u) = θA2D(T,u) + 2θBD(T,u), respectively ([A2]t and [B2]t represent total GyrA59 dimer and CcdB dimer concentrations that are in the case of A2B2 denaturation equal to the total concentration of the complex [A2B2]t). Because θN(T,u) and θD(T,u) can be estimated at any measured T as linear functions of u (pre- and post-transitional base lines; see Fig. 2b), one can, by taking into account that αN(T,u) + αI(T,u) + αD(T,u) = 1, express the measured ellipticity in the terms of a normalized signal (see Figs. 2C and 3) as follows,
 |
where (θ(T,u) − θN(T,u))/(θD(T,u) − θN(T,u)) is obtained directly from the experiment, whereas the expression FIαI(T,u) + αD(T,u) can be, as shown below, calculated from the model. For two-state denaturation of A2 and B2, the first term in Equation 2 is equal to zero (FIαI = 0). For A2B2 denaturation the quantity FI can be assumed to be temperature-independent and was set as a global model (adjustable) parameter. On the other hand, Δθ(T,u)/ΔθD(T,u) can be connected to the thermodynamics of unfolding through the proposed models (Models 1–3) according to which the linear dependence of the standard Gibbs free energy of unfolding (ΔGi(T,u)o) on u for the i-th transition (i = A, B, I, or ID) can be at any T expressed as follows,
where mi is an empirical parameter correlated strongly to the amount of protein (A2, B2, A2B2, or I) surface area-exposed to the solvent upon denaturation (23) and assumed to be temperature-independent. ΔGi(T)o is the standard Gibbs free energy of unfolding in the absence of urea (u = 0) that may be expressed in terms of the corresponding standard Gibbs free energy (ΔGi(To)o) and standard enthalpy of unfolding (ΔHi(To)o) at a reference temperature To = 25 °C and standard heat capacity of unfolding (ΔCP,io) (assumed to be temperature-independent) through the Gibbs-Helmholtz relation (integrated form).
 |
It follows from Equations 3 and 4 that the model (adjustable) parameters ΔGi(To)o, ΔHi(To)o, ΔCP,io, and mi define ΔGi(T,u)o and thus the corresponding Ki(T,u) (Ki(T,u) = exp(−ΔGi(T,u)o/RT)). Consequently, they specify the populations of species in solution (Ki(T,u) = f(αj(T,u); j = N, I, or D), Σjαj(T,u) = 1 ⇒ αj(T,u)) and the model function (Equation 2) at any u and T (see Fig. 3). The best global fit values of ΔGi(To)o, ΔHi(To)o, and ΔCP,io (Table 1) obtained using the nonlinear Levenberg-Marquardt regression procedure (24) were used to estimate ΔGi(T)o (from Equation 4), ΔHi(T)o from the Kirchhoff's law (integrated form),
and the corresponding entropy contribution, TΔSi(T)o, from the general relation ΔGi(T)o = ΔHi(T)o − TΔSi(T)o.
FIGURE 3.

Modeling urea-induced denaturation profiles. Ellipticity measured as a function of urea concentration expressed as normalized ellipticity (Equation 2) for GyrA59 (a) and CcdB (b) and GyrA59-CcdB complex (c). The lines represent the best global fits of the denaturation models (Equation 2; see the insets) to the experimental data. The corresponding populations of species calculated from the best fit parameters (Table 1) at 5 °C are presented in d.
TABLE 1.
Thermodynamic parameters of binding and unfolding
Thermodynamic parameters determined at To = 25 °C were obtained from global fitting of the model functions to the ITC binding data (Equation 6 and Fig. 4) and urea denaturation data (Equation 2 and Fig. 3).
| Process (i) | Parameter |
|||
|---|---|---|---|---|
| ΔGi(To)o | ΔHi(To)o | ΔCP,io | mi | |
| kcal mol−1 | kcal mol−1 | kcal mol−1K−1 | kcal mol−1m−1 | |
| CcdB binding | ||||
| GyrA12a | −11.2 (±0.2) | −8.0 (±0.2) | −0.41 (±0.05) | |
| GyrA14a | −11.8 (±0.3) | −7.3 (±0.3) | −0.42 (±0.05) | |
| GyrA59b | −14.5 (±1.5) | −11.0 (±4.4) | −0.54 (±0.60) | −1.0 (±0.3) |
| Urea unfoldingc | ||||
| GyrA59-CcdB | ||||
| Step I | 7.6 (±0.7) | 16.1 (±2.2) | 1.1 (±0.3) | 2.1 (±0.2) |
| Step IDd | 32.8 (±1.0)d | 35.2 (±2.6)d | 3.2 (±0.4)d | 3.2 (±0.1) |
| GyrA59 | 4.9 (±0.3) | 12.4 (±0.9) | 1.0 (±0.1) | 1.3 (±0.1) |
| CcdB | 21.0 (±0.9) | 27.9 (±2.6) | 2.7 (±0.4) | 2.9 (±0.2) |
a Model analysis of ITC binding data: ± values represent parameter errors estimated as 2× standard deviations obtained as square roots of diagonal elements of variance-covariance matrixes.
b Values of thermodynamic parameters obtained from model analysis of urea unfolding curves using the corresponding thermodynamic cycle.
c Average thermodynamic parameters obtained from fitting the model functions to two independent experimental datasets (Figs. 3 and Fig. 1-SM, supplemental materials). ± values represent parameter errors estimated as a square root of the sum of the corresponding variances.
d Values calculated from parameters describing CcdB binding to GyrA14 and CcdB unfolding.
Global Model Analysis of ITC Binding Curves
Fitting of the model function (describing 1:1 GyrA12+CcdB and GyrA14+CcdB associations) to the sets of ITC curves measured at various temperatures (see Fig. 4, a and b) was performed as described below. The model function at a given temperature T can be defined as (25) follows,
where ΔHi(T)o is the standard enthalpy of formation of the complex i (GyrA12-CcdB or GyrA14-CcdB), ni is the amount of the complex, and n2 is the total amount of the added ligand. The derivative in Equation 6 can be expressed as (26, 27) (δni/δn2)P,T,n1 = 0.5(1 + [1 − r − c]/[r2 − 2r(1 − c) + (1 + c)2]0.5 where c = 1/(Ki(T)[B2]t), Ki(T) is the apparent binding constant defined as Ki(T) = [A2B2]/([A2][B2]), where A2 is the GyrA12 or GyrA14 dimer, B2 is the CcdB dimer, r is the GyrA/CcdB molar ratio, and [B2]t is the total CcdB dimer concentration in the measuring cell. The corresponding standard Gibbs free energy ΔGi(To)o and standard enthalpy ΔHi(To)o at To = 25 °C and standard heat capacity of binding ΔCP,io (assumed to be temperature-independent) define ΔGi(T)o and ΔHi(T)o at any T by Equations 4 and 5. Thus, the values of adjustable parameters ΔGi(To)o, ΔHi(To)o, and ΔCP,io completely define the temperature dependence of the binding constant [Ki(T) = exp(−ΔGi(T)o/RT)], the model function (Equation 6) at any T and consequently the corresponding thermodynamic profiles (see Fig. 6). The best fit values of the adjustable parameters (Table 1) were obtained using the nonlinear Levenberg-Marquardt regression procedure (24). The competition titration of the GyrA59-CcdB complex with GyrA14 (see Fig. 4c) can be interpreted in terms of a displacement reaction: GyrA59-CcdB + GyrA14 ↔ GyrA14-CcdB + GyrA59. The general form of the model function for its description is the same as for 1:1 binding (Equation 6), where i represents the formed GyrA14-CcdB complex. In contrast to 1:1 model the derivative in Equation 6 for the displacement model can be expressed as [(Ki(T)/(2Ki(T) − 2)][1 − (Ki(T)(r − 1) + 2)/(Ki(T)2(r − 1)2 + 4Ki(T)r)0.5], where Ki(T) is the corresponding apparent displacement constant, and r is the GyrA14/CcdB molar ratio. The best fit values of the displacement parameters Ki(T) and ΔHi(T)o at T = 25 °C were obtained using the nonlinear Levenberg-Marquardt regression procedure (24).
FIGURE 6.

Thermodynamic profiles at 25 °C accompanying CcdB-GyrA binding and unfolding processes. a, the standard thermodynamic quantities ΔG(T)o (open column), ΔH(T)o (filled column), TΔS(T)o (hatched column). Dissection of energetic (Equations 7–9). b, contributions to ΔH(T)o caused by the changed interactions of polar (P) and nonpolar surfaces (N). c, TΔS(T)o contributions caused by the differences in solvation (solv) of the final (bound, unfolded) and initial states (unbound, folded) and other contributions caused by the changes of conformational, translational, and rotational freedom (other). In the case of unfolding the estimated contributions are divided by a factor of four for clarity.
Dissection of Thermodynamic Parameters of Protein Unfolding and Binding
Numerous recent studies of protein unfolding and protein-protein binding processes have shown that the corresponding enthalpy (ΔHi(T)o) and heat capacity (ΔCP,io) changes can be parameterized in terms of changes in solvent-accessible polar (ΔAP) and nonpolar (ΔAN) surface areas accompanying these processes (23, 28–31). Such a parameterization is based on the estimation of the nonpolar (AN) and polar (AP) solvent-accessible areas of proteins in the initial (folded, unbound) and final (unfolded, bound) states. They were calculated with the program NACCESS version 2.1 using the probe size of 1.4 Å (32). AN and AP of native (folded) GyrA59 (closed conformation) and CcdB dimers were obtained from the known crystal structures (10, 33), whereas the AN and AP values of the completely unfolded GyrA59 dimer and CcdB monomers were estimated as the sum of the accessibilities of the protein residues located in the Ala-X-Ala tripeptides (28, 29). AN and AP of the GyrA14-CcdB complex were obtained from the crystal structure, whereas the corresponding values for the GyrA12-CcdB and GyrA59 (open conformation): CcdB complexes were estimated from structural models (7). If not stated otherwise, the atomic coordinates of unbound proteins were extracted from the structures of corresponding complexes by deleting the coordinates of either of the two binding partners. The heat capacity (ΔCP,io) and enthalpy changes (ΔHi(T)o = ΔHi(TH)o + ΔCP,io (T − TH)) accompanying unfolding or binding can be expressed as the sum of nonpolar (subscript N) and polar (subscript P) contributions (28–31).
 |
Parameters a = 0.45 calmol−1 K−1 Å−2, b = −0.26 calmol−1 K−1 Å−2, c = −8.44 calmol−1Å−2, and d = 31.4 calmol−1Å−2 are obtained from Murphy and Freire (28) and Xie and Freire (34), whereas ΔHi(TH)o is parameterized as ΔHi(TH)o = cΔAN + dΔAP (34) and represents the enthalpy of unfolding observed with most global proteins at their median transition temperature of TH = 60 °C. As shown recently (35–37), the thermodynamics of a protein unfolding and some association processes can be correlated with its structural features through ΔAN and ΔAP values calculated from Equations 7 and 8 using the experimentally obtained values for ΔCP,io and ΔHi(T)o. This enables the dissection of ΔCP,io and ΔHi(T)o into contributions caused by interactions of nonpolar (ΔCP,i,No, ΔHi(T),No) and polar (ΔCP,i,Po, ΔHi(T),Po) surfaces.
The entropy change (ΔSi(T)o) accompanying unfolding or binding processes can be expressed as (28–31, 34, 38) follows.
The solvation contribution (ΔSi(T),solvo) that describes the changes in exposure of polar and nonpolar groups to the solvent upon unfolding or binding of the proteins may be estimated as ΔSi(T),solvo = ΔCP,io ln(T/TS) (28, 39), where TS ≈ 112 °C is the reference temperature at which ΔSi(T),solvo is assumed to be equal to zero. The second term (ΔSi(T),othero) was estimated by subtracting the calculated ΔSi(T),solvo = ΔCP,io ln(T/TS) from the corresponding measured ΔSi(T)o (Equation 9; see Fig. 6). It can be considered as the sum of changes in configurational, translational, rotational, and side chain conformational entropy contributions that accompany unfolding or binding processes (38, 40).
RESULTS
Urea Induced Unfolding Monitored by CD
Because the thermal denaturation of GyrA59, CcdB, and GyrA59-CcdB is irreversible, we attempted to investigate the thermodynamics of protein unfolding transitions via the reversible urea denaturation (Fig. 2). The normalized circular dichroism signal (Equation 2) measured as a function of urea concentration (u) at various temperatures (T) can be successfully described in terms of two-state (GyrA59 and CcdB) or three-state (GyrA59-CcdB) models (Fig. 3). To begin with, the appropriateness of the suggested models characterizing CcdB, GyrA59, and GyrA59-CcdB denaturation (Models 1–3) needs some qualitative support. In the case of CcdB, it was well established that its denaturation is accompanied by dissociation of the dimer (41, 42). Because this finding was further confirmed by the observed concentration dependence of urea unfolding curves (Fig. 2c), we considered the B2 ↔ 2BD model (Models 1–3) as an appropriate model for description of CcdB denaturation. By contrast, the transition curves accompanying GyrA59 unfolding (Fig. 2c; see also supplemental Fig. 1-SM) are concentration-independent, thus indicating that the transition is monomolecular (A2 ↔ A2D). Because the measured ellipticity of GyrA14 dimer (Fig. 1) is independent on u (Fig. 2a), we assumed that the GyrA59 transition observed at relatively low u (2–4 m) results only from opening and (partial) unfolding of the tower and/or catalytic domains and not from a complete unfolding to the random coil state. Because the structure of the dimerization domain of GyrA59 (Fig. 1; CcdB-binding site) is obviously not altered significantly even at high u (Fig. 2a), it follows that the first GyrA59-CcdB denaturation step observed in a similar u interval (2–4 m) may be ascribed to conformational changes in GyrA59, whereas the second step observed at higher u values corresponds to the release of the CcdB dimer from the open GyrA59-CcdB intermediate and its further dissociation into CcdB monomers.
To rigorously test the appropriateness of the proposed denaturation models, we performed their global fitting to the sets of unfolding curves measured at different temperatures (Fig. 3; see supplemental Fig. 1-SM). We performed two sets of temperature-dependent denaturation experiments for CcdB, GyrA59, and GyrA59-CcdB. They were all reasonably well described by the proposed models. For CcdB, GyrA59, and the first step (Models 1–3, I step) of GyrA59-CcdB denaturation, the differences between the best fit parameters obtained from fitting the models to the two independent datasets were within errors estimated from the corresponding variance-covarinace matrixes, meaning that they can be considered as reliable thermodynamic descriptors of these processes. By contrast, the obtained thermodynamic parameters describing the second step (Models 1–3, ID step) of GyrA59-CcdB denaturation (ΔGID(T)o, ΔHID(T)o, and ΔCP,IDo) were highly unreliable because their significantly different values resulted in equally good global fits. Therefore, the parameters ΔGID(T)o, ΔHID(T)o, and ΔCP,IDo were calculated independently and then used in the fitting procedure as fixed values. Their independent determination was based on the assumption that the ID step in the suggested model (Models 1–3) reflects mainly the release of CcdB dimer from the dimerization domain of GyrA59 followed by its further dissociation into denatured CcdB monomers. Because CcdB-GyrA14 binding can be considered as a process opposite to the release of CcdB dimer from the dimerization domain, we obtained the corresponding thermodynamic parameters as CcdB-GyrA14 binding parameters (Table 1) with the opposite sign. Because the parameters accompanying CcdB denaturation were obtained from analysis of unfolding curves of CcdB alone (Table 1) we calculated ΔGID(T)o, ΔHID(T)o, and ΔCP,IDo as the sums of contributions of the two processes mentioned above.
The average best fit thermodynamic parameters (Table 1) obtained by global model analysis of the urea unfolding data enable calculation of fractions of protein molecules that populate the predicted thermodynamic states (Models 1–3). It can be seen in Fig. 3d that the denatured states of unbound GyrA59 and CcdB are significantly populated at u > 3 and > 4 m, respectively, whereas the fractions of denatured GyrA59 and CcdB resulting from dissociation of the GyrA59-CcdB complex are significant at higher u, indicating a substantial conformational stabilization of the two binding partners upon their association.
Binding of CcdB to GyrA Fragments Monitored by ITC
The calorimetric binding isotherms accompanying association of CcdB to GyrA12 and GyrA14 exhibit the characteristics of a 1:1 association process (Fig. 4, a and b). This observation is confirmed by the global model analysis of ITC data (Equation 6) showing very good agreement of 1:1 binding model with the family of the ITC curves measured at various T (Fig. 4, a and b). To test whether protonation or deprotonation of the proteins is coupled to their binding, we performed the same ITC experiments also in Tris buffer (0.02 m Tris, 0.15 m NaCl, 0.001 m EDTA, pH 7.5, T = 25 °C), which has approximately 10 times higher ionization enthalpy than the phosphate buffer (43). Because the titration curves observed in Tris are the same as those observed in phosphate, we concluded that no protonation or deprotonation is involved in association of CcdB with GyrA12 and GyrA14.
DISCUSSION
Energetics of Unfolding in Correlation with Structural Features
The thermodynamic parameters presented in Table 1 were used to estimate the corresponding thermodynamic profiles of unfolding of GyrA59, CcdB, and GyrA59-CcdB (Figs. 5 and 6). The observation that folding of all studied proteins in the standard state at physiological temperatures is an enthalpy-driven process accompanied by an unfavorable entropy contribution and negative heat capacity change is a general feature of globular proteins (28, 29). Thermodynamic stabilities (ΔGi(T)o) exhibit well defined maxima between T values of ∼20 and 25 °C (Fig. 5a).
FIGURE 5.

Thermodynamic profiles of GyrA59, CcdB, and GyrA59-CcdB unfolding. Standard Gibbs free energy, ΔG(T)o (a), standard enthalpy, ΔH(T)o (b), and the corresponding entropy contribution, TΔS(T)o (c) in the absence of urea (u = 0) as functions of temperature, T, were estimated from the best fit parameters (Table 1) by using Equations 4 and 5 and the general relation ΔG(T)o = ΔH(T)o − TΔS(T)o. The differences, [ΔF(T)o(GyrA59) + ΔF(T)o(CcdB)] − ΔF(T)o(GyrA59-CcdB), where F = G, H, TS, represent the corresponding thermodynamic parameters of GyrA59-CcdB binding.
Besides the general thermodynamic description we present here the dissection of the measured thermodynamic quantities of unfolding of GyrA59, CcdB, and GyrA59-CcdB at 25 °C to various contributions based on Equations 7–9 (Fig. 6). For each protein parsing of the measured enthalpy of unfolding indicates that the contributions caused by the interactions involving polar surfaces that favor protein folding overcompensates the corresponding contributions of nonpolar surfaces that on average favor protein unfolding. Furthermore, parsing of entropic contributions indicates that the contribution caused by the changes of configurational, translational and rotational freedom (TΔSi(T),othero) that favors protein unfolding slightly prevails over the solvation contribution (TΔSi(T),solvo), which favors protein folding.
As shown recently (35, 36), the correlation of the experimentally determined thermodynamics of protein unfolding with its structural features can be carried out using an approach in which the average number of amino acid residues participating in the unfolding process  N
N is estimated from the combination of experimental thermodynamic data and parametrized Equations 7–9. The value of N can be obtained as N = NSTΔAt/ΔAST, where ΔAt refers to the total change in the solvent-accessible surface area calculated from Equations 7 and 8 as ΔAN + ΔAP, ΔAST (ST = structure) to the corresponding change in accessible area calculated for the complete unfolding of the protein from its structural data, and NST is the total number of residues contained in the protein. For GyrA59 unfolding the obtained N of ∼50 is only ∼5% of its NST, indicating that the GyrA59 urea-denatured state is far from being completely unfolded, thus suggesting that the observed thermodynamics of unfolding probably results only from opening and partial unfolding of the tower and/or catalytic domains. This conclusion is confirmed by estimation of N from ΔSi(T),othero (Equation 9) that gives a N value of ∼60. Namely, in the case of monomolecular unfolding of GyrA59 ΔSi(T),othero may be attributed to the configurational entropy change (ΔSi(T),confo) that can be estimated as ΔSi(T),confo = N·Δsconfo, where Δsconfo = 4.3 cal K−1 (mol residue)−1 is the average overall residual configuration entropy change obtained from the thermodynamic data base for unfolding of monomeric proteins (28). For CcdB unfolding the above approaches give a N value of ∼140 or 150, respectively, which is ∼70% of NST. This indicates that also for CcdB its urea-denatured state cannot be considered as the fully unfolded state. It should be noted that in the case of CcdB the estimate of N of ∼150 from ΔSi(T),othero (Equation 9) takes into account that the dimer unfolding is accompanied by monomerization. Therefore, the corresponding ΔSi(T),othero was considered as the sum of changes in configurational (ΔSi(T),confo), translational and rotational (ΔSi(T),r+to) and side chain conformational (ΔSi(T),sco) entropies (38, 40). ΔSi(T),r+to was estimated as an entropy change accompanying (rigid body) dissociation of the dimer (ΔSi(T),r+to = 50 cal K−1mol−1) (30), whereas the corresponding ΔSi(T),sco was estimated using an approach of Baker and Murphy (40) that gives ΔSi(T),sco = 10 cal K−1mol−1. Reasonable agreement between the N values determined from two different relations for both GyrA59 and CcdB suggests that the presented enthalpy and entropy contributions may have a real physical meaning. We are well aware that these contributions determined from the described combination of experimental thermodynamics and structure-based parameterization can be considered only as reasonably good approximations because they comprise errors of the empirical parameterization and those of the measured thermodynamic quantities. Nevertheless, we believe that using this approach one can explain, at least in a semi-quantitative way, the correlation between the thermodynamics of urea-induced unfolding of GyrA59 and CcdB and the structural features of their folded and unfolded states.
As shown in Fig. 6, the thermodynamic profile of the first GyrA59-CcdB unfolding step together with the dissection of its ΔHi(T)o and TΔSi(T)o contributions is very similar to those observed with the pure GyrA59, whereas the corresponding thermodynamic characteristics of the second step seem to be very similar to those observed with unfolding of the pure CcdB. This observation is in accordance with the proposed unfolding models. Namely, the first GyrA59-CcdB unfolding step that corresponds to conformational changes of GyrA59 is accompanied by slightly higher ΔGi(To)o and ΔHi(To)o values than in the case of pure GyrA59, indicating that CcdB binding stabilizes GyrA59 tower and/or catalytic domains in the open conformation by additional noncovalent interactions. Similarly, the second step that corresponds to the release of the CcdB dimer from the open and partially unfolded GyrA59-CcdB intermediate and its further dissociation into CcdB monomers is accompanied by slightly higher ΔGi(To)o and ΔHi(To)o values than those observed for unfolding of pure CcdB, indicating that the specific interactions of CcdB with the dimerization domain of GyrA59 stabilize the dimeric conformation of CcdB.
Driving Forces of Gyrase Recognition by CcdB
The thermodynamic parameters of binding of CcdB to the GyrA12 and GyrA14 (Table 1) obtained by model analysis of ITC data show that the formation of both complexes is an enthalpy-driven process accompanied by a small favorable entropy contribution (Fig. 6). The significantly negative heat capacities of binding suggest that the hydrophobic effect plays an important role in these binding events. The thermodynamic profiles of CcdB binding to GyrA12 and GyrA14 are nearly the same, indicating that the (connecting) helices (Fig. 1) located on GyrA14 and GyrA59, but not on GyrA12, do not play an important role in CcdB binding to gyrase. The dissection of thermodynamic parameters (Fig. 6) suggests that formation of the GyrA12-CcdB and GyrA14-CcdB complexes is driven mainly by interactions of the polar surfaces of each protein and by the reduced hydrophobic solvation of the complex state. Indeed, according to recent structural (7) and mutagenesis (5) studies, the interactions involving Arg462 of GyrA appear to be central in the structure of the GyrA14-CcdB complex. The entropy contributions, other than that caused by changes in solvation (TΔSi(T),othero; Equation 9) are highly unfavorable, mainly because of the loss of translational and rotational freedom upon (rigid body) association (TΔSi(T),r+to ≈−298·K 5·10−2 kcal K−1 mol−1 ≈−15 kcal mol−1) (30) accompanied by the loss of conformational freedom of a side chain (the interacting surface consists almost entirely of the side chain atoms (7); TΔSi(T),sco ≈−5 kcal mol−1 (40)).
In contrast to the association of CcdB with GyrA12 and with GyrA14, binding of CcdB to GyrA59 is a kinetically limited process and thus cannot be studied in a real time experiment. Therefore, the thermodynamics of the GyrA59-CcdB complex formation was investigated via the urea unfolding of GyrA59-CcdB, GyrA59, and CcdB (Figs. 2 and 3). The thermodynamic parameters of the GyrA59-CcdB formation (Table 1 and Fig. 6) were obtained from the parameters describing unfolding of GyrA59-CcdB, GyrA59 and CcdB using the thermodynamic cycle in which the thermodynamic functions characterizing the GyrA59-CcdB denatured state were assumed to be equal to the sum of the corresponding functions characterizing the denatured states of free GyrA59 and CcdB (Fig. 2a). The physical meaning of the GyrA59-CcdB binding parameters is supported by the ITC experiment monitoring the displacement of CcdB from the GyrA59-CcdB complex by GyrA14 (Fig. 4c). The obtained thermodynamic parameters of displacement in combination with the known GyrA14-CcdB binding characteristics (Table 1), result in thermodynamic parameters (Fig. 4c) that are in accordance with those presented in Table 1 and Fig. 6. We believe that these results show that our approach gives reasonable estimates of GyrA59-CcdB binding parameters.
The thermodynamic binding profiles (Fig. 6) reveal that the binding of CcdB to GyrA59 (K ∼ 5·1010 m−1) is approximately two orders of magnitude stronger and more enthalpy-driven than its association with GyrA12 or GyrA14 (7, 44). This suggests that the tower and/or catalytic domains in the open conformation stabilize the GyrA59-CcdB complex through specific interactions that are predicted by our structural model of the GyrA59-CcdB complex (Fig. 1) and partially confirmed by the site-specific mutagenesis studies on CcdB (5). Similarly to the GyrA12-CcdB and GyrA14-CcdB associations, the dissection of thermodynamic parameters accompanying GyrA59-CcdB binding (Fig. 6) suggests that it is driven mainly by interactions of the polar surfaces of each protein and by the reduced hydrophobic solvation of the complex state. The dissection further suggests that the higher strength of GyrA59-CcdB interactions in comparison to those within GyrA14-CcdB comes mainly from additional interactions between polar surfaces of the tower and/or catalytic domains and CcdB. Moreover, the solvation entropy contribution seem to be slightly more favorable than in the case of GyrA14-CcdB. All these findings are in accordance with our structural model of GyrA59-CcdB complex formation (Fig. 1), which predicts burial of additional polar (ΔΔAP = ∼−450 Å2) and nonpolar (ΔΔAN = ∼−200 Å2) solvent-accessible surface areas upon binding of CcdB to the tower and catalytic domains.
Taken together, our results show that gyrase poisoning by CcdB is an enthalpy-driven process, mainly because of specific interactions of CcdB with the GyrA dimerization domain, accompanied by opening of the tower and/or catalytic domains. Furthermore, one can expect that the displacement of CcdB from the gyrase-CcdB complex is accompanied by closing of these domains (cell rejuvenation). In other words, such extensive structural rearrangements appear to be crucial driving forces for the functioning of the ccd toxin-antitoxin module.
Supplementary Material
Acknowledgments
We thank Prof. R. H. Pain for critical reading of the manuscript and Dr. L. Buts for performing some size exclusion chromatography measurements.
This work was supported by the Ministry of Higher Education, Science and Technology, by Republic of Slovenia Agency for Research Grants P1-0201 and J1-6653, and by Fonds Wetenschappelijk Onderzoek-Vlaanderen, Instituut voor de Aanmoediging van Innovatie door Wetenschap en Technologie in Vlaanderen (IWT), and the Onzerzoeksraad of the Vrije Universiteit Brussel in Belgium.

The on-line version of this article (available at http://www.jbc.org) contains supplemental Fig. 1-SM.
- ITC
- isothermal titration calorimetry.
REFERENCES
- 1.Nöllmann M., Crisona N. J., Arimondo P. B. (2007) Biochimie. 89, 490–499 [DOI] [PubMed] [Google Scholar]
- 2.Schoeffler A. J., Berger J. M. (2005) Biochem. Soc. Trans. 33, 1465–1470 [DOI] [PubMed] [Google Scholar]
- 3.Reece R. J., Maxwell A. (1991) Crit. Rev. Biochem. Mol. Biol. 26, 335–375 [DOI] [PubMed] [Google Scholar]
- 4.Maxwell A. (1997) Trends Microbiol. 5, 102–109 [DOI] [PubMed] [Google Scholar]
- 5.Bernard P., Couturier M. (1992) J. Mol. Biol. 226, 735–745 [DOI] [PubMed] [Google Scholar]
- 6.Miki T., Park J. A., Nagao K., Murayama N., Horiuchi T. (1992) J. Mol. Biol. 225, 39–52 [DOI] [PubMed] [Google Scholar]
- 7.Dao-Thi M. H., Van Melderen L., De Genst E., Afif H., Buts L., Wyns L., Loris R. (2005) J. Mol. Biol. 348, 1091–1102 [DOI] [PubMed] [Google Scholar]
- 8.Buts L., Lah J., Dao-Thi M. H., Wyns L., Loris R. (2005) Trends Biochem. Sci. 30, 672–679 [DOI] [PubMed] [Google Scholar]
- 9.Reece R. J., Maxwell A. (1989) J. Biol. Chem. 264, 19648–19653 [PubMed] [Google Scholar]
- 10.Morais Cabral J. H., Jackson A. P., Smith C. V., Shikotra N., Maxwell A., Liddington R. C. (1997) Nature 388, 903–906 [DOI] [PubMed] [Google Scholar]
- 11.Bahassi E. M., O'Dea M. H., Allali N., Messens J., Gellert M., Couturier M. (1999) J. Biol. Chem. 274, 10936–10944 [DOI] [PubMed] [Google Scholar]
- 12.Ladbury J. E., Chowdhry B. Z. (1998) Biocalorimetry: Applications of Calorimetry in the Biological Sciences, John Wiley, Chichester, UK [Google Scholar]
- 13.Lopez M. M., Makhatadze G. I. (2002) Methods Mol. Biol. 173, 121–126 [DOI] [PubMed] [Google Scholar]
- 14.Chaires J. B. (1997) Biopolymers 44, 201–215 [DOI] [PubMed] [Google Scholar]
- 15.Loris R., Marianovsky I., Lah J., Laeremans T., Engelberg-Kulka H., Glaser G., Muyldermans S., Wyns L. (2003) J. Biol. Chem. 278, 28252–28257 [DOI] [PubMed] [Google Scholar]
- 16.Lah J., Marianovsky I., Glaser G., Engelberg-Kulka H., Kinne J., Wyns L., Loris R. (2003) J. Biol. Chem. 278, 14101–14111 [DOI] [PubMed] [Google Scholar]
- 17.Lah J., Vesnaver G. (2004) J. Mol. Biol. 342, 73–89 [DOI] [PubMed] [Google Scholar]
- 18.Dao-Thi M. H., Charlier D., Loris R., Maes D., Messens J., Wyns L., Backmann J. (2002) J. Biol. Chem. 277, 3733–3742 [DOI] [PubMed] [Google Scholar]
- 19.Buts L., De Jonge N., Loris R., Wyns L., Dao-Thi M. H. (2005) Acta Crystallogr. Sect. F. Struct. Biol. Cryst. Commun. 61, 949–952 [DOI] [PMC free article] [PubMed] [Google Scholar]
- 20.Dao-Thi M. H., Van Melderen L., De Genst E., Buts L., Ranquin A., Wyns L., Loris R. (2004) Acta Crystallogr. Biol. Crystallogr. 60, 1132–1134 [DOI] [PubMed] [Google Scholar]
- 21.Reece R. J., Maxwell A. (1991) J. Biol. Chem. 266, 3540–3546 [PubMed] [Google Scholar]
- 22.Gill S. C., von Hippel P. H. (1989) Anal. Biochem. 182, 319–326 [DOI] [PubMed] [Google Scholar]
- 23.Myers J. K., Pace C. N., Scholtz M. J. (1995) Protein Sci. 4, 2138–2148 [DOI] [PMC free article] [PubMed] [Google Scholar]
- 24.Press W. H., Flannery B. P., Teukolsky S. A., Vetterling W. T. (1992) Numerical Recipes, pp. 650–694, Cambridge University Press, Oxford, UK [Google Scholar]
- 25.Lah J., Drobnak I., Dolinar M., Vesnaver G. (2008) Nucleic Acids Res. 36, 897–904 [DOI] [PMC free article] [PubMed] [Google Scholar]
- 26.Wiseman T., Williston S., Brandts J. F., Lin L. N. (1989) Anal. Biochem. 179, 131–137 [DOI] [PubMed] [Google Scholar]
- 27.Lah N., Lah J., Zegers I., Wyns L., Messens J. (2003) J. Biol. Chem. 278, 24673–24679 [DOI] [PubMed] [Google Scholar]
- 28.Murphy K. P., Freire E. (1992) Adv. Protein Chem. 43, 313–361 [DOI] [PubMed] [Google Scholar]
- 29.Makhatadze G. I., Privalov P. L. (1995) Adv. Protein Chem. 47, 307–425 [DOI] [PubMed] [Google Scholar]
- 30.Spolar R. S., Record M. T., Jr. (1994) Science 263, 777–784 [DOI] [PubMed] [Google Scholar]
- 31.Robertson A. D., Murphy K. P. (1997) Chem. Rev. 97, 1251–1268 [DOI] [PubMed] [Google Scholar]
- 32.Hubbard S. J., Thornton J. M. (1993) NACCESS, University College, London [Google Scholar]
- 33.Loris R., Dao-Thi M. H., Bahassi E. M., Van Melderen L., Poortmans F., Liddington R., Couturier M., Wyns L. (1999) J. Mol. Biol. 285, 1667–1677 [DOI] [PubMed] [Google Scholar]
- 34.Xie D., Freire E. (1994) Proteins Struct. Funct. Genet. 19, 291–301 [DOI] [PubMed] [Google Scholar]
- 35.Lah J., Simic M., Vesnaver G., Marianovsky I., Glaser G., Engelberg-Kulka H., Loris R. (2005) J. Biol. Chem. 280, 17397–17407 [DOI] [PubMed] [Google Scholar]
- 36.Lah J., Prislan I., Krzan B., Salobir M., Francky A., Vesnaver G. (2005) Biochemistry 44, 13883–13892 [DOI] [PubMed] [Google Scholar]
- 37.Lah J., Bester-Rogac M., Perger T. M., Vesnaver G. (2006) J. Phys. Chem. B 110, 23279–26291 [DOI] [PubMed] [Google Scholar]
- 38.Lee K. H., Xie D., Freire E., Amzel L. M. (1994) Proteins Struct. Funct. Genet. 20, 68–84 [DOI] [PubMed] [Google Scholar]
- 39.Baldwin R. L. (1986) Proc. Natl. Acad. Sci. U.S.A. 83, 8069–8072 [DOI] [PMC free article] [PubMed] [Google Scholar]
- 40.Baker B. M., Murphy K. P. (1997) J. Mol. Biol. 268, 557–569 [DOI] [PubMed] [Google Scholar]
- 41.Dao-Thi M. H., Messens J., Wyns L., Backmann J. (2000) J. Mol. Biol. 299, 1373–1386 [DOI] [PubMed] [Google Scholar]
- 42.Bajaj K., Chakshusmathi G., Bachhawat-Sikder K., Surolia A., Varadarajan R. (2004) Biochem. J. 380, 409–417 [DOI] [PMC free article] [PubMed] [Google Scholar]
- 43.Bradshaw J. M., Waksman G. (1998) Biochemistry 37, 15400–15407 [DOI] [PubMed] [Google Scholar]
- 44.Kampranis S. C., Howells A. J., Maxwell A. (1999) J. Mol. Biol. 293, 733–744 [DOI] [PubMed] [Google Scholar]
Associated Data
This section collects any data citations, data availability statements, or supplementary materials included in this article.