Abstract
μ opioid receptor (MOR) agonists such as morphine are applied widely in clinical practice as pain therapy. The effects of morphine through MOR, such as analgesia and development of tolerance and dependence, are influenced by individual specificity. Recently, we analyzed single nucleotide polymorphisms on the human MOR gene to investigate the factors that contribute to individual specificity. In process of single nucleotide polymorphisms analysis, we found that specific nuclear proteins bound to G−172 → T region in exon 1 in MOR gene, and its affinity to DNA was increased by base substitution from G−172 to T−172. The isolated protein was identified by mass spectrometry and was confirmed by Western blotting to be poly(ADP-ribose) po ly mer ase-1 (PARP-1). The overexpressed PARP-1 bound to G−172 → T and enhanced the transcription of reporter vectors containing G−172 and T−172. Furthermore, PARP-1 inhibitor (benzamide) decreased PARP-1 binding to G−172 → T without affecting mRNA or protein expression level of PARP-1 and down-regulated the subsequent MOR gene expression in SH-SY5Y cells. Moreover, we found that tumor necrosis factor-α enhanced MOR gene expression as well as increased PARP-1 binding to the G−172 → T region and G−172 → T-dependent transcription in SH-SY5Y cells. These effects were also inhibited by benzamide. In this study, our data suggest that PARP-1 positively regulates MOR gene transcription via G−172 → T, which might influence individual specificity in therapeutic opioid effects.
Opioids have potent analgesic effects, which are mediated by binding of agonists such as opioid alkaloids or opioid peptides to their endogenous receptors. Pharmacological and clinical studies have shown that the μ opioid receptor (MOR)2 affords the greatest analgesic effect among all known opioid receptors. Studies with MOR knock-out mice clearly demonstrated that the MOR is the major target of analgesia (1). Thus, treatments via the MOR have become the center of strategy for palliative care, and the selective MOR agonist, morphine, became widely applied to clinical therapy. However, it is difficult to determine a proper dose of morphine because morphine efficacy is affected by individual specificity. Recently, individual specificity was considered to be related to single nucleotide polymorphisms (SNPs) present on the human MOR gene. MOR couples to G proteins and regulates adenylyl cyclase, intracellular calcium, inwardly rectifying potassium channels, mitogen-activated protein kinase, and other messengers, which further trigger a cascade of intracellular events (2).
The human MOR gene is found on chromosome 6q24-25 and is composed of a transcriptional regulatory region, four exons, and three introns (3), in which 47 kinds of SNPs are discovered (4). Some of the SNPs affect MOR receptor function by causing amino acid substitution or by altering gene transcription levels.
The most typical polymorphism, A118 → G, was located on exon 1 of the MOR gene and induced an amino acid substitution, Asn40 → Asp, in the extracellular domain of the MOR (5); this substitution increased the receptor binding affinity of β-endorphin and decreased the binding affinity of morphine-6-glucuronid (6, 7). The G779 → A, G794 → A, or T802 → C polymorphisms in MOR exon 3 caused amino acid substitutions Arg260 → H, Arg265 → His, or Ser268 → Pro, respectively, in the third intracellular loop of the MOR, which decreased the receptor signaling activity (8). Furthermore, the T802 → C polymorphism (Ser268 → Pro) resulted in a loss of Ca2+/calmodulin-dependent protein kinase-induced receptor desensitization (9).
Expression level of the MOR gene is controlled by various transcriptional factors, and the SNPs in the promoter region influence MOR expression and following responsiveness to its agonists. In immuno-effector cells, interleukin-4 up-regulated the MOR gene via STAT6 binding to −997 bp. The C−995 → A polymorphism is present in the DNA-binding site of STAT6, and the affinity of STAT6 to A−995 was lower than that to C−995. Tumor necrosis factor (TNF)-α up-regulated the MOR gene via NF-κB binding to −2174, −557, and −207 bp. The G−554 → A polymorphism is present on the DNA-binding site of NF-κB. The affinity of NF-κB to A−554 was lower than that to G−554. Therefore, either the C−995 → A or the G−554 → A polymorphism has the possibility of influencing the MOR gene expression that interleukin-4 or TNF-α causes through respective transcriptional factors (10, 11). CXBK mice, a cross-breed between C57BL/6By and BALB/cBy mice (12), are known as MOR knockdown mice. It was reported that the base substitution at C−202 → A detected in CXBK mice decreased the SP1 binding affinity to the MOR gene (13).
Poly(ADP-ribose) polymerase-1 (PARP-1) is a 116-kDa nuclear protein known to have DNA binding activity and enzymatic activity of ADP-ribosylation (14). PARP-1 catalyzes the reaction that adds the ADP-ribose unit of NAD+ to several nuclear proteins, including PARP-1 itself (15). Initial study of PARP-1 implicated many biological functions, including DNA repair, recombination, apoptosis, and tumor genesis (15, 16). However, recent studies demonstrated that PARP-1 also contributed to gene transcription in several ways. It was reported that PARP-1 could act as a transcription activator (17–19), but data from other studies showed that PARP-1 might repress transcription (14, 20, 21). Furthermore, PARP-1 modified histones to alter chromatin structure or bound to other DNA-binding factors as coactivators (22, 23).
Recently, we analyzed SNPs on the MOR gene in the Japanese population and found the novel linkage of SNPs (G−1748 → A and G−172 → T) (24). In these analyses, we found that specific nuclear proteins bound to the G−172 → T region, and its affinity was increased by base substitution of G−172 → T. In this study, we demonstrated that the identified PARP-1 bound to the G−172 → T region in the MOR gene, preferentially to T−172, and positively regulated MOR gene expression.
EXPERIMENTAL PROCEDURES
Cell Cultures and Reagents
The human neuroblastoma cell line SH-SY5Y and the human embryonic kidney cell line HEK293T were cultivated in Dulbecco's modified Eagle's medium (WAKO Pure Chemical Industries, Ltd., Osaka, Japan) supplemented with 10% fetal bovine serum (Invitrogen) and antibiotics (100 units/ml penicillin and 100 μg/ml streptomycin; Invitrogen).
Benzamide (BZD; WAKO Pure Chemical Industries, Ltd.) and sodium benzoate (BZA; WAKO Pure Chemical Industries, Ltd.) were dissolved in dimethyl sulfoxide (DMSO; WAKO Pure Chemical Industries, Ltd.). TNF-α was purchased from WAKO Pure Chemical Industries, Ltd. In all experiments, the same amount of DMSO was added to the control samples.
Nuclear Extract Preparation
Nuclear extracts were prepared from HEK293T or SH-SY5Y cells. All of the steps were performed at 4 °C. The cells were resuspended in lysis buffer (10 mm HEPES, 10 mm KCl, 0.1 mm EDTA, 0.1% Nonidet P-40, 1 mm dithiothreitol, 1 mm 4-(2-aminoethyl) benzenesulfonyl fluoride hydrochloride, 2 μg/ml aprotinin, 2 μg/ml pepstatin, 2 μg/ml leupeptin). The lysate was centrifuged at 500 × g for 3 min to pellet the nuclei, which were washed with lysis buffer. The nuclei were incubated in elution buffer (50 mm HEPES, 420 mm KCl, 0.1 mm EDTA, 5 mm MgCl2, 20% grycerol, 1 mm dithiothreitol, 1 mm 4-(2-aminoethyl) benzenesulfonyl fluoride hydrochloride, 2 μg/ml aprotinin, 2 μg/ml pepstatin, 2 μg/ml leupeptin) for 1 h. The samples were centrifuged at 14,000 × g for 15 min. The supernatant was used for nuclear extracts. Protein concentration of nuclear extracts was determined using the Coomassie protein assay reagent kit (Pierce).
Electrophoretic Mobility Shift Assays (EMSA)
All of the oligonucleotides were synthesized by Operon Biotechnologies Inc. (Tokyo, Japan). To obtain double-stranded DNA, equimolar amounts of consensus oligonucleotides were heated to 85 °C for 15 min with 20 mm Tris-HCl (pH 7.5), 10 mm MgCl2, and 50 mm NaCl. After heating, each sample was allowed to cool down to room temperature slowly.
Oligonucleotides used for EMSA were 5′ end-labeled with T4 kinase (Toyobo, Ltd., Osaka, Japan) and [γ-32P]ATP (PerkinElmer Life Sciences). After the reaction, labeled oligonucleotides were separated with MicroSpinTM G-25 Columns (GE Healthcare) and diluted to 100 μl. Oligonucleotide sequences are shown as follows: G−172 probe, 5′-AGAGGAGAATGTCAGATGCTCAGCTCGGTCCCCTCCGCCTGA-3′; and T−172 probe, 5′-AGAGGAGAATGTCAGATGCTCATCTCGGTCCCCTCCGCCTGA-3′. Nuclear extracts were preincubated for 15 min at room temperature in 10 μl of binding reaction mixture contained 1 μg of nuclear extracts and 2 μl of 5× gel shift binding buffer (Promega Co., San Luis, CA). Subsequently, 35 fmol of labeled probe was added, and incubation was continued for 30 min at room temperature. For competition assay, unlabeled probe was added to the binding reaction mixture before the addition of the labeled probe. For supershift assay, anti-PARP-1 antibody (sc-8007; Santa Cruz Biotechnology, Santa Cruz, CA) was dialyzed with 0.1× phosphate-buffered saline for 2 days. Subsequently, dialyzed antibody and buffer were concentrated on 8-fold by lypholization. Two microliters of anti-PARP-1 antibody, concentrated dialyzed buffer, or anti-SP1 antibody (sc-59X; Santa Cruz Biotechnology) was added to the binding reaction and incubated for 1 h at 4 °C before the addition of the labeled probe.
Samples were loaded on a 6% polyacrylamide gel in 0.5× TBE buffer. After running, the gel was dewatered, exposed to the imaging plate and analyzed with Typhoon9410 (GE Healthcare).
Affinity Purification of DNA-binding Protein
For blocking nonspecific protein binding, 10 μl of streptavidin-agarose beads (Merck) were preincubated in 2% bovine serum albumin and washed twice in the buffered solution (10 mm Tris-HCl, 0.5 mm EDTA, 1 mm MgCl2, 4% glycerol, 0.5 mm dithiothreitol, and 50 mm NaCl). Biotin-labeled oligonucleotides (90 pmol) were added to nuclear extracts of 100 μg and incubated for 30 min at room temperature. Next, streptavidin-agarose beads pretreated with bovine serum were added to the oligo-DNA-protein complex and incubated for 1 h at 4 °C. Bead-oligo-DNA-protein complexes were washed twice in the buffered solution and then collected by centrifugation at 1,400 × g for 5 min. The sample for SDS-PAGE was prepared by heating precipitated complex with 100 μl of Laemmli buffer (62.5 mm Tris-HCl, pH 6.5, 2% SDS, 10% glycerol, and 0.00125% bromphenol blue) containing 5% β-mercaptoethanol.
PARP-1 Expression Vector
The PARP-1 coding sequence was cloned from SH-SY5Y cells using PCR amplification; PCR was performed using KOD plus (Toyobo, Ltd.) and the following set of primers: forward, 5′-TATCTCGAGGATGGCGGAGTCTTCGG-3′; and reverse, 5′-TGCCTCGAGTACCTCTCCCAATTACCACAG-3′. Following sequencing, the fragments were digested with XhoI (Takara Bio Inc., Shiga, Japan) and inserted to expression vector digested with same enzyme. DNA fragments were purified using the Wizard PCR Preps DNA purification system (Promega Co.), and plasmid DNA was purified using the Genopure plasmid maxi kit (Roche Applied Science).
Western Blotting (WB)
Nuclear extracts containing 2 μg of protein were diluted to 100 μl with Laemmli buffer contained of 5% β-mercaptoethanol and heated for 5 min at 95 °C. The samples were loaded on 8% polyacrylamide gel and transferred to polyvinylidene fluoride membrane. The PARP-1 protein was detected by using mouse monoclonal antibody that recognizes the C terminus of PARP-1 (sc-8007), anti-mouse horseradish peroxidase secondary antibodies, and ECL reagent. SP1 protein for loading control was detected by using rabbit polyclonal antibody (sc-59), anti-rabbit horseradish peroxidase secondary antibodies, and ECL reagent.
RNA Interference against PARP-1
PARP-1 RNA interference was carried out by using shRNA expression vector. All of the shRNA expression vectors were based on the piGENETMtRNA Neo/KpnI/SacI (iGENE Therapeutics, Inc., Tokyo, Japan). Construction of shPARP-1 vectors were accomplished by inserting oligonucleotides directed against human PARP-1. Target area was decided according to the research of Kameoka et al. (25).
The oligonucleotide sequences were as follows: SH-1 (human PARP-1 2401–2421 bp), 5′-AAGCCTCGGCTCCTGAACAATCTTCCTGTCAATTGTTCAGGAGCGGAGGCTT-3′; and SH-2 (human PARP-1 2671–2691 bp), 5′-AAGATAGAGCGTGAAGGCGAACTTCCTGTCATTCGCCTTCACGCTCTATCTT-3′.
Each shRNA expression vector was transiently transfected into SH-SY5Y cells by using FuGENE 6 (Roche Applied Sciences). Seventy-two hours after transfection, total RNA was prepared and used for RT-PCR and real time RT-PCR analyses.
RT-PCR
Total RNA was prepared using TRIzol (Invitrogen), and reverse transcription was performed in a final volume of 20 μl using 1 μg of RNA, 1 μl of oligo(dT)15 primer (Promega), and 50 units of Rever Tra Ace (Toyobo, Ltd.). The reaction conditions were as follows: 70 °C for 10 min, 4 °C for 5 min, 42 °C for 60 min, and 99 °C for 5 min. PCR was carried out using an ABI PRISM 7000 system (Applied Biosystems, Carlsbad, CA). The reactions were performed in a final volume of 25 μl using 5 μl of diluted cDNA, 12.5 pmol of each primer, and 0.625 units of Taq polymerase (Qiagen). Amplification conditions were as follows: 94 °C for 30 s, 58 °C for 30 s, 72 °C for 1 min. Primer sequences used are as follows: MOR forward, 5′-CTGCCACCAACATCTACATTTTCAACC-3′, and reverse, 5′-GCCACCACCACCAGCACCATC-3′; glyceraldehyde-3-phosphate dehydrogenase forward, 5′-GAACATCATCCCTGCCTCTACT-3′, and reverse, 5′-CTTCCTCTTGTGCTCTTGCTG-3′; and dopamine D2 receptor (DRD2) forward, 5′-ATCCCACCCAGCCACCACCAG-3′, and reverse, 5′-CACGCCAAGCCCCACAAAGAG-3′.
Real Time RT-PCR
Real time RT-PCR was carried out using a My iQTM single-color real time PCR detection system (Bio-Rad). A total reaction volume of 50 μl was prepared containing 4 μl of template cDNA, 25 μl of iQ SYBR Green Supermix (Bio-Rad), and 250 nm each of the forward and reverse PCR primers. Amplification conditions were as follows: 95 °C for 15 s, 62 °C for 30 s, and 72 °C for 30 s. To amplify the MOR mRNA, a forward primer (5′-CTGGGTCAACTTGTCCCACT-3′) and reverse primer (5′-TGGAGTAGAGGGCCATGATC-3′) were used for amplification of a 146-bp fragment. As an internal control, a 169-bp fragment of the L19 ribosomal protein gene was amplified with a forward primer (5′-CTAGTGTCCTCCGCTGTGG-3′) and reverse primer (5′-AAGGTGTTTTTCCGGCATC-3′). These primers sequences and the calculation method of relative MOR mRNA level were referred to Bedini's report (26). A nontemplate control was included in each experiment. Melting curve analysis and agarose electrophoresis were carried out to validate the specificity of the amplification products.
Reporter Gene Plasmids
All of the reporter plasmids were based on the pGL3 basic vector (Promega Co.). Construction of pGL3 TK G−172 or T−172 was accomplished by inserting oligonucleotides used for EMSA into the pGL3 basic vector digested with SmaI (Takara Bio Inc.). Next, thymidine kinase promoter sequence was obtained from the pRL TK vector (Promega) by digesting with BglII (Takara Bio, Inc.) and HindIII (Takara Bio, Inc.) and then inserting in all pGL3 vectors. Construction of pGL3G−172 or -T−172 was accomplished by inserting the MOR promoter ranged from translation initiation site to 3 kilobase pairs upstream into the pGL3 basic vector at XhoI and HindIII sites. The inserted G−172 fragment was amplified from genomic DNA of the G−172 → G genotype with PCR; PCR was performed using KOD plus (Toyobo, Ltd.) and the following set of primers: forward, 5′-TATCTCGAGGATGGCGGAGTCTTCGG-3′, and reverse, 5′-TGCCTCGAGTACCTCTCCCAATTACCACAG-3′. The T−172 fragment was amplified from the G−172 fragment by mutagenesis that employed PCR. DNA fragments were purified using the Wizard PCR Preps DNA purification system (Promega), and plasmid DNA was purified using the Genopure plasmid maxi kit.
Transfection
Plasmid DNA transfection to HEK293T cells was performed in a 24-well plate by using NP-OH transfection reagent (27). Plasmid DNA (0.5 μg) and 2.4 μl of NP-OH transfection reagent were added to 12.5 μl of NaCl (40 mm). This mixture was incubated at room temperature for 20 min and used for each well. SH-SY5Y cells were transfected by using FuGENE 6.
Luciferase Assay
HEK293T cells and SH-SY5Y cells were cultivated in 24-well plates at a density of 5 × 10⁴/well for 24 h before transfection. Transient transfection was performed using 0.25 μg of the pGL3 vector, 0.125 μg of the pEF-bos β-galactosidase vector, and 0.125 μg of the pcDNA3-myc vector. The pEF-bos β-galactosidase vector was used for β-galactosidase assay as an internal control of transfection efficacy. After incubation for 24 h, the cells were lysed in 200 μl of lysis solution (25 mm Tris-HCl, pH 8.0, 2 mm dithiothreitol, 2 mm CDTA, 10% glycerol, 1% Triton X-100, 4 mm MgCl2, and 4 mm EGTA). Each lysate (40 μl) was used for luciferase assay and for β-galactosidase assay. Luciferase activity was quantified in MiceoLumat Plus LB96Y (Berthold Technologies, Bad Wildbad, Germany) by measurements based on the luciferase reporter assay system (Promega). These assays were performed three times in triplicate.
Statistical Analysis
For statistical evaluation of the experiments, one-way analysis of variance was performed. The asterisks indicate significantly difference (*, p < 0.05; **, p < 0.01; ***, p < 0.001).
RESULTS
Increase in Specific Nuclear Protein Binding by the Base Substitution of G−172 to T−172
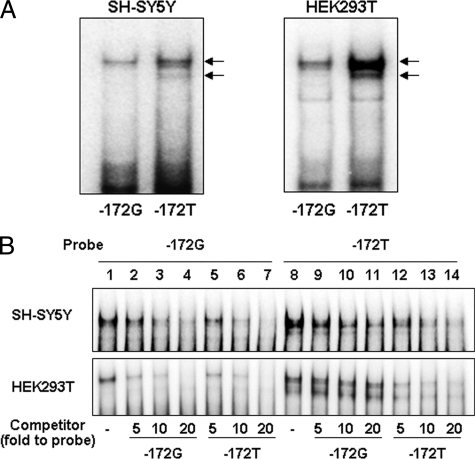
To determine whether specific nuclear proteins bind to the G−172 → T region, we performed EMSA using nuclear proteins extracted from SH-SY5Y or HEK293T cells and 32P-labeled oligonucleotide probes containing the G−172 → T region. SH-SY5Y or HEK293T cells were respectively employed as MOR-expressing cells or as advantageous cells for gene transfer analysis. In each cell, specific nuclear protein binding to both the G−172 and T−172 probes were observed as doublet bands. More proteins displayed binding to the T−172 probe than to the G−172 probe (Fig. 1A). To compare the binding affinity of specific nuclear proteins to the G−172 or to the T−172 probe, a cross-competition assay was carried out using respective nonlabeled probes as a competitor (Fig. 1B). Nonlabeled T−172 probe dose-dependently interfered with specific nuclear protein binding to the G−172 probe (Fig. 1B, lanes 5–7). However, inhibitory effects by the nonlabeled G−172 probe to the T−172 probe were comparatively weak (Fig. 1B, lanes 9–11). These results were similar for both SH-SY5Y and HEK293T cells.
FIGURE 1.
Specific nuclear protein binding to the G−172 → T region in EMSA. A, each probe was radiolabeled (−172G and −172T), and 1.0 μg of nuclear protein was obtained from SH-SY5Y or HEK293T cells. The arrows indicate specific protein binding to the G−172 → T region. B, competition assay using nonlabeled probe for investigation of relative protein binding affinity to G−172 or T−172. Lanes 1–7, radiolabeled G−172 probe; lanes 8–14, radiolabeled T−172 probe; lanes 1 and 8, noncompetition; lanes 2–4 and 9–11, 5–20-fold molar excess of G−172; lanes 5–7 and 12–14, 5–20-fold molar excess of T−172. All of the data were repeated three times in independent experiments or more.
Transcriptional Activity of G−172 → T Region and the Influence of the Base Substitution in MOR Promoter
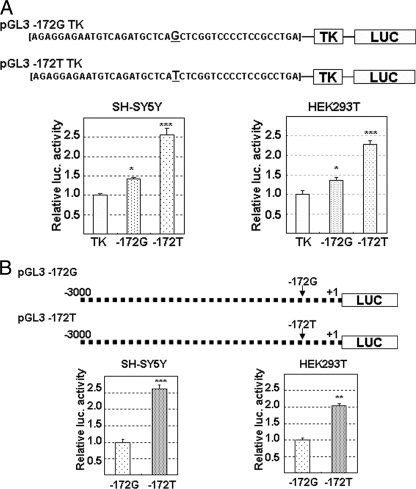
The reporter vector of G−172 → T TK or of G−172 → T was used for the luciferase assay to monitor transcriptional activity of the MOR gene in SH-SY5Y or HEK293T cells. Oligonucleotide containing the G−172 or T−172 probe was cloned upstream of the thymidine kinase promoter sequence in the pGL3 TK vector. Luciferase activity of pGL3G−172 TK or of pGL3T−172 TK normalized by that of pGL3 TK was shown as the relative transcriptional activity of these sequences. As a result, both pGL3G−172 TK and pGL3T−172 TK showed the transcriptional activities, which in pGL3T−172 TK was 1.7-fold as high as that of pGL3G−172 TK in SH-SY5Y or HEK293T cells (Fig. 2A). Similar to the results in pGL3G−172 → T TK, the pGL3G−172 → T containing the MOR promoter that ranged from the start site of transcription to −3 kb upstream indicated transcriptional activity; that of pGL3T−172 was 2.0–2.5-fold higher than that of pGL3G−172 in SH-SY5Y or HEK293T cells (Fig. 2B). The results depicted in Figs. 1 and 2 indicate that the promoter containing T−172 could possibly bind much more nuclear protein and have higher transcriptional activity.
FIGURE 2.
Transcriptional activity of G−172 or T−172 in MOR gene. A, pGL3G−172 → T TK were constructed by insertion of a 42-bp oligonucleotide containing G−172 → T upstream of TK in the pGL3 TK vector. B, pGL3T−172 or pGL3G−172 was constructed by insertion of respective MOR promoter gene, −3 kb upstream from transcriptional start site, to pGL3 basic vector. Luciferase assay was performed 24 h after each transfection of reporter vectors in SH-SY5Y cells or HEK293T cells. Relative luciferase activity of pGL3G−172 or pGL3T−172 was indicated against that of pGL3 TK (A), and that of pGL3T−172 was expressed against that of pGL3G−172 (B). Activities of coexpressed β-galactosidase were utilized for the correction of transfection efficiency in respective samples. The error bars indicates S.D. derived from three independent experiments. The asterisks indicate significantly difference (*, p < 0.05; **, p < 0.01; ***, p < 0.001).
Purification of Specific Binding Protein on G−172 → T Region Using Biotin-labeled T−172 Probe, and Identification of the Protein by MALDI-TOF Mass Spectrometry and Immunoblotting with Specific Antibody
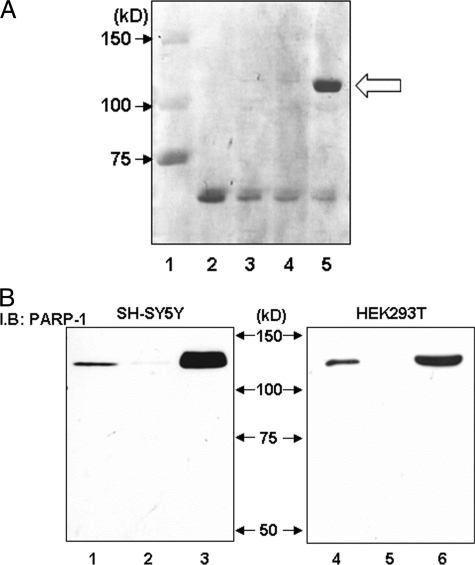
For identification of binding proteins in the G−172 → T region, the biotin-labeled T−172 probe and streptavidin-agarose beads were applied to nuclear protein purification. Protein separated by SDS-PAGE was stained with Coomassie brilliant blue and observed as a single band at 120 kDa (Fig. 3A, lane 5). MALDI-TOF mass spectrometry revealed that the 120-kDa protein separated from acrylamide gel was PARP-1, which was confirmed by WB with anti-PARP-1 antibody in both SH-SY5Y and HEK293T cells (Fig. 3B).
FIGURE 3.
Purification of specific binding protein to the G−172 → T region and confirmation of identified PARP-1 protein using specific antibody in Western blotting. A, specific protein was purified using biotin-labeled T−172 probe, avidin-agarose beads, and HEK293T-derived nuclear extract and was applied to SDS-PAGE and stained with Coomassie Brilliant Blue. Avidin-agarose beads were pretreated by bovine serum to prevent nonspecific protein binding. Loaded sample was as follows: lane 1, protein molecular weight standards; lane 2, 1.0 μg of bovine serum; lane 3, purified protein with biotin-labeled T−172 probe/without nuclear extracts; lane 4, purified protein with non-biotin-labeled T−172 probe and HEK293T-derived nuclear extracts; lane 5, purified protein with biotin-labeled T−172 probe and HEK293T-derived nuclear extracts. In lane 5 only, specific DNA-binding protein was observed at 120 kDa, as indicated by the arrow. B, cell lysate or purified protein from SH-SY5Y or HEK293T was loaded to SDS-PAGE and was investigated by immunoblotting (I.B.) using anti-PARP-1 antibody. Lanes 1–3, nuclear protein was extracted from SH-SY5Y; lanes 4–6, nuclear protein was extracted from HEK293T. Lanes 1 and 4, 1.0 μg of unpurified nuclear protein; lanes 2 and 5, purified protein with non-biotin-labeled T−172 probe; lanes 3 and 6, purified protein with biotin-labeled T−172 probe. These experiments were independently performed three times or more.
Enhancement of Protein Binding to T−172 and of Transcriptional Activity by Overexpressed PARP-1
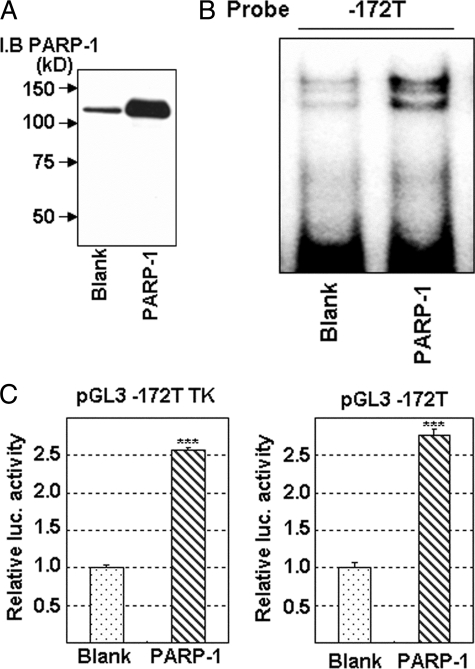
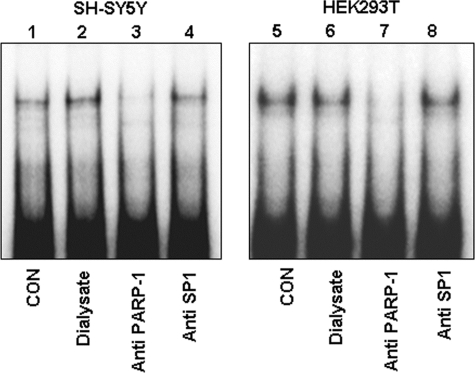
PARP-1 overexpression enhanced protein binding to the T−172 probe and was detected as doublet bands in EMSA (Fig. 4B); it also increased transcriptional activity of pGL3T−172 TK or of pGL3T−172 (Fig. 4C). Similarly, the increase in transcriptional activities was also observed in pGL3G−172 TK or in pGL3G−172 (data not shown). Furthermore, in supershift analysis, anti-PARP-1 antibody specifically diminished PARP-1-delieved doublet bands (Fig. 5, lanes 3 and 7). SP1 was initially predicted by computer program to bind G−172 → T; however, anti-SP1 antibody did not influence protein-binding signals in T−172 (Fig. 5, lanes 4 and 8). These results clearly indicate that PARP-1 binds to the G−172 → T region and activates transcription of MOR, which is influenced by base substitution.
FIGURE 4.
Enhancement of protein binding to the G−172 → T region, and of transcriptional activity in MOR gene by PARP-1 overexpression. A, PARP-1 overexpression was shown in Western blotting. B, PARP-1 binding to the T−172 probe was investigated in EMSA. HEK293T cells were transfected with the PARP-1 expression vector, and a nuclear extract was prepared for EMSA 48 h after the transfection. C, transcriptional activity in luciferase assay with pGL3T−172 TK or pGL3T−172. HEK293T cells were transfected with the PARP-1 expression vector and respective reporter vector, and cell lysate was prepared for luciferase assay 48 h after the transfection. The error bar indicates S.D. derived from three independent experiments. β-Galactosidase activities, a control for transfection efficiency, were used to normalize the data. The asterisks indicate significant difference (***, p < 0.001). I.B., immunoblotting.
FIGURE 5.
Super shift analysis with anti-PARP-1 antibody for reconfirmation of PARP-1 binding to the T−172 probe. Each sample, consisting of 1.0 μg of nuclear protein extracted from SH-SY5Y (lanes 1–4) or HEK293T (lanes 5–8), was loaded in EMSA. Anti-PARP-1 antibody was prepared after the dialysis and the concentration because commercially available antibody was too thin. Salt concentration of anti-PARP-1 antibody, concentrated dialyzed buffer, and anti-SP1 antibody was equal in respective sample. Lanes 1 and 5, nuclear extract without any antibody or dialyzed buffer; lane 2 and 6, nuclear extract with 2.0 μl of dialyzed buffer used for dialysis of antibody solution; lanes 3 and 7, nuclear extract with 2.0 μl of anti-PARP-1 antibody; lanes 4 and 8, nuclear extract with 2.0 μl of anti-SP1 antibody as a negative control (CON). These results were performed of at least three independent experiments.
Detection of PARP-1 Binding Sequence in T−172 Region
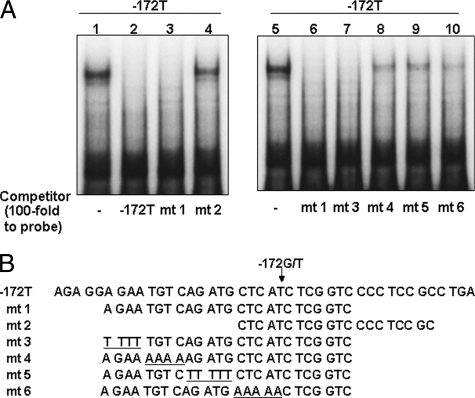
For detection of a PARP-1-binding sequence in the G−172 → T region, a competition assay was performed using shortened or mutated T−172 probes. In the analysis using shortened probes, mt 1 competed to T−172 probe and diminished PARP-1 signals, but mt 2 did not have this effect. Among mutated probes of mt 1, mt 3 completely diminished PARP-1 signals, but inhibition by mt 4, mt 5, or mt 6 was partial (Fig. 6A). These results indicate that TGTCAGATG was the center of PARP-1 binding in the MOR gene, and the sequence CTCAT beside the T−172 also related to its binding.
FIGURE 6.
Analysis of PARP-1 binding sequence in the T−172 probe by competition assay. A, nuclear protein (2.0 μg/lane) extracted from HEK293T was applied to EMSA. Respective 100-fold nonlabeled oligo-DNAs were added for competition to labeled T−172 probe. Lanes 1 and 5 show control sample without competitor, and lanes 2–4 and 6-10 show samples with competitor T−172 or mt 1, 2, 3, 4, 5, or 6, respectively. B, competitor sequences are described. The underlined bases indicate mutated sequence to clarify the PARP-1 binding region in T−172 probe. These results were represented for three experiments or more.
Suppression of the Binding to the G−172 → T Region by PARP-1 Inhibition
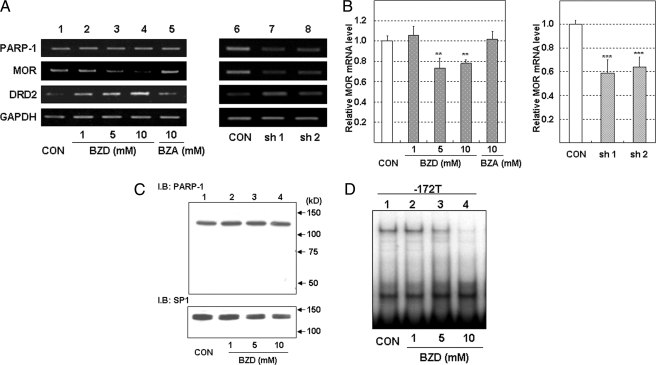
BZD, an inhibitor of PARP-1, was used for further confirmation of PARP-1 binding to the G−172 → T region. Although neither the mRNA nor the protein expression of PARP-1 was affected by BZD (Fig. 7, A and C), the quantity of PARP-1 binding in the T−172 probe dose-dependently decreased 24 h after the addition of BZD in SH-SY5Y cells (Fig. 7D).
FIGURE 7.
The inhibition of MOR mRNA and PARP-1 binding to T−172 probe by the treatment of PARP-1 inhibitor in SH-SY5Y cells. A, total RNA in SH-SY5Y was extracted 24 h after the addition of DMSO, BZD, or BZA or was extracted 72 h after transfection of shRNA expression vector. Then MOR mRNA expression was investigated by RT-PCR. Lane 1, DMSO as a vehicle control (CON); lanes 2–4, BZD (1, 5, and 10 mm); lane 6, BZA as a negative control of BZD; lane 7, control shRNA; lane 8, shPARP-1 (SH-1); lane 9, shPARP-1 (SH-2). PCR cycles of each gene were as follows: MOR, 26 cycles; PARP-1, 25 cycles; DRD2, 28 cycles; glyceraldehyde-3-phosphate dehydrogenase, 20 cycles. B, the real time RT-PCR indicated MOR mRNA expression level normalized to L19 mRNA expression level. The error bars indicate S.D. derived from three independent experiments. The asterisks indicate significantly different values (**, p < 0.01; ***, p < 0.001). C, PARP-1 protein expression detected by WB. SP1 protein expression was used as loading control. D, BZD inhibited PARP-1 binding to the T−172 probe. Nuclear protein in BZD-treated SH-SY5T cells was extracted 24 h after the addition of DMSO (vehicle control) or various concentrations of BZD. Lane 1, nuclear protein treated with DMSO as a vehicle control; lanes 2–4, nuclear protein treated with BZD (1, 5, and 10 mm). These experiments were performed three times or more. I.B., immunoblot.
SH-SY5Y cells are known to express MOR constitutively. MOR mRNA expression detected by RT-PCR was suppressed by BZD in a dose-dependent manner. However, BZA, as a negative control for BZD, did not influence the tested mRNA expressions, including MOR (Fig. 7A). Real time RT-PCR analysis showed that BZD resulted in a 0.7-fold depletion of MOR mRNA expression (Fig. 7B).
Moreover, PARP-1 expression was knocked down by two kinds of PARP-1 shRNA vector in SH-SY5Y cells, which was investigated for the PARP-1-dependent regulation of MOR expression. For correction of the nonspecific effects by transfection, SH-SY5Y cells were also transfected with a control shRNA. The MOR mRNA expression was analyzed by RT-PCR or real time RT-PCR 72 h after transfection. The MOR mRNA levels were decreased by depletion of PARP-1 (Fig. 7A). Real time RT-PCR analysis showed that PARP-1 knockdown resulted in a 0.6-fold depletion of MOR mRNA expression (Fig. 7B). The increase in DRD2 mRNA by BZD or by PARP-1 knockdown indicated that the inhibition of MOR mRNA expression by both treatments was not merely caused by their nonspecific toxic effects.
TNF-α Increased PARP-1 Binding to G−172 → T Region and MOR Promoter Activity
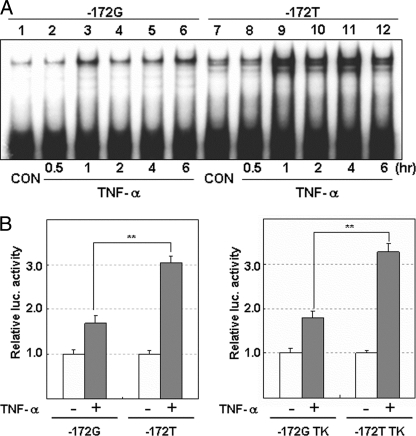
Next, we searched for factors that increase PARP-1-binding to the G−172 → T probe. We found that TNF-α increased the binding of PARP-1 1–6 h after the addition of TNF-α in SH-SY5Y cells (Fig. 8A). Phorbol 12-myristate 13-acetate, prostaglandin E2, quinpirole (dopamine D2 receptor agonist), trichostatin A, and [d-Ala2,N-Me-Phe4,Gly5-ol]enkephalin also up-regulated MOR mRNA expression, but all of which did not activate PARP-1 binding to T−172 probe in SH-SY5Y cells. Only TNF-α up-regulated both MOR expression and PARP-1 binding to G−172 → T region. Moreover, the signals of PARP-1 binding to the T−172 probe were higher than those of G−172 probe with or without stimulation by TNF-α (Fig. 8A). Corresponding to the results of PARP-1 binding to the G−172 → T probe, TNF-α preferentially increased transcriptional activity of pGL3T−172 (3.0-fold) more than that of pGL3G−172 (1.7-fold) (Fig. 8B).
FIGURE 8.
TNF-α-induced enhancement of PARP-1 binding to the G−172 → T region and transcription activity of MOR gene in SH-SY5Y cells. Nuclear protein or cell lysate in SH-SY5Y was prepared at respective times after stimulation with TNF-α (10 ng/ml). A, PARP-1 binding to the G−172 or the T−172 probe after the stimulation of TNF-α was investigated by EMSA. B, SH-SY5Y cells transfected with pGL3G−172 → T or with pGL3G−172 → T TK were stimulated by TNF-α and were prepared 12 h after TNF-α stimulation for luciferase assay. Luciferase activity in T−172 was represented as relative value against that in G−172. The error bars indicate S.D. derived from three independent experiments. β-galactosidase activities, as controls (CON) for transfection efficiency, were used to normalize the data. The asterisks indicate significantly difference (**, p < 0.01).
Suppression of TNF-α-induced Enhancement of the PARP-1 Binding to G−172 → T Region and of MOR Gene Expression by PARP-1 Inhibitor
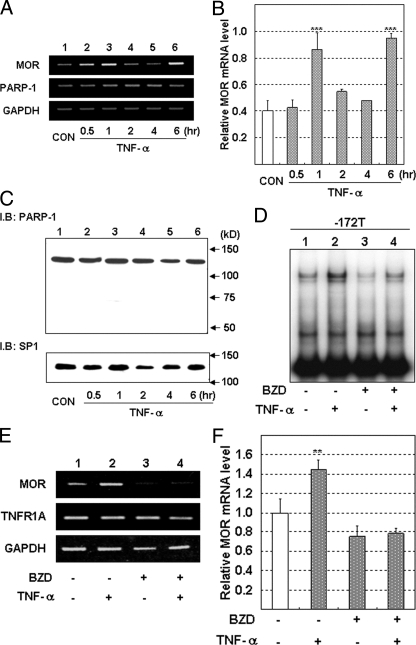
Increase of MOR mRNA expression was observed at 1 or 6 h after TNF-α stimulation in SH-SY5Y cells (Fig. 9A). Real time RT-PCR analysis showed that TNF-α resulted in a 2.2–2.4-fold induction of MOR mRNA expression (Fig. 9B). During the increase in PARP-1 binding to G−172 → T by TNF-α (Fig. 8A), the total amount of the PARP-1 protein in SH-SY5Y did not change (Fig. 9C). Moreover, both increases in PARP-1 binding to T−172 and MOR expression induced by TNF-α stimulation were inhibited by pretreatment with BZD (Fig. 9, D–F). These results indicate that PARP-1 also contributed to TNF-α-induced up-regulation of the MOR gene.
FIGURE 9.
Inhibition of TNF-α-induced PARP-1 binding to the T−172 probe, and of MOR mRNA expression, by PARP-1 inhibitor, BZD, in SH-SY5Y cells. Total RNA or nuclear protein in SH-SY5Y was prepared at respective times after the stimulation with TNF-α. A, MOR or PARP-1 gene expression was investigated by RT-PCR. B, relative MOR mRNA expression level was detected by real time RT-PCR. MOR mRNA expression in cells treated as in A was normalized to L19 mRNA expression. The error bars indicate S.D. derived from three independent experiments. The asterisks indicate significantly difference (***, p < 0.001). C, expression of PARP-1 protein or of SP1 protein for loading control (CON) was detected by WB. BZD was pretreated in SH-SY5Y 24 h before TNF-α stimulation. D, influence of BZD on the TNF-α enhanced PARP-1 binding to the T−172 probe was investigated by EMSA. E, influence of BZD on TNF-α enhanced MOR mRNA expression, or to TNFR1A gene expression, was monitored by RT-PCR. Lane 1, DMSO as a vehicle control; lane 2, 10 ng/ml of TNF-α; lane 3, 10 mm of BZD; lane 4, 10 mm of BZD and 10 ng/ml of TNF-α. PCR cycles of each gene were as follows: MOR, 26 cycles; PARP-1, 25 cycles; DRD2, 28 cycles; glyceraldehyde-3-phosphate dehydrogenase, 20 cycles. F, MOR mRNA expression level in SH-SY5Y treated with TNF- and/or BZD as for E was detected by real time RT-PCR and normalized to L19 mRNA. The error bars indicate S.D. derived from three independent experiments. The asterisks indicate significantly difference (**, p < 0.01).
DISCUSSION
The G−172 → T polymorphism in the MOR gene promoter is caused by base substitution from guanine to thymine, which is located 172 bp upstream of the translation initiation site. In previous studies, no functional differences were found between G−172 and T−172 on MOR promoter activity (28). However, we definitely detected such differences, i.e. the T−172 probe displayed higher binding affinity to unknown nuclear protein and higher transcriptional activity than the G−172, thereby implying that this protein regulates MOR transcription at G−172 → T (Figs. 1 and 2). Therefore, we employed the computer program TFSEARCH to predict known transcription factors bindable to neighborhood of G−172 → T region, which assessed that the sterol regulatory element binding protein, SP1, or GATA-1 possibly bound to G−172 → T region. On the basis of the anticipated results, we attempted to compete protein binding to T−172 probe with oligo-DNA-probes containing the consensus binding sequences for the anticipated transcription factors, but the binding was not influenced by these competitions (data not shown). Consequently, we purified the specific nuclear protein bound to the T−172 probe and identified PARP-1. WB using anti-PARP-1 antibody confirmed that this nuclear protein was definitely PARP-1 (Fig. 3B). The binding of overexpressed PARP-1 to the G−172 → T probe was also detected as doublet bands in EMSA (Fig. 4B), and anti-PARP-1 antibody diminished both bands in supershift analysis (Fig. 5). Although we can only speculate about the details, PARP-1 might have two kinds of binding forms to the G−172 → T probe.
In the relationship between PARP-1-related transcriptional regulation and gene polymorphisms, it has been reported that G−228 → T at the transcriptional region in the MARCB1 gene significantly increased PARP-1 binding affinity and reporter activity; furthermore, this SNP altered the level of SMARCB1 mRNA and protein expression in human acute lymphoblastic leukemia cell lines (29). It was also reported that PARP-1 bound to NACP-Rep1 in microsatellite repeats located in the SNCA gene, which exhibited different transcriptional activities resulting from the varying individual length of NACP-Rep1 sequences (30, 31).
Previously, many reports have shown the PARP-1-binding sequence, but some of these results are controversial, e.g. those for the murine inducible nitric-oxide synthase gene (5′-AATTATAATTT-3′), the rat Reg gene (5′-TGCCCCTCCCAT-3′), the mouse Tcirg1 gene (5′-TTCCCACAGC-3′), the human SNCA gene [5′-(TC)10(T)2(TC)10(TA)8(CA)11-3′], and the human SMARCB1 gene (5′-CTTTTGTTTGAGCTGCGGCGCGCGCGTC-3′) (29, 31–34). We speculate from these reports that PARP-1 tends to bind to the CCCC sequence like GC-box, but it is difficult to forecast the appropriate PARP-1-binding region from DNA sequences, as with other transcription factors. In many cases in previous studies, the PARP-1-binding region has been revealed only after the DNA protein binding to a specific DNA region was identified as PARP-1 by mass spectrometry. Such is also the case in our study.
In a report concerning the mouse MOR gene, PARP-1 bound to the poly(C) sequences (5′-CTTCTGCTCCCCCCCCCCCTACCC-3′; −430 to −407 bp) and repressed MOR gene expression in mouse neuroblastoma NS20Y cells (35). In contrast to that report, our results show that PARP-1 increases human MOR gene transcriptional activity (Fig. 4C), BZD, an inhibitor of PARP-1, or PARP-1 shRNA decreases MOR gene expression in human neuroblastoma SH-SY5Y cells (Fig. 7, A and B). When an unknown protein binding to the T−172 probe was revealed as PARP-1, we expected that PARP-1 bound to the CCCC sequence of these probes located 162–165 bp upstream from the translation start site of the MOR gene (Fig. 6B). However, the results in Fig. 6 clearly show that PARP-1 binds to TGTCAGATG within the T−172 probe (5′-AGAGGAGAATGTCAGATGCTCA (G/T) CTCGGCCCCTCCGCCTGA-3′; −194 to −153 bp) but not to CCCC. Thus, human MOR gene transcription regulated by PARP-1 might be in different mechanism from that of the mouse because the human MOR regulatory region including the G−172 → T probe did not have a region similar to the poly(C) sequences in the mouse MOR gene.
We explored the inducing factors for MOR expression, as well as those for PARP-1 binding to the G−172 → T region, and we found that TNF-α increased MOR expression and PARP-1 binding to T−172 probe. TNF-α was reported as the inducer of MOR transcription in human immune effecter cells through NF-κB (10). In our study, the increase of MOR gene expression by TNF-α (Fig. 9, A and B) was suppressed by BZD in SH-SY5Y cells (Fig. 9, E and F). These results suggest that TNF-α induces MOR transcription in SH-SY5Y cells not only through NF-κB but also through PARP-1. Both the increase of PARP-1 binding to T−172 probe by TNF-α and decreasing of PARP-1 binding by BZD did not involve changing the amount of PARP-1 protein level. Furthermore, anti-PARP-1 antibody that recognized the PARP-1 C terminus containing the catalytic domain completely diminished bands of PARP-1 binding to the G−172 → T region in EMSA but did not shift it upward. Considering that BZD inhibits PARP-1 catalytic activity and that anti-PARP-1 antibody recognizes the PARP-1 C terminus containing the catalytic domain, the catalytic activity of PARP-1 might be crucial for its own binding to the G−172 → T region, as well as for MOR gene transcription.
In this study, TNF-α remarkably increased PARP-1 binding to the T−172 probe, but details of the mechanism for this binding are still not known; it might result from post-translational modification of PARP-1 through auto-PARylation, acetylation, or phosphorylation (36–39). PARP-1-dependent transcription was reported to be regulated by cellular signaling pathways. Actually, direct phosphorylation of PARP-1 by ERK1/2 enhanced PARP-1 catalytic activity, but the effect on transcriptional activity was obscure (38). Although TNF-α-induced signaling to PARP-1 was indistinct, the effects on cytotoxicity by TNF-α were reported to be mediated by ADP-ribosylaton in murine fibroblast cell line L929 cells (40). Moreover, previous studies reported that DNA binding activity of PARP-1 was altered because of its catalytic activity by NAD+ in in vitro experiments (35). In our preliminary study, NAD+ stimulated PARP-1 binding to T−172 probe; furthermore, TNF-α stimulated PARP-1 catalytic activity (data not shown). Therefore, the regulation of nuclear NAD+ synthesis could be critical for PARP-1-dependent gene regulation including MOR expression.
In summary, our study demonstrated that PARP-1 binds to the G−172 → T region and up-regulates MOR gene transcription. PARP-1 binding affinity to T−172 sequence was higher than that of G−172, and the transcriptional activity with or without TNF-α was also enhanced by T−172 substitution, which was considered to be related to relate to own catalytic activity. In conclusion, PARP-1 positively regulates MOR gene transcription via G−172 → T, which possibly influences individual specificity in the therapeutic opioid effect, furthermore, which might provide useful information for inflammatory pain therapy.
This work was supported by grants from the Ministry of Education, Culture, Sports, Science, and Technology of Japan.
- MOR
- μ opioid receptor
- PARP
- poly(ADP-ribose) polymerase
- SNP
- single nucleotide polymorphism
- BZD
- benzamide
- TNF
- tumor necrosis factor
- STAT
- signal transducers and activators of transcription
- BZA
- sodium benzoate
- DMSO
- dimethyl sulfoxide
- EMSA
- electrophoretic mobility shift assay(s)
- WB
- Western blotting
- shRNA
- small hairpin RNA
- RT
- reverse transcription
- CDTA
- 1,2-cyclohexylenedinitrilotetraacetic acid
- MALDI-TOF
- matrix-assisted laser desorption ionization time-of-flight
- TK
- thymidine kinase
- mt
- mutant type.
REFERENCES
- 1.Kieffer B. L. (1999) Trends Pharmacol. Sci. 20, 19–26 [DOI] [PubMed] [Google Scholar]
- 2.Law P. Y., Erickson L. J., El-Kouhen R., Dicker L., Solberg J., Wang W., Miller E., Burd A. L., Loh H. H. (2000) Mol. Pharmacol. 58, 388–398 [DOI] [PubMed] [Google Scholar]
- 3.Wang J. B., Johnson P. S., Persico A. M., Hawkins A. L., Griffin C. A., Uhl G. R. (1994) FEBS Lett. 338, 217–222 [DOI] [PubMed] [Google Scholar]
- 4.Hoehe M. R., Köpke K., Wendel B., Rohde K., Flachmeier C., Kidd K. K., Berrettini W. H., Church G. M. (2000) Hum. Mol. Genet. 9, 2895–2908 [DOI] [PubMed] [Google Scholar]
- 5.Bergen A. W., Kokoszka J., Peterson R., Long J. C., Virkkunen M., Linnoila M., Goldman D. (1997) Mol. Psychiatry 2, 490–494 [DOI] [PubMed] [Google Scholar]
- 6.Bond C., LaForge K. S., Tian M., Melia D., Zhang S., Borg L., Gong J., Schluger J., Strong J. A., Leal S. M., Tischfield J. A., Kreek M. J., Yu L. (1998) Proc. Natl. Acad. Sci. U.S.A. 95, 9608–9613 [DOI] [PMC free article] [PubMed] [Google Scholar]
- 7.Lötsch J., Skarke C., Grösch S., Darimont J., Schmidt H., Geisslinger G. (2002) Pharmacogenetics. 12, 3–9 [DOI] [PubMed] [Google Scholar]
- 8.Wang D., Quillan J. M., Winans K., Lucas J. L., Sadée W. (2001) J. Biol. Chem. 276, 34624–34630 [DOI] [PubMed] [Google Scholar]
- 9.Koch T., Kroslak T., Averbeck M., Mayer P., Schröder H., Raulf E., Höllt V. (2000) Mol. Pharmacol. 58, 328–334 [DOI] [PubMed] [Google Scholar]
- 10.Kraus J., Borner C., Giannini E., Hickfang K., Braun H., Mayer P., Hoehe M. R., Ambrosch A., Konig W., Hollt V. (2001) J. Biol. Chem. 276, 43901–43908 [DOI] [PubMed] [Google Scholar]
- 11.Kraus J., Börner C., Giannini E., Höllt V. (2003) Mol. Pharmacol. 64, 876–884 [DOI] [PubMed] [Google Scholar]
- 12.Bailey D. W. (1971) Transplantation 11, 419–422 [DOI] [PubMed] [Google Scholar]
- 13.Lee P. W., Wu S., Lee Y. M. (2004) Mol. Pharmacol. 66, 1580–1584 [DOI] [PubMed] [Google Scholar]
- 14.Soldatenkov V. A., Chasovskikh S., Potaman V. N., Trofimova I., Smulson M. E., Dritschilo A. (2002) J. Biol. Chem. 277, 665–670 [DOI] [PubMed] [Google Scholar]
- 15.D'Amours D., Desnoyers S., D'Silva I., Poirier G. G. (1999) Biochem. J. 342, 249–268 [PMC free article] [PubMed] [Google Scholar]
- 16.Virág L., Szabó C. (2002) Pharmacol. Rev. 54, 375–429 [DOI] [PubMed] [Google Scholar]
- 17.Anderson M. G., Scoggin K. E., Simbulan-Rosenthal C. M., Steadman J. A. (2000) J. Virol. 74, 2169–2177 [DOI] [PMC free article] [PubMed] [Google Scholar]
- 18.Cervellera M. N., Sala A. (2000) J. Biol. Chem. 275, 10692–10696 [DOI] [PubMed] [Google Scholar]
- 19.Hassa P. O., Hottiger M. O. (2002) Cell Mol. Life Sci. 59, 1534–1553 [DOI] [PMC free article] [PubMed] [Google Scholar]
- 20.Butler A. J., Ordahl C. P. (1999) Mol. Cell Biol. 19, 296–306 [DOI] [PMC free article] [PubMed] [Google Scholar]
- 21.Miyamoto T., Kakizawa T., Hashizume K. (1999) Mol. Cell Biol. 19, 2644–2649 [DOI] [PMC free article] [PubMed] [Google Scholar]
- 22.Kraus W. L., Lis J. T. (2003) Cell 113, 677–683 [DOI] [PubMed] [Google Scholar]
- 23.Zaniolo K., Desnoyers S., Leclerc S., Guérin S. L. (2007) BMC Mol. Biol. 8, 96–114 [DOI] [PMC free article] [PubMed] [Google Scholar]
- 24.Ono T., Muto A., Kaneda T., Yoshida T. (2009) Biol. Pharm. Bull. 32, 721–723 [DOI] [PubMed] [Google Scholar]
- 25.Kameoka M., Nukuzuma S., Itaya A., Tanaka Y., Ota K., Ikuta K., Yoshihara K. (2004) J. Virol. 78, 8931–8934 [DOI] [PMC free article] [PubMed] [Google Scholar]
- 26.Bedini A., Baiula M., Spampinato S. (2008) J Neurochem. 105, 2166–2178 [DOI] [PubMed] [Google Scholar]
- 27.Hattori Y., Ding W. X., Maitani Y. (2007) J. Control. Release 120, 122–130 [DOI] [PubMed] [Google Scholar]
- 28.Bayerer B., Stamer U., Hoeft A., Stüber F. (2007) Eur. J. Pain 11, 421–427 [DOI] [PubMed] [Google Scholar]
- 29.Pottier N., Cheok M. H., Yang W., Assem M., Tracey L., Obenauer J. C., Panetta J. C., Relling M. V., Evans W. E. (2007) Hum. Mol. Genet. 16, 2261–2271 [DOI] [PubMed] [Google Scholar]
- 30.Chiba-Falek O., Nussbaum R. L. (2001) Hum. Mol. Genet. 10, 3101–3109 [DOI] [PubMed] [Google Scholar]
- 31.Chiba-Falek O., Kowalak J. A., Smulson M. E., Nussbaum R. L. (2005) Am. J. Hum. Genet. 76, 478–492 [DOI] [PMC free article] [PubMed] [Google Scholar]
- 32.Yu Z., Kuncewicz T., Dubinsky W. P., Kone B. C. (2006) J. Biol. Chem. 281, 9101–9109 [DOI] [PubMed] [Google Scholar]
- 33.Shiokawa M., Masutani M., Fujihara H., Ueki K., Nishikawa R., Sugimura T., Kubo H., Nakagama H. (2005) Jpn. J. Clin. Oncol. 35, 97–102 [DOI] [PubMed] [Google Scholar]
- 34.Beranger G. E., Momier D., Rochet N., Quincey D., Guigonis J. M., Samson M., Carle G. F., Scimeca J. C. (2006) J. Bone Miner Res. 21, 1757–1769 [DOI] [PubMed] [Google Scholar]
- 35.Choi H. S., Hwang C. K., Kim C. S., Song K. Y., Law P. Y., Loh H. H., Wei L. N. (2008) J. Cell Mol. Med. 12, 2319–2333 [DOI] [PMC free article] [PubMed] [Google Scholar]
- 36.Cohen-Armon M., Visochek L., Rozensal D., Kalal A., Geistrikh I., Klein R., Bendetz-Neze S., Yao Z., Seger R. (2007) Mol. Cell 25, 297–308 [DOI] [PubMed] [Google Scholar]
- 37.Hassa P. O., Haenni S. S., Buerki C., Meier N. I., Lane W. S., Owen H., Gersbach M., Imhof R., Hottiger M. O. (2005) J. Biol. Chem. 280, 40450–40464 [DOI] [PubMed] [Google Scholar]
- 38.Kauppinen T. M., Chan W. Y., Suh S. W., Wiggins A. K., Huang E. J., Swanson R. A. (2006) Proc. Natl. Acad. Sci. U.S.A. 103, 7136–7141 [DOI] [PMC free article] [PubMed] [Google Scholar]
- 39.Zhang S., Lin Y., Kim Y. S., Hande M. P., Liu Z. G., Shen H. M. (2007) Cell Death. Differ. 14, 1001–1010 [DOI] [PubMed] [Google Scholar]
- 40.Agarwal S., Drysdale B. E., Shin H. S. (1988) J. Immunol. 140, 4187–4192 [PubMed] [Google Scholar]


