Abstract
The mitochondrial cytochrome bc1 complex (ubiquinol/cytochrome c oxidoreductase) is generally thought to generate superoxide anion that participates in cell signaling and contributes to cellular damage in aging and degenerative disease. However, the isolated, detergent-solubilized bc1 complex does not generate measurable amounts of superoxide except when inhibited by antimycin. In addition, indirect measurements of superoxide production by cells and isolated mitochondria have not clearly resolved the contribution of the bc1 complex to the generation of superoxide by mitochondria in vivo, nor did they establish the effect, if any, of membrane potential on superoxide formation by this enzyme complex. In this study we show that the yeast cytochrome bc1 complex does generate significant amounts of superoxide when reconstituted into phospholipid vesicles. The rate of superoxide generation by the reconstituted bc1 complex increased exponentially with increased magnitude of the membrane potential, a finding that is compatible with the suggestion that membrane potential inhibits electron transfer from the cytochrome bL to bH hemes, thereby promoting the formation of a ubisemiquinone radical that interacts with oxygen to generate superoxide. When the membrane potential was further increased, by the addition of nigericin or by the imposition of a diffusion potential, the rate of generation of superoxide was further accelerated and approached the rate obtained with antimycin. These findings suggest that the bc1 complex may contribute significantly to superoxide generation by mitochondria in vivo, and that the rate of superoxide generation can be controlled by modulation of the mitochondrial membrane potential.
The mitochondrial oxidative phosphorylation system utilizes the energy derived from the oxidation of metabolic substrates to drive the synthesis of ATP. Electron transport through the NADH dehydrogenase complex, cytochrome bc1 complex, and cytochrome c oxidase complex is coupled to proton translocation across the mitochondrial inner membrane, thus generating a protonmotive force (Δp) consisting of a membrane potential (ΔΨ) and a pH gradient (ΔpH) that drives the synthesis of ATP by the ATP synthase (reviewed in Ref. 1).
Several of the mitochondrial electron transport complexes produce free radical intermediates that interact with oxygen to generate superoxide (reviewed in Refs. 2, 3). Superoxide is a highly reactive compound that can lead to the formation of other free radicals and reactive compounds and thus damage directly or indirectly cellular proteins, DNA, and phospholipids. It is also believed that free radical damage is a major cause of aging and contributes to many degenerative diseases (reviewed in Ref. 4).
Studies with isolated mitochondria have attempted to evaluate the contributions of the different mitochondrial energy-transducing complexes to this process (5–9). An early study with isolated rat heart mitochondria suggested that the bc1 complex produces large amounts of superoxide, but only when the mitochondrial membrane potential is high (10). This conclusion led to the suggestion that cells modulate the magnitude of the mitochondrial protonmotive force to protect the mitochondria from excess production of superoxide (11).
However, it was shown later that with high concentrations of succinate as a substrate and without rotenone (as in Ref. 10), most of the superoxide is generated by reverse electron transport through complex I (8). Moreover, the rate of generation of superoxide by reverse electron transport through complex I was shown to be more strongly dependent on ΔpH than on Δψ (12). It was also suggested that the contribution of the bc1 complex to superoxide generation by mitochondria is negligible compared with that produced by reverse electron transport through complex I (9), but it is not clear whether reverse electron transport is a significant process under most physiological conditions.
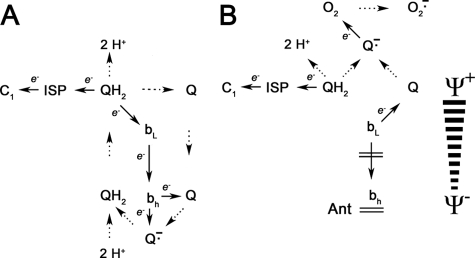
Several groups have measured superoxide production by the detergent-solubilized bc1 complex isolated from either yeast or beef heart. It was possible to observe superoxide production by the isolated, detergent-solubilized bc1 complex that was mutated in key residues at the ubiquinol oxidation site (13). However, the native enzyme did not produce measurable amounts of superoxide except when inhibited by antimycin or other bc1 complex inhibitors (14–18). The mechanism of the antimycin-induced generation of superoxide by the bc1 complex is fairly well understood within the framework of the Q cycle mechanism, shown in Fig. 1. Following the oxidation of ubiquinol at center P, as electrons recycle through the b hemes, antimycin inhibits reduction of ubiquinone at center N and electrons back up in center P, resulting in the formation of a ubisemiquinone radical, which can interact with oxygen to form superoxide (15, 18). It also can be predicted that the membrane potential would inhibit electron transfer from heme bL to bH and stimulate the production of superoxide by the bc1 complex. However, it is not known whether this prediction actually manifests and, if so, how strong is the dependence of superoxide production by the bc1 complex on the magnitude of membrane potential.
FIGURE 1.
Mechanistic basis for production of superoxide by the reconstituted cytochrome bc1 complex. The figure shows the protonmotive Q cycle mechanism and the leak of electrons to oxygen that is presumably the source of superoxide formation by the reconstituted enzyme. A shows the protonmotive Q cycle mechanism as it normally functions. Ubiquinol (QH2) is oxidized at center P near the outer surface of the membrane or vesicle in a bifurcated reaction that transfers one electron to the Rieske iron-sulfur protein (ISP) and one electron to the bL heme of cytochrome b. The electron on the iron-sulfur protein is then transferred to cytochrome c1, and the electron on the bL heme is transferred to the bH heme, which then reduces ubiquinone (Q) to semiquinone at center N. When a second molecule of ubiquinol is oxidized, the electron that arrives on the bH heme reduces semiquinone to ubiquinol. B shows the formation of superoxide anion that results when electron transfer from the bL to bH heme is inhibited, either by an opposing membrane potential or by antimycin, which blocks reoxidation of the bH heme, causing electrons to accumulate in the bL heme. Superoxide anion is formed by reaction of oxygen with ubisemiquinone, which is formed either by transfer of one electron from ubiquinol to the iron-sulfur protein or by reduction of ubiquinone by the reduced bL heme. In both panels solid arrows indicate electron transfer reactions. Dashed arrows indicate movement of ubiquinone and ubiquinol between reaction centers in the bc1 complex, release and uptake of protons at center P and center N, or changes in redox status of ubiquinone, ubiquinol, and oxygen. Solid bars in B show the opposition of electron transfer from the bL to bH heme by the membrane potential and inhibition of bH reoxidation by antimycin.
We have attempted to resolve this issue by reconstitution of the yeast cytochrome bc1 complex into phospholipid vesicles, followed by measuring the rate of superoxide generation in parallel with the magnitude of the membrane potential that is generated by the reconstituted enzyme. Our findings indicate that superoxide anion formation by the bc1 complex in situ depends strongly on membrane potential and can approach values similar to those promoted by antimycin.
EXPERIMENTAL PROCEDURES
Reagents
All reagents were purchased from Sigma except Amplex® UltraRed that was purchased from Molecular Probes.
Purification of Cytochrome bc1 Complex
Cytochrome bc1 complex was isolated from Red Star cake yeast as described previously (19), except that the dodecyl maltoside concentration was increased to 0.05% in the elution buffers, and the volume of DEAE-Bio-Gel A was reduced to 25 ml to increase the yield of active enzyme. Quantification of the bc1 complex was performed as described (20) using extinction coefficients of 17.5 mm−1 cm−1 at 553–539 nm for cytochrome c1 (21) and 25.6 mm−1 cm−1 at 563–579 nm for the average absorbance of the bH and bL hemes in cytochrome b (22).
Reconstitution of Cytochrome bc1 Complex with Phospholipid Vesicles
Unilamellar phospholipid vesicles were prepared by sonication of an ice-cold mixture of 40 mg of sodium cholate and 60 mg of asolectin in 4 ml of dialysis buffer (100 mm KCl, 3 mm K+-HEPES, pH 7.3), using a model 500 Sonic Dismembrator (Fisher) set at 20% power amplitude for 10 s, repeated every 20 s until the suspension became clear. The suspension of phospholipid vesicles was mixed with 1 nmol of the purified bc1 complex to a concentration of 0.25 μm. The mixture was then loaded into two dialysis cassettes (20,000 molecular weight cutoff, Thermo Scientific) that were immersed in 0.5 liter of the cold dialysis buffer and dialyzed at 4 °C for 24 h, with 3–4 changes of the buffer. During dialysis the volume of the suspension increased to 6 ml, resulting in a final concentration of 0.167 μm bc1 complex. However, only 0.05 μm of this enzyme was active, as determined by the extent of cytochrome c reduction obtained by rapid mixing of vesicles with DBH3 in the presence of antimycin using an Olis rapid scanning monochromator stopped flow spectrophotometer. Addition of detergent did not increase the amount of bc1 complex that was able to react with cytochrome c, indicating that all the reconstituted enzyme was oriented with cytochrome c1 protruding outside of the vesicles.
Preparation of DBH and Cytochrome c Reductase Assay
DBH was prepared from decyl ubiquinone as described (23) and quantified by UV spectroscopy using an extinction coefficient of 4.14 mm−1 cm−1 at 290 nm (24). The rate of cytochrome c reduction was measured in an Aminco DW2a double-beam spectrophotometer at 550–539 nm. The 2-ml reaction mixture consisted of the dialysis buffer supplemented with 2 mm MgCl2, 1 mm KCN, 15 μm cytochrome c, 30 μm DBH, and 40 μl of the reconstituted vesicles, such that the bc1 concentration in the reaction mixture was 3.34 nm.
Measurements of the Rate of Superoxide Generation
Rates of superoxide generation were measured by the Amplex® UltraRed-HRP assay (25). In this method superoxide is rapidly converted to hydrogen peroxide by a large excess of superoxide dismutase, whereas HRP couples the oxidation of hydrogen peroxide to the formation of the Amplex® UltraRed fluorescent oxidation product resorufin. The rate of formation of the fluorescent product was monitored with an Hitachi F3010 fluorescence spectrophotometer, using excitation and emission wavelengths of 526 and 590 nm, respectively.
The measurement of the rate of superoxide generation by the reconstituted bc1 complex presents a daunting challenge because DBH reduces cytochrome c directly, apparently generating a semiquinone radical that interacts with oxygen to produce superoxide, independent of the reaction catalyzed by the bc1 complex. The direct chemical reaction is enhanced in phospholipid vesicles and under some conditions could produce superoxide at a rate that far exceeds the rate of superoxide production by the bc1 complex (26). Moreover, the large scale changes in the absorption of cytochrome c during its reduction interfere with the fluorescence measurements, because both the excitation and emission spectra overlap the absorption spectra of reduced cytochrome c. Therefore, we devised an assay that overcomes these difficulties as described in the supplemental material.
Estimation of Membrane Potential, Δψ, the pH Gradient, ΔpH, and Protonmotive Force, Δp
We estimated the membrane potential that was generated by the reconstituted bc1 complex from the extent of fluorescence quenching of the positively charged fluorescence probe rhodamine 123 (27). The formation of a membrane potential, negative inside, by the bc1 complex proton translocation induces uptake of the probe into the phospholipid vesicles that contain the coupled bc1 complex, and the fluorescence of the probe inside the vesicle, which becomes highly concentrated, is quenched as shown in Fig. 2.
FIGURE 2.
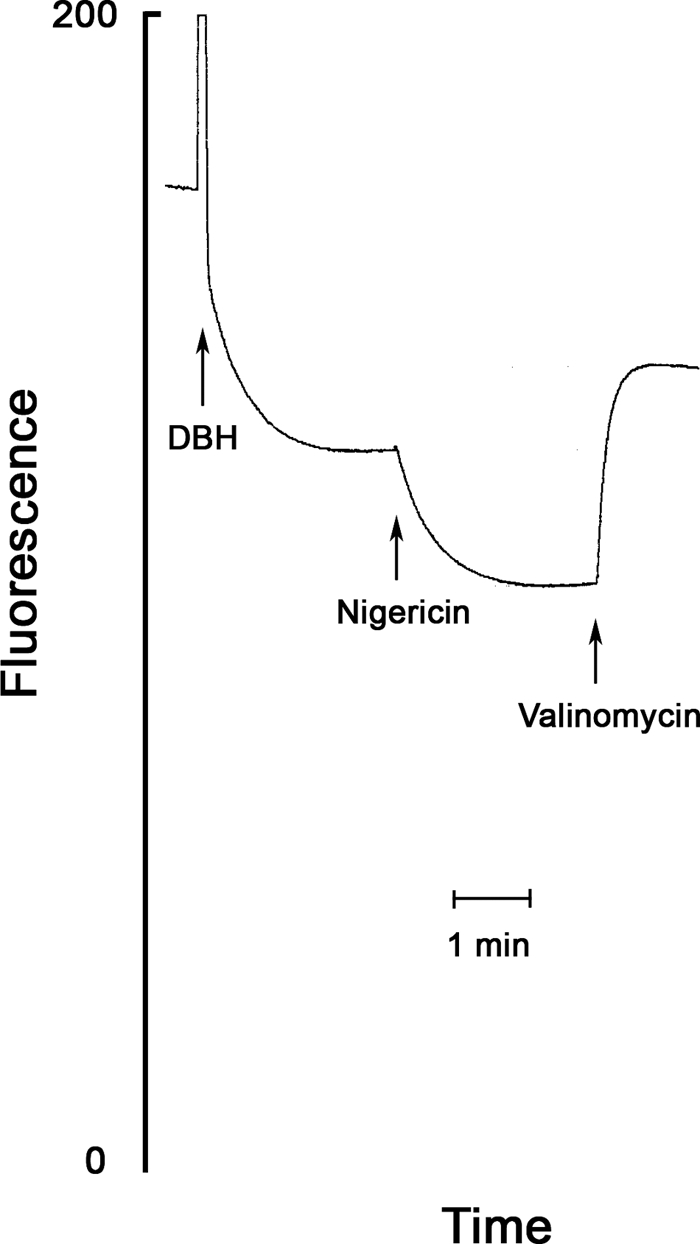
Determination of ΔΨ, ΔpH, and Δp generated by the reconstituted bc1 complex. The conditions are as in Fig. 4 except that superoxide dismutase, HRP, and the Amplex® reagent were omitted. First, 0.5 μm Rh123 was added, and the fluorescence followed (excitation, 504 nm; emission, 526 nm); second, 50 μm DBH was added, and after the quenching reached a stable value, nigericin (2 μg/ml) was added to collapse ΔpH. Finally, valinomycin (1 μg/ml) was added to collapse ΔΨ. Fluorescence quenching, Q, was calculated from the fluorescence before and after the addition of valinomycin. Q before addition of nigericin is a function of the bc1-generated ΔΨ; Q after the addition of nigericin is a function of the bc1-generated Δp, and the difference between the two Q values is a function of ΔpH (see text).
The magnitude of the fluorescence quenching is a function of the magnitude of the membrane potential. The generation of membrane potential by the bc1-catalyzed reduction of cytochrome c by DBH is associated with large changes in the absorption of cytochrome c that may interfere with measurement of the Rh123 fluorescence. Therefore, we selected an excitation wavelength that coincides with an isosbestic point in the cytochrome c reduced versus oxidized spectra (504 nm), and an emission wavelength that coincides with another isosbestic point (526 nm). After the addition of DBH, there is initial direct quenching of the probe and a slower quenching that results from the accumulation of the probe in the vesicles (Fig. 2).
To estimate the protonmotive force, we added 2 μg/ml nigericin. Nigericin catalyzes a K+/H+ exchange that collapses the pH gradient and thus allows the membrane potential to increase to the full magnitude of the protonmotive force. Nigericin only stimulated slightly the rate of cytochrome c reduction (see below), indicating that the magnitude of the protonmotive force is not significantly reduced by nigericin.
Finally, we added 1 μg/ml valinomycin that completely collapsed the membrane potential because of the high concentration of potassium in the assay medium (100 mm KCl). The collapse of the membrane potential induced a rapid release of the probe that was accumulated in the energized vesicles, and therefore the fluorescence that was measured immediately after the valinomycin-induced release was taken as the fluorescence in the absence of membrane potential. This protocol corrects for the direct quenching of Rh123 by DBH (see Fig. 2). The potential dependent quenching (Q) is calculated from the value of the fluorescence (F) before the addition of valinomycin (F−val) and the value after the addition of valinomycin (F+val) as shown in Equation 1,
Q calculated from the fluorescence before the addition of nigericin is a function of the membrane potential that is generated by the coupled bc1 complex, whereas Q calculated from the fluorescence after the addition of nigericin is a function of the protonmotive force that is generated by the coupled bc1 complex, and the difference between Q after the addition of nigericin and Q before the addition of nigericin is a function of ΔpH.
Although Q depends on the membrane potential, it is not a linear function of the membrane potential. Assuming that the positively charged probe reaches electrochemical equilibrium and that all the fluorescence of the probe that has been taken into the vesicles is quenched, the membrane potential can be estimated from the value of Q, provided that the internal volume of the coupled vesicles (Vi in μl/ml) is known (Equation 2).
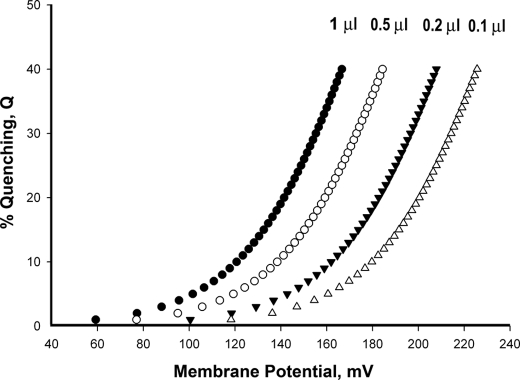
Fig. 3 shows the predicted relationships between Q and ΔΨ that would be obtained at different internal volumes as calculated from Equation 2. It is observed that in general Q increases exponentially with an increase in ΔΨ. Moreover, when the internal volume is very small, only high ΔΨ values would result in a measurable Q, and when the internal volume is large, even relatively low ΔΨ values would result in measurable Q. In our assay conditions (see Fig. 2), the predicted volume of the phospholipid vesicles is ∼0.5 μl/ml, i.e. ∼1 μl/mg phospholipid (28). However, only a fraction of the vesicles can be expected to have active-coupled bc1 complex. Indeed, when we incorporated the pH indicator pyranine into the phospholipid vesicles before reconstitution and monitored the change in pH that was induced by DBH, only a small fraction (15–20%) of the vesicle-trapped pyranine appeared to respond (results not shown). This suggests that the range of effective internal volume values is quite narrow, between 0.075 and 0.1 μl/ml, when the correction factor for the percent of vesicles that contains the coupled enzyme is applied. This allows us to provide reasonable estimates of the relative magnitude of membrane potential from the measurement of Q.
FIGURE 3.
Fluorescence quenching versus membrane potential. Calculated values of ΔΨ from the values of Q were measured as in Fig. 2 and the internal volumes of the bc1 vesicles, assuming that all the fluorescence of the accumulated probe is quenched (see Equation 2).
RESULTS
Respiratory Control and the Protonmotive Force of the Phospholipid-reconstituted bc1 Complex
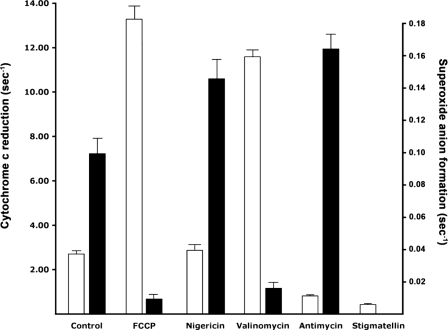
We reconstituted the isolated, detergent-solubilized bc1 complex into phospholipid vesicles composed of a mixture of soybean phospholipids and cholate. After 24 h of dialysis to remove most of the detergent, the rate of DBH reduction of cytochrome c catalyzed by the reconstituted complex, shown by the open bars in Fig. 4, was stimulated ∼5-fold (respiratory control) by the addition of the protonophore, FCCP, indicating that the reconstituted complex generates a large protonmotive force across the phospholipid membrane (Fig. 4). Addition of the ionophore valinomycin, which in the presence of 100 mm KCl can be expected to collapse completely ΔΨ but not ΔpH, stimulated cytochrome c reduction almost as much as FCCP, suggesting that ΔΨ is a major component of Δp in the bc1 vesicles. In contrast, nigericin, which collapses ΔpH, stimulated cytochrome c reduction only slightly, suggesting that nigericin induces an increase in ΔΨ almost equal to the collapsed ΔpH, thus retaining the magnitude of Δp in the bc1 vesicles (see also Fig. 2). Antimycin inhibited cytochrome c reduction but not completely, whereas the inhibition by stigmatellin was more complete. The residual cytochrome c reduction after stigmatellin addition can be attributed to the direct chemical reduction by DBH.
FIGURE 4.
Rates of cytochrome c reduction and superoxide anion generation by the reconstituted bc1 complex. The open bars show the rates of cytochrome c reduction in the freshly prepared phospholipid-reconstituted bc1 complex, which were calculated as described under “Experimental Procedures.” The reconstituted bc1 complex was suspended in 2 ml of the dialysis K+ buffer (3.34 pmol/ml) that was supplemented with 2 mm MgCl2, 1 mm KCN, 15 μm cytochrome c, and 20 μm DBH. FCCP concentration was 1 μm; valinomycin was 1 μg/ml; nigericin was 2 μg/ml; antimycin was 10 nm; and stigmatellin was 20 nm. The rates are the average values from six fresh preparations. The solid bars show the effect of ionophores and inhibitors on the rate of superoxide generation by freshly prepared reconstituted bc1 complex (measured as in supplemental Fig. S1). The bc1 complex (8.35 nm) was incubated with 2 mm MgCl2, 100 units of superoxide dismutase (SOD), 1 unit of HRP, 7.5 μm cytochrome c, 50 μm DBH; and the Amplex® UltraRed reagent was added to a concentration of 16.6 μm. Inhibitor and ionophore concentrations were the same as used to measure rates of cytochrome c reduction by the reconstituted complex. The results are the average of 4–6 preparations.
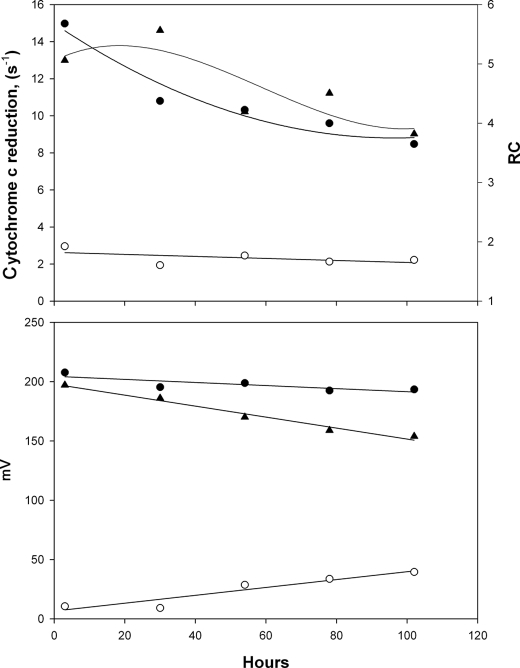
Reconstitution stabilized the bc1 complex so that it retained its activity for more than a week, provided it was kept in the cold (4 °C). Interestingly, after 24 h of storage the respiratory control first increased and then gradually decreased after prolonged storage, as shown in Fig. 5. To determine the magnitude of ΔΨ and ΔpH and the magnitude of the protonmotive force (i.e. ΔΨ + ΔpH), we measured the DBH-induced quenching of the Rh123 fluorescence (Fig. 2). Fig. 5 shows an example, from a typical preparation, of the changes in cytochrome c reduction rates, ΔΨ, ΔpH, and Δp over the course of several days. Freshly prepared phospholipid-reconstituted bc1 complex has relatively high membrane potential and low ΔpH, but over a period of several days of storage, membrane potential is decreased but ΔpH is increased. This suggests that the ion permeability of the liposomes increased slowly during storage.
FIGURE 5.
Changes in the coupling parameters of the vesicles during storage at 4 °C. The top panel shows the rate of cytochrome c reduction in control vesicles (empty circles), FCCP-stimulated reduction (closed circles), and respiratory control (triangles) as a function of storage time. The bottom panel shows ΔΨ (triangles), Δp (closed circles), and ΔpH (open circles) as a function of storage time. These values were calculated from the quenching of the fluorescence of Rh123 as described under “Experimental Procedures” and assuming an effective internal volume of 0.1 μl/ml. Conditions for the top panel were the same as in Fig. 4 and for the bottom panel as in Fig. 2.
The permeability of ions constrains the value of membrane potential that can be generated by the bc1 complex. However, as long as the proton permeability does not increase to the point that the proton leak rate is the same as the proton translocation rate, ΔpH will increase. Over time the proton permeability also increases, hence the gradual and slower decrease of the protonmotive force. Because Δp decreased after 24 h of storage, while respiratory control increased, we attribute the latter effect to the instability of a fraction of the bc1 complex that was absorbed on the surface of the liposomes but not fully inserted into the phospholipid bilayer. Apparently, proper reconstitution into the lipid bilayer stabilized the bc1 complex.
We followed respiratory control, ΔΨ, ΔpH, and Δp in five preparations of reconstituted bc1 complex over 4 days, and the results generally followed the pattern shown in Fig. 5. When we looked at the correlation between respiratory control (RC) and each of these parameters (i.e. ΔΨ, ΔpH, or Δp), there was a significant correlation between log(RC) and the calculated Δp, a much weaker and not significant correlation with ΔΨ, and no correlation with ΔpH. This is what is expected from well coupled proton translocation; the rate of translocation should be controlled by the protonmotive force but not by its components; the weak correlation with membrane potential resulted from the fact that ΔΨ is the major component of Δp, and with time they decline in parallel.
Superoxide Generation by the Phospholipid-reconstituted bc1 Complex
The coupled, reconstituted bc1 complex generated significant amounts of superoxide (supplemental Fig. S1). To find out how superoxide generation depends on the magnitude of ΔΨ, ΔpH, or Δp, we measured the effect of FCCP, nigericin, and valinomycin on the rate of superoxide generation in freshly prepared bc1 vesicles. As shown by the solid bars in Fig. 4, FCCP and valinomycin strongly inhibited the rate of superoxide generation, and nigericin stimulated superoxide generation. Because valinomycin collapses ΔΨ but not ΔpH, and nigericin collapses ΔpH while increasing ΔΨ (but not Δp), it is apparent that the rate of superoxide generation depends strongly only on the magnitude of ΔΨ, with no evidence that either ΔpH or Δp has any effect on superoxide generation. Fig. 4 also shows the effect of antimycin on the rate of superoxide generation. The value obtained from the antimycin-inhibited bc1 complex, which is arguably the maximal rate of superoxide generation that can be expected in the native bc1 complex, is not much higher than that observed in the coupled bc1 complex, particularly in the presence of nigericin.
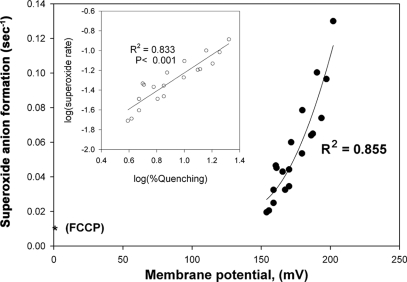
To further evaluate the effects of ΔΨ, ΔpH, and Δp on superoxide generation, we followed the changes in these parameters (as in Fig. 5) in parallel with the rates of superoxide generation over several days in five different preparations of reconstituted bc1 complex. As can be predicted from Fig. 4, only the Q value before the addition of nigericin, which is a function of the magnitude of ΔΨ that is generated by the coupled bc1 complex, exhibits a statistically significant correlation with the rate of superoxide generation (Fig. 6, inset). The rate of superoxide generation did not correlate with ΔpH and only very weakly with Δp, because the latter was correlated with ΔΨ (results not shown).
FIGURE 6.
Superoxide generation as a function of membrane potential. Superoxide anion was measured as in Fig. 4. The inset shows the correlation between the rate of superoxide generation and Q, the fluorescence quenching induced by ΔΨ. The results are from five preparations of reconstituted bc1 complex measured each day for 4 days after the preparation. The membrane potential was calculated from Q using Equation 2, assuming an effective internal volume of 0.1 μl/ml. The asterisk shows the value in the presence of FCCP.
The inset in Fig. 6 demonstrates clearly that the rate of superoxide generation by the coupled bc1 complex is a function of ΔΨ, whereas Fig. 6 shows the dependence of the rate of superoxide generation on ΔΨ, as calculated from Q, based on Equation 2 (as in Fig. 3). We estimated the effective volume of reconstituted vesicles as 0.1 μl, after correcting for the percent of vesicles that contain coupled enzyme, but different values of internal volume would only shift the curve to the left or right and would not change the shape of the curve. We also included in this plot the values measured at high FCCP concentration (ΔΨ = 0). It is evident that below a certain threshold (120–150 mV) very little superoxide is generated by the bc1 complex, and that superoxide generation increases exponentially with ΔΨ. Notably, this voltage threshold is comparable with the increment in potentials of the bL and bH hemes.
Effect of Diffusion Potential on the Rate of Generation of Superoxide
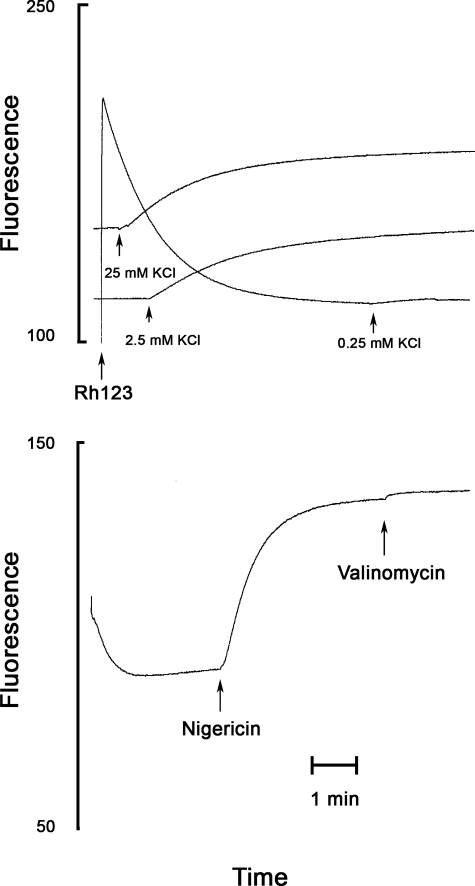
To be able to generate a K+ diffusion potential, we prepared the phospholipid vesicles as usual in a K+-rich medium (100 mm), but after 20 h of dialysis of the bc1-reconstituted vesicles in K+ buffer, we dialyzed the reconstituted bc1 complex against Na+ buffer to replace all of the K+ outside the vesicles with Na+. The Na+-suspended vesicles retained their activity and respiratory control but increased their rate of superoxide production nearly 2-fold (Table 1). This was apparently due to the formation of a diffusion potential, negative inside, by the K+ concentration gradient. Indeed, the addition of Rh123 to the Na+-suspended vesicles resulted in a strong quenching of the fluorescence following the initial high fluorescence (Fig. 7). Addition of KCl to the medium restored the fluorescence to its initial value, indicating that the quenching resulted from a K+ diffusion potential. Nigericin catalyzed the efflux of K+ from the vesicles and thus collapsed the diffusion potential, and that resulted in enhanced fluorescence.
TABLE 1.
Effect of potassium diffusion potential and nigericin on the rate of superoxide generation
The rate of superoxide generation in K+-loaded, Na+-washed vesicles in K+ and Na+ medium (other conditions as in Fig. 4).
| Conditions | Rate of superoxide generation |
|---|---|
| s−1 ± S.E. | |
| K+ medium | 0.085 ± 0.008 |
| Na+ medium (103 mm) | 0.137 ± 0.017 |
| K+ medium + nigericin | 0.138 ± 0.014 |
| Na+ medium + nigericin | 0.107 ± 0.007 |
FIGURE 7.
Formation of a K+ diffusion potential. The top panel shows a suspension in a Na+ buffer of K+-loaded, Na+-washed phospholipid-reconstituted bc1 vesicles. The fluorescence of the Rh123 probe is quenched after it is added to the suspension. The quenching is reversed by the sequential additions of 0.25, 2.5, and 25 mm KCl, indicating the existence of a K+ diffusion potential. The bottom panel shows that nigericin also reverses the fluorescence quenching in a Na+ buffer as it induces the efflux of K+ from the vesicles and thus collapses the diffusion potential.
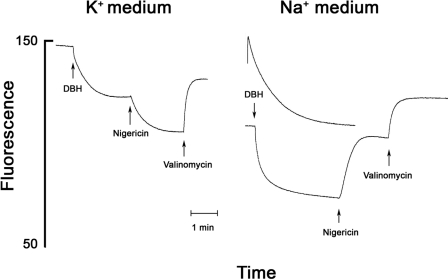
DBH oxidation by Na+-suspended vesicles also generated membrane potential and thus further increased fluorescence quenching (Fig. 8). In K+-suspended vesicles nigericin increased the quenching (Fig. 8, left panel, and Fig. 2), but in Na+ buffer nigericin enhances the fluorescence because it collapsed the diffusion potential (as in Fig. 7). Valinomycin, which catalyzed the electrogenic influx of K+, collapsed the bc1-generated membrane potential (Fig. 8). In the Na+ buffer superoxide generation was nearly twice as fast as when the vesicles were suspended in K+ buffer (Table 1), reflecting the contribution of the K+ diffusion potential. In Na+ buffer nigericin inhibited superoxide production, in contrast to its effect in K+ buffer where nigericin stimulated superoxide production (Table 1 and Fig. 4).
FIGURE 8.
Formation of a K+ diffusion potential and its effect on DBH-generated Δp. The left panel shows that when the K+-loaded, Na+-washed vesicles are suspended in a K+ buffer there is no quenching until the addition of DBH, and nigericin enhances the quenching, which is reversed by valinomycin (see Fig. 2). The right panel shows that when the K+-loaded, Na+-washed vesicles are suspended in Na+ medium there is strong quenching of Rh123 fluorescence before the addition of DBH (see Fig. 7), and DBH further increases the quenching. In this case nigericin partially reverses the quenching as it collapses the K+ diffusion potential (see Fig. 7), but only valinomycin collapses the DBH-generated membrane potential.
These contrasting effects resulted from the different effects of nigericin on ΔΨ in K+ and Na+ medium. In K+ medium nigericin increased ΔΨ (see Figs. 2 and 8), and in Na+ medium nigericin decreased the K+ diffusion potential (Fig. 8). In a Na+ medium where there is a large K+ concentration gradient (K+in ≫ K+out), nigericin catalyzes the electroneutral efflux of K+ that collapses the K+ gradient and hence the diffusion potential. In high K+ medium, where there is no K+ gradient, nigericin catalyzes electroneutral uptake of K+, driven by the pH gradient. The collapse of the pH gradient allows ΔΨ to increase. The effect of the K+ diffusion potential on the rate of superoxide generation and the contrasting effects of nigericin in Na+ and K+ medium lend further support to the conclusion that the magnitude of ΔΨ greatly affects the rate of superoxide generation by the bc1 complex.
DISCUSSION
Protonmotive Force Generated by the Reconstituted bc1 Complex
In previous studies of the reconstituted bc1 complex, the coupling was evaluated by the determination of the proton/electron stoichiometry (29, 30). To the extent that the measured stoichiometry deviates from the mechanistic stoichiometry, such determination can reveal what fraction of the electron transport activity arises from the bc1 complex that is not coupled. However, it is not a sensitive measure of the degree of coupling of the reconstituted bc1 complex (31).
In this study we attempted to determine, for the first time, the magnitude of the protonmotive force that is generated by the bc1 complex reconstituted into liposomes. Although there is some uncertainty in the values calculated from the fluorescence quenching of Rh123, the fact that such massive quenching is obtained with a very small volume of coupled vesicles suggests that Δp in the coupled vesicles is quite high. Considering that it is very likely that not all the detergent is removed by the dialysis, which would increase the membrane permeability, it is likely that the magnitude of Δp in these vesicles is constrained by the phospholipid membrane permeability of protons and not by the intrinsic degree of coupling of the bc1 complex. It would be of interest to find whether there are differences between bc1 complexes from different organisms in the degree of coupling and whether there are mutants that exhibit a lower degree of coupling than that observed with the native bc1 complex from yeast.
Superoxide Generation by the Purified bc1 Complex
Most previous studies of superoxide generation by the isolated, detergent-solubilized bc1 complex did not yield measurable rates of superoxide generation except in the presence of cytochrome b inhibitors (13–18). As we show here, the rates of superoxide generation in the coupled bc1 complex in the absence of any inhibitors are an order of magnitude higher than that of the uncoupled complex and at high membrane potential approach the rates that were obtained with antimycin. Moreover, the protocol that we developed here, and that can be applied also to the detergent-solubilized complex, allows measurements of superoxide generation even when the rates are below that of the chemical reaction.
Membrane Potential Dependence of Superoxide Generation by Reconstituted bc1 Complex
A central finding of this study, with important implications regarding the mechanism of superoxide generation by the bc1 complex, is that membrane potential alone and not the protonmotive force determines the rate of superoxide production. Not only was the correlation between membrane potential and superoxide generation rate much stronger than that with the protonmotive force, but nigericin, which increases membrane potential but not protonmotive force, also increased rather than decreased the rate of superoxide production.
Respiratory control correlated with the protonmotive force more strongly than with the membrane potential. This is expected because it is the coupling of electron transfer to proton transport that inhibits electron transfer when the protonmotive force is high. Although one cannot assign this inhibition to any specific step in the Q cycle, it must involve steps associated with proton translocation. But the inhibition of superoxide generation can be assigned, on the basis of these results, to the only transmembrane electrogenic step in the Q cycle, electron transfer from heme bL to heme bH. This result confirms the suggestion that superoxide is generated at center P because of the formation of a semiquinone anion that shares an electron with heme bL (Fig. 1).
Contribution of the bc1 Complex to Superoxide Generation by Mitochondria in Situ
Several recent studies of superoxide generation suggested that the bc1 complex does not contribute significantly to superoxide generation by mitochondria. This conclusion was based on the results of experiments with various metabolic substrates and electron transport inhibitors (9, 32). The most persuasive observation that led to this conclusion is that under conditions that favor reverse electron transport through complex I there is a very rapid generation of superoxide. Under conditions that allow electron transport through the bc1 complex, but not reverse electron transport through complex I, there was relatively slow generation of superoxide. However, it is not clear that the conditions that result in a high rate of superoxide generation by complex I (i.e. reverse electron transport) actually exist in the cell under most circumstances.
In the reconstituted bc1 complex we obtained a superoxide formation (“leak”) rate of 3.68%. Applying this value to the state 4 electron transfer rate of mitochondria, e.g. ∼40 nmol/mg protein·min, yields a rate of ∼1472 pmol/mg protein·min. This predicted value is comparable with the high rates of superoxide production by intact mitochondria that were attributed to reverse electron transport through complex I or to the bc1 complex in the presence of antimycin (9), and were also reported recently to be generated by the bc1 complex in rat mitochondria from several tissues (33).
An important feature of superoxide generation by the bc1 complex is that it is generated in the mitochondrial intermembrane space, in contrast to most other sources of mitochondrial superoxide that are located in the matrix. It is therefore unlikely that bc1-generated superoxide is a major contributor to free radical damage to mtDNA and matrix proteins. However, the bc1 complex is likely to be a major contributor to free radical damage in other cell compartments and is also likely to signal superoxide generation to these compartments. Indeed, several recent studies suggest that the free radicals that are generated by the mitochondria serve as a signal to initiate different pathways in the cell, and most of these studies implicate the bc1 complex as the source of the signal (34–39). Moreover, it appears that the magnitude of the superoxide signal that originates in the intermembrane space can be enhanced by modulating the intermembrane space concentration of superoxide dismutase (40) or cytochrome c (41). In conclusion, the results of this study provide the first direct evidence that the coupled bc1 complex generates superoxide at a rate that depends strongly on the magnitude of the membrane potential. These results also suggest that at high membrane potential the bc1 complex is a major contributor to the generation of superoxide by mitochondria.
Supplementary Material
This work was supported, in whole or in part, by National Institutes of Health Grant GM 20379.

The on-line version of this article (available at http://www.jbc.org) contains supplemental Fig. S1.
- DBH
- decyl ubiquinone
- HRP
- horseradish peroxidase
- Rh123
- rhodamine 123
- Q
- ubiquinone
- FCCP
- carbonyl cyanide p-trifluoromethoxyphenylhydrazone.
REFERENCES
- 1.Saraste M. (1999) Science 283, 1488–1493 [DOI] [PubMed] [Google Scholar]
- 2.Adam-Vizi V. (2005) Antioxid. Redox. Signal. 7, 1140–1149 [DOI] [PubMed] [Google Scholar]
- 3.Murphy M. P. (2009) Biochem. J. 417, 1–13 [DOI] [PMC free article] [PubMed] [Google Scholar]
- 4.Beckman K. B., Ames B. N. (1998) Physiol. Rev. 78, 547–581 [DOI] [PubMed] [Google Scholar]
- 5.Zoccarato F., Cavallini L., Deana R., Alexandre A. (1988) Biochem. Biophys. Res. Commun. 154, 727–734 [DOI] [PubMed] [Google Scholar]
- 6.Hansford R. G., Hogue B. A., Mildaziene V. (1997) J. Bioenerg. Biomembr. 29, 89–95 [DOI] [PubMed] [Google Scholar]
- 7.Chen Q., Vazquez E. J., Moghaddas S., Hoppel C. L., Lesnefsky E. J. (2003) J. Biol. Chem. 278, 36027–36031 [DOI] [PubMed] [Google Scholar]
- 8.Liu Y., Fiskum G., Schubert D. (2002) J. Neurochem. 80, 780–787 [DOI] [PubMed] [Google Scholar]
- 9.Muller F. L., Liu Y., Abdul-Ghani M. A., Lustgarten M. S., Bhattacharya A., Jang Y. C., Van Remmen H. (2008) Biochem. J. 409, 491–499 [DOI] [PubMed] [Google Scholar]
- 10.Korshunov S. S., Skulachev V. P., Starkov A. A. (1997) FEBS Lett. 416, 15–18 [DOI] [PubMed] [Google Scholar]
- 11.Brand M. D., Buckingham J. A., Esteves T. C., Green K., Lambert A. J., Miwa S., Murphy M. P., Pakay J. L., Talbot D. A., Echtay K. S. (2004) Biochem. Soc. Symp. 71, 203–213 [DOI] [PubMed] [Google Scholar]
- 12.Lambert A. J., Brand M. D. (2004) Biochem. J. 382, 511–517 [DOI] [PMC free article] [PubMed] [Google Scholar]
- 13.Wenz T., Covian R., Hellwig P., Macmillan F., Meunier B., Trumpower B. L., Hunte C. (2007) J. Biol. Chem. 282, 3977–3988 [DOI] [PubMed] [Google Scholar]
- 14.Muller F., Crofts A. R., Kramer D. M. (2002) Biochemistry 41, 7866–7874 [DOI] [PubMed] [Google Scholar]
- 15.Muller F. L., Roberts A. G., Bowman M. K., Kramer D. M. (2003) Biochemistry 42, 6493–6499 [DOI] [PubMed] [Google Scholar]
- 16.Forquer I., Covian R., Bowman M. K., Trumpower B. L., Kramer D. M. (2006) J. Biol. Chem. 281, 38459–38465 [DOI] [PubMed] [Google Scholar]
- 17.Cape J. L., Bowman M. K., Kramer D. M. (2007) Proc. Natl. Acad. Sci. U.S.A. 104, 7887–7892 [DOI] [PMC free article] [PubMed] [Google Scholar]
- 18.Dröse S., Brandt U. (2008) J. Biol. Chem. 283, 21649–21654 [DOI] [PubMed] [Google Scholar]
- 19.Ljungdahl P. O., Pennoyer J. D., Robertson D. E., Trumpower B. L. (1987) Biochim. Biophys. Acta 891, 227–241 [DOI] [PubMed] [Google Scholar]
- 20.Snyder C., Trumpower B. L. (1998) Biochim. Biophys. Acta 1365, 125–134 [DOI] [PubMed] [Google Scholar]
- 21.Yu C. A., Yu L., King T. E. (1972) J. Biol. Chem. 247, 1012–1019 [PubMed] [Google Scholar]
- 22.Berden J. A., Slater E. C. (1970) Biochim. Biophys. Acta 216, 237–249 [DOI] [PubMed] [Google Scholar]
- 23.Trumpower B. L., Edwards C. A. (1979) J. Biol. Chem. 254, 8697–8706 [PubMed] [Google Scholar]
- 24.Rich P. R. (1984) Biochim. Biophys. Acta 768, 53–79 [DOI] [PubMed] [Google Scholar]
- 25.Zhou M., Diwu Z., Panchuk-Voloshina N., Haugland R. P. (1997) Anal. Biochem. 253, 162–168 [DOI] [PubMed] [Google Scholar]
- 26.Zhang L., Yu L., Yu C. A. (1998) J. Biol. Chem. 273, 33972–33976 [DOI] [PubMed] [Google Scholar]
- 27.Emaus R. K., Grunwald R., Lemasters J. J. (1986) Biochim. Biophys. Acta 850, 436–448 [DOI] [PubMed] [Google Scholar]
- 28.Katz Y., Diamond J. M. (1974) J. Membr. Biol. 17, 87–100 [DOI] [PubMed] [Google Scholar]
- 29.Leung K. H., Hinkle P. C. (1975) J. Biol. Chem. 250, 8467–8471 [PubMed] [Google Scholar]
- 30.Yang X. H., Trumpower B. L. (1988) J. Biol. Chem. 263, 11962–11970 [PubMed] [Google Scholar]
- 31.Rottenberg H. (1979) Biochim. Biophys. Acta 549, 225–253 [DOI] [PubMed] [Google Scholar]
- 32.Kudin A. P., Malinska D., Kunz W. S. (2008) Biochim. Biophys. Acta 1777, 689–695 [DOI] [PubMed] [Google Scholar]
- 33.Tahara E. B., Navarete F. D., Kowaltowski A. J. (2009) Free Radic. Biol. Med. 46, 1283–1297 [DOI] [PubMed] [Google Scholar]
- 34.Bell E. L., Klimova T. A., Eisenbart J., Moraes C. T., Murphy M. P., Budinger G. R., Chandel N. S. (2007) J. Cell Biol. 177, 1029–1036 [DOI] [PMC free article] [PubMed] [Google Scholar]
- 35.Guzy R. D., Mack M. M., Schumacker P. T. (2007) Antioxid. Redox. Signal. 9, 1317–1328 [DOI] [PubMed] [Google Scholar]
- 36.Klimova T., Chandel N. S. (2008) Cell Death Differ. 15, 660–666 [DOI] [PubMed] [Google Scholar]
- 37.Lin X., David C. A., Donnelly J. B., Michaelides M., Chandel N. S., Huang X., Warrior U., Weinberg F., Tormos K. V., Fesik S. W., Shen Y. (2008) Proc. Natl. Acad. Sci. U.S.A. 105, 174–179 [DOI] [PMC free article] [PubMed] [Google Scholar]
- 38.Banfi C., Brioschi M., Barbieri S. S., Eligini S., Barcella S., Tremoli E., Colli S., Mussoni L. (2009) J. Thromb. Haemost. 7, 206–216 [DOI] [PubMed] [Google Scholar]
- 39.Soberanes S., Urich D., Baker C. M., Burgess Z., Chiarella S. E., Bell E. L., Ghio A. J., De Vizcaya-Ruiz A., Liu J., Ridge K. M., Kamp D. W., Chandel N. S., Schumacker P. T., Mutlu G. M., Budinger G. R. (2009) J. Biol. Chem. 284, 2176–2186 [DOI] [PMC free article] [PubMed] [Google Scholar]
- 40.Kawamata H., Manfredi G. (2008) Hum. Mol. Genet. 17, 3303–3317 [DOI] [PMC free article] [PubMed] [Google Scholar]
- 41.Zhao Y., Wang Z. B., Xu J. X. (2003) J. Biol. Chem. 278, 2356–2360 [DOI] [PubMed] [Google Scholar]
Associated Data
This section collects any data citations, data availability statements, or supplementary materials included in this article.


