Abstract
Microvascular endothelial cell (EC) expression of tumor necrosis factor receptor (TNFR) 2 is induced in situ by ischemia/reperfusion injury. To assess effects of molecular oxygen on TNFR2 expression, we subjected cultured human dermal microvascular ECs (HDMECs) to hypoxic conditions (1% O2) or to hypoxic conditions followed by return to normoxic conditions. TNFR2 mRNA and protein are expressed under normoxic conditions but are rapidly reduced by hypoxia; they fall even further upon reoxygenation but rebound by 6–9 h. TNFR1 expression is unaffected by hypoxia or reoxygenation in these same cells. We identified a potential FOXO3a binding site in the 5′ enhancer region of the TNFR2 gene. FOXO3a from normoxic but not hypoxic HDMECs binds an oligonucleotide sequence matching this site, and the endogenous enhancer binds FOXO3a at this site in HDMECs under normoxic but not hypoxic conditions. Unphosphorylated FOXO3a is present in the nucleus of HDMECs under normoxic conditions. Hypoxia leads to FOXO3a phosphorylation at an Akt/protein kinase B target site and subsequent nuclear export; these processes are reversed by reoxygenation and blocked by LY294002, a phosphatidylinositol 3-kinase inhibitor that blocks Akt activation. LY294002 also prevents the hypoxia-mediated decrease in TNFR2 expression. Transiently transfected FOXO3a activates a TNFR2 promoter/reporter construct in HDMECs, whereas small interference RNA knockdown of FOXO3a reduces TNFR2 but not TNFR1 expression under normoxic conditions. Reduction in TNFR2 by small interference RNA sensitizes HDMECs to TNFR1-mediated apoptosis. We conclude that FOXO3a regulates oxygen-dependent changes in expression of TNFR2 in HDMECs, controlling sensitivity to TNF-mediated apoptosis.
TNF2 is an important mediator of inflammatory disorders such as rheumatoid arthritis, psoriasis, and inflammatory bowel disease (1–3). Many of the actions of TNF target microvascular endothelial cells (ECs) (4). However, the net biological effects on these cells are complex and variable. For example, under certain circumstances, TNF may induce EC apoptosis while at other times it may promote EC proliferation and angiogenesis (5, 6). Some of this complexity may be explained by time-dependent alterations in signaling complexes. For example, TNF may promote activation of NF-κB within 10 min and switch over to activation of c-Jun N-terminal kinase and p38 MAPK (7) in a response that is also self-limited. After a lag of several hours, TNF may promote autocatalytic activation of pro-caspase 8, initiating an apoptotic signaling pathway (8, 9). However, caspase 8 activation may be opposed by genes that are induced by NF-κB such as c-FLIP (10). Further complexities in the response may be attributed to the existence of two distinct TNF receptors, TNFR1 (CD120a), which initiates the pathways just described, and TNFR2 (CD120b), which initiates a PI3K/Akt signaling pathway via recruitment and activation of endothelial/epithelial tyrosine kinase (11, 12). Overexpression of TNFR2 in ECs also activates NF-κB, but ligand binding to the endogenous receptor does not appear to do so (13–15). TNFR1 may also activate PI3K/Akt but appears to do so more indirectly, e.g. via generation of sphingosine 1-phosphate, which, in turn, engages a G protein-coupled receptor on ECs (16). Once activated, Akt (also known as protein kinase B) can inhibit apoptosis by several mechanisms, including the phosphorylation of the FOXO3a transcription factor, which is then excluded from the cell nucleus (17). This response is thought to be protective, because several known genes controlled by FOXO3a contribute to apoptosis through either mitochondrial or TNFR1-dependent pathways (18). The role of FOXO3a may be more nuanced than originally thought. Like p53, it may contribute to genome repair and cell cycle arrest and, only if these fail, initiate apoptosis (19). We have recently described another layer of regulation of TNF responses, namely differential control of TNFR1 and TNFR2 expression (20). In healthy human kidney specimens, TNFR1 is expressed mainly on microvascular and glomerular ECs, whereas TNFR2 expression is barely detectable on any cell type. Following ischemia/reperfusion injury, TNFR1 expression is lost from ECs, being replaced by the structurally related protein death receptor 3 (DR3), and TNFR2 is induced on both ECs and renal tubular epithelial cells (21). These alterations in protein levels are correlated with changes in mRNA expression, suggesting that receptor levels are controlled at the level of gene transcription. Treatment of renal organ cultures with TNF or with TL1A, the ligand of DR3, can mimic the changes in TNFR1 and TNFR2 mRNA and protein levels seen in ischemia/reperfusion injury (22). However, we have not observed regulation of TNFR1 or TNFR2 by TNF or TL1A in cultured ECs.
We are particularly interested in the one or more pathways by which TNFR2 expression is regulated, because selective engagement of this receptor by a mutated form of TNF that is incapable of binding TNFR1 exhibits little of the pro-apoptotic properties of the wild-type cytokine but retains at least some of the protective effects. We have chosen to begin our investigation of TNFR2 expression in the well characterized culture system of human dermal microvascular ECs (HDMECs). HDMECs, like most other cultured cells, express both TNFR1 and TNFR2 under standard culture conditions. As an initial approach to investigate ischemia/reperfusion injury, we manipulated the oxygen tension of the culture system, going from normoxia to hypoxia and back again. Here we report that hypoxia leads to a fall in TNFR2 mRNA with a further fall followed by a rebound upon reoxygenation. We present evidence that these changes in TNFR2 transcription are in part controlled by FOXO3a and that TNFR2 mediates cytoprotective effects in HDMECs.
EXPERIMENTAL PROCEDURES
Tissue Culture
HDMECs were isolated by the cell culture core of the Yale Skin Disease Research Center from discarded skin under a protocol approved by the Yale Human Investigation Committee and cultured in EGM-2 medium supplemented with EGM-2® MV singleQuots (Lonza, Walkersville, MD) as described (23). Experiments were conducted with cells at passage levels 2–4. To create conditions of hypoxia and reoxygenation, passaged HDMECs were seeded at low density and cultured for 2 days at room air plus 5% CO2 to a density of ∼50–60% visual confluence and then transferred to 1% O2 and 5% CO2 in a controlled environment chamber (Proox model C21, Biopherix, Redfield, NY) for up to 6 h as indicated in the text. Reoxygenation was achieved by transferring the cultures back to 21% O2 plus 5% CO2 for up to 12 h as indicated in the text. Where indicated, Ly294002 (20 μm, Sigma-Aldrich) or an equivalent volume of DMSO (Sigma, vehicle control) was added 15 min prior to exposure to hypoxia. At the end of the experiment, cells were fixed and analyzed by immunofluorescence microscopy or were harvested by adding lysis buffer directly on ice and analyzed by immunoblotting, chromatin immunoprecipitation (ChIP), or oligonucleotide binding as indicated in the text.
Transfections
To knock down gene expression, HDMECs were transfected separately with FOXO3a siRNA duplexes (Sigma), designated as siRNA1 (5′-CUCUGAACUCCCUACGCCATT-3′), siRNA2 (5′-UUAACAGCACGGTGTTCGGTT-3′), or siRNA3 (5′-GAAUGAUGGGCUGACUGAATT-3′), or with control siRNA (Qiagen Allstar control siRNA) using Lipofectamine 2000 and incubated 48 h before experimentation. The final concentration of siRNA was 60 pmol/ml. The same procedure was used to knock down TNFR2 using a validated siRNA (Santa Cruz Biotechnology, Santa Cruz, CA). For assays of reporter genes, HDMECs were cotransfected using nucleoelectroporation (Amaxa, Inc., Gaithersburg, MD) with either pGL-FOXO/pCMV-HA-FOXO3A or pGL-HIF/pCMV-HA-FOXO3A (control) as well as with pSVβgal (as an internal efficiency control, Promega, Madison, WI) at the point when the cells were at 95% visual confluence, and cells were trypsinized for nucleoelectroporation. The pGL-FOXO reporter gene was constructed by inserting a 156-bp PCR segment (from −882 to −1038) of the TNFR2 5′-flanking region into the KpnI/BglII site of the pGL3 vector. The PGL-HIF reporter gene, used as a control, was constructed by inserting a 140-bp PCR segment (from −596 to −736) of the TNFR2 5′-flanking region into the KpnI/BglII site of the pGL3 vector. The pCMV-HA-FOXO3a expression vector was constructed by cutting HA-FOXO3A from pECE-HA-FOXO3A (Addgene Inc., Cambridge, MA) and transferring to pCDNA3.0 (Invitrogen). The activity of luciferase was detected after 48 h incubation using a luciferase assay kit (Promega) according to the manufacturer's instructions. The results of both siRNA knockdown and of plasmid expression were confirmed by immunoblotting or fluorescence-activated cell sorting analysis as described (23) using a mouse anti-human TNFR2 antibody (ABCAM clone MR2, catalog no. Ab8161).
Immunoblotting
Antibodies used for immunoblotting included: anti-hsTNFR2 (R&D System, catalog no. MAB226, Minneapolis, MN), anti-TNFR1 (Santa Cruz Biotechnology, catalog no. sc-8436), anti-β-actin (Sigma), anti-Foxo3a (Cell Signaling, catalog no. 9467, Boston, MA), anti-phospho-Foxo3a (Cell Signaling, catalog no. 9466S), and goat anti-goat or rabbit IgG-conjugated fluorescein isothiocyanate or Texas Red (Santa Cruz Biotechnology). At times indicated in the text, HDMECs were harvested with trypsin (Invitrogen) and washed three times with ice-cold PBS. Lysis buffer (50 mm Tris-HCl, pH 7.5, 10% of glycerol, 1% of Triton X-100, 300 mm NaCl, 150 mm KCl, 5 mm EDTA, 1 mm dithiothreitol, 0.5 mm Na3VO4, 10 mm NaF, 10 mm iodoacetamide, and protease inhibitors) or SDS gel buffer with β-mercaptoethanol (Laemmli sample buffer, Bio-Rad, Hercules, CA) was then added, and the lysates were cleared of debris by centrifugation. Total protein concentration of the clarified lysates was determined using Bradford reagent as described by the manufacturer (Bio-Rad). 80 μg of total protein/sample was subjected to 4–15% gradient SDS-PAGE and electrophoretically transferred to polyvinylidene difluoride membranes. Protein blots on the membrane were identified by using specific primary antibodies followed by horseradish peroxidase-conjugated anti-IgG secondary antibodies in blocking buffer. Images were obtained by chemiluminescence on x-ray film using ECL reagents (LumiGLO Reserve Chemiluminescent substrate kit, KPL, Gaithersburg, MD).
ChIP Analyses
Isolated HDMECs were cross-linked by addition of 3% formaldehyde. Genomic DNA was sheared by sonication and purified by using the Nuclear/Cytosol Fractionation kit (BioVision, catalog no. k266-25, Dublin, OH). Anti-FOXO3a antibody was used to pull down complexes of FOXO3a-binding DNA (Chromatin Immunoprecipitation Assay Kit, Upstate). PCR amplification of the precipitated DNA was conducted with one set of primers that flank a putative FOXO3a binding site in the 5′-flanking region of the TNFR2 gene: forward (5′-GAGCAGGGAAGTGCAGAGTC-3′) and backward (5′-ATGTTGTCCAGGCTGGTCTC-3′). Control primers flanked a putative FOXO3a binding sequence located in the first intron: forward (5′-GCGCTGGAGTTAGATCCCTA-3′) and backward (5′-GGAGCAATCTGCCACTCTTC-3′).
Biotinylated Oligonucleotide Precipitation Assays
DNA binding by proteins in HDMEC lysates was examined using a biotinylated double-stranded oligonucleotide (24) containing a FOXO3a binding motif sequence, 5′-CCTGTGAGAAGGCTGGATGCGTGTTTAAGGATAAATGAACACGCGAAGAGTAGTAACAACAGCCAAGATTTATAAATGCCTATTGTTATATATGTAGATACTTACTTAAGTATATATAAAGTACAGACTGCATTATGTATATTACATATCTTTAAA-3′ (sense strand), as well as a control biotinylated double-stranded oligonucleotide containing a HIF-binding motif sequence, 5′-CTCTAGAGTCTAAACAGGCCGAGTGCAGTGGCTCACACCTATAATCCCAGCACCTTGGGAGGCCAGAGGCGGGAAGATCACTTGAGGGTGGGAAGAACACGTGAGCTCAGGAGTTCGAGACCAGCCTGGACAACATGGCG-3′ (sense strand). The DNA and target protein complexes were pulled down using streptavidin agarose. Beads were washed, boiled, and centrifuged. The supernatants were then subjected to immunoblotting blot to detect FOXO3a.
Immunofluorescence Microscopy
HDMEC cultures grown on coverslips were fixed in methanol/acetone (1:1) for 20 min at −20 °C. Anti-TNFR2 antibody (R&D Systems) or Anti-Foxo3a antibody (Cell Signaling) were separately added (1:200 in 10% goat serum in PBS) and incubated overnight at 4 °C. Goat anti-goat or rabbit IgG-conjugated fluorescein isothiocyanate or Texas Red (1:200) were added, and the mixture was incubated 45 min at room temperature. The coverslips were washed with PBS and air-dried. Slide covers were sealed with anti-fade solution containing 4′,6-diamidino-2-phenylindole for nuclear identification (H1200, Vector Laboratories, Burlingame, CA). Slides were viewed on a fluorescence microscope (Nikon, Japan).
Cytotoxicity Assays
HDMECs were plated into 100- × 20-mm tissue culture dishes and allowed to grow to confluence. Confluent cultures were transfected with an siRNA for TNFR2 or a control siRNA as described above and allowed to rest for 48 h. Cells were then passaged into 24-well plates for TNF and cycloheximide (CHX) cytotoxicity assays. Cells were either untreated or treated with 10 μg/ml CHX (Calbiochem) and with a variable concentration of TNF, as indicated, for 18 h. Floating HDMECs were collected and pooled with residual attached HDMECs suspended by trypsin treatment. The pooled HDMECs were washed once in PBS and resuspended in PBS containing propidium iodide (50 μg/ml, Sigma). The percentage of cell death was determined by fluorescence-activated cell sorting analysis using FloJo Software (TreeStar, Ashland OR).
Statistical Analysis
Where indicated, multigroup comparisons were analyzed by analysis of variance. Cytotoxicity data were analyzed by using a paired t-test.
RESULTS
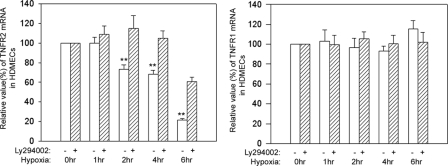
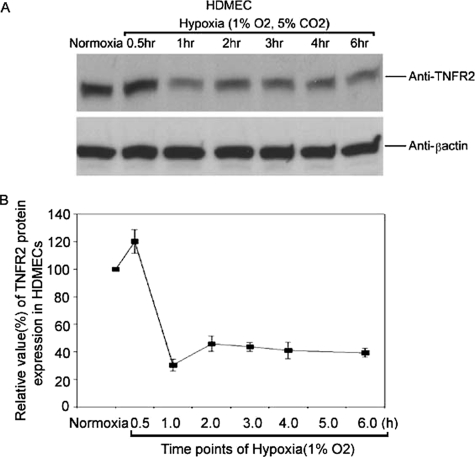
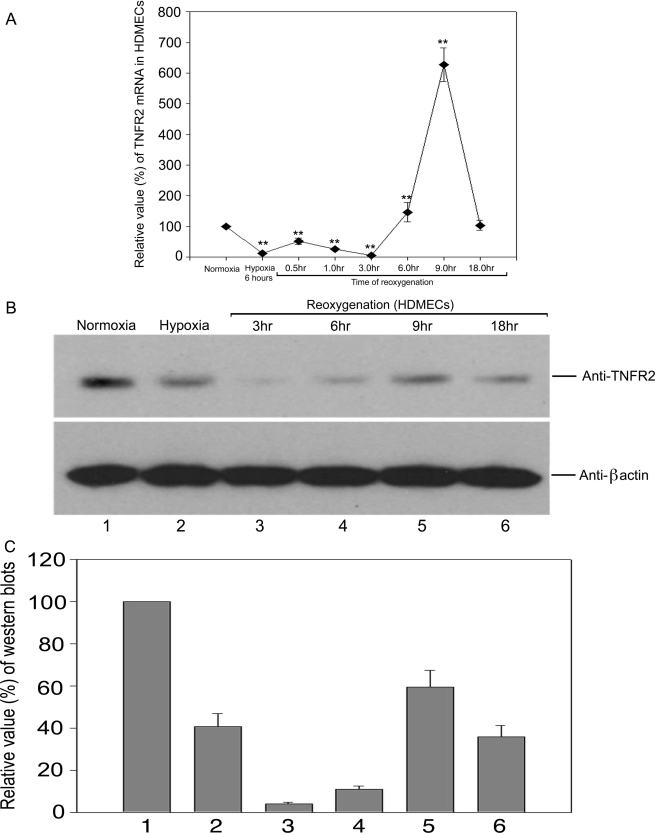
To elucidate the mechanism of altered TNFR2 expression induced in vivo by ischemia/reperfusion injury, we analyzed the response of cultured human microvascular ECs to changes in oxygen tension using the well studied HDMEC culture system. Under “normoxic” culture conditions (21% O2), we found that HDMECs express TNFR2 mRNA and protein as detected by quantitative reverse transcription-PCR and immunoblotting, respectively (Figs. 1 and 2). Upon reduction of O2 to 1%, both TNFR2 mRNA and protein expression fell within 30–60 min. After 6 h of hypoxia, TNFR2 remained at reduced levels. When the cells were then restored to normoxic conditions, TNFR2 mRNA initially fell further and then reappeared by 3–6 h, peaked at 9 h at levels above control cultures not exposed to hypoxia, and then returned to pre-hypoxic levels (Fig. 3). TNFR2 protein re-expression followed that of mRNA but did not appear to overshoot levels in normoxic controls. TNFR1 mRNA and protein levels were unaffected by hypoxia or by reoxygenation (Fig. 1 and data not shown), indicating that this is not a global effect on gene expression in HDMECs.
FIGURE 1.
Effects of hypoxia on TNFR1 and R2 mRNA levels. HDMECs were incubated for 2 days, grown to 50–60% confluence, and then subjected to hypoxia (1% O2) for the times indicated above in the presence or absence of the PI3K inhibitor Ly294002. Cells were then harvested, and specific TNFR1 and -R2 mRNA levels were quantified by quantitative reverse transcription-PCR as described under “Experimental Procedures.” Note that hypoxia causes a reduction of TNFR2 (significant reductions at p < 0.05 at 2, 4, and 6 h) but not TNFR1 mRNA and that this fall in mRNA is largely inhibited by blocking the PI3K/Akt pathway. Data represent one of two experiments with similar results, although the kinetics varied slightly between the two experiments.
FIGURE 2.
Effects of hypoxia on TNFR2 protein levels. HDMECs were treated as in Fig. 1, and TNFR2 protein was analyzed by immunoblotting as described under “Experimental Procedures.” A chemiluminescence image is shown in A, and a densitometric quantitation of the same image is shown in B. Note that protein levels fall to ∼40% of the levels in normoxic cells. Data represent one of three experiments with similar results, although the kinetics varied slightly among different experiments.
FIGURE 3.
Effects of hypoxia and reoxygenation on TNFR2 mRNA and protein levels. HDMECs were subjected to hypoxia followed by reoxygenation and TNFR2 mRNA (A) and protein (B and C) were quantified as in Figs. 1 and 2. Note that mRNA levels recover sooner than those of protein, which actually fall further upon reoxygenation, and that mRNA but not protein levels transiently overshoot the levels in normoxic cells. Data represent one of three experiments with similar results, although the kinetics varied among different experiments. TNFR2 mRNA was significantly reduced by 6 h (p < 0.05). Levels remained significantly lower (p < 0.05) until 6 h of re-oxygenation whereby they significantly increased by 9 h and returned to baseline by 18 h.
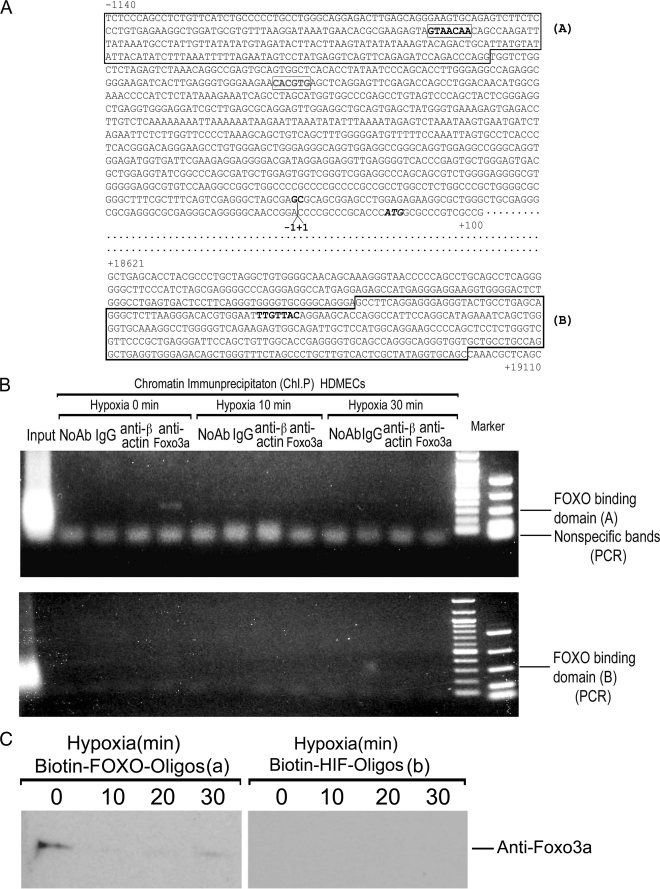
Because changes in mRNA levels generally correlated with alterations in protein expression (although the kinetics varied among different experiments), we considered the hypothesis that TNFR2 expression might be mediated by oxygen tension through control of gene transcription. We analyzed the 5′-flanking region of the TNFR2 gene for the presence of possible oxygen regulatory sequences and identified a potential FOXO3a binding site at position −1011 (Fig. 4A). We then performed ChIP analysis and found this site to be occupied by FOXO3a in HDMECs cultured under normoxic conditions and that occupancy was lost as early as 10 min of exposure to hypoxia (Fig. 4B). A second potential FOXO3a binding site located in the coding region of the gene was not occupied by FOXO3a in either normoxic or hypoxic HDMECs. The findings of our ChIP analysis were supported by an oligonucleotide binding assay in which FOXO3a could be pulled down using the relevant but not an irrelevant (putative HIF-1 binding) sequence from normoxic but not hypoxic HDMECs (Fig. 4C).
FIGURE 4.
FOXO3a binding to the 5′-flanking region of the TNFR2 gene. A, partial sequence of the human TNFR2 gene (19), including potential FOXO3a binding sites in the 5′-flanking region and in the first intron (bolded); sequences surrounding these sites that are amplified for ChIP studies are boxed and labeled as A and B. Additional highlighted sequences are a potential HIF-1 binding site in the 5′-flanking region, the transcriptional start site, and the ATG translational start codon. B, ChIP analysis as described under “Experimental Procedures” demonstrating that the candidate FOXO3a binding sequence is occupied in HDMECs by FOXO3a under normoxic conditions but not hypoxic conditions while the potential binding site in the first exon is not occupied by FOXO3a under either set of culture conditions. ChIP with antibody to β-actin is used as a negative specificity control. One of two experiments with similar results. C, oligonucleotide binding analysis of extracts from HDMECs subjected to various times of ischemia as described under “Experimental Procedures.” Note that FOXO3a from normoxic but not hypoxic cells (left panels) binds to the putative FOXO3a binding site and does not bind to an irrelevant DNA sequence (right panels). Data represent one of two experiments with similar results.
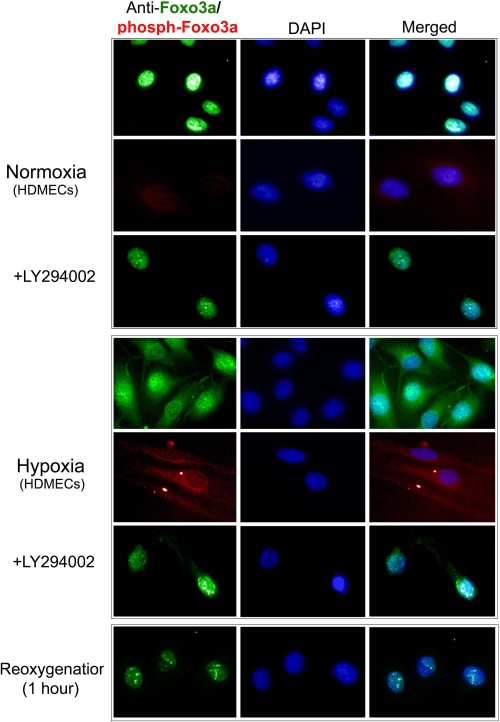
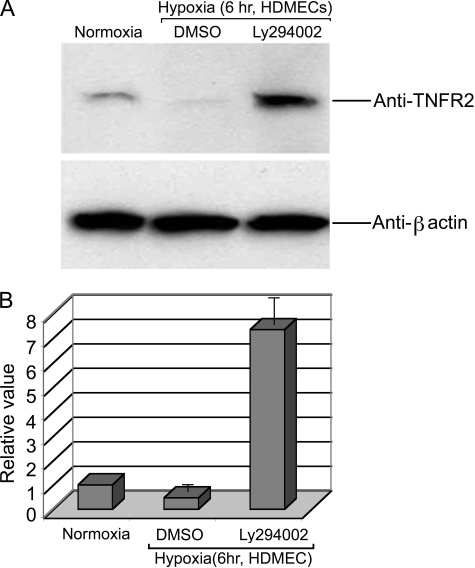
In other cell systems, regulation of FOXO3a is mediated by Akt-catalyzed phosphorylation, which leads to nuclear export and sequestration in the cytosol (25). To determine if this mechanism is operational in HDMECs, we examined the subcellular location of FOXO3a in HDMECs under normoxic and hypoxic conditions (Fig. 5). We observed that FOXO3a is localized to the nucleus, identified by 4′,6-diamidino-2-phenylindole costaining, in normoxic cells, but is translocated to the cytosol under hypoxic conditions. Reoxygenation leads to re-localization to the nucleus. Only cytosolic FOXO3a under hypoxic conditions appears to be phosphorylated by Akt, detected with a phospho-FOXO3a-specific antibody, and prevention of the activation of Akt with the PI3K inhibitor Ly294002 prevents hypoxia-induced export of FOXO3a from the nucleus. Ly294002 also prevents the reduction of TNFR2 mRNA (Fig. 1) and protein expression (Fig. 6) observed in hypoxic conditions.
FIGURE 5.
Effects of hypoxia and reoxygenation on immunofluorescence microscopic localization of FOXO3a and phosphoFOXO3a in cultured HDMECs. Most FOXO3a is in the nucleus (identified by 4′,6-diamidino-2-phenylindole (DAPI) staining, row 1) and is minimally phosphorylated at its Akt target site (row 2) under normoxic conditions. The presence of the PI3K inhibitor Ly294002 has no detectable effect (row 3) on FOXO3a localization under normoxic conditions. Most FOXO3a translocates to the cytosol (row 4) and becomes phosphorylated at its Akt target site (row 5) in response to hypoxia; the translocation is blocked by the presence of Ly294002 (row 6). Reoxygenation of hypoxic cells restores the nuclear localization of FOXO3a (row 7). Data represent one of two experiments with similar results.
FIGURE 6.
Effects of PI3K inhibition on the response to hypoxia. A, Ly294002 treatment prevents the hypoxia-induced decline of TNFR2 protein levels in cultured HDMECs as assessed by immunoblotting. B, densitometric quantitation of the chemiluminescence results in panel A. Note that, in this experiment, PI3K inhibition actually leads to a superinduction of TNFR2 expression. Data represent one of four experiments with similar results.
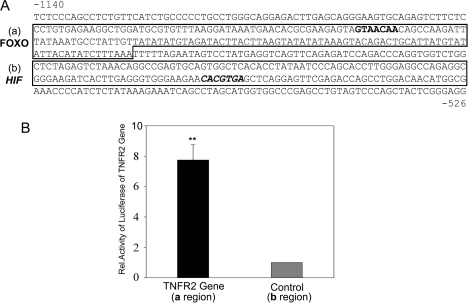
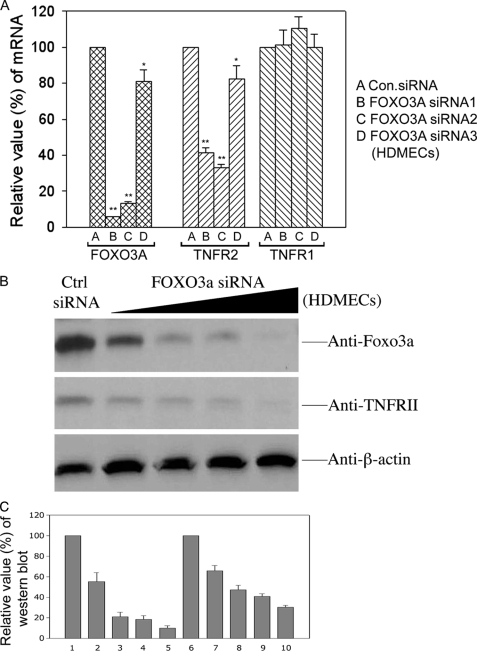
In the next series of experiments, we examined if FOXO3a could directly control the transcription of TNFR2 in HDMECs under normoxic conditions. First, we transiently transfected HDMECs with two TNFR2 promoter-reporter genes (using the sequences identified in Fig. 7A) and cotransfected both a FOXO3a expression vector and a control expression vector or only the control vector. Overexpression of exogenous FOXO3a increased the expression level of the TNFR2 promoter-reporter gene containing the FOXO3a binding element but had no effect on the expression of the TNFR2 promoter-reporter gene lacking the FOXO3a binding site (Fig. 7B). Finally, we reduced the expression of endogenous FOXO3a using siRNA. Two siRNAs that efficiently reduced FOXO3a expression in HDMECs efficiently reduced TNFR2 mRNA, whereas a third siRNA that was less effective at reducing FOXO3a less effectively reduced TNFR2 mRNA (Fig. 8A). None of the three siRNAs nor a control siRNA had any effect on TNFR1 mRNA. TNFR2 protein was proportionately reduced to the knockdown of FOXO3A protein (Fig. 8B).
FIGURE 7.
Effects of FOXO3a overexpression on the response of TNFR2 promoter-reporter genes. A, partial sequence of the 5′-flanking region of the human TNFR2 gene, identifying regions containing the FOXO3a binding element (box (a)) and a putative HIF-1 binding element (box (b)) used to construct promoter-luciferase reporter genes as described under “Experimental Procedures.” B, FOXO3a overexpression induces an increase in luciferase activity, corrected for transfection efficiency, in a promoter-reporter construct incorporating the FOXO3a binding element but not the putative HIF-1 binding element in transiently transfected HDMECs. Data represent one of three experiments with similar results.
FIGURE 8.
Effect of siRNA knock down of FOXO3a on expression of endogenous TNFR1 and TNFR2 in HDMECs. A, comparison of the effects of three different siRNA sequences that target FOXO3a on mRNA expression levels of FOXO3a, TNFR2, and TNFR2. These results were highly significant (p < 0.05) for both the FOXO3a and TNFR2 mRNA with the exception of “D” in the TNFR2 group. There was no reduction in FOXO3a expression on TNFR1 expression. Data represent one of three experiments with similar results. B, effect of a FOXO3a siRNA sequence (siRNA3 in panel A) on both FOXO3a and TNFR2 protein expression; note the co-ordinate reduction with increasing siRNA concentration. C, densitometric quantitation of the chemiluminescence image in panel B.
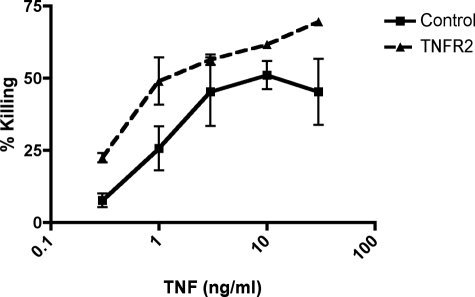
In a final series of experiments, we asked if reduction of TNFR2 expression as caused by hypoxia could affect the response of HDMECs to TNF. In pilot experiments, we had observed that hypoxia produces a global inhibition of cytokine-induced protein synthesis, which would confound any simple interpretation. Therefore, we chose instead to reduce expression of TNFR2 by means of siRNA transfection and then to assess the response to killing of HDMECs by the combination of TNF plus CHX. This response is known to be mediated by TNF binding to TNFR1, and we thus asked if the absence of TNFR2 would increase EC injury as had been observed in vivo (13). In three of three experiments, we observed an increase in the sensitivity of HDMECs to killing by TNF proportional in each case to the extent of knock down of TNFR2 on the cell surface (Fig. 9 and data not shown).
FIGURE 9.
Cytotoxicity assay of siRNA-transfected HDMEC treated with CHX and TNF. Data represent percent killing as assessed by propidium iodide staining of HDMECs transfected with either siRNA to TNFR2 and/or siRNA control. TNFR2-deficient cells were more sensitive to killing by CHX and TNF with significant reductions in cell death (p < 0.05) at 0.3 and 10 ng/ml TNF. The knockdown of TNFR2 by siRNA was 72% in this experiment as assessed by fluorescence-activated cell sorting analysis as compared with control siRNA. Reduction in killing proportional to TNFR2 reduction was observed in two other experiments.
DISCUSSION
Our siRNA results, oligonucleotide binding data, ChIP data, and reporter gene experiments collectively establish that TNFR2 transcription in cultured HDMECs depends upon FOXO3a under normoxic conditions. Our immunofluorescence experiments, oligonucleotide binding data, ChIP data, and pharmacological inhibition experiments indicate that TNFR2 transcription is down-regulated in response to hypoxia through PI3K/Akt-mediated phosphorylation and nuclear export of FOXO3a. Furthermore, we observe a further fall in expression upon reoxygenation followed by rebound of expression. The mechanism for further rapid reduction of mRNA upon reoxygenation is unclear and implies that there must be additional levels of regulation. The delayed rebound appears related to reappearance of dephosphorylated FOXO3a in the nuclear compartment. FOXO3a may be phosphorylated by several different kinases, including Akt, SGK, CK1, DYRK1A, and Ral (26). We believe that our data are most consistent with an Akt response, because the phospho-FOXO3a species detected with our antibody is directed toward the species that is generated by Akt (phosphorylated on Ser residue 253) and because the generation of this species was blocked by preventing the activation of Akt through inhibition of PI3K. The inhibition of FOXO3a function by its phosphorylation represents an adaptive response to hypoxia, inhibiting the transcription of target genes known to contribute to apoptosis (27). Consistent with this interpretation, it has recently been reported that adenovirally transduced overexpression of FOXO3a in cultured human umbilical vein ECs leads to increased expression of several TNF pathway genes that contribute to apoptosis, including TNF itself, TANK, and TTRAP. TNF treatment of these modified cells led to diminished NF-κB signaling and increased JNK signaling, contributing to cell death (28). The induction of TNFR2 transcription by FOXO3a in HDMECs reported here, which was not described in human umbilical vein ECs, appears to defy this pattern, because this receptor is principally linked to cell survival and proliferation, largely through activation of PI3K and Akt. In other words, the induction of TNFR2 by FOXO3a likely represents a negative feedback loop leading to the activation of a pathway that inhibits FOXO3a function. Reduction of TNFR2 by siRNA knockdown does render HDMECs more sensitive to TNFR1-mediated killing, consistent with this idea. It is our experience3 that hypoxic regulation of FOXO3a is more pronounced in HDMECs than in human umbilical vein ECs, although the basis of this difference is unclear.
The transcriptional control of TNFR2 is incompletely understood. As noted earlier, we have observed induction of TNFR2 in organ culture in response to TNF and to TL1A (20, 29). The TNF response appears to be mediated through TNFR2, as assessed by the response to receptor-specific mutein forms of TNF (20), and the response to TL1A occurs in mouse kidney tissue harvested from DR3-deficient mice (29), DR3 being the only known receptor for TL1A. In both cases, the induction of TNFR2 was not reduced by effective pharmacological inhibition of NF-κB activation (29). In addition to the FOXO3a site we have identified in this study, there are a number of other potential regulatory sequences in the 5′-flanking region of the human (30) and mouse (31) TNFR2 gene, including motifs for binding of transcription factors T cell factor 1, Ikaros, AP-1, CK-2, interleukin-6 receptor E, ISRE, GAS, NF-κB, Sp1, CREB, Yi, and YY1. One previous report (32) examined the response of TNFR2 in murine NIH 3T3 cells to hypoxia and reoxygenation. These investigators saw an increase in expression but ruled out a role for HIF-1 or HIF-2 and instead identified a response to NF-interleukin-6. We do not understand the basis of the differences between the response of HDMECs and murine 3T3 cells, but they could be species- and/or cell type-dependent. No previous reports have implicated a role for forkhead family transcriptional control of TNFR2 in any cell type.
In summary, we have described a novel pathway of regulation of TNFR2 expression in cultured HDMECs involving PI3K, Akt, and the FOXO3a transcription factor. Nuclear FOXO3a drives TNFR2 in normoxic conditions, and its inactivation by hypoxia results in reduced expression of this receptor. Because FOXO3a mediates EC apoptosis and TNFR2 mediates resistance to apoptosis, this pathway could function as a negative feedback loop.
This work was supported, in whole or in part, by National Institutes of Health Grant HL36003.
B. Ding and J. S. Pober, unpublished observations.
- TNF
- tumor necrosis factor
- TNFR
- TNF receptor
- DR3
- death receptor 3
- EC
- endothelial cell
- HDMEC
- human dermal microvascular EC
- MAPK
- mitogen-activated protein kinase
- PI3K
- phosphatidylinositol 3-kinase
- ChIP
- chromatin immunoprecipitation
- siRNA
- small interference RNA
- PBS
- phosphate-buffered saline
- CHX
- cycloheximide.
REFERENCES
- 1.Pober J. S., Cotran R. S. (1990) Physiol. Rev. 70, 427–451 [DOI] [PubMed] [Google Scholar]
- 2.Bradley J. R. (2008) J. Pathol. 214, 149–160 [DOI] [PubMed] [Google Scholar]
- 3.Danese S., Dejana E., Fiocchi C. (2007) J. Immunol. 178, 6017–6022 [DOI] [PubMed] [Google Scholar]
- 4.Hoffmann G., Schloesser M., Czechowski M., Schobersberger W., Fürhapter C., Sepp N. (2004) Exp. Dermatol. 13, 113–119 [DOI] [PubMed] [Google Scholar]
- 5.Deshpande S. S., Angkeow P., Huang J., Ozaki M., Irani K. (2000) FASEB J. 14, 1705–1714 [DOI] [PubMed] [Google Scholar]
- 6.Grethe S., Coltella N., Di Renzo M. F., Pörn-Ares M. I. (2006) Biochem. Biophys. Res. Commun. 347, 781–790 [DOI] [PubMed] [Google Scholar]
- 7.Yamanaka Y., Abu-Amer Y., Faccio R., Clohisy J. C. (2006) J. Orthop. Res. 24, 1349–1357 [DOI] [PubMed] [Google Scholar]
- 8.Qin Z. H., Wang Y., Kikly K. K., Sapp E., Kegel K. B., Aronin N., DiFiglia M. (2001) J. Biol. Chem. 276, 8079–8086 [DOI] [PubMed] [Google Scholar]
- 9.Wang L., Du F., Wang X. (2008) Cell 133, 693–703 [DOI] [PubMed] [Google Scholar]
- 10.Schattenberg J. M., Galle P. R., Schuchmann M. (2006) Liver Int. 26, 904–911 [DOI] [PubMed] [Google Scholar]
- 11.He Y., Luo Y., Tang S., Rajantie I., Salven P., Heil M., Zhang R., Luo D., Li X., Chi H., Yu J., Carmeliet P., Schaper W., Sinusas A. J., Sessa W. C., Alitalo K., Min W. (2006) J. Clin. Invest. 116, 2344–2355 [DOI] [PMC free article] [PubMed] [Google Scholar]
- 12.Takada Y., Aggarwal B. B. (2004) J. Immunol. 173, 1066–1077 [DOI] [PubMed] [Google Scholar]
- 13.Luo D., Luo Y., He Y., Zhang H., Zhang R., Li X., Dobrucki W. L., Sinusas A. J., Sessa W. C., Min W. (2006) Am. J. Pathol. 169, 1886–1898 [DOI] [PMC free article] [PubMed] [Google Scholar]
- 14.Haridas V., Darnay B. G., Natarajan K., Heller R., Aggarwal B. B. (1998) J. Immunol. 160, 3152–3162 [PubMed] [Google Scholar]
- 15.Seitz C., Muller P., Krieg R. C., Mannel D. N., Hehlgans T. (2001) J. Biol. Chem. 276, 19390–19395 [DOI] [PubMed] [Google Scholar]
- 16.De Palma C., Meacci E., Perrotta C., Bruni P., Clementi E. (2006) Arterioscler. Thromb. Vasc. Biol. 26, 99–105 [DOI] [PubMed] [Google Scholar]
- 17.Rena G., Woods Y. L., Prescott A. R., Peggie M., Unterman T. G., Williams M. R., Cohen P. (2002) EMBO J. 21, 2263–2271 [DOI] [PMC free article] [PubMed] [Google Scholar]
- 18.Lee H. H., Dadgostar H., Cheng Q., Shu J., Cheng G. (1999) Proc. Natl. Acad. Sci. U.S.A. 96, 9136–9141 [DOI] [PMC free article] [PubMed] [Google Scholar]
- 19.Tran H., Brunet A., Grenier J. M., Datta S. R., Fornace A. J., Jr., DiStefano P. S., Chiang L. W., Greenberg M. E. (2002) Science 296, 530–534 [DOI] [PubMed] [Google Scholar]
- 20.Al-Lamki R. S., Wang J., Vandenabeele P., Bradley J. A., Thiru S., Luo D., Min W., Pober J. S., Bradley J. R. (2005) FASEB J. 19, 1637–1645 [DOI] [PubMed] [Google Scholar]
- 21.Cornell L. D., Smith R. N., Colvin R. B. (2008) Annu. Rev. Pathol. 3, 189–220 [DOI] [PubMed] [Google Scholar]
- 22.Al-Lamki R. S., Wang J., Thiru S., Pritchard N. R., Bradley J. A., Pober J. S., Bradley J. R. (2003) Am. J. Pathol. 163, 401–411 [DOI] [PMC free article] [PubMed] [Google Scholar]
- 23.Kluger M. S., Shiao S. L., Bothwell A. L., Pober J. S. (2002) J. Immunol. 168, 2091–2095 [DOI] [PubMed] [Google Scholar]
- 24.Hata A., Seoane J., Lagna G., Montalvo E., Hemmati-Brivanlou A., Massagué J. (2000) Cell 100, 229–240 [DOI] [PubMed] [Google Scholar]
- 25.Krol J., Francis R. E., Albergaria A., Sunters A., Polychronis A., Coombes R. C., Lam E. W. (2007) Mol. Cancer Ther. 6, 3169–3179 [DOI] [PubMed] [Google Scholar]
- 26.Van Der Heide L. P., Hoekman M. F., Smidt M. P. (2004) Biochem. J. 380, 297–309 [DOI] [PMC free article] [PubMed] [Google Scholar]
- 27.Mandinova A., Lefort K., Tommasi di Vignano A., Stonely W., Ostano P., Chiorino G., Iwaki H., Nakanishi J., Dotto G. P. (2008) EMBO J. 27, 1243–1254 [DOI] [PMC free article] [PubMed] [Google Scholar]
- 28.Lee H. Y., Youn S. W., Kim J. Y., Park K. W., Hwang C. I., Park W. Y., Oh B. H., Park Y. B., Walsh K., Seo J. S., Kim H. S. (2008) Arterioscler. Thromb. Vasc. Biol. 28, 112–120 [DOI] [PubMed] [Google Scholar]
- 29.Al-Lamki R. S., Wang J., Tolkovsky A. M., Bradley J. A., Griffin J. L., Thiru S., Wang E. C., Bolton E., Min W., Moore P., Pober J. S., Bradley J. R. (2008) J. Am. Soc. Nephrol. 19, 953–960 [DOI] [PMC free article] [PubMed] [Google Scholar]
- 30.Santee S. M., Owen-Schaub L. B. (1996) J. Biol. Chem. 271, 21151–21159 [DOI] [PubMed] [Google Scholar]
- 31.Seitz C., Männel D. N., Hehlgans T. (1998) Genomics 48, 111–116 [DOI] [PubMed] [Google Scholar]
- 32.Hehlgans T., Seitz C., Lewis C., Männel D. N. (2001) J. Interferon Cytokine Res. 21, 757–762 [DOI] [PubMed] [Google Scholar]


