

Abstract
The role of 14-3-3 proteins in the regulation of FOXO forkhead transcription factors is at least 2-fold. First, the 14-3-3 binding inhibits the interaction between the FOXO and the target DNA. Second, the 14-3-3 proteins prevent nuclear reimport of FOXO factors by masking their nuclear localization signal. The exact mechanisms of these processes are still unclear, mainly due to the lack of structural data. In this work, we used fluorescence spectroscopy to investigate the mechanism of the 14-3-3 protein-dependent inhibition of FOXO4 DNA-binding properties. Time-resolved fluorescence measurements revealed that the 14-3-3 binding affects fluorescence properties of 5-(((acetylamino)ethyl)amino) naphthalene-1-sulfonic acid moiety attached at four sites within the forkhead domain of FOXO4 that represent important parts of the DNA binding interface. Observed changes in 5-(((acetylamino)ethyl)amino) naphthalene-1-sulfonic acid fluorescence strongly suggest physical contacts between the 14-3-3 protein and labeled parts of the FOXO4 DNA binding interface. The 14-3-3 protein binding, however, does not cause any dramatic conformational change of FOXO4 as documented by the results of tryptophan fluorescence experiments. To build a realistic model of the FOXO4·14-3-3 complex, we measured six distances between 14-3-3 and FOXO4 using Förster resonance energy transfer time-resolved fluorescence experiments. The model of the complex suggests that the forkhead domain of FOXO4 is docked within the central channel of the 14-3-3 protein dimer, consistent with our hypothesis that 14-3-3 masks the DNA binding interface of FOXO4.
The forkhead family of transcription factors shares a highly conserved 100-amino acid large DNA-binding domain (DBD)2 or FOX (Forkhead box) domain. The FOX proteins display large functional diversity and play a wide range of roles in a number of physiological and pathological processes (1–3). Among the forkhead family, the FOXO class consists of four members (FOXO1, FOXO3, FOXO4, and FOXO6) that play a central role in cell cycle control, differentiation, metabolism control, stress response, and apoptosis (4–6). Transcriptional activity of FOXO proteins is regulated through the insulin-phosphatidylinositol 3-kinase-AKT/protein kinase B (PKB) signaling pathway. The AKT/PKB-mediated phosphorylation triggers phosphorylation of additional sites by casein kinase-1 and dual specificity tyrosine-regulated kinase-1A and induces FOXO binding to the 14-3-3 protein. This in turn both promotes the nuclear export of the resulting complex and inhibits the nuclear import of FOXO, probably by interfering with the function of its nuclear localization signal (NLS) (7–11). In addition to phosphorylation, the function of FOXO proteins is further controlled by other types of posttranslational modifications, including acetylation and ubiquitination (12, 13).
The AKT/PKB-dependent phosphorylation of FOXO proteins generates two 14-3-3 binding sites. First motif is located close to the N terminus of FOXO molecule and the second one at the C terminus of DBD (Fig. 1A). It has been shown that simultaneous use of both 14-3-3 binding motifs is necessary for optimal FOXO binding to the 14-3-3 proteins (7, 10, 14). These two motifs border the DBD, raising the possibility that the 14-3-3 proteins could participate in the disruption of FOXO binding to the DNA. Such 14-3-3 protein-dependent inhibition of DNA binding has been suggested for DAF-16 (Caenorhabditis elegans FOXO homologue) and FOXO4 (9, 14). However, the exact mechanism of this 14-3-3-dependent inhibition of FOXO binding to DNA is still unclear. Since the second AKT/PKB motif is embedded in the C-terminal part of DBD, also known as the wing W2, the 14-3-3 protein can interfere with the binding of this region to DNA, mask other parts of the FOXO DNA binding interface, or change the conformation of the forkhead domain core.
FIGURE 1.

Structure of the FOXO4 transcription factor. A, schematic representation of primary structure of FOXO4 protein. TA domain, transactivation domain; NES, nuclear export sequence. Black vertical bars denote locations of 14-3-3 protein binding sites. B, locations of AEDANS attachment sites (serines that were replaced by cysteines) and tryptophan residues within the structure of FOXO DBD. The serine residue at position 92 is missing. The crystal structure of the FOXO3a DBD·DNA complex was used to create this figure (27). Residues are numbered according to FOXO4 sequence.
To better understand the mechanism of 14-3-3-dependent regulation of FOXO function, we investigated which regions of FOXO4 DBD, apart from the C-terminal phosphorylated motif, physically interact with 14-3-3ζ protein. We labeled four different sites within the FOXO4 DBD (N-terminal region, C-terminal wing W2, and both sides of helix H3) with the extrinsic fluorophore 1,5-IAEDANS and used methods of time-resolved fluorescence spectroscopy to study the interaction between FOXO4 and the 14-3-3ζ protein. Our results suggest that the 14-3-3ζ protein physically interacts with all four tested regions of DBD that represent important parts of its DNA binding interface. Such interactions probably mask the DNA binding interface, thus blocking the FOXO4 binding to the target DNA. The 14-3-3ζ protein binding, however, does not cause any dramatic conformational change of FOXO4, as documented by the results of tryptophan fluorescence experiments. To build a realistic model of the FOXO4·14-3-3ζ complex, we measured six distances between 14-3-3ζ and FOXO4 using Förster resonance energy transfer (FRET) time-resolved fluorescence experiments. The model of the complex suggests that the forkhead domain of FOXO4 is docked within the central channel of the 14-3-3 protein dimer, consistent with our hypothesis that the 14-3-3 protein masks the DNA binding interface of FOXO4.
EXPERIMENTAL PROCEDURES
Expression, Purification, and Phosphorylation of FOXO4
All mutants of FOXO4 (sequences 11–213 and 82–207) were generated using the QuikChange kit (Stratagene). All mutations were confirmed by sequencing. Both wild type and all mutants of FOXO4-(11–213) and FOXO4-(82–207) were expressed, purified, and phosphorylated as described previously (11, 15). The completeness of the phosphorylation reaction was checked using MALDI-TOF mass spectrometry.
Mass Spectrometric Analysis of FOXO4
Samples were first separated by 12% SDS-PAGE, and excised protein bands were digested with trypsin endoprotease (Promega) directly in gel with cysteine modification by iodoacetamide (16). The resulting peptide mixtures were extracted and loaded on a MALDI-TOF target with α-cyano-4-hydroxy-cinnamic acid as matrix, and positively/negatively charged spectra were acquired on a BIFLEX mass spectrometer (Bruker-Daltonics, Bremen, Germany) with internal calibration using the monoisotopic [M + H]+/[M − H]− ions of the FOXO4 peptides with known sequence, as described previously (11).
Labeling of FOXO411–213 and FOXO482–207 Mutants by 1,5-IAEDANS
Covalent modification of FOXO4-(11–213) and FOXO4-(82–207) containing a single cysteine residue with the thiol-reactive probe 1,5-IAEDANS was carried out as described elsewhere (15, 17). Briefly, the protein (50–70 μm) in 50 mm Tris (pH 7.5), 100 mm NaCl, 1 mm EDTA, 10% (v/w) glycerol, and label were mixed at a molar ratio of 1:40 and incubated at 30 °C for 2 h and then at 4 °C overnight in the dark. The free unreacted label was removed by size exclusion chromatography on a Superdex 75 10/300 GL column in a buffer containing 50 mm Tris (pH 7.5), 100 mm NaCl, 1 mm EDTA, and 10% (v/w) glycerol. The incorporation stoichiometry was determined by comparing the peak protein absorbance at 280 nm with the absorbance of bound AEDANS measured at 336 nm using the extinction coefficient of 5,700 m−1 cm−1 (Molecular Probes, Inc., Eugene, OR).
Expression and Purification of 14-3-3 Protein
Human 14-3-3 protein (ζ-isoform) was expressed and purified as described previously (18).
Labeling of 14-3-3 Protein Mutants by 5-IAF
To prepare the 14-3-3 protein suitable for FRET measurements, we constructed two mutants containing a single cysteine residue (either at position 25 or 189) of human monomeric 14-3-3ζ protein (mutant S58D) (19). The protein (40 μm) in 50 mm Tris (pH 7.5), 100 mm NaCl, 1 mm EDTA, and label 5-iodoacetamidofluorescein (Invitrogen) were mixed at a molar ratio of 1:40 and incubated at room temperature for 8 h and then at 4 °C overnight in the dark. The free unreacted label was removed by dialysis and size exclusion chromatography. The incorporation stoichiometry was determined by the absorbance at 492 nm using an extinction coefficient of 78,000 m−1 cm−1 (Molecular Probes). The stoichiometry of fluorescein incorporation/mol of protein was found to be 99–100%.
DNA-binding Studies
Steady-state fluorescence measurements were performed on a PerkinElmer Life Sciences LS50B fluorescence spectrometer at 17 °C in a buffer containing 50 mm Tris (pH 7.5), 100 mm NaCl, and 1 mm EDTA with 100 nm double-stranded DNA (dsDNA) labeled with fluorescein at the 5′ terminus of one strand. The following oligonucleotides containing the consensus FOXO binding sequence were used to prepare the samples of dsDNA: 5′-fluorescein-GCGTTGTTTACGC-3′ and 5′-GCGTAAACAACGC-3′ (15). Increasing amounts of the protein were titrated into the cuvette. At each FOXO4-(11–213) concentration, the steady-state fluorescence anisotropy of fluorescein was recorded (excitation at 494 nm and emission at 520 nm). Anisotropy was calculated from the fluorescence intensities according to the relationship, r = (I‖ − I⊥)/(I‖ + 2I⊥). The fraction of the DNA bound (FB) was calculated from the formula,
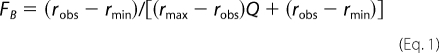 |
where Q represents the quantum yield ratio of the bound to the free form, and it was estimated by the ratio of the intensities of the bound to the free fluorophore. Parameter rmax is the anisotropy at saturation, robs is the observed anisotropy for any FOXO4-(11–213) concentration, and rmin is the minimum observed anisotropy of the free DNA. FB was plotted against the FOXO4-(11–213) protein concentration and fitted using Equation 2 (20) to determine KD for the FOXO4-(11–213)·dsDNA complex formation,
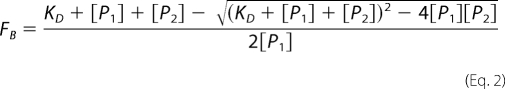 |
where KD is the equilibrium dissociation constant, [P1] is the dsDNA-fluorescein concentration, and [P2] is the FOXO4-(11–213) concentration. Nonlinear data fitting was performed using the Origin version 6.0 package (Microcal Software Inc.).
14-3-3 Protein Binding Studies
Steady-state fluorescence measurements were performed with 0.5 μm FOXO4-(11–213) labeled with 1,5-IAEDANS in a buffer containing 50 mm Tris (pH 7.5), 100 mm NaCl, and 1 mm EDTA. Increasing amounts of the 14-3-3ζ protein were titrated into the cuvette. At each 14-3-3ζ concentration, the steady-state fluorescence anisotropy of AEDANS was measured (excitation at 336 nm and emission at 490 nm). Data were analyzed as described above in the case of the DNA-binding studies.
Time-resolved Fluorescence Measurements
Fluorescence intensity and anisotropy decays were measured on a time-correlated single photon counting apparatus, as described previously (17, 21). The fluorescence decays have been acquired under the “magic angle” conditions when the measured intensity decay, I(t), is independent of the rotational diffusion of the chromophore and provides unbiased information about lifetimes. The apparatus response function was measured with a diluted Ludox (colloidal silica) solution. Samples were placed in a thermostatic holder, and all experiments were performed at 22 °C in a buffer containing 50 mm Tris-HCl (pH 7.5), 100 mm NaCl, and 1 mm EDTA. The FOXO4-(11–213) concentration was 15 μm; the 14-3-3 protein concentration was 30 μm. Dansyl fluorescence was excited at 315 nm by an actively mode-locked picosecond dye laser (Spectra Physics). Fluorescence was collected at 480 nm using a monochromator with a 400 nm cut-off filter placed in front of its input slit. Tryptophan emission was excited at 297 nm by a pulsed UV-LED with a 500-ps pulse width (PLS 295-10; PicoQuant). Tryptophan emission was collected at 355 nm through a monochromator complemented by a UG1 glass filter (Zeiss) in front of the input slit. The fluorescence decays were processed as described previously (17, 21), using the singular value decomposition maximum entropy method (22).
Fluorescence was assumed to decay multiexponentially according to the formula,
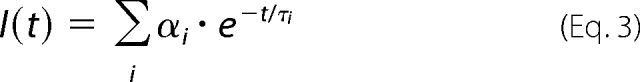 |
where τi and αi are the fluorescence lifetimes and the corresponding amplitudes, respectively. I(t) was analyzed by the singular value decomposition maximum entropy method coded according to Bryan (22). The program yields a set of amplitudes αi that represents the lifetime distribution in the decay. We have chosen 100 lifetimes covering the range from 20 ps to 20 ns. The lifetimes were equidistantly spaced in the logarithmic scale. Not having prior information about the number of lifetime classes (peaks) in the lifetime distribution and about the distribution shape, the data analysis started from the flat initial guess, where all lifetimes have the same prior probability. The mean lifetime τ̄ was calculated as follows,
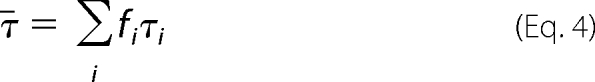 |
where fi represents the fractional intensity of the ith lifetime component.
 |
The fluorescence anisotropy decays, r(t), were obtained from the parallel I‖(t) and perpendicular I⊥(t) decay components. Data were analyzed by a method similar to the one published by Brochon (23), using a program developed at the Institute of Physics, Charles University (Prague, Czech Republic). We used a model-independent singular value decomposition maximum entropy method approach that does not set prior limits on the shape of the distribution. The anisotropies were analyzed for a series of exponentials,
 |
where the amplitudes βi represent the distribution of the correlation times ϕi. βi values are related to the initial anisotropy r0 by the formula,
We used 100 correlation times ϕi equidistantly spaced in the logarithmic scale and ranging from 100 ps to 500 ns.
Fluorescence Quenching
AEDANS fluorescence was quenched by acrylamide. The fluorescence decays were collected at 480 nm in the presence of different quencher concentrations [Q]. The time-resolved quenching data were analyzed by the Stern-Volmer equation,
where τ̄0 and τ̄ represent the mean fluorescence lifetime in the absence and in the presence of acrylamide, respectively. Ksv and kq represent the phenomenological Stern-Volmer constant and the bimolecular quenching constant that reflects the collisional quenching efficiency of AEDANS by the quencher, respectively.
Fluorescence Resonance Energy Transfer Analysis
The average efficiency of fluorescence energy transfer E was calculated from the mean donor (AEDANS) lifetime in the presence (τDA) and absence of the acceptor (τD).
 |
The average distance between the donor-acceptor pair R was calculated from Equation 10,
 |
where R0 is the Förster critical distance. R0 is given by Ref. 24,
where n is the refractive index of the medium, QD is the emission quantum yield of the donor in the absence of the acceptor, and κ2 is the orientation factor. The spectral overlap integral J(λ) of donor fluorescence and acceptor absorption was calculated from Equation 12 (24),
 |
where FD(λ) and ϵa(λ) represent the fluorescence intensity of the donor and the molar extinction coefficient of the acceptor, respectively, at the wavelength λ expressed in cm. The orientation factor κ2 was assumed to be equal to ⅔, which corresponds to randomly oriented dipole moments of the donor-acceptor pairs. The value of 1.31 was used for the refractive index of the aqueous solution. The quantum yields of the donor, which is the AEDANS moiety attached at three different positions within the pFOXO4-(82–207) molecule, were calculated relative to the QD value of quinine sulfate in 0.1 m H2SO4 (25).
RESULTS
Preparation and Characterization of Single-Cys Mutants of FOXO4
The main goal of this work was to characterize interactions between the 14-3-3ζ protein and the forkhead domain of transcription factor FOXO4 and, above all, to answer the question of how the 14-3-3 protein inhibits FOXO4 binding to the target DNA. The AKT/PKB-induced phosphorylation of FOXO factors, followed by their association with the 14-3-3 proteins, takes place in the nucleus. This interaction in turn inhibits the FOXO binding to DNA and promotes nuclear export of the resulting complex (7–11). Since the 14-3-3 protein binding motifs border the DBD, it is reasonable to speculate that the 14-3-3 protein can either sterically block the DNA binding interface or change its structure. To test the former possibility, we prepared four mutants of FOXO4-(11–213) (human FOXO4, sequence 11–213) suitable for site-specific labeling of DBD with thiol-reactive fluorescence dye. The sequence of FOXO4-(11–213) covers the N-terminal half of the FOXO4 protein and contains the DBD flanked by two AKT/PKB phosphorylation/14-3-3 protein binding sites and NLS (Fig. 1A) (11, 14).
The amino acid sequence of FOXO4-(11–213) contains only one cysteine residue at position 27. To specifically label the selected sites within the FOXO4 DBD with a fluorescence probe, we mutated Cys27 to Ala and introduced new Cys residues at four different positions within the DBD. The sequence of DBD does not contain any cysteine residue; thus, serines located at four different positions were replaced with cysteines (Cys92, Cys142, Cys155, and Cys183) (Fig. 1B). Next, the fluorescence anisotropy-based binding assay was used to check the DNA-binding affinity of FOXO4-(11–213) single-Cys mutants. These experiments showed that FOXO4-(11–213) single-Cys mutants bind dsDNA, containing consensus FOXO binding sequence, with KD ranging from 28 to 42 nm (Fig. 2A). This is fully comparable with the DNA-binding affinity of FOXO4-(11–213) wild type, which binds DNA with a KD value of 34 ± 6 nm.
FIGURE 2.

Binding properties of selected mutants of FOXO4-(11–213). A, examples of fluorescence anisotropy DNA-binding assays performed using a dsDNA probe labeled at the 5′-end of one strand with fluorescein. Binding isotherms of wild-type FOXO4-(11–213) (WT), FOXO4-(11–213) S92C mutant (Cys92), FOXO4-(11–213) S155C mutant (Cys155), and FOXO4-(11–213)W-mutant are shown. B, examples of 14-3-3 protein-binding isotherms for AEDANS-labeled phosphorylated dpFOXO4-(11–213)-Cys155 and unphosphorylated FOXO4-(11–213)-Cys155.
The single-Cys mutants of FOXO4-(11–213) were then labeled with the extrinsic fluorophore 1,5-IAEDANS, and the stoichiometry of AEDANS incorporation/mol of the protein was found to be 96–100%. The AEDANS-labeled mutants of FOXO4-(11–213) were phosphorylated using AKT/PKB, which is known to stoichiometrically phosphorylate FOXO4-(11–213) in vitro at two sites, Thr28 and Ser193 (11, 14). Both the modification by AEDANS and the completeness of phosphorylation were confirmed by MALDI-TOF mass spectrometry. The comparison of the mass spectra of digested sample with theoretically generated tryptic peptides clearly demonstrated the presence of two phosphorylated peptides having a protonated mass of 3163.4 (m/z), corresponding to the phosphorylated peptide SApTWPLPRPEIANQPSEPPEVEPDLGEK, and 1345.6 (m/z), matched to the phosphorylated peptide AApSMDSSSKLLR (where pS and pT denote phosphorylated serine and threonine residues, respectively). The tandem mass spectrometry fragmentation in postsource decay experiment confirmed the structure and phosphorylated amino acid of these peptides. The negative MALDI-TOF mass spectra of digested samples were also used to corroborate an AEDANS moiety at the cysteine residue of all single cysteine constructs. As one example of these results, the signal at 1983.9 (m/z) of the modified peptide SSWWMLNPEGGKC*GK by AEDANS was observed (where C* denotes a modified cysteine residue). On the other hand, the nonphosphorylated or unmodified protein mass spectra provided no peaks with the same values of m/z there; only the signals corresponding to the nonphosporylated or unmodified peptides were detected (data not shown).
A fluorescence anisotropy-based binding assay was used to check the binding of the 14-3-3ζ protein to the AEDANS-labeled phosphorylated mutants of FOXO4-(11–213) (Fig. 2B). These experiments confirmed that the replacement of serines with cysteines and subsequent modification by 1,5-IAEDANS do not affect the FOXO4-(11–213) interaction with the 14-3-3ζ protein. The analysis of the binding curves yielded dissociation constants ranging from 60 to 120 nm (considering the FOXO4-(11–213)·14-3-3 complex with the 1:2 molar stoichiometry) (11, 14).
Time-resolved Fluorescence Intensity Decay Measurements
One possible mechanism of the 14-3-3 protein-dependent inhibition of the FOXO binding to the target DNA is the steric occlusion of the DNA binding interface by the 14-3-3 protein. To map the interaction of FOXO4 DBD with the 14-3-3ζ protein, time-resolved fluorescence intensity and anisotropy decay measurements of all four AEDANS-Cys mutants of FOXO4-(11–213) were performed.
Since AEDANS is an environmentally sensitive fluorophore that changes the fluorescence lifetime according to its local interactions, a variation of the mean excited state lifetime, τ̄, sensitively reflects changes in polarity around the AEDANS moiety induced by the binding of the 14-3-3ζ protein. We have found that all AEDANS-labeled FOXO4-(11–213) mutants exhibited complex emission decays with multimodal lifetime distributions (e.g. see Fig. 3). The results of the emission decay analysis for all mutants are summarized in Table 1. It is seen that although AKT/PKB-induced phosphorylation itself has only a marginal effect on τ̄, the mean lifetime of all phosphorylated dpFOXO4-(11–213) mutants significantly increases upon the binding of the 14-3-3ζ protein. Since we did not record any changes in τ̄ for unphosphorylated FOXO4-(11–213) mutants, where binding of 14-3-3ζ is weak, we suggest that the observed increase in τ̄ reflects a binding-induced decrease in polarity around the AEDANS moieties. AEDANS is an extrinsic fluorophore covalently attached to a single cysteine residue that in different mutants samples different places of the DBD. Cysteines Cys92 and Cys183 are located within the N-terminal and the C-terminal flexible loops, respectively, whereas Cys142 and Cys155 border the main DNA recognition helix H3 (Fig. 1B) (26, 27). Considering these locations and the size and the charge of AEDANS moiety, it is unlikely that the probe in any of the studied mutants would be deeply buried in the protein structure. Therefore, the observed lifetime/polarity changes are the effect of the steric shielding of the fluorophore caused by 14-3-3ζ binding rather than the result of binding-induced conformational change of the dpFOXO4-(11–213) protein.
FIGURE 3.

Example of time-resolved fluorescence of AEDANS-labeled FOXO4-(11–213). A, fluorescence intensity decay of dpFOXO4-(11–213) labeled with AEDANS at Cys155. B, excited state lifetime distribution of dpFOXO4-(11–213) labeled with AEDANS at Cys155. Solid and dashed lines represent the distribution in the absence and in the presence of phosphorylated 14-3-3ζ, respectively.
TABLE 1.
Mean excited state lifetimes of AEDANS-labeled single-Cys mutants of FOXO4-(11–213)
| Single-Cys mutant | Mean excited state lifetime τ̄a |
|||
|---|---|---|---|---|
| FOXO4-(11–213) | FOXO4-(11–213) + 14-3-3ζ | dpFOXO4-(11–213) | dpFOXO4-(11–213) + 14-3-3ζ | |
| ns | ||||
| AEDANS-Cys92 | 15.7 | 15.9 | 15.8 | 17.4 |
| AEDANS-Cys142 | 15.8 | 16.0 | 15.9 | 17.2 |
| AEDANS-Cys155 | 17.3 | 17.4 | 17.5 | 18.7 |
| AEDANS-Cys183 | 15.4 | 15.6 | 15.4 | 16.8 |
a S.D. value is ±0.1 ns.
Time-resolved Fluorescence Anisotropy Decay Measurements
Since polarized time-resolved emission measurements carry a wealth of information about fluorophore movements (24), we used them to examine the effect of 14-3-3ζ binding on segmental dynamics of the AEDANS-labeled FOXO4-(11–213) mutants. It is easy to envision that proximity of AEDANS and 14-3-3ζ should restrict AEDANS mobility upon the binding of 14-3-3ζ to FOXO4-(11–213). The extent of the fast mobility decrease should depend both on the level of the steric hindrance and the initial rotational freedom of the AEDANS moiety.
Results of the fluorescence anisotropy measurements are summarized in Table 2 and in Figs. 4–6. First, we examined the effect of the AKT/PKB-induced phosphorylation itself on the anisotropy decays. We found that double phosphorylation at Thr28 and Ser193 does not affect AEDANS movement for any of the FOXO4-(11–213) single-Cys mutants. The fluorescence anisotropy decays of the phosphorylated and the unphosphorylated forms were identical within the experimental accuracy (e.g. see Fig. 4A). Fig. 4B demonstrates changes in the raw fluorescence anisotropy decays of the FOXO4-(11–213)-Cys155 mutant resulting from the interaction with 14-3-3ζ. Visual inspection of Fig. 4B reveals that although binding of 14-3-3ζ to the phosphorylated dpFOXO4-(11–213) results in a highly significant change of the decay data, weak interaction with unphosphorylated FOXO4-(11–213) causes only minor decay changes. This data pattern was found to be the same for all examined mutants (Fig. 5). Fig. 5, A–C, represents a graphic summary of data analysis results. The curves represent the best fits, and experimental points are omitted for clarity. It is clearly seen that the 14-3-3ζ binding to any of the dpFOXO4-(11–213) mutants changes the mode of AEDANS motion, which results in a significant fluorescence anisotropy increase. Only minor changes can be registered for the unphosphorylated mutants that were used for control (Fig. 4C). Interestingly, both in the presence and in the absence of 14-3-3ζ, the FOXO4-(11–213)-Cys92 and -Cys183 mutants exhibit highly similar rotational freedom of AEDANS that can be deduced from the overlapping anisotropy curves. As expected, in these DBD-bordering mutants, the motional freedom of the fluorophore is higher (anisotropy is lower) than for Cys142 and Cys155 with the AEDANS moiety located in the more rigid DBD structure.
TABLE 2.
Anisotropy decay parameters of AEDANS-labeled single-Cys mutants of FOXO4-(11–213)
| Single-Cys mutant | dpFOXO4-(11–213) |
||||||||
|---|---|---|---|---|---|---|---|---|---|
| β1 | ϕ1 | β2 | ϕ2 | β3 | ϕ3 | β4 | ϕ4 | β1 + β2a | |
| ns | ns | ns | ns | ||||||
| AEDANS-Cys92 | 0.070 | 0.7 | 0.075 | 5.2 | 0.045 | 24 | 0.145 | ||
| AEDANS-Cys142 | 0.024 | 0.3 | 0.067 | 2.8 | 0.099 | 19 | 0.091 | ||
| AEDANS-Cys155 | 0.033 | 0.3 | 0.045 | 2.7 | 0.112 | 18 | 0.078 | ||
| AEDANS-Cys183 | 0.071 | 0.7 | 0.074 | 4.9 | 0.045 | 23 | 0.145 | ||
| Single-Cys mutant | dpFOXO4-(11–213) + 14-3-3ζ |
||||||||
|---|---|---|---|---|---|---|---|---|---|
| β1 | ϕ1 | β2 | ϕ2 | β3 | ϕ3 | β4 | ϕ4 | β1 + β2 + β3a | |
| ns | ns | ns | ns | ||||||
| AEDANS-Cys92 | 0.047 | 0.9 | 0.058 | 7.6 | 0.085 | 80 | 0.105 | ||
| AEDANS-Cys142 | 0.021 | 0.4 | 0.020 | 1.9 | 0.042 | 7.4 | 0.107 | 69 | 0.083 |
| AEDANS-Cys155 | 0.018 | 0.3 | 0.020 | 2.3 | 0.024 | 8.2 | 0.128 | 67 | 0.062 |
| AEDANS-Cys183 | 0.053 | 1.6 | 0.053 | 8.3 | 0.084 | 77 | 0.106 | ||
a S.D. value is ±0.005.
FIGURE 4.

Fluorescence anisotropy decays of AEDANS attached to FOXO4-(11–213)-Cys155 mutant. A, effect of phosphorylation. B, effect of 14-3-3ζ binding. Closed and open symbols represent phosphorylated and unphosphorylated FOXO4-(11–213), respectively. The solid lines represent the best fit.
FIGURE 5.

Fluorescence anisotropy decays of AEDANS attached to different single-Cys FOXO411–213 mutants. Shown are phosphorylated dpFOXO4-(11–213) mutants in the absence (A) and in the presence (B) of 14-3-3ζ. Binding of 14-3-3ζ to unphosphorylated FOXO4-(11–213) is shown for comparison (C). Experimental points are omitted for clarity; lines represent the best fit of the experimental data.
FIGURE 6.

Rotation correlation time distributions of AEDANS attached to dpFOXO4-(11–213) mutants. Shown is dpFOXO4 (11–213) labeled with AEDANS at Cys92 (A), at Cys142 (B), at Cys155 (C), and at Cys183 (D).
Quantitative singular value decomposition maximum entropy method data analysis yielded the complex anisotropy decays with multimodal correlation time distributions (Table 2 and Fig. 6). Due to the complex AEDANS motion, it is difficult to interpret the detailed meaning of each anisotropy decay component. However, it seems safe to assign the longest correlation time to the slow overall rotation of the labeled protein and shorter components to fast depolarization caused by AEDANS wobbling combined with slower segmental and domain motions. Table 2 reveals that the longest correlation time of about 20 ns, representing rotation of the FOXO4-(11–213) molecule, increases more than 3 times upon binding of the 14-3-3ζ dimer. Since, for globular proteins, this correlation time scales linearly with the protein volume (24), this change adequately reflects the increase in the molecular mass caused by dpFOXO4-(11–213)·14-3-3ζ complex formation.
Information about the fast AEDANS dynamics is contained in the amplitudes associated with the short correlation times. For AEDANS completely immobilized within the protein structure, the sum βfast of these amplitudes (i.e. βfast = β1 + β2, and βfast = β1 + β2 + β3 for dpFOXO4-(11–213) and the dpFOXO4-(11–213)·14-3-3ζ complex, respectively) should be close to zero. The higher the protein flexibility and the motional freedom of the fluorophore, the higher should be βfast. The values of βfast (Table 2) confirm that the AEDANS motional freedom is larger for the Cys92 and Cys183 mutants than for the Cys142 and Cys155 ones. From the last column of Table 2, it is seen that for all mutants, βfast decreases upon the formation of the dpFOXO4-(11–213)·14-3-3ζ complex. Although in the case of more dynamic AEDANS attached to the Cys92 and Cys183 residues, the decrease in the fluorophore motional freedom was found to be highly significant, in the case of less movable AEDANS attached to the Cys142 and Cys155 residues, the decrease seems to be insignificant. These differences probably reflect different flexibility of the labeled regions, where the unstructured loopy N and C termini are more flexible, compared with the region containing the helix H3 (26, 27). Moreover, for all mutants, the correlation time distributions became significantly narrower in the presence of 14-3-3ζ (data not shown). In conclusion, fluorescence anisotropy experiments strongly indicate that the interaction of dpFOXO4-(11–213) with 14-3-3ζ causes the restriction of the AEDANS motion, especially in flexible regions containing residues Cys92 and Cys183 (N-terminal region and C-terminal wing W2). These effects are probably caused by the combination of the steric hindrance and the binding-induced decrease of the protein segmental mobility.
AEDANS Fluorescence Quenching
Since fluorescence anisotropy experiments revealed an insignificant effect of 14-3-3ζ binding on the rotational freedom of AEDANS attached to the Cys142 and Cys155 residues (Table 2), we decided to perform acrylamide quenching experiments with these two mutants to further support the conclusions drawn from the fluorescence lifetime data. The suggested steric shielding caused by the 14-3-3ζ binding should change the accessibility of AEDANS to the solute quencher. In order to examine a dynamic, diffusion-controlled, contribution, we employed the time-resolved approach that eliminates possible static effects caused by formation of nonfluorescent ground state AEDANS·acrylamide complexes. Results of the quenching experiments are shown in Fig. 7. It is seen that all Stern-Volmer plots exhibit a downward curvature. The observed departure from linearity should not be surprising for fluorophores with multiple lifetime components (28), although the existence of some conformational heterogeneity of the protein in solution cannot be ruled out. From Fig. 7 it is also seen that acrylamide quenching in the presence of 14-3-3ζ is less efficient. To examine more rigorously the binding-induced changes, we extracted the bimolecular quenching constants kq from slopes of the Stern-Volmer plots at low acrylamide concentrations (Fig. 7, dashed lines). Data analysis according to Equation 8 revealed that for the FOXO4-(11–213)-Cys155 mutant, kq decreased almost twice from 1.24 × 10⁸ to 6.52 × 10⁷ m−1 s−1 upon the 14-3-3ζ binding. A similar significant decrease was observed for FOXO4-(11–213)-Cys142, where kq decreased from 1.88 × 10⁸ to 1.24 × 10⁸ m−1 s−1. In accord with the fluorescence lifetime data, the quenching experiments indicate for both mutants much lower accessibility of the AEDANS moiety in the presence of 14-3-3ζ, thus supporting the steric shielding model.
FIGURE 7.

Time-resolved acrylamide quenching of AEDANS fluorescence. A, dpFOXO4-(11–213) labeled with AEDANS at Cys155. B, dpFOXO4-(11–213) labeled with AEDANS at Cys142. Solid and open circles denote dpFOXO4-(11–213) in the absence and in the presence of phosphorylated 14-3-3ζ, respectively.
Preparation and Characterization of Tryptophan Mutants of FOXO4
The 14-3-3 proteins are known to affect the conformation of their binding partners (29, 30). Therefore, the second hypothesis we tested was whether the 14-3-3 binding changes the structure of FOXO4 DBD. To investigate this possibility, we prepared a mutant of FOXO4-(11–213) containing only two tryptophan residues (Trp173 and Trp174) within the forkhead domain (denoted as FOXO4-(11–213)W-mutant) (Fig. 1). All other tryptophans (Trp29, Trp97, Trp126, and Trp146) were mutated to phenylalanines. Residues Trp173 and Trp174 are completely conserved and cannot be mutated without a significant loss of the FOXO4 DNA-binding affinity (data not shown). They are both located at the C terminus of β-strand S3; residue Trp174, which participates in the DNA binding, interacts with Leu154 from the main DNA recognition helix H3, whereas residue Trp173 is oriented in the opposite direction toward the loop between helices H1 and H2 (Fig. 1B). Considering this location, we decided to use the intrinsic fluorescence of these two tryptophans to probe structural changes within the DNA binding interface of FOXO4-DBD.
Circular dichroism measurements were used to check the secondary structure of FOXO4-(11–213)W-mutant, and no significant changes compared with FOXO4-(11–213) wild type were found (data not shown). The steady-state fluorescence anisotropy-based DNA-binding assay showed that FOXO4-(11–213)W-mutant binds DNA containing the consensus FOXO binding sequence with a KD value of 54 ± 5 nm. This is fully comparable with the DNA-binding affinity of FOXO4-(11–213) wild type (Fig. 2A).
14-3-3 Protein Binding Does Not Affect the Structure of FOXO4-DBD in the Region of Trp173 and Trp174
Time-resolved measurements of the tryptophan fluorescence decays revealed that neither the phosphorylation by AKT/PKB nor the binding of 14-3-3ζ protein change the mean fluorescence lifetime (τ̄) of FOXO4-(11–213)W-mutant (Table 3). This indicates that neither direct interaction of the 14-3-3 protein with the tryptophan residues nor significant binding-induced conformational change of DBD that would affect the tryptophan microenvironment takes place. Similar results were observed also for mutants containing only one AKT/PKB phosphorylation site (data not shown).
TABLE 3.
Summary of tryptophan fluorescence anisotropy measurements
| Sample | τ̄ a | β1b | ϕ1 | β2 | ϕ2 |
|---|---|---|---|---|---|
| ns | ns | ns | |||
| FOXO4-(11–213)W-mutant | 4.9 | 0.12 | 2.4 | 0.07 | 18 |
| dpFOXO4-(11–213)W-mutant | 4.9 | 0.12 | 2.5 | 0.07 | 20 |
| dpFOXO4-(11–213)W-mutant + 14-3-3 | 4.9 | 0.11 | 2.6 | 0.08 | >45 |
a S.D. value is ±0.1 ns.
b S.D. value is ±0.007.
All tryptophan emission anisotropy decays were well fitted by the bimodal lifetime distribution. Consistently with the AEDANS experiments, the interaction of FOXO4-(11–213)W-mutant with the 14-3-3ζ protein is reflected by the increase of the longest rotational correlation time ϕ2 (Table 3). The interaction is clearly seen in Fig. 8, where higher anisotropy at long times indicates lower rotational depolarization caused mainly by the increase of the molecular weight of the FOXO4-(11–213)W-mutant·14-3-3ζ complex. The correlation time ϕ2, close to 20 ns, characterizing the overall rotational diffusion rate of free FOXO4-(11–213)W-mutant, corresponds well to the values obtained from the AEDANS fluorescence. Depending on noise in the data, the relatively short Trp lifetime (4.9 ns) prevents accurate recovery of very long correlation times. As a consequence, the confidence interval of the longest correlation time is highly asymmetrical and stretched to large values. This could be a reason for mismatch between the overall rotational diffusion rates of the dpFOXO4-(11–213)·14-3-3ζ complex obtained from the Trp and AEDANS fluorescence anisotropies.
FIGURE 8.

Time-resolved tryptophan fluorescence anisotropy (Trp173 and Trp174) decays. Shown are fluorescence anisotropy decays of dpFOXO4-(11–213)W-mutant in the presence (closed circles) and in the absence (open circles) of 14-3-3ζ.
The interaction of FOXO4-(11–213)W-mutant with the 14-3-3ζ protein does not seem to significantly restrict segmental motion of the forkhead domain, which contains both Trp173 and Trp174. The segmental motion is characterized by the shorter correlation time, ϕ1, and amplitudes of this motion are reflected in the value of β1. If the segment containing Trp173 and Trp174 was completely immobilized after the binding (β1 = 0), r(t) would decay with a single correlation time of about 45 ns belonging to a rotor with the molecular weight of the FOXO4-(11–213)W-mutant·14-3-3ζ complex. Depolarization processes other than the rotation of the complex as a whole are absent in this case. This situation is represented by the upper reference line in Fig. 8. The lower reference line in Fig. 8 represents an opposite hypothetical situation when the motion of the tryptophan-containing DBD is completely unrestricted by the rest of the macromolecule or the complex. In this case, β2 = 0, because all depolarization is caused by the fast movement of the domain with a single correlation time of about 2.5 ns. Similar results were also observed for mutants containing only one AKT/PKB phosphorylation site, suggesting that one 14-3-3 binding motif is sufficient for stable association of FOXO4-(11–213)W-mutant with the 14-3-3ζ protein (data not shown).
Mapping of the Interaction between 14-3-3ζ and pFOXO4 DBD Using FRET Time-resolved Fluorescence Measurements
To build a realistic model of the FOXO4·14-3-3ζ complex, we measured six distances between AEDANS-labeled FOXO4 DBD and fluorescein-labeled 14-3-3ζ using FRET time-resolved fluorescence experiments. To prepare well defined pFOXO4·14-3-3ζ complexes containing only one donor-acceptor pair of fluorophores, we constructed two versions of the monomeric form of 14-3-3ζ (mutation S58D) containing a single cysteine residue either at position 25 or 189, respectively (17, 19). To specifically label FOXO4 DBD, we prepared three mutants of FOXO4-(82–207) containing a single cysteine residue (either at position 101, 142, or 183, respectively). The construct FOXO4-(82–207) interacts with the monomeric 14-3-3ζ in a uniform manner, because it contains only one AKT/PKB phosphorylation site/14-3-3 binding motif at Ser193 within the wing W2. Both the modification by fluorescence dyes and the completeness of phosphorylation were confirmed by MALDI-TOF mass spectrometry.
The Förster critical distance, R0, of the AEDANS-fluorescein pair was determined from Equations 11 and 12. The calculated values of the spectral overlap J(λ) between AEDANS and fluorescein are listed in Table 4. The quantum yields of AEDANS-labeled pFOXO4-(82–207) fluorescence at 22 °C in the presence of unlabeled 14-3-3ζ were determined to be 0.058 for Cys101-AEDANS, 0.114 for Cys142-AEDANS, and 0.181 for Cys183-AEDANS, respectively. The mean excited state lifetimes (τ̄) of AEDANS in the absence and presence of the acceptor (fluorescein), the efficiency of the energy transfer, and the calculated average distances are presented in Table 4. These distances enabled us to build a model of the pFOXO4·14-3-3ζ complex (Fig. 9, A and B). This model suggests that FOXO4 DBD is bound within the central channel of the 14-3-3 protein dimer similarly as has been observed for the 14-3-3ζ·serotonin N-acetyltransferase complex (18). The FOXO4 DBD is oriented with the helix H1 facing the bottom of the 14-3-3 central channel, whereas the loop between the helices H2 and H3 interacts with the ninth helix of the second 14-3-3 monomer (Fig. 9B). This model is consistent with our hypothesis that the 14-3-3 protein masks the DNA binding interface of FOXO4 DBD. In addition, the wing W1 containing Trp173 and Trp174 at the C terminus of β-strand S3 has no interaction with 14-3-3, consistent with our tryptophan fluorescence data.
TABLE 4.
Summary of energy transfer measurements
| pFOXO4 donor site | 14-3-3ζ acceptor site | Label | τ̄ a,b | Ec | J(λ)d | R0e | R |
|---|---|---|---|---|---|---|---|
| ns | % | cm3m−1 | Å | Å | |||
| Cys101 | Cys25 | Donor only | 16.8 | 51.8 | 1.508 × 10⁻¹³ | 34.7 | 34.3 |
| Donor + acceptor | 8.1 | ||||||
| Cys101 | Cys189 | Donor only | 16.9 | 47.3 | 35.3 | ||
| Donor + acceptor | 8.9 | ||||||
| Cys142 | Cys25 | Donor only | 16.5 | 32.7 | 1.554 × 10⁻¹³ | 39.0 | 44.0 |
| Donor + acceptor | 11.1 | ||||||
| Cys142 | Cys189 | Donor only | 16.6 | 31.3 | 44.5 | ||
| Donor + acceptor | 11.4 | ||||||
| Cys183 | Cys25 | Donor only | 16.6 | 42.2 | 1.578 × 10⁻¹³ | 42.3 | 44.5 |
| Donor + acceptor | 9.6 | ||||||
| Cys183 | Cys189 | Donor only | 16.7 | 28.1 | 49.4 | ||
| Donor + acceptor | 12.0 |
a Mean lifetimes were calculated as τmean = Σifiτi, where fi is an intensity fraction of the ith lifetime component τi.
b S.D. value is ±0.1 ns.
c Energy transfer.
d Spectral overlap integral of the donor fluorescence and acceptor absorption.
e Förster critical distance represents the distance between energy donor and energy acceptor where the FRET efficiency is 50%.
FIGURE 9.

Model of the pFOXO4·14-3-3ζ complex. A, model of the FOXO4 DBD·14-3-3ζ complex with the AEDANS moiety attached at Cys101, Cys142, and Cys183 of FOXO4 DBD and the fluorescein moiety attached at Cys25 and Cys189 of 14-3-3ζ. This model was built using the average distances calculated from FRET measurements. The crystal structure of FOXO3a DBD was used to create this model (27). The conformation of the wing W2 was changed to allow its fit into the ligand binding groove of 14-3-3ζ. The AKT/PKB phosphorylation site Ser193 is shown in red. B, model of the FOXO4 DBD·14-3-3ζ dimer complex. The structure of the 14-3-3ζ dimer from the crystal structure of the 14-3-3ζ·serotonin N-acetyltransferase complex was used to create this model (18). The red circles indicate the position of Ser184, which is known to be phosphorylated by JNK kinase (40, 41).
DISCUSSION
The 14-3-3 protein family is a group of highly conserved dimeric proteins found in all eukaryotes (31, 32). To date, several hundred distinct proteins have been found to interact with 14-3-3s, including proteins involved in metabolism control, cell cycle regulation, apoptosis, and control of gene transcription (33, 34). Although the interaction between the 14-3-3 proteins and their ligands are usually controlled through phosphorylation of the binding partner (35–37), a number of unphosphorylated 14-3-3 binding motifs has also been characterized (32). The 14-3-3 proteins are molecular scaffolds that regulate function of their binding partners by a number of different mechanisms (31, 38). It is still relatively unknown how the 14-3-3 proteins exhibit such promiscuity toward the binding and regulation of such a diverse group of binding partners; however, it is increasingly clear in the literature that many interactions are quite specific for a certain isoform or isoforms.
The role of the 14-3-3 proteins in the regulation of FOXO transcription factors is at least 2-fold. First, the 14-3-3 binding inhibits the interaction between the FOXO and the target DNA (9, 14). Second, the 14-3-3 proteins prevent nuclear reimport of FOXO factors by masking their NLS (7, 8, 39). The exact mechanisms of these processes are still unclear, mainly due to the lack of structural data. In this work, we have used various techniques of fluorescence spectroscopy to investigate the mechanism of 14-3-3 protein-dependent inhibition of FOXO4 DNA-binding properties. FOXO factors possess two 14-3-3 protein binding motifs, and both of them are required for optimal FOXO binding to the 14-3-3 proteins (7, 10, 14). These two motifs border the forkhead domain, thus raising the possibility that the 14-3-3 protein can either sterically block the DNA binding interface or change the structure of the forkhead domain.
Time-resolved fluorescence intensity decay measurements revealed that the 14-3-3ζ protein binding affects fluorescence properties of the AEDANS moiety attached at four sites within the FOXO4 DBD, representing important parts of the DNA binding interface (Table 1 and Fig. 3). It is likely that observed changes in fluorescence properties of AEDANS are caused by the steric shielding of the fluorophore upon the 14-3-3ζ protein binding, thus indicating physical contact between the 14-3-3ζ and labeled regions of FOXO4. This is also consistent with the results of time-resolved fluorescence anisotropy experiments that indicated restriction of segmental motions of labeled regions of DBD upon dpFOXO4 binding to 14-3-3ζ protein (Table 2 and Figs. 4–6). In addition, it seems that interaction with 14-3-3 does not cause any dramatic conformational change of FOXO4 DBD, as documented by the results of tryptophan fluorescence experiments (Table 3 and Fig. 8).
To map the interaction between FOXO4 and 14-3-3ζ, we measured, using FRET time-resolved fluorescence experiments, six distances between AEDANS-labeled FOXO4 DBD and fluorescein-labeled 14-3-3ζ. This enabled us to build a model of the pFOXO4·14-3-3ζ complex (Fig. 9, A and B). This model suggests that FOXO4 DBD is docked into the central channel of the 14-3-3ζ dimer in a similar manner as observed previously for the serotonin N-acetyltransferase·14-3-3ζ complex (18). This position allows for efficient masking of the whole DNA binding interface of FOXO4, consistent with the results of our fluorescence measurements.
Our fluorescence data, together with results published previously (11), also suggest that FOXO4 DBD remains relatively mobile upon the 14-3-3ζ protein binding. The correlation component with ϕ ranging from 3 to 8 ns probably reflects movement of a rigid domain within the FOXO4-(11–213) construct (Table 2, ϕ2 and ϕ3 in the absence and the presence of the 14-3-3ζ protein, respectively). We assume that this could be compact and about 11-kDa large DBD. Thus the model presented in Fig. 9, A and B, should represent the average position of FOXO DBD with respect to the 14-3-3 molecule.
It is now generally accepted that the phosphorylation of 14-3-3 isoforms on specific residues plays an important regulatory role (32). The c-Jun N-terminal kinase (JNK) belongs to the group of mitogen-activated protein kinases that are activated when cells are exposed to environmental stresses. It has been shown that the phosphorylation of 14-3-3 by JNK at Ser184 (ζ-isoform) induces dissociation of proapoptotic proteins Bad and FOXO3 from 14-3-3, thus reversing the effect of Akt/PKB signaling (40, 41). Residue Ser184 is located within the loop between helices α7 and α8 in the vicinity of the ligand binding groove (Fig. 9B). Our previous work has suggested that the 14-3-3ζ protein physically interacts with the whole region of FOXO4 NLS (11). Therefore, the interaction between the NLS of FOXO proteins and the α7-α8 loop of the 14-3-3 molecule cannot be ruled out. In such a case, the JNK-induced phosphorylation of Ser184 could interfere with FOXO binding to 14-3-3. However, our model cannot predict this interaction, because the crystal structure of FOXO3, which was used to create our model, does not contain any residues beyond the Akt/PKB phosphorylation site (27). Considering both the location of Ser184 and the fact that the JNK-induced phosphorylation inhibits the interaction between 14-3-3 and Bad, it is also entirely possible that the phosphorylation of the α7-α8 loop affects the structure of the 14-3-3 ligand binding groove and inhibits the 14-3-3 binding properties.
In conclusion, our data strongly suggest that the 14-3-3ζ protein physically interacts with the DNA binding interface of phosphorylated FOXO4. The FOXO4 DBD is docked into the central channel of the 14-3-3 protein dimer but remains relatively mobile upon the complex formation. Moreover, intrinsic tryptophan fluorescence indicates no significant binding-induced conformational change of DBD. Thus, the 14-3-3ζ protein functions as a molecular hood that covers the DNA binding interface of FOXO4 and blocks its interaction with the target DNA.
Acknowledgments
We thank Dr. Ondrej Julinek for helping with the measurements of circular dichroism spectra. We also thank Dr. Eva Muchova for proofreading of the manuscript.
This work was supported by Grant Agency of the Czech Republic Grant 204/06/0565; Grant Agency of the Academy of Sciences of the Czech Republic Grant IAA501110801; Ministry of Education, Youth, and Sports of the Czech Republic Research Projects MSM0021620857 and MSM0021620835 and Centre of Neurosciences LC554; and Academy of Sciences of the Czech Republic Research Project AV0Z50110509.
- DBD
- DNA-binding domain
- 1,5-IAEDANS
- 5-((((2-iodoacetyl)amino)ethyl)amino)naphthalene-1-sulfonic acid
- AEDANS
- 5-(((acetylamino)ethyl)amino) naphthalene-1-sulfonic acid
- PKB
- protein kinase B
- dpFOXO4-(11–213)
- doubly phosphorylated FOXO4- (11–213)
- pFOXO4-(82–207)
- phosphorylated FOXO4-(82–207)
- FRET
- Förster resonance energy transfer
- JNK
- c-Jun N-terminal kinase
- MALDI-TOF
- matrix-assisted laser desorption ionization-time of flight
- NLS
- nuclear localization signal
- dsDNA
- double-stranded DNA.
REFERENCES
- 1.Weigel D., Jäckle H. (1990) Cell 63, 455–456 [DOI] [PubMed] [Google Scholar]
- 2.Kaestner K. H., Knochel W., Martinez D. E. (2000) Genes Dev. 14, 142–146 [PubMed] [Google Scholar]
- 3.Mazet F., Yu J. K., Liberles D. A., Holland L. Z., Shimeld S. M. (2003) Gene 316, 79–89 [DOI] [PubMed] [Google Scholar]
- 4.Calnan D. R., Brunet A. (2008) Oncogene 27, 2276–2288 [DOI] [PubMed] [Google Scholar]
- 5.Fu Z., Tindall D. J. (2008) Oncogene 27, 2312–2319 [DOI] [PMC free article] [PubMed] [Google Scholar]
- 6.Gross D. N., van den Heuvel A. P. J., Birnbaum M. J. (2008) Oncogene 27, 2320–2336 [DOI] [PubMed] [Google Scholar]
- 7.Brunet A., Bonni A., Zigmond M. J., Lin M. Z., Juo P., Hu L. S., Anderson M. J., Arden K. C., Blenis J., Greenberg M. E. (1999) Cell 96, 857–868 [DOI] [PubMed] [Google Scholar]
- 8.Brownawell A. M., Kops G. J., Macara I. G., Burgering B. M. (2001) Mol. Cell. Biol. 21, 3534–3546 [DOI] [PMC free article] [PubMed] [Google Scholar]
- 9.Cahill C. M., Tzivion G., Nasrin N., Ogg S., Dore J., Ruvkun G., Alexander-Bridges M. (2001) J. Biol. Chem. 276, 13402–13410 [DOI] [PubMed] [Google Scholar]
- 10.Zhao X., Gan L., Pan H., Kan D., Majeski M., Adam S. A., Unterman T. G. (2004) Biochem. J. 378, 839–849 [DOI] [PMC free article] [PubMed] [Google Scholar]
- 11.Obsilova V., Vecer J., Herman P., Pabianova A., Sulc M., Teisinger J., Boura E., Obsil T. (2005) Biochemistry 44, 11608–11617 [DOI] [PubMed] [Google Scholar]
- 12.van der Horst A., Burgering B. M. T. (2007) Nat. Rev. Mol. Cell Biol. 8, 440–450 [DOI] [PubMed] [Google Scholar]
- 13.Obsil T., Obsilova V. (2008) Oncogene 27, 2263–2275 [DOI] [PubMed] [Google Scholar]
- 14.Obsil T., Ghirlando R., Anderson D. E., Hickman A. B., Dyda F. (2003) Biochemistry 42, 15264–15272 [DOI] [PubMed] [Google Scholar]
- 15.Boura E., Silhan J., Herman P., Vecer J., Sulc M., Teisinger J., Obsilova V., Obsil T. (2007) J. Biol. Chem. 282, 8265–8275 [DOI] [PubMed] [Google Scholar]
- 16.Sadilkova L., Osicka R., Sulc M., Linhartova I., Novak P., Sebo P. (2008) Protein Sci. 17, 1834–1843 [DOI] [PMC free article] [PubMed] [Google Scholar]
- 17.Silhan J., Obsilova V., Vecer J., Herman P., Sulc M., Teisinger J., Obsil T. (2004) J. Biol. Chem. 279, 49113–49119 [DOI] [PubMed] [Google Scholar]
- 18.Obsil T., Ghirlando R., Klein D. C., Ganguly S., Dyda F. (2001) Cell 105, 257–267 [DOI] [PubMed] [Google Scholar]
- 19.Woodcock J. M., Murphy J., Stomski F. C., Berndt M. C., Lopez A. F. (2003) J. Biol. Chem. 278, 36323–36327 [DOI] [PubMed] [Google Scholar]
- 20.Kohler J. J., Schepartz A. (2001) Biochemistry 40, 130–142 [DOI] [PubMed] [Google Scholar]
- 21.Obsilova V., Herman P., Vecer J., Sulc M., Teisinger J., Obsil T. (2004) J. Biol. Chem. 279, 4531–4540 [DOI] [PubMed] [Google Scholar]
- 22.Bryan R. K. (1990) Eur. Biophys. J. 18, 165–174 [Google Scholar]
- 23.Brochon J. C. (1994) Methods Enzymol. 240, 262–311 [DOI] [PubMed] [Google Scholar]
- 24.Lakowicz J. R. (1983) Principles of Fluorescence Spectroscopy, pp. 305–315, Plenum Press, New York [Google Scholar]
- 25.Melhuish W. H. (1961) J. Phys. Chem. 65, 229–235 [Google Scholar]
- 26.Clark K. L., Halay E. D., Lai E., Burley S. K. (1993) Nature 364, 412–420 [DOI] [PubMed] [Google Scholar]
- 27.Tsai K. L., Sun Y. J., Huang C. Y., Yang J. Y., Hung M. C., Hsiao C. D. (2007) Nucleic Acids Res. 35, 6984–6994 [DOI] [PMC free article] [PubMed] [Google Scholar]
- 28.Eftink M. R. (1991) in Topics in Fluorescence Spectroscopy (Lakowicz J. R. ed) Vol. 2, pp. 55–91, Plenum Press, New York [Google Scholar]
- 29.Yaffe M. B. (2002) FEBS Lett. 513, 53–57 [DOI] [PubMed] [Google Scholar]
- 30.Obsilova V., Nedbalkova E., Silhan J., Boura E., Herman P., Vecer J., Sulc M., Teisinger J., Dyda F., Obsil T. (2008) Biochemistry 47, 1768–1777 [DOI] [PubMed] [Google Scholar]
- 31.Fu H., Subramanian R. R., Masters S. C. (2000) Annu. Rev. Pharmacol. Toxicol. 40, 617–647 [DOI] [PubMed] [Google Scholar]
- 32.Aitken A. (2006) Semin. Cancer Biol. 16, 162–172 [DOI] [PubMed] [Google Scholar]
- 33.Mackintosh C. (2004) Biochem. J. 381, 329–342 [DOI] [PMC free article] [PubMed] [Google Scholar]
- 34.Milne F. C., Moorhead G., Pozuelo Rubio M., Wong B., Kulma A., Harthill J. E., Villadsen D., Cotelle V., MacKintosh C. (2002) Biochem. Soc. Trans. 30, 379–381 [DOI] [PubMed] [Google Scholar]
- 35.Muslin A. J., Tanner J. W., Allen P. M., Shaw A. S. (1996) Cell 84, 889–897 [DOI] [PubMed] [Google Scholar]
- 36.Yaffe M. B., Rittinger K., Volinia S., Caron P. R., Aitken A., Leffers H., Gamblin S. J., Smerdon S. J., Cantley L. C. (1997) Cell 91, 961–971 [DOI] [PubMed] [Google Scholar]
- 37.Rittinger K., Budman J., Xu J., Volinia S., Cantley L. C., Smerdon S. J., Gamblin S. J., Yaffe M. B. (1999) Mol Cell 4, 153–166 [DOI] [PubMed] [Google Scholar]
- 38.Bridges D., Moorhead G. B. (2004) Sci. STKE, 2004re10. [DOI] [PubMed] [Google Scholar]
- 39.Rena G., Prescott A. R., Guo S., Cohen P., Unterman T. G. (2001) Biochem. J. 354, 605–612 [DOI] [PMC free article] [PubMed] [Google Scholar]
- 40.Tsuruta F., Sunayama J., Mori Y., Hattori S., Shimizu S., Tsujimoto Y., Yoshioka K., Masuyama N., Gotoh Y. (2004) EMBO J. 23, 1889–1899 [DOI] [PMC free article] [PubMed] [Google Scholar]
- 41.Sunayama J., Tsuruta F., Masuyama N., Gotoh Y. (2005) J. Cell Biol. 170, 295–304 [DOI] [PMC free article] [PubMed] [Google Scholar]