Abstract
HIV-1 Gag can assemble and generate virions at the plasma membrane, but it is also present in endosomes where its role remains incompletely characterized. Here, we show that HIV-1 RNAs and Gag are transported on endosomal vesicles positive for TiVamp, a v-SNARE involved in fusion events with the plasma membrane. Inhibition of endosomal traffic did not prevent viral release. However, inhibiting lysosomal degradation induced an accumulation of Gag in endosomes and increased viral production 7-fold, indicating that transport of Gag to lysosomes negatively regulates budding. This also suggested that endosomal Gag-RNA complexes could access retrograde pathways to the cell surface and indeed, depleting cells of TiVamp-reduced viral production. Moreover, inhibition of endosomal transport prevented the accumulation of Gag at sites of cellular contact. HIV-1 Gag could thus generate virions using two pathways, either directly from the plasma membrane or through an endosome-dependent route. Endosomal Gag-RNA complexes may be delivered at specific sites to facilitate cell-to-cell viral transmission.
The production of infectious retroviral particles is an ordered process that includes many steps (for review see Refs. 1–3). In particular, three major viral components, Gag, the envelope, and genomic RNAs have to traffic inside the cell to reach their assembly site. Viral biogenesis is driven by the polyprotein Gag, which is able to make viral-like particles when expressed alone (4). Upon release, HIV-14 Gag is processed by the viral protease into matrix (MA(p17)), capsid (CA(p24)), nucleocapsid (NC(p7)), p6, and smaller peptides SP1 and SP2. Gag contains several domains that are essential for viral assembly: a membrane binding domain (M) in MA; a Gag-Gag interaction domain in CA; an assembly domain (I) in NC; and a late domain (L) in p6, which recruits the cellular budding machinery. Genomic RNAs are specifically recognized by NC, and they play fundamental roles in viral biogenesis by acting as a scaffold for Gag multimerization (5).
It has been demonstrated that retroviruses bud by hijacking the endosomal machinery that sorts proteins into internal vesicles of multivesicular bodies (for review, see Refs. 6, 7). Indeed, these vesicles bud with the same topology as viral particles. Proteins sorted into this pathway are usually destined for degradation in lysosomes, but some can also recycle to the plasma membrane (for review see Refs. 8, 9). They are also frequently ubiquitinated on their cytoplasmic domain (10, 11), allowing their recognition by ESCRT complexes. ESCRT-0 and ESCRT-I recognize ubiquitinated cargo present at the surface of endosomes and recruit other ESCRT complexes (12–14). ESCRT-III is believed to function directly in the formation of multivesicular body intralumenal vesicles (12), even though its mechanism of action is currently not understood. Remarkably, Gag L domains interact directly with components of the multivesicular body-sorting machinery (for review see Ref. 15). HIV-1 Gag uses a PTAP motif to bind Tsg101, a component of ESCRT-I (16–19), and a YPLTSL motif to interact with Alix, a protein linked to ESCRT-I and -III (20–22). Finally, various ubiquitin ligases are also required directly or indirectly during HIV-1 biogenesis (23, 24; for review see Ref. 25).
In many cell lines, Gag is found both at the plasma membrane and in endosomes. This has led to the hypothesis that there are several assembly sites for HIV-1 (1, 3). First, Gag can initiate and complete assembly at the plasma membrane. This is thought to occur predominantly in T lymphocytes, and this process is supported by several lines of evidences: (i) disruption of endosomal trafficking with drugs does not prevent viral production (26, 27); (ii) ESCRT complexes can be recruited at the plasma membrane, at sites where Gag accumulates (28–30); (iii) Gag can be seen multimerizing and budding from the plasma membrane in live cells (31). Second, Gag could initiate assembly in endosomes, and then traffic to the cell surface to be released. This is mainly supported by the presence of Gag in endosomes in several cell lines (32–34), including T cells and more strikingly macrophages (32, 35, 36–39). However, we are currently lacking functional experiments addressing the role of this endosomal pool of Gag, and it is still not clear to what extent it contributes to the production of viral particles. Nevertheless, the presence of Gag in endosomes might facilitate recruitment of ESCRT complexes (34, 40), packaging of viral genomic RNAs (32, 41), and incorporation of the envelope (42). It may also be important for polarized budding (43, 44) and to create a viral reservoir in infected cells (45, 46).
Despite great progress, the traffic of HIV-1 components is still not fully elucidated. In particular, the transport of the genomic RNAs is poorly understood. In this study, we have used single molecule techniques to investigate the trafficking of HIV-1 RNAs in fixed and live cells, and we show that they are transported on endosomal vesicles. We also obtained functional evidence that Gag and viral RNAs can use at least two trafficking pathways to produce virions, one going directly from the plasma membrane and another one passing through endosomes.
EXPERIMENTAL PROCEDURES
Plasmids and Antibodies
The pTRIP-MS2×24 and pMS2-YFP plasmids were described previously (47, 48). TiVamp-CFP, Rab7-YFP, Gag-CFP, and Gag-TC were gifts of T. Galli (52), M. Zerial (49), H. G. Krausslich (50), and D. E. Ott (51). Antibodies used in this study were monoclonals anti-CA(p24) (183-H12-5C, National Institutes of Health AIDS Research & Reference Reagent Program), anti-CD44 (Abcam), anti-Rab9 (Abcam), anti-Alix (Santa Cruz Biotechnology), anti-Tsg101 (Abcam), anti-Tivamp (Gift from T. Galli (52)), and polyclonals anti-Rab7 (Sigma), anti-μ1 (a gift from L. M. Traub), and anti-Env gp70 (805-24, kind gift of B. Chesebro).
Cell Culture, Labeling, and Drug Treatments
Human HT1080 cells and their HT*, HT*A, and HT*A-GFP derivatives were a gift of M. K. Collins (53). Cells were grown in DMEM with antibiotics and 10% fetal bovine serum (FBS). Cells were transfected with either Lipofectamine and plus reagent (Invitrogen) or Effectene (Qiagen), according to the manufacturer's instructions.
To disrupt endosomal pathways, cells were incubated for 6 h with monensin (5 μm), nocodazole (5 μm), or chloroquine (20 μm), with 30 min of pretreatment. Kinetic analyses revealed that similar results were obtained after 2, 4, or 6 h of treatment, and no cellular toxicity was observed (data not shown). To inhibit translation, cells were incubated with 200 μg/ml cycloheximide. To stimulate endosomal exocytosis, cells were treated with 10 μm ionomycin and 3 mm CaCl2. For TiVamp depletion, cells were transfected with siRNAs against TiVamp for 72 h.5
To label early and recycling endosomes, cells were incubated in DMEM containing 1% FBS for 3 h at 37 °C, and then in the same media containing 20 μg/ml Cy3- or Cy5-labeled transferrin (Molecular Probes) for 45 min at 37 °C. To label Gag-TC, live cells were labeled with ReAsH-EDT2, according to the manufacturer (Invitrogen).
Live Cell Imaging
Cells were grown in a non-fluorescent medium (48) and plated on a gelatin-coated glass coverslip mounted in an FCS2 chamber kept at 37 °C (Bioptechs, Butler, PA). Observations were performed with a wide-field Leica DMRA upright microscope, and images were captured with a Cool-snap HQ charge-coupled device camera (Roper Scientific). Two-dimensional time series were deconvolved using Huygens (Bitplane) and analyzed with Metamorph (Universal Imaging).
FISH
RNAs were detected as described previously (48), with oligonucleotide-Cy3 probes specific for the MS2 sequence. Coverslips were mounted in Vectashield (Vector Laboratories).
Immunofluorescence
Cells were grown on glass coverslips, washed with 1× PBS, and fixed in 4% paraformaldehyde/1× PBS for 20 min at room temperature. After three washes in PBS, cells were permeabilized in 0.1% Triton X-100 for 10 min. Cells were saturated for 30 min with 0.2% bovine serum albumin/1× PBS and immunostained for 1 h at room temperature with primary antibodies. Cells were washed, stained with secondary antibodies, and mounted in Vectashield.
Purification and Analyses of HIV-1 Viral Particles
Cell culture supernatants were collected and filtered on 0.45-μm membranes. Viral-like particles were purified by centrifugation on 20% sucrose cushion for 2 h at 20,000 × g and analyzed by Western blotting. Viral-like particle production was quantified by direct measurement of light with a charge-coupled device camera (GeneGnome, Ozyme). To analyze RNAs, cellular and viral fractions were incubated in TRIzol (Invitrogen), processed as recommended by the manufacturer, and analyzed by slot-blot hybridization.
For infectivity tests, supernatants of HT*A-GFP cells were harvested, and serial dilutions were used to infect indicator HT1080 cells. Three days later, cells were fixed, and infected cells were detected by flow cytometry using the GFP label. Titers were then normalized by measuring the amount of HIV-1 Gag in the supernatants.
Pulse-Chase Metabolic Labeling
HT* cells were starved during 30 min in DMEM lacking methionine and cysteine (Invitrogen) and supplemented with 10% dialyzed FBS. Cells were then pulse-labeled with 50 μCi/ml Tran35S-label methionine (Amersham Biosciences), for 10 min at 37 °C, washed three times, and chased in DMEM containing 10% FBS and an excess of unlabeled cysteine and methionine. Drugs were added during the starvation period and maintained throughout the experiment. Cellular and viral fractions were prepared as above and resuspended in radioimmune precipitation assay buffer (150 mm NaCl, 1 mm EDTA, 0.1% SDS, 0.5% deoxycholate, 1% Triton X-100, 10 mm Tris, pH 7.4). Fractions were immunoprecipitated overnight at 4 °C with anti-CA(p24), and Western blots were quantified with a PhosphorImager.
Subcellular Fractionation Experiments
Cells were harvested in homogenization buffer (0.25 m sucrose, 78 mm KCl, 4 mm MgCl2, 8.4 mm CaCl2, 10 mm EGTA, and 50 mm HEPES-NaOH (pH 7.0)), containing a mixture of protease inhibitors (Complete EDTA-free, Roche Applied Science). Cells were broken with a ball-bearing cell cracker (41). Homogenates were centrifuged at 1000 × g for 5 min to pellet nuclei and cellular debris. Postnuclear supernatants were loaded onto a 5 to 20% linear Optiprep gradient and centrifuged at 100,000 × g, and at 4 °C for 3 h. Fractions were collected from the top of the gradient and analyzed by Western blot.
Infection with Recombinant Adenovirus
Three recombinant adenoviruses were used. The first expressed a tetracycline-regulatable chimeric transcription activator (AdtTA; kindly given by Y. Altschuler (54)). The two others expressed WT dynamin (AdDynWT) or a dominant negative mutant (AdDynK44A), both under the control of a tetracycline-regulated promoter (kindly given by S. L. Schmid (55)). To enhance infection rates, AdtTA (5000pp), AdDynWT (2500pp), and AdDynK44A (2500pp) were diluted in 320 μl of sterile PBS and preincubated with 72 μl of 1 μg/ml polylysine for 30 min at room temperature. HT* cells were seeded on 60-mm dishes for 3–5 h, washed, and incubated with adenoviral mix overnight at 37 °C in serum-free DMEM containing tetracycline. Cells were then washed and incubated in DMEM supplemented with 10% FBS and tetracycline. Expression of dynamin was finally induced by withdrawing tetracycline from the media.
Electron Microscopy
Cells were fixed in 3.5% glutaraldehyde, phosphate buffer (0.1 m, pH 7.4) overnight at 4 °C, washed in phosphate buffer, and post-fixed in 1% osmic acid, 0.8% potassium ferrocyanide for 1 h at room temperature, washed twice in phosphate buffer, dehydrated in a graded series of ethanol, and embedded in Epon resin. 85-nm sections were cut with a Leica-Reichert Ultracut E and collected at different levels in each block. Sections were counterstained with uranyl acetate and lead citrate and observed using a Hitachi 7100 transmission electron microscope (Pleasanton, CA).
RESULTS
HIV-1 RNAs Display Directed Movements on Endosomal Vesicles
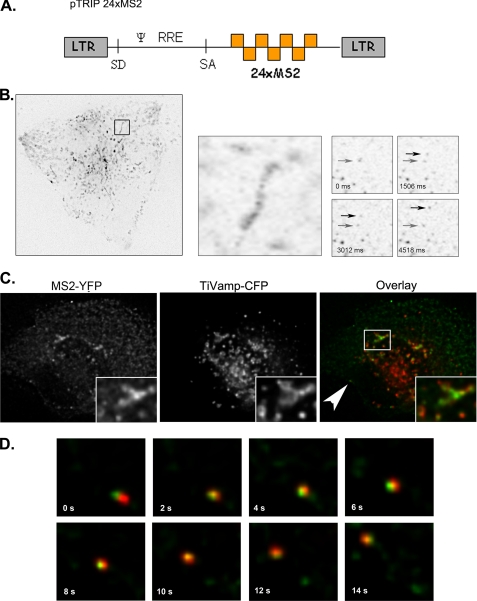
To study the trafficking of HIV-1 RNA, we used a reporter that carried all the elements required for RNA production and packaging (pTRIP-MS2×24 (Fig. 1A)) (47): the 5′ long terminal repeat, the major splice donor site (SD1), the packaging signal, the Rev-responsive element, the splice acceptor site (A7), and the 3′ long terminal repeat that drives 3′-end formation. In addition, this reporter was tagged with 24 binding sites for the coat protein of phage MS2, because the use of MS2-YFP fusions allows its visualization in live cells with single molecule sensitivity (48). To avoid overexpression levels often obtained with transient transfection, we worked with three stable cell lines: HT*, which expresses HIV-1 Gag, Gag-Pol, Tat, and Rev proteins; HT*A, which is derived from HT* and expresses the amphotropic MLV envelope; and HT*A-GFP, which is similar to HT*A, but in addition contains a packageable HIV-1 RNA-encoding GFP. To verify that binding of MS2-YFP molecules to the reporter RNA did not affect its incorporation into viral particles, we expressed pTRIP-MS2×24 RNAs and compared their packaging efficiency in the presence and absence of MS2-YFP. As previously observed for MLV, MS2-YFP had no adverse effect (data not shown (41)).
FIGURE 1.
Single molecules of HIV-1 RNA are transported on endosomes in living cells. A, schematic representation of pTRIP-MS2×24 is shown. B, HIV-1 RNAs display directed movements. HT* cells were transfected with pTRIP-MS2×24 and pMS2-YFP. Left and middle panels represent maximal image projections of movie stacks (67 × 65 μm). The right panels are single frame enlargements of the movement of RNA molecules (7 × 7 μm). Arrows point the initial and final location of the moving RNAs. Time (t) is in seconds. C, HIV-1 RNAs are transported on endosomal vesicles. HT* cells were transfected with pTRIP-MS2×24, pMS2-YFP, and TiVamp-CFP and imaged live in two wavelengths. Green, HIV-1 RNA (MS2-YFP); red, TiVamp (TiVamp-CFP). D, enlargement of movie frames displaying movements of RNAs on TiVamp-positive endosomes (11 × 11 μm) is shown. Green, HIV-1 RNA; red, TiVamp. The RNAs displayed are indicated by an arrow in C. Time (t) is in seconds.
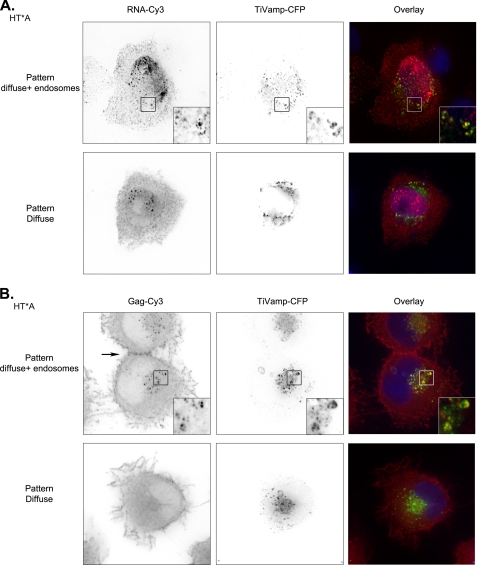
We next co-transfected pTRIP-MS2×24 with pMS2-YFP in HT* cells and performed live cell microscopy. In HT* cells, but not in the parental cell line that expressed no viral components, rectilinear movements of HIV-1 RNAs were observed (Fig. 1B, supplemental movies S1–S5, and data not shown). Because we had previously observed that MLV RNAs are transported on endosomal vesicles (41), we investigated whether this was also the case for HIV-1. HT* cells were co-transfected with vectors expressing MS2-YFP, pTRIP-MS2×24, and TiVamp-CFP, a v-SNARE specific for late endosomes (also referred as Vamp7 (56)). By two-color imaging, we observed that a fraction of HIV-1 RNAs co-localized with the endosomal marker in living cells (Fig. 1C). Moreover, we were able to visualize simultaneous movements of TiVamp vesicles and HIV-1 RNAs (Fig. 1D and supplemental movies S1–S5). To ensure that these observations were not an artifact induced by MS2-YFP binding, we examined the localization of HIV-1 RNAs by FISH. HT*A cells were co-transfected with pTRIP-MS2×24 and TiVamp-CFP, fixed, and processed such that single molecules of the viral RNA were efficiently detected (48). Two distinct patterns were observed (Fig. 2A). Consistent with the results obtained in live cells, HIV-1 RNAs were first found throughout the cytoplasm and in late endosomes, in 57% of the cells. In the remaining cells, a second pattern was observed in which RNAs were diffuse and did not show any particular localization. Similar results were obtained in HT* cells (data not shown). Thus, we concluded that HIV-1 RNAs, like MLV RNAs (41), can travel through the cytoplasm on endosomal vesicles.
FIGURE 2.
HIV-1 RNA and Gag are transported to late endosomes. A, two patterns of HIV-1 RNAs localization occur in HT*A cells. pTRIP-MS2×24 and TiVamp-CFP were co-transfected and HIV-1 RNAs were detected by FISH. Red, HIV-1 RNA (RNA-Cy3); green, TiVamp (TiVamp-CFP). Images correspond to a projection of three-dimensional stacks (60 × 60 μm). Insets show magnification of the boxed areas (7 × 7 μm). Top, HIV-1 RNAs accumulate in late endosomes; bottom, HIV-1 RNAs are diffusely distributed in the cytoplasm. B, two patterns of HIV-1 Gag localization occur in HT*A cells. HIV-1 Gag was detected by immunofluorescence with an antibody against CA(p24). Late endosomes were revealed with transiently expressed TiVamp-CFP. Red, HIV-1 Gag (Gag-Cy3); green, TiVamp (TiVamp-CFP). Images correspond to a projection of three-dimensional stacks (47 × 45 μm). Insets show the magnification of the boxed areas (5 × 5 μm). Top, HIV-1 Gag accumulates in late endosomes; bottom, HIV-1 Gag is diffusely distributed in the cytoplasm. The arrow points to a site of cellular contact.
HIV-1 Gag Is Present in Late Endosomes
Because Gag is responsible for the recognition and packaging of genomic RNAs and is also essential for viral biogenesis, we investigated its trafficking. Late endosomes were identified with TiVamp-CFP, early and recycling endosomes with fluorescent transferrin, and HIV-1 Gag was detected by immunofluorescence with an antibody against CA(p24), which recognizes both processed and unprocessed forms of Gag. Similar to the case of HIV-1 RNAs, several patterns were observed (Fig. 2B). In the most frequent one (67% of the cells), Gag was diffuse in the cytoplasm. In the second pattern (33% of the cells), Gag was also present in intracellular vesicles corresponding mainly to late endosomes (Fig. 2B and supplemental Fig. S1). These endosomes were not deep invaginations of plasma membrane, as proposed in other systems (28, 57), because they were negative for the plasma membrane marker CD44 (data not shown). In addition, endosomal Gag did not correspond to endocytosed virions produced by surrounding cells (supplemental Fig. S2). We also noted that a minute amount of Gag was present at the plasma membrane (Fig. 2B). This is different from the strong enrichment observed in transient transfection (58) (see also Fig. 9A), but the high expression levels obtained in these conditions are known to induce the association of Gag with the plasma membrane (58). Nevertheless, we noted that, in our cell lines, Gag was frequently concentrated at sites of cellular contact (Fig. 2B and see Fig. 11B). In conclusion, although HIV-1 Gag and its genomic RNAs were predominantly diffuse in the cytoplasm, they were also present in endosomal compartments.
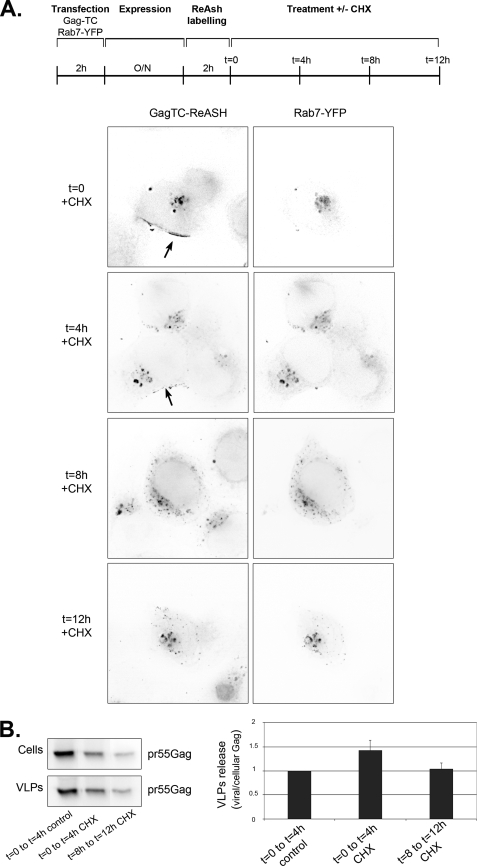
FIGURE 9.
A fraction of Gag is stably associated with late endosome and is able to produce viral particle. A, Gag resides a short time at the plasma membrane but a long time in endosomes. HT1080 cells were transfected with plasmids expressing Gag-TC and Rab7-YFP. 24 h post-transfection, cells were labeled with ReAsh during 2 h, incubated with 200 μm cycloheximide (CHX), and observed after various lengths of time (t in hours). Red, Gag (GagTC-ReAsh); green, Rab7 (Rab7-YFP). Images correspond to a projection of three-dimensional stacks (64 × 64 μm). Arrows point to plasma membrane staining. B, both endosomal and plasma-membrane Gag produce viral particles. Cells were transfected and incubated with cycloheximide as in A. At the indicated time (0 or 8 h), cells were washed and incubated for 4 additional hours in cycloheximide. Efficiency of viral release was calculated as the ratio of viral versus cellular Gag and normalized to values obtained in untreated cells. Results are the mean of three experiments done in duplicates (±S.E.).
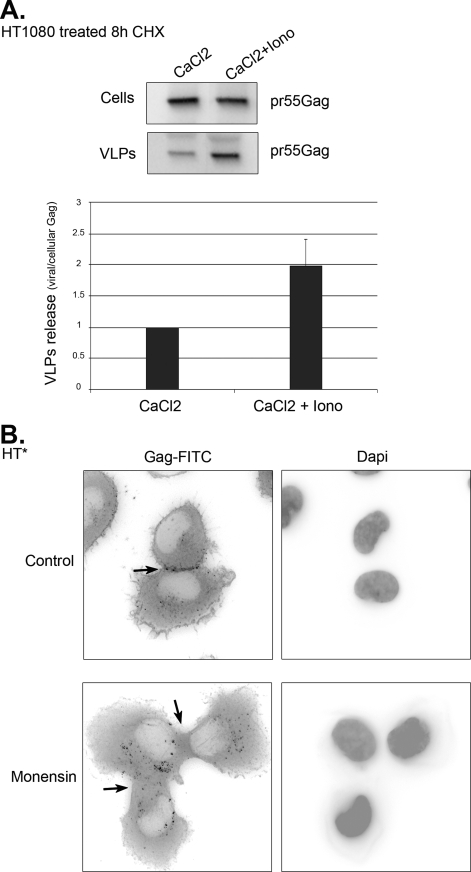
FIGURE 11.
Budding of endosomal Gag is regulated in time and space. A, endosomal exocytosis stimulates the release of endosomal Gag. HT1080 cells transfected with Gag-TC and treated for 8 h with cycloheximide were incubated for 10 min with 3 mm CaCl2 in the absence (CaCl2) or presence of 10 mm ionomycin (CaCl2 + Iono). Cells were washed, and viral production was assessed after 30 additional minutes. Viral release was normalized to CaCl2-treated cells. Mean of two experiments done in duplicate (±S.E.). B, inhibition of endosomal trafficking blocks the accumulation of HIV-1 Gag at sites of cellular contacts. HT* cells were treated or not with monensin, and HIV-1 Gag was detected by immunofluorescence with an antibody against CA(p24). The arrows point to sites of cellular contact.
Inhibition of Endosomal Traffic Induces the Accumulation of HIV-1 RNAs and Gag in Late Endosomes
To gain functional insights into the endosomal trafficking of HIV-1 Gag and genomic RNA, we used drugs that disrupted endosomal pathways: (i) monensin, an ionophore that neutralizes acidic intracellular compartments and leads to defects in vesicular budding; (ii) nocodazole, which depolymerizes microtubules and blocks motorized transport; and (iii) chloroquine, which inhibits late endosome-lysosome fusion and the degradation activity of lysosomes.
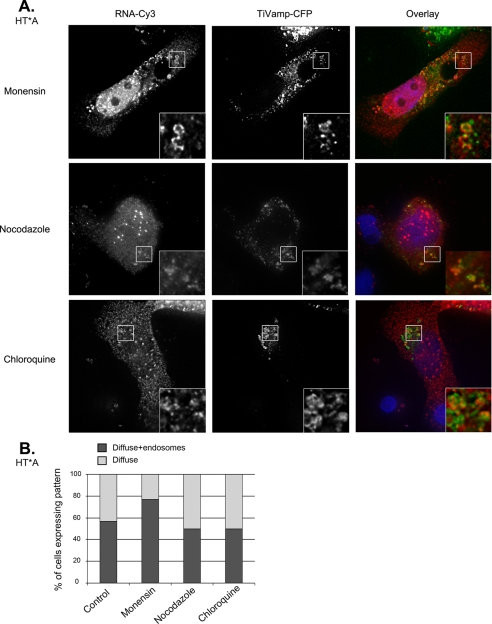
We first looked at the distribution of HIV-1 RNAs. To this end, HT* and HT*A cells were co-transfected with pTRIP-MS2×24 and TiVamp-CFP, treated with drugs and analyzed by FISH (Fig. 3A and data not shown). Nocodazole and chloroquine-treated cells were similar to control (Fig. 3B). However, monensin increased the presence of HIV-1 RNAs on endosomes as they could be detected there in 77% of the cells.
FIGURE 3.
Drugs that disrupt endosomal pathways affect the trafficking of HIV-1 RNAs. A, localization of HIV-1 RNAs after drug treatments. HT*A cells were co-transfected with pTRIP-MS2×24 and TiVamp-CFP and treated with the indicated drugs. HIV-1 RNAs were detected by FISH. Red, HIV-1 RNA (RNA-Cy3); green, TiVamp (TiVamp-CFP). Images correspond to a projection of three-dimensional stacks (60 × 60 μm). Insets show magnifications of the boxed areas (7 × 7 μm). The most frequent pattern is shown. B, quantitation of HIV-1 RNA patterns following drug treatment. For each condition, 100–150 cells were counted.
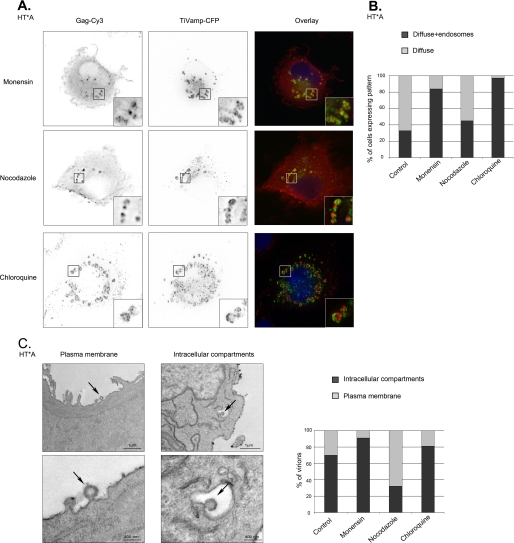
We next investigated the trafficking of Gag (Fig. 4, A and B, and data not shown). Nocodazole-treated HT* and HT*A cells displayed a slightly more frequent accumulation of Gag in late endosomes (in 45% of the cells versus 33% for control). This effect was, however, much more pronounced in cells treated with monensin or chloroquine (84 and 97% of cells, respectively). Thus, disruption of endosomal trafficking induced an accumulation of viral RNAs and Gag on endosomes.
FIGURE 4.
HIV-1 Gag accumulates in late endosomes upon disruption of endosomal pathways. A, analysis of Gag localization by immunofluorescence. HT*A cells were treated with the indicated drugs, and HIV-1 Gag was detected by immunofluorescence with an antibody against CA(p24). Late endosomes were revealed with transiently expressed TiVamp-CFP. Red, HIV-1 Gag (Gag-Cy3); green, TiVamp (TiVamp-CFP). Images correspond to a projection of three-dimensional stacks (47 × 45 μm). Insets show magnifications of the boxed areas (5 × 5 μm). The most frequent pattern is shown. B, quantitation of Gag patterns following drug treatment. For each condition, 100–150 cells were counted. C, analysis of viral assembly by EM. Thin-section electron micrographs of untreated HT*A cells (left panels). Cells were treated as in A, and virions budding at the plasma membrane or in intracellular compartments were quantitated by counting 50 to 70 nascent particles in each condition (right panel).
To confirm these effects and to visualize viral assembly, we analyzed cells by electron microscopy (Fig. 4C). In HT*A cells, we observed nascent virions both at the plasma membrane and in intracellular compartments. Quantitation of the images revealed that 33% of nascent virions were present at the plasma membrane and 67% in intracellular compartments. Treatment with monensin and chloroquine induced an accumulation of nascent virions in intracellular compartments, up to 91 and 81%, respectively.
Altogether, our data indicated that the endosomal localization of HIV-1 RNAs, Gag, and nascent virions increased dramatically when endosomal trafficking was perturbed, suggesting that their transport through the endosomal pathway was a transient and dynamic phenomenon.
Transport of Newly Synthesized Gag to Endosomes Does Not Require Dynamin-dependent Endocytosis
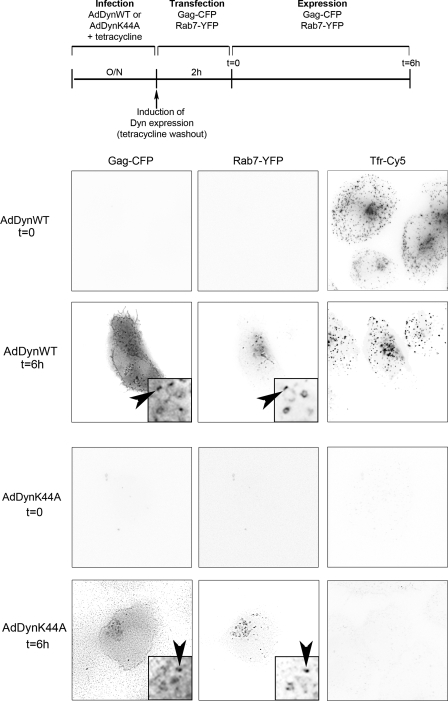
The next question was to elucidate the origin of endosomal Gag and viral RNAs. We envisioned two non-exclusive possibilities. First, Gag could be addressed to the plasma membrane after its synthesis, where a fraction could undergo endocytosis to reach endosomal compartments. Second, Gag could be directly transported to endosomes without transiting through the plasma membrane. To visualize the trafficking of newly synthesized Gag, we performed a microscopic pulse-labeling experiment, both in control cells and when dynamin-dependent endocytosis was inhibited. Dynamin is essential for clathrin-dependent and cholesterol-dependent endocytosis via caveolae (59), and both pathways have been involved in Gag internalization (26, 27, 60). Some dynamin-independent endocytic routes have also been described (59), but these are poorly documented, and there is currently no evidence that HIV-1 Gag could use them. A dominant-negative dynamin mutant (AdDynK44A) was thus expressed from a tetracycline-inducible adenovirus. Inhibition was efficient, because this abolished endocytosis in more than 80% of cells (Fig. 5 and data not shown).
FIGURE 5.
Dynamin-dependent endocytosis is not required for targeting Gag to late endosomes. HT1080 cells were infected with AdDynWT or AdDynK44A, transfected for 2 h with vectors expressing Gag-CFP and Rab7-YFP, and incubated for 6 additional hours. Labeling of cells with Cy5-transferrin (Tfr-Cy5) shows the inhibition of endocytosis. Red, Rab7 (Rab7-YFP); green, Gag (Gag-CFP). Images correspond to a single plane of a deconvolved image (54 × 54 μm). Insets show magnifications of the boxed areas (7 × 7 μm). Arrowheads indicates Rab7 endosomes containing Gag.
To analyze the traffic of newly synthesized Gag, HT1080 cells were infected with AdDynWT or AdDynK44A. Expression of these constructs was induced by withdrawing tetracycline from the media, and cells were then simultaneously transfected for 2 h with vectors expressing both a CFP-tagged version of Gag that buds without visible defects (50), and Rab7-YFP, a late endosomal marker. Six hours after transfection, we could readily detect Gag accumulating in Rab7-positive endosomes in cells infected with AdDynWT (in 95% of cells, Fig. 5). Moreover, in cells infected with AdDynK44A, Gag also localized in endosomes (in 87% of the cells). This Gag was produced in cells unable to perform endocytosis, because this was already inhibited after the 2-h transfection period, at which point CFP-Gag was not yet detectable (Fig. 5, AdDynK44A t = 0 panels). This demonstrated that Gag could reach endosomes when dynamin-dependent endocytosis was inhibited, suggesting that a fraction of Gag was directly targeted to endosomes without first trafficking through the plasma membrane.
Inhibiting Endosomal Traffic Increases Viral Production
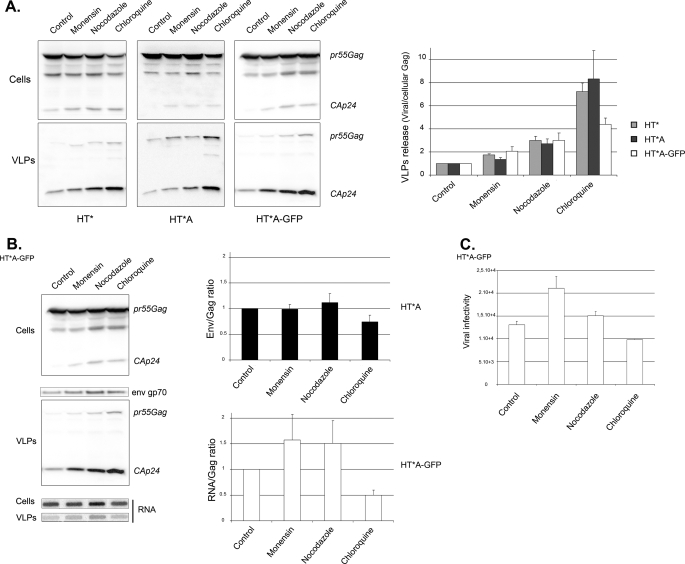
To evaluate the role of the endosomal Gag during viral replication, we treated Gag-producing cell lines with endosomal inhibitors and measured viral release. Surprisingly, and in contrast to what had been previously found for MLV (41), all drugs enhanced the production of HIV-1 particles (Fig. 6A). In HT* and HT*A cells, it increased 2-fold with monensin, 3-fold with nocodazole, and an impressive 7-fold with chloroquine. Similar results were observed in HT*A-GFP cells, but the effect of chloroquine was slightly weaker as it increased viral production by 3.5-fold. To test whether Gag was released as bona fide virions rather than in exosomes, supernatants of treated cells were analyzed on 5–20% iodixanol gradients. Exosomes are well separated from virions under these conditions, with exosomes migrating in the top third of the gradient and virions in the bottom third (75). Indeed, Gag was released as virions (supplemental Fig. S3). In addition, these viral particles were able to incorporate the envelope and genomic RNAs (Fig. 6B) and had an infectivity similar to wild-type particles (Fig. 6C).
FIGURE 6.
Inhibition of endosome and lysosome function increases the production of infectious viral particles. A, disruption of endosomal pathways enhances the production of viral particles. HT*, HT*A, and HT*A-GFP cells were incubated with the indicated drugs. Cellular and viral fractions were analyzed by Western blots. Viral release is the ratio between the amount of total Gag (Pr55Gag + Ca(p24)) in viral and in cellular fractions, normalized to the value of non-treated cells. HT* cells (gray bars): mean of six experiments done in triplicates; HT*A cells (black bars): mean of three experiments done in triplicates; HT*A-GFP cells (white bars): mean of two experiments done in triplicates (±S.E.). B, incorporation of genomic RNAs and MLV envelope. HT*A and HT*A-GFP cells were incubated with drugs and cellular and viral fractions were prepared. Gag and Env were analyzed by Western blotting and viral RNA by slot blots. Results were normalized to control cells. HT*A: mean of three experiments; HT*A-GFP: mean of two experiments (±S.E.). C, viral infectivity. HT*A-GFP cells were incubated with drugs as in A, and viral infectivity was defined as the titer normalized to the amount of secreted Gag, set to 1 for the control. Results are the mean of two experiments done in triplicate (±S.E.).
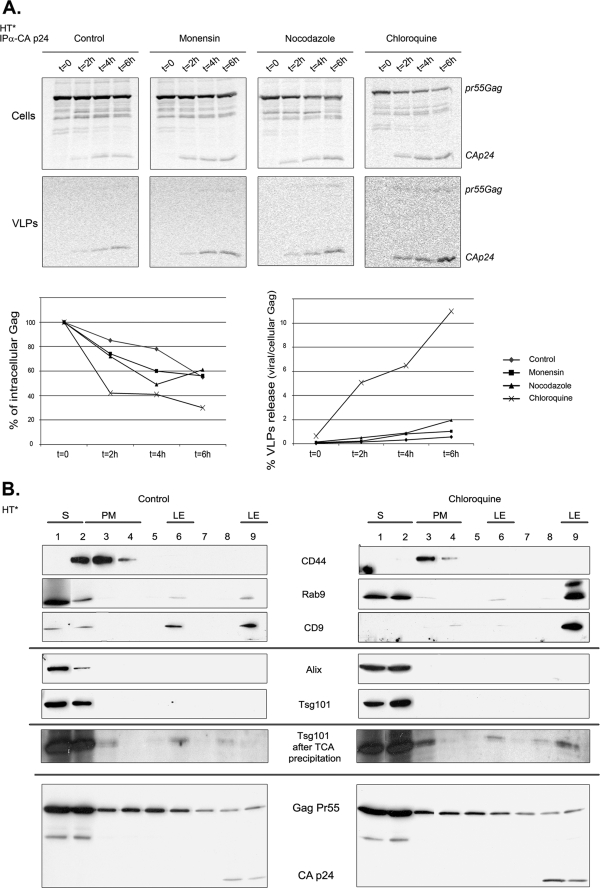
To extend these results, we examined the behavior of newly synthesized Gag by pulse-chase analysis (Fig. 7A). Similar to what has been observed previously (61), only a small fraction of Gag formed viral particles. Moreover, the amount of pulse-labeled Gag decreased during the chase, and only 55% of Gag was recovered after 6 h, suggesting that a large amount was degraded. Nevertheless, in agreement with steady-state experiments, cells treated with monensin and nocodazole generated two to three times more virions (Fig. 7). Inhibition of lysosomal degradation by chloroquine did not stabilize Gag, but it induced a dramatic 20-fold increase in viral production.
FIGURE 7.
Inhibition of endosome and lysosome function increases the release of newly synthesized Gag without perturbing the subcellular distribution of Alix and Tsg101. A, kinetic of degradation and budding of newly synthesized Gag. HT* cells were pulse-labeled with [35S]Met during 10 min and chased for the indicated time in presence of drugs. Cellular and viral fractions were prepared, and Gag was immunoprecipitated and quantified. Results are expressed as percentages of the amount of Gag initially labeled (mean of two experiments). B, treatment with chloroquine does not perturb the subcellular localization of Tsg101 and Alix. Extracts of untreated (left panel) and chloroquine-treated (right panel) HT* cells were fractionated on iodixanol gradients and analyzed by Western blots with the indicated antibodies. Bottom panel, overexposure of the blots to show the presence of Tsg101 in late endosomes. S, soluble; PM, plasma membrane; and LE, late endosomes.
To exclude the possibility that chloroquine treatment resulted in overexpression or re-localization of ESCRT machineries, leading to uncontrolled budding of viral particles, we analyzed the subcellular distribution of Tsg101 and Alix by fractionation on iodixanol gradient (Fig. 7B). Plasma membrane and late endosomal fractions were identified with antibodies against CD44 and Rab9 (or CD9), respectively. In both control and chloroquine-treated cells, Alix and Tsg101 localized predominantly in fraction 1 (top, soluble fraction) and to a lesser extent in fraction 2, containing soluble proteins and plasma membrane. They were not readily detected in late endosomal fractions (fractions 6 and 9). However, following concentration of extracts by trichloroacetic acid precipitation and overexposure of the blots, Tsg101 was weakly detected in late endosomes in both untreated and treated cells. Thus, the subcellular profiles of Tsg101 and Alix were not influenced by drug treatment. In contrast, Gag was detected in the soluble fraction, as well as at the plasma membrane and in late endosomes, and treatment with chloroquine increased the amount of Gag in late endosomes.
Altogether, these experiments demonstrated that inhibition of endosomal traffic did not prevent release of HIV-1 virions, in contrast to the case of MLV (41). Furthermore, they indicated that, although a significant fraction of Gag was normally degraded in lysosomes, it could generate viral particles when lysosomes were not functional. These experiments thus suggested that Gag could use both endosome-dependent and independent routes.
Virions Rescued by Chloroquine Treatment Do Not Originate from Dynamin-dependent Endocytosis
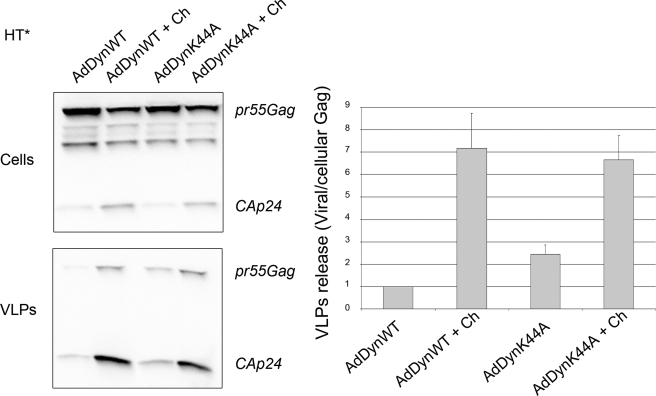
To determine if the endosomal Gag rescued by chloroquine treatment had transited through the plasma membrane or originated directly from the cytosol, we analyzed the effect of inhibiting endocytosis on Gag release. HT* cells infected with AdDynWT were similar to control, whereas cells infected with AdDynK44A increased viral production by 2-fold (Fig. 8). These data indicated that a fraction of Gag localized at the plasma membrane was subjected to endocytosis, but could bud upon the endocytic block. Nevertheless, because inhibiting lysosomal degradation with chloroquine stimulated budding 7-fold, it appeared that the majority of Gag rescued by chloroquine was directly transported to endosomes without first transiting through the plasma membrane. However, another possibility was that some plasma membrane Gag required to be addressed to endosomes to become competent for budding. To distinguish between these possibilities, we simultaneously inhibited endocytosis and blocked lysosomal degradation with chloroquine. Chloroquine-treated HT* cells infected with AdDynWT increased viral release by 7-fold (Fig. 8), as observed in control cells (Fig. 6A). Moreover, chloroquine also stimulated viral release in cells infected with AdDynK44A (3.5-fold), to reach a level equivalent to AdDynWT-infected cells. These results indicated that most of the endosomal Gag rescued by chloroquine treatment had not transited previously through the plasma membrane.
FIGURE 8.
Inhibition of dynamin-dependent endocytosis does not prevent the enhancement of viral release by chloroquine. HT* cells were infected with AdDynWT or AdDynK44A and incubated with chloroquine (Ch). Cellular and viral fractions were purified and analyzed by Western blotting using CA(p24) antibodies (left panels). Viral release represents the ratio between viral and cellular Gag (Pr55Gag plus CA(p24)), and results are normalized to untreated AdDynWT cells (right panel). Results are the mean of seven experiments (±S.E.).
Viral Production Does Not Correlate with Plasma Membrane Localization of Gag
The previous data suggested that endosomal Gag could use retrograde pathways to reach the plasma membrane. To support this possibility, we performed a microscopic chase experiment. We used a Gag-TC construct, which contains a tetracysteine tag (CCPGCC) fused to the C-terminal domain of Gag and allows visualization of old and newly synthesized proteins in living cells by successive rounds of labeling with red and green arsenite conjugates (51, 62, 63). However, it was difficult to obtain reliable signals in two colors, and we thus preferred to simply chase the existing protein by stopping its synthesis with cycloheximide. HT1080 cells were transfected with Rab7-YFP and Gag-TC expression vectors and treated with cycloheximide (Fig. 9A). At the beginning of the chase (t = 0), Gag accumulated both at the plasma membrane and in intracellular Rab7-positive compartments (in 80% of cells). After 4 h of chase (t = 4 h), the staining of Gag at the plasma membrane decreased and was observed only in 45% of cells while Gag still accumulated in endosomes. After 8 h of chase, Gag was detectable at the plasma membrane in <20% of the cells and was exclusively detected in endosomes in 80% of cells. This pattern was then stable, because Gag remained in endosomes even after 12 h of cycloheximide treatment. In control cells not treated with cycloheximide, the distribution of Gag remained unchanged with 80% of cells displaying both plasma membrane and endosomal localization (data not shown). Thus, Gag molecules were transiently localized at the plasma membrane and a fraction had a long residency time in endosomes. This allowed us to measure their respective contribution in viral production. Cells treated with cycloheximide generated viral particles as efficiently as control cells (Fig. 9B). Moreover, there were no differences in budding efficiency during the first 4 h after cycloheximide addition and the 8- to 12-h period, despite the disappearance of Gag from the plasma membrane. Similar results were obtained with HT* cells that stably express Gag (data not shown). We thus observed no correlation between the intra-cellular localization of Gag and the efficiency of viral release, and the simplest interpretation of these data was that plasma membrane and endosomal Gag had similar abilities to generate viral particles.
Viral Production Is Inhibited by TiVamp Depletion
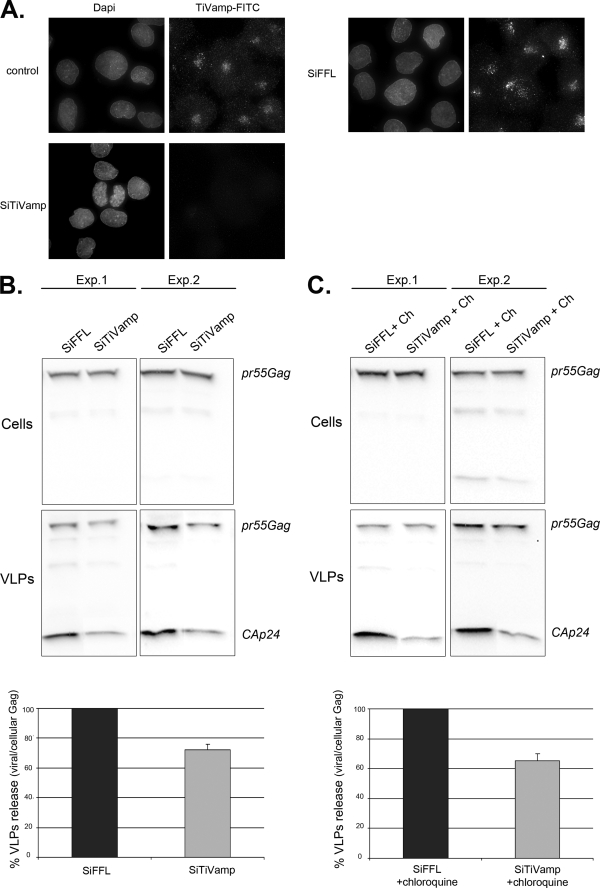
To formally prove that endosomal Gag produced virions and to decipher the mechanisms involved, we attempted to inhibit its retrograde transport to the plasma membrane. Because we had previously observed that Gag and viral RNAs co-localized with TiVamp, which is involved in fusion events between late endosomes and the plasma membrane (64), we investigated a possible role of TiVamp in HIV-1 budding. HT* cells were transfected with siRNAs against TiVamp, and viral production was measured. siRNAs were very efficient, because TiVamp became undetectable in >90% of the cells (Fig. 10A). Remarkably, TiVamp depletion decreased viral production by 30% (Fig. 10B). Moreover, the siRNAs also inhibited budding upon chloroquine treatment (35%, Fig. 10C). This demonstrated that endosomal Gag contributed to viral production, and that one-third used a TiVamp-dependent route to exit cells.
FIGURE 10.
Depletion of the v-SNARE TiVamp decreases viral release. A, TiVamp depletion is efficient. HT* cells were transfected with siRNA against FFL or TiVamp, incubated during 72 h, and fixed. TiVamp was detected by immunofluorescence with a monoclonal antibody (green). B, TiVamp depletion impairs viral release. HT* cells were transfected with siRNAs against FFL or TiVamp. After 72 h, cells were washed and incubated for an additional 6 h. Cellular and viral fractions were analyzed by Western blotting (two different experiments are shown). Results were normalized to cells transfected with FFL siRNAs, and five experiments done in triplicates were averaged (±S.E.; p < 0.05). C, TiVamp depletion impairs viral release in chloroquine-treated cells. Legend as in B, except that cells were incubated with chloroquine (Ch, 20 μm) during the 6-h incubation period. Results are the mean of four experiments done in triplicates, p < 0.05 (±S.E.).
Release of Endosomal Gag Is Stimulated by Endosomal Exocytosis and Occurs Preferentially at Sites of Cellular Contact
Previous work suggested that endosomal Gag could divert the cellular exocytic machinery to reach the cell surface (32, 33, 36, 38). To re-examine this hypothesis, we treated cells with cycloheximide for 8 h to deplete Gag from the plasma membrane. Late endosomal and lysosomal exocytosis was then induced by incubating cells with ionomycin, an ionophore that raises the concentration of intracellular calcium (65). This enhanced viral production by a factor of two, suggesting that the release of endosomal Gag was regulated by extracellular signals (Fig. 11A).
As mentioned above, HIV-1 Gag frequently accumulated at sites of cellular contact in HT* cells (in 93% of the cells (Fig. 11B)). We thus asked if this localization could be altered by perturbing endosomal trafficking. Indeed, treatment with monensin, which prevents trafficking out of endosomes, increased the amount of Gag in endosomes and induced a simultaneous loss of Gag at sites of cellular contact (in 85% of the cells). Altogether, these experiments suggested that release of endosomal Gag could occur at specific sites.
DISCUSSION
Although HIV-1 Gag has been shown to localize at the plasma membrane and in endosomes, its trafficking pathway is still not well understood. Among key questions are the origin and fate of endosomal Gag and, in particular, whether it can significantly contribute to the generation of viral particles. In this study, we coupled microscopic and biochemical approaches with inhibition of specific steps of the endocytic pathway to address these questions. Importantly, most of our analyses were done with stably transfected cell lines, which avoid the high expression levels achieved in transient transfections and known to induce the translocation of Gag to the plasma membrane (58).
A Fraction of Gag Is Directly Transported from the Cytosol to Late Endosomes
Our study reveals a number of surprising features in the intracellular trafficking of Gag. First, our results indicate that newly synthesized Gag can reach late endosomes without first transiting through the plasma membrane. Indeed, we observed that, when a CFP-Gag fusion was expressed in cells unable to perform dynamin-dependent endocytosis, Gag could still accumulate in late endosomes. Nevertheless, this does not exclude that plasma membrane Gag can be also endocytosed to reach endosomes, and in fact our results suggest that this occurs as budding increases 2-fold when endocytosis is inhibited. Our data contrast to that of Jouvenet et al. (27), who reported that Gag-GFP fails to reach endosomes upon expression of dominant-negative forms of Rab5 or Eps15, which block some dynamin-dependent endocytic pathways. The reasons for this discrepancy are not clear, but could be due to the cell line used (293T versus HT1080), the fluorescent Gag fusion, or the amount of Gag expressed. Importantly, a direct cytosol-to-endosome route is also supported by our functional analysis of viral budding. Indeed, we show that inhibition of lysosomal degradation by chloroquine increases the release of viral particles 7-fold, whereas inhibition of endocytosis increases the release of viral particles only 2-fold. Thus, the cytosol-to-endosome pathway is quantitatively important as it represents several times the amount of Gag that forms viral particles under control conditions. Although this route is rather unusual, it has been previously observed for the cytosolic protein c-Jun, which is transported to late endosomes/lysosomes in a ubiquitin-dependent manner and degraded there (67). A similar pathway may operate for HIV-1 Gag, because inhibition of lysosomal function by chloroquine leads to a dramatic accumulation of Gag in late endosomes.
The mechanisms that could directly target HIV-1 Gag to late endosomes remain to be characterized. However, we note that the attachment of Gag to membranes requires a structural switch in MA to expose the myristoyl anchor. This conformational change can be induced by the binding of phosphatidylinositol 4,5-bisphosphate, which is mainly localized at the plasma membrane, but also by the multimerization of Gag on the RNA (66, 68, 69). Furthermore, several endosomal proteins like TIP47 and AP-1 bind MA (70, 71) and could thus potentially induce the myristoyl switch in proximity to endosomal membranes.
It has been previously shown that cells contain a restriction factor, recently identified as tetherin (72), which prevents the release of Gag from the plasma membrane (73, 74). Interestingly, tetherin induces Gag endocytosis and its accumulation in intracellular compartments, whereas the viral protein Vpu is able to counteract this effect (72). Our results show that another major restriction of viral release occurs by the direct transport of cytosolic Gag into late endosome, followed by rapid lysosomal degradation. Although tetherin and Vpu are not operating in the HT1080 cells used here, the fact that tetherin is present in various endosomal compartments raises the possibility that it could act not only at the plasma membrane but also in endosomes. Alternatively, HIV-1 virions that bud in late endosomes might escape tetherin surveillance.
HIV-1 Gag Uses Endosome-dependent and Endosome-independent Pathways to Produce Virions
Our study attempted to trace the origin of HIV-1 virions by inhibiting specific transport steps and analyzing the release of viral particles. We believe that this is a key approach to complement localization studies, because only a small fraction of Gag generates virions, and global analyses of Gag localization can thus be misleading. Furthermore, the trafficking of Gag through some compartments can be very transient and underestimated by steady-state localization studies.
Our pulse-chase and steady-state experiments performed in the presence of various inhibitors allowed us to draw several conclusions for the trafficking of Gag and its impact on viral egress. First, as noted previously (61), only a small fraction of Gag generates viral particles. Second, a large fraction of Gag does not require endosomal trafficking to generate virions, as also proposed by several studies (26, 27). Indeed, virions are produced efficiently when endocytosis or endosomal transport is blocked with dynamin, nocodazole, monensin, or chloroquine. Third, transport to endosomes negatively regulates viral egress, because inhibition of either endocytosis or lysosomal degradation increases budding 2- and 7-fold, respectively. Fourth, Gag molecules present in endosomes can access retrograde routes to reach the plasma membrane and to produce virions. Indeed, treatments with drugs that act late on the endocytic pathway, downstream of the plasma membrane, increase viral budding. Finally, we identified one of these retrograde routes with TiVamp, a v-SNARE required for the fusion of late endosome with the plasma membrane. Indeed, TiVamp co-localizes with both Gag and genomic RNAs in endosomes, and its inactivation reduces budding. Altogether, our data indicate that HIV-1 Gag can use at least two routes to produce virions, one that is independent of endosomes, and another one that requires them. This latter pathway generates a minor, but significant fraction of the virions.
Endosomes and RNA Packaging
Although the behavior of HIV-1 RNAs generally parallels the one of Gag, there are some interesting differences. First, inhibition of lysosomal degradation leads to a dramatic accumulation of Gag in late endosomes, whereas viral RNAs become only slightly enriched there. Second, this induces the release of nearly 2-fold more Gag than viral RNAs, suggesting that inhibition of lysosomal degradation preferentially stabilizes and rescues Gag molecules not bound to viral RNAs. Interestingly, chasing Gag with cycloheximide revealed that late endosomes contain a stable population of Gag molecules, in addition to the ones transported to lysosomes for rapid degradation. In agreement with the possibility that this stable population could be bound to viral RNA, our videomicroscopy experiments indicate that viral RNAs are associated with late endosomes for extended periods of time. Such a stabilization of Gag by the viral RNAs would be consistent with their scaffolding role during the biogenesis of viral particles. It also suggests that endosomes participate in a quality-control step, because Gag molecules bound to genomic RNAs would preferentially escape lysosomal degradation and eventually be released in the extracellular media.
Endosomal Gag: A Means to Regulate Budding in Time and Space?
Several components of retroviruses have been observed in endosomes (32, 34, 36, 39, 41, 42), and this has led to a number of speculations regarding their role in viral biogenesis (see the introduction). Recent remarkable observations made in live macrophages have shown that “intracellular” HIV-1 Gag can be mobilized to the cell surface during the formation of infectious synapses (43). However, it is not yet clear whether this intracellular Gag corresponds to invaginations of the plasma membrane or to an endosomal pool of Gag. In this study, we show that, in HT* cells, inhibition of endosomal traffic by monensin prevents Gag accumulation at intercellular contact sites, indicating that the retrograde transport route that we have uncovered plays an important role in the subsequent delivery of Gag to specific sites of the plasma membrane.
It was previously shown that viral production is stimulated by increasing intracellular calcium concentration (32, 33). Our data confirmed that this is likely due to endosomal Gag. Altogether, these data support the possibility that endosomal Gag could generate virions in a regulated manner, i.e. at the appropriate time and place, particularly during and at sites of cellular contact. Thus, endosomal Gag may be specialized to propagate viruses by direct cell-cell contact, whereas plasma membrane Gag may preferentially produce circulating viruses.
Supplementary Material
Acknowledgments
We thank MRI for support with image acquisition and processing and T. Galli for the siRNA against TiVamp. We thank L. M. Traub for the gift of anti-Mu1 antibody.
Note Added in Proof
Related findings were reported recently by Lehmann et al. (Lehmann, M., Milev, M. P., Abrahamyan, L., Yao, X.-J., Pante, N., and Mouland, A. J. (2009) J. Biol. Chem. 284, 14572–14585).
This work was supported in part by EURASNET, ANRS, and SIDACTION.

The on-line version of this article (available at http://www.jbc.org) contains supplemental Figs. S1–S3 and Movies S1–S5.
L. Danglot and T. Galli, personal communication.
- HIV-1
- human immunodeficiency virus, type 1
- MA
- matrix
- CA
- capsid
- NC
- nucleocapsid
- FISH
- fluorescence in situ hybridization
- v-SNARE
- vesicle-soluble NSF attachment protein receptors
- DMEM
- Dulbecco's modified Eagle's medium
- PBS
- phosphate-buffered saline
- FBS
- fetal bovine serum
- siRNA
- small interference RNA
- MLV
- murine leukemia virus
- AdtTA
- recombinant adenovirus with tetracycline-regulatable chimeric transcription activator
- AdDynWT
- recombinant adenovirus with WT dynamin
- AdDynK44A
- recombinant adenovirus with dominant negative mutant
- GFP
- green fluorescent protein
- YFP
- yellow fluorescent protein
- CFP
- cyan fluorescent protein
- ESCRT
- endosomal sorting complex required for transport.
REFERENCES
- 1.Demirov D. G., Freed E. O. (2004) Virus Res. 106, 87–102 [DOI] [PubMed] [Google Scholar]
- 2.Göttlinger H. G. (2001) AIDS 15, S13–S20 [DOI] [PubMed] [Google Scholar]
- 3.Morita E., Sundquist W. I. (2004) Annu. Rev. Cell Dev. Biol. 20, 395–425 [DOI] [PubMed] [Google Scholar]
- 4.Accola M. A., Strack B., Gottlinger H. G. (2000) J. Virol. 74, 5395–5402 [DOI] [PMC free article] [PubMed] [Google Scholar]
- 5.Muriaux D., Mirro J., Harvin D., Rein A. (2001) Proc. Natl. Acad. Sci. U.S.A. 98, 5246–5251 [DOI] [PMC free article] [PubMed] [Google Scholar]
- 6.Hurley J. H. (2008) Curr. Opin. Cell Biol. 20, 4–11 [DOI] [PMC free article] [PubMed] [Google Scholar]
- 7.Williams R. L., Urbé S. (2007) Nat. Rev. Mol. Cell Biol. 8, 355–368 [DOI] [PubMed] [Google Scholar]
- 8.Stoorvogel W., Kleijmeer M. J., Geuze H. J., Raposo G. (2002) Traffic 3, 321–330 [DOI] [PubMed] [Google Scholar]
- 9.Trombetta E. S., Mellman I. (2005) Annu. Rev. Immunol. 23, 975–1028 [DOI] [PubMed] [Google Scholar]
- 10.Hicke L., Dunn R. (2003) Annu. Rev. Cell Dev. Biol. 19, 141–172 [DOI] [PubMed] [Google Scholar]
- 11.Piper R. C., Luzio J. P. (2007) Curr. Opin. Cell Biol. 19, 459–465 [DOI] [PMC free article] [PubMed] [Google Scholar]
- 12.Babst M., Katzmann D. J., Estepa-Sabal E. J., Meerloo T., Emr S. D. (2002) Dev. Cell 3, 271–282 [DOI] [PubMed] [Google Scholar]
- 13.Babst M., Katzmann D. J., Snyder W. B., Wendland B., Emr S. D. (2002) Dev. Cell 3, 283–289 [DOI] [PubMed] [Google Scholar]
- 14.Katzmann D. J., Babst M., Emr S. D. (2001) Cell 106, 145–155 [DOI] [PubMed] [Google Scholar]
- 15.Bieniasz P. D. (2006) Virology 344, 55–63 [DOI] [PubMed] [Google Scholar]
- 16.Demirov D. G., Orenstein J. M., Freed E. O. (2002) J. Virol. 76, 105–117 [DOI] [PMC free article] [PubMed] [Google Scholar]
- 17.Garrus J. E., von Schwedler U. K., Pornillos O. W., Morham S. G., Zavitz K. H., Wang H. E., Wettstein D. A., Stray K. M., Côté M., Rich R. L., Myszka D. G., Sundquist W. I. (2001) Cell 107, 55–65 [DOI] [PubMed] [Google Scholar]
- 18.Martin-Serrano J., Zang T., Bieniasz P. D. (2001) Nat. Med. 7, 1313–1319 [DOI] [PubMed] [Google Scholar]
- 19.VerPlank L., Bouamr F., LaGrassa T. J., Agresta B., Kikonyogo A., Leis J., Carter C. A. (2001) Proc. Natl. Acad. Sci. U.S.A. 98, 7724–7729 [DOI] [PMC free article] [PubMed] [Google Scholar]
- 20.Martin-Serrano J., Yarovoy A., Perez-Caballero D., Bieniasz P. D. (2003) Proc. Natl. Acad. Sci. U.S.A. 100, 12414–12419 [DOI] [PMC free article] [PubMed] [Google Scholar]
- 21.Strack B., Calistri A., Craig S., Popova E., Göttlinger H. G. (2003) Cell 114, 689–699 [DOI] [PubMed] [Google Scholar]
- 22.von Schwedler U. K., Stuchell M., Müller B., Ward D. M., Chung H. Y., Morita E., Wang H. E., Davis T., He G. P., Cimbora D. M., Scott A., Kräusslich H. G., Kaplan J., Morham S. G., Sundquist W. I. (2003) Cell 114, 701–713 [DOI] [PubMed] [Google Scholar]
- 23.Chung H. Y., Morita E., von Schwedler U., Müller B., Kräusslich H. G., Sundquist W. I. (2008) J. Virol. 82, 4884–4897 [DOI] [PMC free article] [PubMed] [Google Scholar]
- 24.Usami Y., Popov S., Popova E., Göttlinger H. G. (2008) J. Virol. 82, 4898–4907 [DOI] [PMC free article] [PubMed] [Google Scholar]
- 25.Martin-Serrano J. (2007) Traffic 8, 1297–1303 [DOI] [PubMed] [Google Scholar]
- 26.Finzi A., Orthwein A., Mercier J., Cohen E. A. (2007) J. Virol. 81, 7476–7490 [DOI] [PMC free article] [PubMed] [Google Scholar]
- 27.Jouvenet N., Neil S. J., Bess C., Johnson M. C., Virgen C. A., Simon S. M., Bieniasz P. D. (2006) PLoS Biol. 4, e435. [DOI] [PMC free article] [PubMed] [Google Scholar]
- 28.Deneka M., Pelchen-Matthews A., Byland R., Ruiz-Mateos E., Marsh M. (2007) J. Cell Biol. 177, 329–341 [DOI] [PMC free article] [PubMed] [Google Scholar]
- 29.Martin-Serrano J., Zang T., Bieniasz P. D. (2003) J. Virol. 77, 4794–4804 [DOI] [PMC free article] [PubMed] [Google Scholar]
- 30.Nydegger S., Khurana S., Krementsov D. N., Foti M., Thali M. (2006) J. Cell Biol. 173, 795–807 [DOI] [PMC free article] [PubMed] [Google Scholar]
- 31.Jouvenet N., Bieniasz P. D., Simon S. M. (2008) Nature 454, 236–240 [DOI] [PMC free article] [PubMed] [Google Scholar]
- 32.Grigorov B., Arcanger F., Roingeard P., Darlix J. L., Muriaux D. (2006) J. Mol. Biol. 359, 848–862 [DOI] [PubMed] [Google Scholar]
- 33.Perlman M., Resh M. D. (2006) Traffic 7, 731–745 [DOI] [PubMed] [Google Scholar]
- 34.Sherer N. M., Lehmann M. J., Jimenez-Soto L. F., Ingmundson A., Horner S. M., Cicchetti G., Allen P. G., Pypaert M., Cunningham J. M., Mothes W. (2003) Traffic 4, 785–801 [DOI] [PubMed] [Google Scholar]
- 35.Nydegger S., Foti M., Derdowski A., Spearman P., Thali M. (2003) Traffic 4, 902–910 [DOI] [PubMed] [Google Scholar]
- 36.Raposo G., Moore M., Innes D., Leijendekker R., Leigh-Brown A., Benaroch P., Geuze H. (2002) Traffic 3, 718–729 [DOI] [PubMed] [Google Scholar]
- 37.Pelchen-Matthews A., Kramer B., Marsh M. (2003) J. Cell Biol. 162, 443–455 [DOI] [PMC free article] [PubMed] [Google Scholar]
- 38.Nguyen D. G., Booth A., Gould S. J., Hildreth J. E. (2003) J. Biol. Chem. 278, 52347–52354 [DOI] [PubMed] [Google Scholar]
- 39.Jouve M., Sol-Foulon N., Watson S., Schwartz O., Benaroch P. (2007) Cell Host Microbe 2, 85–95 [DOI] [PubMed] [Google Scholar]
- 40.Goff A., Ehrlich L. S., Cohen S. N., Carter C. A. (2003) J. Virol. 77, 9173–9182 [DOI] [PMC free article] [PubMed] [Google Scholar]
- 41.Basyuk E., Galli T., Mougel M., Blanchard J. M., Sitbon M., Bertrand E. (2003) Dev. Cell 5, 161–174 [DOI] [PubMed] [Google Scholar]
- 42.Blot G., Janvier K., Le Panse S., Benarous R., Berlioz-Torrent C. (2003) J. Virol. 77, 6931–6945 [DOI] [PMC free article] [PubMed] [Google Scholar]
- 43.Gousset K., Ablan S. D., Coren L. V., Ono A., Soheilian F., Nagashima K., Ott D. E., Freed E. O. (2008) PLoS Pathog. 4, e1000015. [DOI] [PMC free article] [PubMed] [Google Scholar]
- 44.Lodge R., Lalonde J. P., Lemay G., Cohen E. A. (1997) EMBO J. 16, 695–705 [DOI] [PMC free article] [PubMed] [Google Scholar]
- 45.Pelchen-Matthews A., Raposo G., Marsh M. (2004) Trends Microbiol. 12, 310–316 [DOI] [PubMed] [Google Scholar]
- 46.Sharova N., Swingler C., Sharkey M., Stevenson M. (2005) EMBO J. 24, 2481–2489 [DOI] [PMC free article] [PubMed] [Google Scholar]
- 47.Boireau S., Maiuri P., Basyuk E., de la Mata M., Knezevich A., Pradet-Balade B., Bäcker V., Kornblihtt A., Marcello A., Bertrand E. (2007) J. Cell Biol. 179, 291–304 [DOI] [PMC free article] [PubMed] [Google Scholar]
- 48.Fusco D., Accornero N., Lavoie B., Shenoy S. M., Blanchard J. M., Singer R. H., Bertrand E. (2003) Curr. Biol. 13, 161–167 [DOI] [PMC free article] [PubMed] [Google Scholar]
- 49.Rink J., Ghigo E., Kalaidzidis Y., Zerial M. (2005) Cell 122, 735–749 [DOI] [PubMed] [Google Scholar]
- 50.Müller B., Daecke J., Fackler O. T., Dittmar M. T., Zentgraf H., Kräusslich H. G. (2004) J. Virol. 78, 10803–10813 [DOI] [PMC free article] [PubMed] [Google Scholar]
- 51.Rudner L., Nydegger S., Coren L. V., Nagashima K., Thali M., Ott D. E. (2005) J. Virol. 79, 4055–4065 [DOI] [PMC free article] [PubMed] [Google Scholar]
- 52.Muzerelle A., Alberts P., Martinez-Arca S., Jeannequin O., Lafaye P., Mazié J. C., Galli T., Gaspar P. (2003) Neuroscience 122, 59–75 [DOI] [PubMed] [Google Scholar]
- 53.Ikeda Y., Takeuchi Y., Martin F., Cosset F. L., Mitrophanous K., Collins M. (2003) Nat. Biotechnol. 21, 569–572 [DOI] [PubMed] [Google Scholar]
- 54.Le P. U., Guay G., Altschuler Y., Nabi I. R. (2002) J. Biol. Chem. 277, 3371–3379 [DOI] [PubMed] [Google Scholar]
- 55.Altschuler Y., Barbas S. M., Terlecky L. J., Tang K., Hardy S., Mostov K. E., Schmid S. L. (1998) J. Cell Biol. 143, 1871–1881 [DOI] [PMC free article] [PubMed] [Google Scholar]
- 56.Advani R. J., Yang B., Prekeris R., Lee K. C., Klumperman J., Scheller R. H. (1999) J. Cell Biol. 146, 765–776 [DOI] [PMC free article] [PubMed] [Google Scholar]
- 57.Welsch S., Keppler O. T., Habermann A., Allespach I., Krijnse-Locker J., Kräusslich H. G. (2007) PLoS Pathog. 3, e36. [DOI] [PMC free article] [PubMed] [Google Scholar]
- 58.Perez-Caballero D., Hatziioannou T., Martin-Serrano J., Bieniasz P. D. (2004) J. Virol. 78, 9560–9563 [DOI] [PMC free article] [PubMed] [Google Scholar]
- 59.Mayor S., Pagano R. E. (2007) Nat. Rev. Mol. Cell Biol. 8, 603–612 [DOI] [PMC free article] [PubMed] [Google Scholar]
- 60.Harila K., Salminen A., Prior I., Hinkula J., Suomalainen M. (2007) Virology 369, 299–308 [DOI] [PubMed] [Google Scholar]
- 61.Tritel M., Resh M. D. (2000) J. Virol. 74, 5845–5855 [DOI] [PMC free article] [PubMed] [Google Scholar]
- 62.Adams S. R., Campbell R. E., Gross L. A., Martin B. R., Walkup G. K., Yao Y., Llopis J., Tsien R. Y. (2002) J. Am. Chem. Soc. 124, 6063–6076 [DOI] [PubMed] [Google Scholar]
- 63.Gaietta G., Deerinck T. J., Adams S. R., Bouwer J., Tour O., Laird D. W., Sosinsky G. E., Tsien R. Y., Ellisman M. H. (2002) Science 296, 503–507 [DOI] [PubMed] [Google Scholar]
- 64.Proux-Gillardeaux V., Rudge R., Galli T. (2005) Traffic 6, 366–373 [DOI] [PubMed] [Google Scholar]
- 65.Reddy A., Caler E. V., Andrews N. W. (2001) Cell 106, 157–169 [DOI] [PubMed] [Google Scholar]
- 66.Tang C., Loeliger E., Luncsford P., Kinde I., Beckett D., Summers M. F. (2004) Proc. Natl. Acad. Sci. U.S.A. 101, 517–522 [DOI] [PMC free article] [PubMed] [Google Scholar]
- 67.Fang D., Kerppola T. K. (2004) Proc. Natl. Acad. Sci. U.S.A. 101, 14782–14787 [DOI] [PMC free article] [PubMed] [Google Scholar]
- 68.Saad J. S., Loeliger E., Luncsford P., Liriano M., Tai J., Kim A., Miller J., Joshi A., Freed E. O., Summers M. F. (2007) J. Mol. Biol. 366, 574–585 [DOI] [PMC free article] [PubMed] [Google Scholar]
- 69.Saad J. S., Miller J., Tai J., Kim A., Ghanam R. H., Summers M. F. (2006) Proc. Natl. Acad. Sci. U.S.A. 103, 11364–11369 [DOI] [PMC free article] [PubMed] [Google Scholar]
- 70.Camus G., Segura-Morales C., Molle D., Lopez-Vergès S., Begon-Pescia C., Cazevieille C., Schu P., Bertrand E., Berlioz-Torrent C., Basyuk E. (2007) Mol. Biol. Cell 18, 3193–3203 [DOI] [PMC free article] [PubMed] [Google Scholar]
- 71.Lopez-Vergès S., Camus G., Blot G., Beauvoir R., Benarous R., Berlioz-Torrent C. (2006) Proc. Natl. Acad. Sci. U.S.A. 103, 14947–14952 [DOI] [PMC free article] [PubMed] [Google Scholar]
- 72.Neil S. J., Zang T., Bieniasz P. D. (2008) Nature 451, 425–430 [DOI] [PubMed] [Google Scholar]
- 73.Harila K., Prior I., Sjöberg M., Salminen A., Hinkula J., Suomalainen M. (2006) J. Virol. 80, 3765–3772 [DOI] [PMC free article] [PubMed] [Google Scholar]
- 74.Neil S. J., Eastman S. W., Jouvenet N., Bieniasz P. D. (2006) PLoS Pathog. 2, e39. [DOI] [PMC free article] [PubMed] [Google Scholar]
- 75.Cantin R., Diou J., Bélanger D., Tremblay A. M., Gilbert C. (2008) J. Immunol. Methods 338, 21–30 [DOI] [PubMed] [Google Scholar]
Associated Data
This section collects any data citations, data availability statements, or supplementary materials included in this article.


