

Abstract
Technology-based instruction represents a new recent pedagogical paradigm that is rooted in the realization that new generations are much more comfortable with, and excited about, new technologies. The rapid technological advancement over the past decade has fueled an enormous demand for the integration of modern networking, informational and computational tools with classical pedagogical instruments. Consequently, teaching with technology typically involves utilizing a variety of IT and multimedia resources for online learning, course management, electronic course materials, and novel tools of communication, engagement, experimental, critical thinking and assessment.
The NSF-funded Statistics Online Computational Resource (SOCR) provides a number of interactive tools for enhancing instruction in various undergraduate and graduate courses in probability and statistics. These resources include online instructional materials, statistical calculators, interactive graphical user interfaces, computational and simulation applets, tools for data analysis and visualization. The tools provided as part of SOCR include conceptual simulations and statistical computing interfaces, which are designed to bridge between the introductory and the more advanced computational and applied probability and statistics courses. In this manuscript, we describe our designs for utilizing SOCR technology in instruction in a recent study. In addition, present the results of the effectiveness of using SOCR tools at two different course intensity levels on three outcome measures: exam scores, student satisfaction and choice of technology to complete assignments. Learning styles assessment was completed at baseline. We have used three very different designs for three different undergraduate classes. Each course included a treatment group, using the SOCR resources, and a control group, using classical instruction techniques. Our findings include marginal effects of the SOCR treatment per individual classes; however, pooling the results across all courses and sections, SOCR effects on the treatment groups were exceptionally robust and significant. Coupling these findings with a clear decrease in the variance of the quantitative examination measures in the treatment groups indicates that employing technology, like SOCR, in a sound pedagogical and scientific manner enhances overall the students’ understanding and suggests better long-term knowledge retention.
Keywords: education research, teaching with technology, Java applets, online course materials, probability and statistics
I. Introduction
a. General
Many modern approaches to enhancing liberal and science college education significantly rely on the availability and utilization of multimedia, networking, web, interactive, computational and visualization technologies. This recent paradigm shift to technology-based instruction is driven in part by the rapid advancement of technology, the proliferation of the Internet in all aspects of life and the intrinsic demand for the integration of information technology with classical pedagogical instruments. As a result of this, contemporary methods for teaching with technology typically involve utilizing variety of IT and multimedia resources for online learning, course management, electronic course materials, and novel tools of communication, engagement, experimental, critical thinking and learning assessment.
b. Study Objectives
With the increasing trend of incorporating technology in the classroom, the question we want to ask in the study is whether or not SOCR has an effect on students’ overall performance in the course. Because the traditional lecture structure primarily addresses auditory learners we also want to know: Was the SOCR able to further the understanding of topics taught in the course? Did its interactive applets and visualization help enhance students’ understanding? And finally, how did the students respond to this program?
Our main education research question is: given two group of students that are taught exactly the same material, and are demographically comparable, does the use of SOCR in one of them result in better quantitative outcomes (as measured by exam grades) and better satisfaction than in the control group, where SOCR is not used.
c. Technology-Based Instruction in Probability and Statistics Courses
Statistical analyses commonly involve a problem identification and description, data design and acquisition, theoretical model development, manual or automated data analysis and results interpretation (Whitley & Ball, 2002a; Whitley & Ball, 2002b; Whitley & Ball, 2002c; Whitley & Ball, 2002d; Whitley & Ball, 2002e). Most of the statistical pedagogical approaches follow a similar design with an emphasis on statistical thinking and practical aspects of data analysis (Lovett, 2000; Taplin, 2003). Advanced upper division courses are typically presented with enough rigor, putting emphasis on both data analysis and theoretical mathematical foundations. In contrast, lower division courses generally put more emphasis on data analysis and or empirical observations alone. In both cases, there are pedagogically valuable reasons for these choices. The first setting appears to be mostly adequate for teaching mathematically oriented students. Most of the statistics, applied science and engineering students prefer a more interactive and hands-on instruction to probability and statistics, with arts and humanity students at the far left spectrum. Some motivational, descriptive and practical aspects may be significantly downplayed by solely theoretical or entirely empirical instructional approaches. In-class demonstrations, use of contemporary probability problems and providing computer simulations could enhance the learning process and improve conceptual understanding in both settings.
The latest recommendations of many international pedagogical resources in probability and statistics (e.g., SurfStat (SurfStat), the Chance Project (ChanceProject), GAISE Report (GAISEReport), ASA (ASA), USCOTS (USCOTS), ARTIST (ARTIST), IASE, etc.) suggest that undergraduate students taking probability and statistics courses should be exposed to real-world problems and be given hands-on experiences in generating, collecting and displaying data, as well as trained in model-design, analysis and result interpretation (Cox, 1998; Hawkins, 1997; Taplin, 2003; Teugels, 1997). To address these necessities and improve content delivery in undergraduate statistics and probability courses we have built a dynamic collection of interactive online displays, simulations, games, tutorials, presentations and datasets.
Several national and international initiatives for overhauling science undergraduate education (including statistics) have also recently attracted significant interest from researchers, educators, policy makers and funding agencies. Some of those are the Multimedia Educational Resource for Learning and Online Teaching (MERLOT) (MERLOT), the DOE Gateway to Educational Materials (GEM) (GEM), Eisenhower National Clearinghouse for Mathematics and Science Education (ENC) (ENC), Fund for the Improvement of Postsecondary Education (FIPSE) (FIPSE), Regional Technology in Education Consortium (R*TEC) (RTEC) and CAUSEWEB(CAUSEWEB).
Evaluation of the effects of information and communications technology (ICT) on educational attainment are difficult to conduct and widely accept because of large variation curricula, study designs and specific of the ICT integration into the classroom. For example, a three-year study (ImpaCT2) was carried out in the United Kingdom, starting in 1999, to address a number of media reports of little or no impact of ICT on pupil attainment. This study involved over 2,000 pupils in 60 schools and is one of the most comprehensive investigation of the impact of ICT in education. This study found a positive relationship between ICT use by pupils and their performance in National Tests in 12 out of 13 subjects across key stages (Becta, 2003; Becta, 2006).
d. The Statistics Online Computational Resource (SOCR)
The SOCR resource (http://www.socr.ucla.edu) is an NSF-funded project that designs, implements, validates and integrates various interactive tools for statistics and probability education and computing. Many of the projects and initiatives discussed above are directed at the basic introduction to probability and statistics courses. SOCR resource tools attempt to bridge between the introductory and the more advanced computational and applied probability and statistics courses by including conceptual simulations, statistical computing interfaces and educational materials within the same environment.
There are a number of statistics educational, computational and visualization resources already available, with most of them briefly referenced below. The main reasons for developing the SOCR tools were: to provide a free, web-accessible and browser-independent suite of tools for probability and statistics education and computing; to have a well-designed, extensible and open-source library; to introduce a graphical user interface to statistical resources; and to present an integrated framework for course-materials, simulation and computation web-resources.
There are three major types of SOCR users: educators, students and tool developers. Course instructors and teachers will find the SOCR class notes and interactive tools useful for student motivation, concept demonstrations and for enhancing their technology based pedagogical approaches to any study of variation and uncertainty. Students and trainees may find the SOCR class notes, analyses, computational and graphing tools extremely useful in their learning/practicing pursuits. Model developers, software programmers and other engineering, biomedical and applied researchers may find the light-weight plug-in oriented SOCR computational libraries and infrastructure useful in their algorithm designs and research efforts.
The SOCR resource comprises of a hierarchy of portable online interactive aids for motivating, modernizing and improving the teaching format in college-level probability and statistics courses. These tools include a number of applets, user interfaces and demonstrations, which are fully accessible over the Internet. The SOCR resources allow instructors to supplement methodological course material with hands-on demonstrations, simulations and interactive graphical displays illustrating in a problem-driven manner the presented theoretical and data-analytic concepts. The SOCR framework received international attention following a Science magazine review of our probability and statistics resources (Leslie, 2003). SOCR consists of seven major categories of resources: interactive distribution modeler, virtual experiments, statistical analyses, computer generated games, a data modeler, a data-graphing tool and a collection of additional tools.
Until now, like many other technological tools, the SOCR resources have had limited testing in the classroom to determine their efficacy. Other studies exist that show other applets to be effective in different ways. For example, studies have found that students in introductory statistics courses react very positively to applets and interactive aids, both in term of enjoying playing with them as well as better understanding the concepts (Anderson-Cook, 2003). Because of lack of access to technology for all students, difficulties with designing evaluation experiments or for other reasons, no testing of the effectiveness of using interactive applets in student performance or other outcome measures exists. Even less evidence exists on the effectiveness of applets in teaching probability courses.
In this paper, we assess the effectiveness of SOCR using different designs, and different classroom environments. All three courses were taught at UCLA in the Fall of 2005. There were two sections of the same upper division course (Stat 100A), taught by different instructors, and one lower division course (Stat 13). This is the first time we are doing such quasi-experimentation and we saw many things we did not anticipate. Our findings are extremely useful to us, and may be others, for designing future similar studies or for assessing new intensive pedagogical instruments.
e. SOCR Tools Web Page Statistics
For the duration of the Fall quarter 2005 the SOCR resource pages, and the individual courses web pages, were heavily utilized by students. We have tracked this usage of the SOCR resource pages by IP addresses. Table 1 depicts the summary statistics for these two types of resource for users with UCLA bound IPs. Thus, we exclude from this summary all the background SOCR and class notes traffic that regularly occurs and steadily increases by about 20% quarterly. In Table 1, September may be used as an estimate of the SOCR background usage. October and November show significant volume increase. Using hour access, background access and user IP address statistics we estimate that for the Fall quarter in 2005 about 50–75% of the SOCR resource traffic was driven by the needs of the students enrolled in these three classes. We have less detailed course specific web-page utilization information. In October 2005, for example, the main 49 section-specific lower division course web pages had 1,814 and 1,466 unique users, respectively for Stat 13 section 1 (control) and section 2 (SOCR treatment).
Table 1.
SOCR Server Web Statistics
| Month | Unique visitors | Number of visits | Pages | Hits | Bandwidth |
|---|---|---|---|---|---|
| Sep 2005 | 1603 | 1993 | 8396 | 14602 | 842.41 MB |
| Oct 2005 | 2506 | 4110 | 20287 | 41108 | 2.13 GB |
| Nov 2005 | 2141 | 3199 | 16910 | 33428 | 1.50 GB |
| Dec 2005 | 318 | 419 | 3504 | 4661 | 252.03 MB |
f. Undergraduate Probability and Statistics Courses at UCLA
The complete list of UCLA probability and statistics undergraduate and graduate courses is available online at http://www.registrar.ucla.edu/catalog/catalog05-07-7-98.htm. We have lower and upper division undergraduate courses for majors, minors and service courses for a number of departments within the UCLA.
An undergraduate statistics major at UCLA requires 36 units from courses taken for a letter grade. A “C” or better grade is required in each preparation course with an overall minimum preparation GPA of 2.5. Each statistics undergraduate major must take at least 4 elective classes that add up to at least 16 units. Honors statistics classes and some service courses (Stat 89, 89HC, 110A, 110B, 189, and 189HC) do not count towards any of the major requirements. At UCLA, there is no pre-Statistics major, just a statistics major.
We have employed the SOCR tools and resources in an experimental setting in several of these classes over the past 3 years. However, this is the first account of a rigorous attempt to assess qualitatively and quantitatively the students’ perception and the efficacy of the SOCR resources for student motivation, enhancing the instructional process and improving students learning.
In this manuscript, we have assessed the efficacy of using SOCR tools in two types of courses – one section of Statistics 13, and two sections of Statistics 100A. Stat 13 is a lower division introduction to statistical reasoning for undergraduates in the Life Sciences. Its curriculum has the three basic modules: descriptive statistics, probability and Inference. No calculus is required, so the mathematical level is minimal, while data analysis is heavy. In contrast, Stat 100A is an upper division strictly introduction to probability course with no statistics, although instructors teach some descriptive statistics in order to be able to use simulation to explain some of the main concepts. This is a course taken typically by mathematics or statistics majors or minors who choose the graduate/professional school track. Stat 100A is calculus-based, and does not require that students have taken previously any other statistics courses.
g. Felder-Silverman-Solomon Learning Questionnaire
There are several established frameworks for describing learning styles. Most of them define a learning style as some description of the perception, attitude and behavior on the part of the learner, which determine the individual’s preferred way of acquiring new knowledge (Honey, 1992; Kolb, 1976). The individual learning style is an integral measure of many cognitive and psychological factors. It typically indicates an individual’s approach to responding to new learning stimuli. In this study, we employed the Felder-Silverman-Solomon learning style model as an instrument to compare the learning styles of the experimental and control groups at baseline.
The Felder-Silverman-Solomon learning style model (Felder, 1988; Felder, 2003) is a learning style approach, which was developed as a four dimensional model. It includes the following dimensions: Perception (sensing/intuitive), Input (visual/verbal), Processing (active/reflective) and Understanding (sequential/global). The reasons we have opted for this particular learning style assessment as an instrument to compare group differences at baseline are as follows: Firstly, it covers all four learning styles dimensions and is based on a sound theoretical model. Secondly, the instrument has been widely tested and used successfully in helping to guide the design, development and use of effective learning environments (Pearl, 2005), although, we did not used it for this purpose here. Thirdly, this instrument is simple to use and the results are easy to interpret. Fourthly, this instrument has been well validated, which makes it reliable in detecting preferred learning styles among students.
The dichotomous learning style dimensions of this model are continuous and not discrete categories. This means that the learner’s preference on a given scale does not necessarily belong to one of the poles. It may be strong, moderate, or almost non-existent. Active learners are described as those who learn by actively trying things and collaborating with others. Reflective learners’ preferences are for thinking rather than trying things through and they prefer working alone. Sensing learners prefer learning facts and procedures. Intuitive learners are innovative and oriented more toward concepts, theories and meanings. Visual learners prefer visual representations such as pictures, diagrams and charts while verbal learners prefer written or spoken explanations. Sequential learners are linear, orderly and learn in small incremental steps while global learners are holistic thinkers who learn in large leaps.
The instrument consists of 11 dichotomous groups of questions for measuring each of the four dimensions, and thus a total of 44 questions. Each question along a dimension is designed to determine if a respondent tends to belong to one category or another on that dimension (Felder, 1998). It does so by asking the respondent to choose only one of two options where each option represents each category. For example the Input dimension has two categories: Visual and Verbal. One of the Input dimension questions in the instrument is when I think about what I did yesterday, I am most likely to get (a) a picture or (b) words. A respondent who chooses (a) is one who tends to be a visual learner while one who chooses (b) tends to be a verbal learner. A respondent is classified as belonging to a particular category, for example, visual instead of verbal on the Input dimension, if he or she chooses more of the options that correspond to those of visual learners. Since there are 11 questions for each dimension, a respondent is always classifiable along each dimension. The range of data for each dimension is from 0 to 11 and there are 16 possible combinations, or types of learning in this model.
In this study, our objective with the Felder-Silverman-Solomon questionnaire was to determine whether students’ learning styles were a possible confounding factor mixing up the final comparison of treatment and control groups’ scores. Thus, if the control group had had a different proportion of learning styles than the experimental group, we would have had less confidence in the size of the SOCR effects. Group comparison at baseline was our only objective, the survey was given to students anonymously and on a voluntary basis, so we did not have a way to know which students had which learning styles. The summaries we obtained represent about 50% of the students who chose to participate. The only summaries we collected for each class is the proportion of type (a) or (b) answers to each question. To correlate the learning styles of the students with their scores, we would have designed the study differently by splitting into groups the weekly review sessions with the teaching assistant for each course. Then matching learning styles and groups and giving the same activities to all students, but presenting the material differently in each group according to the learning style most appropriate for each group.
To compensate for the lack of customization of our classes to student learning styles, we made it a point of teaching the class in a balanced way, i.e., trying to teach according to the needs of the two dimensions of all of the learning scales. Thus, in each class, we tried to address all learning styles. For example, to teach the concept of Central Limit Theorem we used in class experiments with dice to address the active learners, and mathematical deduction to please the reflective learners. In addition, we taught students to use the SOCR Central Limit Theorem applet to address the needs of the visual learners, and explained the applet in a written page to address the needs of the verbal learners. To address the needs of both sequential and global learners, we taught appropriate concepts at the right time in the course, after we had covered enough background for all students to understand the material. Finally, to engage the sensing and intuitive learners, we made sure that the assessment materials we used in exams and homework contained problems that required finding facts (e.g., simple simulations to find the specifics of the Central Limit Theorem under specific circumstances) for the sensing learning style or problems that required applications to new areas of study for the intuitive learners.
The question: does SOCR have a different impact depending on the student’s learning style is a very interesting research question and we plan to pursue this in a future study. This will involve a different design, with different objectives, compared to this current study; however, given that our preliminary results are so encouraging it will be a worthwhile pursuit.
II. Designs, Methods and Results
We now present separately our designs, methods and findings for each of the three courses that we compared traditional (control) and SOCR-based (treatment) instruction. We have intentionally used different experimental designs for the three courses in which we applied traditional and SOCR-based instruction in the Fall of 2005. The course materials, student composition and study design were all quite different in the three studies we report on. One common feature is that all three courses used the SOCR introductory survey to assess whether the treatment and control groups were comparable in what concerned learning styles at baseline. This survey was based on Felder-Silverman-Solomon learning style assessment tool. The response rate of this anonymous survey was about 50% within each class. We had obtained a UCLA Institutional Review Board (IRB) approval of all the methods and techniques we used for our data collection.
a. Statistical Methods for the Life and Health Sciences (UCLA Stat 13(1) and Stat 13(2), Dinov)
i. Course Description
Stat 13 is an introductory course on statistical methods for the life and health sciences. Most enrolled students are bound for medical, graduate and professional schools after completing their undergraduate curricula. The complete course description, coverage, assignments, class-notes, grading schema and all course related materials are available online at http://www.stat.ucla.edu/~dinov/courses_students.dir/05/Fall/STAT13.2.dir/STAT13.html.
Two sections of this course were taught – a control section (traditional instruction) and treatment section (SOCR-based instruction). Each of the two sections taught for this study received 5 hours of instruction a week – 3 lectures, one discussion and one laboratory. For discussion and laboratory, each section was split into three sub-sections, which were conducted by teaching assistants. There were two distinct teaching assistants for each section. In both groups, student learning was assessed using the same gradebook schema and grade distribution, the same examinations and homework assignments. Different laboratory assignments were conducted in the two sections reflecting the traditional R versus the SOCR training and instruction during laboratory work.
ii. Student Demographics (treatment vs. control group)
Table 2 shows some of the student demographics of the two groups in this experiment. Each section started off with 90 enrolled students and 5 people on waiting list. Upon completion of the courses there were 83 students in the control group and 88 in the treatment group. The slightly better retention in the treatment group may be caused by the treatment itself, by the slightly different group demographics or may be the result of the time of the treatment course MWF 10–11 AM, vs. the time for the control group MWF 9–10 AM.
Table 2.
Stat 13 Student Demographics (at the end of the quarter).
| Demographics | Stat13 section1 Control | Stat13 section 2 Treatment |
|---|---|---|
| Freshmen | 24 | 7 |
| Sophomores | 18 | 14 |
| Juniors | 16 | 38 |
| Seniors | 23 | 29 |
| Graduates | 2 | 0 |
| Total | 83 | 88 |
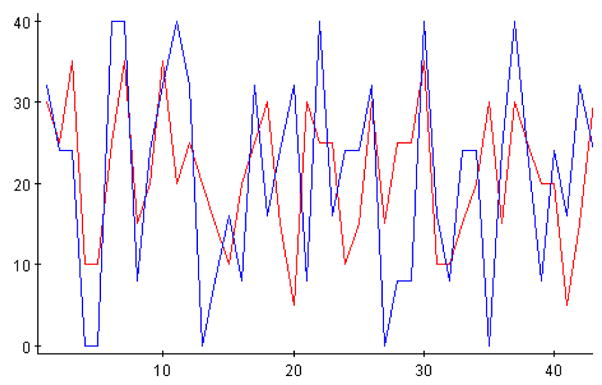
When comparing the treatment and control group’s responses to the Felder-Solomon Index of Learning Styles questionnaire (Felder, 1988; Felder, 2003) we got a chi-square statistic x2o = 46.85 ~ χ2(42) which yields a p-value of 0.28 (we had only compared the normalized raw frequencies of “a” responses to these 44 dichotomous questions between the two groups). This indicates the two sections of Stat 13 (control and treatment groups) are not significantly distinct in their learning styles, course information processing and a priori thinking. These findings are graphically illustrated on Figure 1, where we show only the frequencies of the “a” responses to all 44 questions of the Felder-Silverman-Solomon questionnaire.
Figure 1.

Statistically insignificant differences between the Stat 13 (Dinov) treatment and control classes according to the beginning of the quarter Felder-Solomon questionnaire. Figure shows only the frequencies of the “a” responses to all questions from the two groups. The horizontal and vertical axes represent the index of the Felder-Solomon questions and the frequencies of the “a” responses, respectively.
iii. Experimental design
Two sections of Stat 13 were taught in Fall 2005 at the UCLA department of statistics. Section 1 was randomly selected to receive the traditional instruction (control group) using the software R for laboratory work and homework assignments. Section 2 was the treatment group, which was exposed to instruction and assessment using the SOCR resource tools. This was a quasi-experimental design, as the groups were not completely demographically matched, Table 2. There may have been hidden effects (such as time of the course, instructors, etc.) The course instructor (Dinov) frequently showed SOCR demonstrations in the treatment group and only occasionally in the control group. SOCR utilization in Stat 13 involved hands-on demonstration of a variety of distributions (e.g., Normal, Binomial, χ2, etc.), interactive experiments (die/coin tossing, card drawing, Central Limit Theorem, etc.), manual validation of the results of various statistical analysis done using SOCR Analyses (e.g., T-tests, ANOVA, sign-test, etc.), simulation and model fitting (SOCR Modeler) and using the SOCR Charts to plot data, models, residuals, results, etc.
iv. Virtual Office Hour (VOH) Forum Page Statistics
In addition to the instructors regular office hours all students had an optional, free and anonymous access to a web forum pages (VOH, http://www.stat.ucla.edu/course/stat13_1/forum). These pages were heavily and jointly utilized by students in the treatment and control groups. Because of the anonymous nature of the forum, specific demographic summaries of these web postings were not available nor was the VOH forum an official course web resource. So, students were asked to validate critical information posted on the VOH with official course page and/or the instructor. We had over 400 postings for the 10-week Fall quarter in 2005. Most threads were initiated by students. Responses came from the instructor, the four course teaching assistants and frequently other students enrolled in the class. As expected, the intensity of the postings highly correlated with due-dates for assignments and the exam schedule.
v. Quantitative measures
Table 3 below shows the summary statistics for the most important quantitative measurements of learning in the control and treatment groups–the student’s scores on the midterm and final examinations. The final scores for both sections of the class were computed using the same grading schema: 5% Final Paper, 10% Laboratory Assignments, 20% Homework Projects, 30% Midterm Exam and 35% Final Exam. The mean group differences in scores were not significantly different (0.05<p<0.1); however there was a consistent trend of improving the performance in the SOCR-based section (treatment) of this study. The student retention rate was also slightly better for the treatment group (96.6%) compared to the control section (90%). A Normal test for difference of proportions yields zo=1.84 and a corresponding one-sided p-value = 0.034. This indicated a lower student drop out rate and possibly improved satisfaction of the SOCR-based instruction course.
Table 3.
Quantitative Results measuring student learning in the two groups of Dinov’s Stat 13 courses.
| Group | High | Low | Median | Mean | Standard Deviation | Statistics | |
|---|---|---|---|---|---|---|---|
| Midterm | Control | 10 | 53 | 84.33 | 83.9 | 10 | to = 1.37 t(169) p=0.089 |
| 0 | |||||||
| Treatment | 10 | 58 | 88 | 86 | 10 | ||
| 0 | |||||||
| Final | Control | 10 | 42 | 83 | 81.2 | 13 | to = 1.34 t(169) p=0.093 |
| 0 | |||||||
| Treatment | 99 | 35 | 87 | 83.8 | 12 | ||
| Overall Performance | Control | 96.89 | 53.6 | 86.82 | 84.57 | 9.1 | to =1.448 t(169) p=0.075 |
| Treatment | 98.05 | 42.32 | 88.26 | 86.68 | 9.9 |
b. Introduction to Probability (UCLA 100A(3) and 100A(4), Sanchez)
i. Course Description
The Introduction to Probability Course taught in the Statistics Department, is a Calculus-based undergraduate upper division course for Statistics majors and minors, but it is also required by the Biostatistics Department and by the Human Genetics Department. It also includes Econ Majors, Math and Applied Math students. The topics covered in this course are exclusively Probability, with little Statistics. Students are taught how to summarize data, so that they can interpret results of simulation of random numbers, and central limit theorems, but there is no statistical inference in this course. For most students taking Stat 100A, this is their first exposure to Statistics. The course is taught assuming that students will later enroll in a follow up Introduction to Mathematical Statistics course. Course material used for the course can be found at http://www.stat.ucla.edu/~jsanchez/courses/course100A.html.
ii. Student Demographics (treatment vs. control group)
As far as the learning styles are concerned, according to the Felder-Solomon questionnaire, the two groups in this experiment were extremely significantly different (χ2(42) p-value < 10−7). Figure 2 illustrates diagrammatically these differences for all 44 questions of this battery. We must point out however that not all students did this survey, since it was voluntary, and therefore not all students are represented in these baseline numbers for learning styles. However, looking at the demographics of the groups explains in part this difference and gives us more reason to believe that as a whole the two groups were not comparable at baseline.
Figure 2.
Statistically insignificant differences between the Stat 100A (Sanchez) treatment and control classes according to the beginning of the quarter Felder-Solomon questionnaire. Figure shows only the frequencies of the “a” responses to all questions from the two groups. The horizontal and vertical axes represent the index of the Felder-Solomon questions and the frequencies of the “a” responses, respectively.
As shown in Table 4, the enrollment in the control group had a large number of graduate master students (G) from the Biostatistics Department and a few others from other departments. The treatment group only had three graduate students from different departments. This created a confounding factor in the comparison between the two groups that also explains in part the difference in the results of the Felder-Solomon survey. For this reason, our quantitative outcome measures in this study report treatment and control group differences excluding all graduate students from both classes. The two groups were however, independent as they were classes taught at different times and no student in one class attended the other.
Table 4.
Demographics of the two groups with all students included in Stat 100A (Sanchez)
| Group | Major (%) | Class (%) |
|---|---|---|
| Math 15 | ||
| Applied Math 5 | ||
| Math/Ec 35 | Junior 65 | |
| Treatment (n=20) | Math-app 25 | Senior 15 |
| 9:00–9:50 AM | Anth(G) 5 | GD1 15 |
| Gen(G) 5 | Other 5 | |
| AtSci(G) 5 | ||
| Unex 5 | ||
| Math 5.1 | ||
| Appl.Math 2.5 | ||
| Math/Ec 20.5 | ||
| Math-app 5.1 | Junior 28 | |
| Control (n=39) | PrBEco 2.5 | Senior 28 |
| 11:00–11:50 AM | Biost(G) 33 | GD1 2.5 |
| Engineer 18 | GD2 5.1 | |
| Mech(G) 2.5 | GMT 33 | |
| Mph(G) 5.1 | Other 2.5 | |
| Bioch 2.5 | ||
| Unex 2.5 | ||
iii. Experimental Design
Experts agree that any teaching of probability should address several dimensions (Metz, 1997): (1) Understanding what random and chance variation means; (2) Being able to interpret a probability distribution and make well-reasoned claims about a variable by studying its probability distribution; (3) Have students be able to interpret a display of a probability distribution and understand how it conveys probability; (4) Know how to work with a probability distribution and see in it the difficult concept of probability. In a course dedicated exclusively to the teaching of Probability, there are other concepts such as expectations at different levels, roles of marginal and conditional probabilities, probabilities of functions of random variables, moment generating functions, approximation theorems and central limit theorems that are very important in the curriculum. Probability distributions are crucial for learning almost any part of probability and statistics (Cohen, 1997). SOCR experiments are particularly suited to this task, since students generate data and they can compare their data distribution with the theoretical distribution at a very early stage. The applets from SOCR that we used in this quasi-experiment allow addressing many of the dimensions described above. The assessment instruments used included homeworks (20%), midterms (35%) and final exam (45%) and all these tested students’ understanding of the role of probability distributions.
To determine the effectiveness of the use of SOCR tools in student learning, student satisfaction and use of technology, we conducted a quasi-experiment with two different Stat 100 classes that were taught by the same instructor and as similar as possible in all characteristics relevant to the outcome measures of interest (Dinov, 2006). The only difference was that in one group we used SOCR and in the other group we did not. The two classes participating in the experiment were taught during the Fall quarter 2005, one at 9 AM (treatment) and the other at 11 AM (control).
These two classes met 4 times a week with 3 lectures and one discussion session with different teaching assistants. The following modules of SOCR were used in the treatment group: Interactive Distributions and Experiments and Demos. The first module allows interactive computation of probabilities for discrete and continuous random variables, using a graphical interface that allows students to see pictorially what they are calculating. The second module contains a number of experiments, such as the birthday experiment, the matching experiment, central limit theorem experiments, bivariate normal experiments, etc. To accompany these tools the instructor of the course prepared handouts with instructions to teach students how to use the applets in a basic way and other handouts with activities that required the use of the applets to discover the answers to more complex applied probability problems. The use of the applets to complete these activities was required only in the treatment group. Furthermore, students were allowed to use the applets for the final exam, but this was not required. At UCLA, computing support is available to all students in the form of campus labs and laptop checkout, which can last from 3 hours to the whole day depending on demand.
Both classes were taught in a room with data projector and using the same power point lectures, which were also available in the course web site; both classes had the same core homework and similar discussion sessions. The treatment group had additional activities in the homework that required SOCR and some of the common core problems were required to be completed using SOCR. Treatment group students were also taught how to use R, but R was never required. The control group did not have those activities, but in some homeworks they were required to use the software R. During discussion periods, the teaching assistants conducted the group-specific activities assigned by the course instructor, including training students to use R and/or the SOCR applets and addressed general questions from students. Based on the weekly teaching assistant reports the two sessions were conducted similarly. Both classes had identical information in the syllabus, identical practice midterms and final, and identical information about labs and accessories, but only the treatment group’s web page had a link to the SOCR web resource. Because of web-page access password requirements, different teaching assistants and different assignment due dates, the students in one section were not interacting with the students in, or web resources for, the other. The textbook used in both classes was Ross (Ross, 2006). All exams were graded simultaneously. Two different graders graded the assignments of the two sections, however, both graders shared the same answer keys and point-allocation instructions.
Our treatment involved a moderate use of the SOCR applets. In order to make the instruction as similar as possible in the two groups, the applets were not extensively used in the lecture sessions but the applets used in the activities that students in the treatment group had to do were demonstrated in class. No late assignments were allowed and after each assignment due date, all students were given the answer key for that activity or homework.
As we noticed above when discussing the characteristics of the groups at baseline, the two groups were very different in their demographics. The Felder-Solomon results convinced us that this demographic difference is not trivial, since it is manifested also as a baseline difference of learning styles. Hence, our quantitative measures of the study comparing the treatment and control groups excludes graduate students from both sections. This exclusion of graduate students makes sense since they introduce a confounding factor that invalidates the comparability of the two groups. Table 5 shows the quantitative performance of the two groups on various measures and Figure 3 compares the total scores between the two groups (the scale of this table is different than the scales of the tables representing the quantitative outcomes for the other two courses).
Table 5.
Quantitative Results measuring student learning in the two groups of Sanchez’s Stat 100A courses.
| Group | High | Low | Median | Mean | Standard Deviation | Statistics | |
|---|---|---|---|---|---|---|---|
| Midterm | Control | 34 | 17.5 | 26.5 | 26.19 | 4.65 | to = 0.63 t(38) p>0.2 |
| Treatment | 33 | 17.5 | 28.5 | 27.08 | 4.25 | ||
| Homework | Control | 19.74 | 4.69 | 16.92 | 15.76 | 4.44 | to = 0.64 t(16) p>0.2 |
| Treatment | 19.07 | 13.39 | 16.41 | 16.41 | 1.73 | ||
| Final | Control | 37.2 | 18.4 | 29.4 | 28.48 | 5.31 | to=0.49 t(38) p>0.2 |
| Treatment | 36.9 | 22.5 | 29.40 | 29.23 | 4.30 | ||
| Overall Performance | Control | 90.55 | 43.19 | 71.22 | 70.45 | 12.24 | to=0.71 t(38) p>0.2 |
| Treatment | 84.89 | 58.42 | 72.44 | 72.73 | 8.08 |
Figure 3.
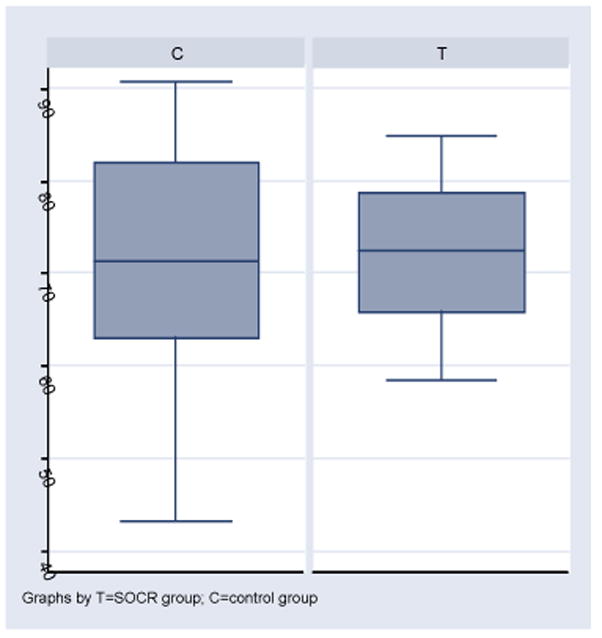
Total scores.
iv. Student Learning Outcome
Compared with the students in the control group, the treatment group students did better than the control group in all outcome measures relevant to student learning (homework, midterms, final exam and total score), as we can see in Table 5 and Figure 3. These results are reversed when we include the graduate students in the comparison, showing the bias and impact of having heterogeneous student populations (e.g., unbalanced number of biostatistics students, in this case). As we can see from the box plots on Figure 3, we do not have outliers among the undergraduates, and the variability in total score is much smaller in the SOCR group than in the control group.
Despite the fact that none of the exam categories indicated statistically significant between-group differences, the consistency of the treatment effect is noticeable. In fact, if we consider the 4 homeworks and 2 exams as independent measures, then the observed, albeit marginal, superiority of the treatment group in all 6 measures indicates a significant treatment effect, p-value=0.016, xo=6, X~B(n=6, p=0.5). This consistency is indicative of a significantly better performance of the treatment group across different quantitative assessments.
v. Use of Technology Outcome
For this study, the final exam for both groups was conducted in a computer lab where the teaching assistants centrally monitored all the computers during the examination. The students could only open one of two applications, SOCR (treatment group) or R (control group). The teaching assistant would check their monitors every 15 minutes to record the activity and kept an eye on all monitors constantly to guarantee that there was no other software opened. In the treatment group, by the end of the final exam, 6 students had at some point used R, and 13 had used SOCR. Thus in the treatment group, 95% of the students used one or another form of technology, with 65% using SOCR. In the control group, by the end of the exam, about 26 (68%) of the students had used the technology. Thus, the treatment group felt more comfortable using the technology at the end of the quarter for the final exam. It must be pointed out that all students were allowed to have a scientific calculator during the exam. Moreover, all questions could have been answered using a scientific calculator alone.
vi. Student satisfaction outcomes
At the end of this study, students filled out a questionnaire to measure their satisfaction with the course (http://wiki.stat.ucla.edu/socr/index.php/SOCR_EduMaterials_Surveys_Fall2005Sanchez). Because of the anonymous nature of the questionnaire, we could not exclude the graduate students from completing the survey. The completed questionnaires were collected by a student in each class and delivered to the main Statistics office to be kept confidential until the grades for the class were turned in. This was done to encourage students to be more sincere than if the instructor had processed the survey. In this satisfaction survey, students responded to the following:
Whether the use of technology in this class had made their learning more effective or not in some dimension, as compared with other classes not using technology (79% in the treatment group and 67% in the control group said yes to some dimension);
Whether they would take a second probability course with more applications (73% in the treatment group said yes, 81% in the control group);
Whether the class taught them things more relevant to their lives than other classes (84% in the treatment group, 62% in the control group).
Generally, students in both groups reported that the class was more interesting than other applied mathematics classes they had previously taken. The results described above show however, that the effort of using SOCR is worthwhile. Not only were students more at ease in using the technology in the SOCR group, but also the SOCR group had less variability. They were more homogeneous in their performance and were more satisfied with the class than the students in the control group were. The fact that their learning assessment scores were not significantly different according to the overall mean and median measures may be lack of statistical power. The lack of statistical significance may also be the result of only a moderate use of the SOCR resource. Perhaps a more intensive use of the SOCR technologies may also potentiate the quantitative learning and knowledge retention.
c. Probability and Statistics (UCLA 100A(1), Christou)
i. Course Description
Stat 100A was already described above as part of section II. b. To reiterate, Stat 100A is an introductory course to probability theory and the first in the Stat 100 series which is a requirement for both the major and the minor in Statistics. Stat 100B covers central limit theorem, sampling distributions, estimation, and hypothesis testing, while the last class in the series Stat 100C focuses on regression analysis. The majority of the enrolled students had good mathematical background, mainly due to their major. The class received 3 hours of instruction and one hour of discussion per week.
ii. Student Demographics (treatment vs. control group)
Even though the treatment group is small compared to the control group, the group demographics, based on majors, were comparable with the majority of students in the groups being math majors, Table 6. In addition, the vast majority of the students in the control and treatment groups were college juniors and seniors.
Table 6.
Student Demographics for the Stat 100A class (Christou)
| Majors | Stat 100A control group | Stat 100A treatment group |
|---|---|---|
| Mathematics | 25 | 8 |
| Statistics | 2 | 1 |
| BioStatistics | 3 | 0 |
| BioChem | 2 | 0 |
| Psyscho-bio | 0 | 1 |
| Sociology | 0 | 1 |
| Business Econ | 1 | 0 |
| Total | 33 | 11 |
Figure 4 illustrates that the learning styles of the two groups (as measured by Felder-Solomon Index of Learning Styles questionnaire (Felder, 1988; Felder, 2003)) in this experiment were quite distinct (χ2(42), p-value<10−7). The observed differences between the two groups may be explained by the non-random selection and/or the varying amount of instruction received per week. The control group only received three hours of lecture and one hour of discussion per week. The students in the treatment group were a proper subset of the class who had signed up for a one hour per week Honors Seminar, which involved additional SOCR-based instruction (treatment). Note that the treatment group received an extra hour with the professor in a smaller classroom environment, but the two groups had the same general instruction and discussion. The additional one-hour seminar covered the same materials taught in class but with an interactive approach using the SOCR resources. Qualitatively, we observed a clear difference in the way the two groups learned, which may be due to the extra instruction and enhancement of the SOCR resources. This technology allowed students to see hands-on theory taught in class using simulation applets, experiments and visualization.
Figure 4.

Statistically insignificant differences between the Stat 100A (Christou) treatment and control classes according to the beginning of the quarter Felder-Solomon questionnaire. Figure shows only the frequencies of the “a” responses to all questions from the two groups. The horizontal and vertical axes represent the index of the Felder-Solomon questions and the frequencies of the “a” responses, respectively.
iii. Experimental design
The treatment group was a self-selected group of students who chose to enroll for an additional one hour per week seminar. This seminar used SOCR demonstrations and simulations applets to enhance the concepts and theories taught to all students during regular class. Due to the process of self-selection, the students in the treatment group wanted to explore the topic beyond the general class instruction. The performance of the control group was based on instruction during regular class and discussion alone, as it was not exposed to SOCR. The homework assignments were the same for both groups, however the treatment group also received additional homeworks based on SOCR. The SOCR materials presented to the treatment group mainly included interactive discrete and continuous distributions, experiments, demonstrations and joint distributions. All the exams and quizzes were administered in a classroom without access to computers or the SOCR tools. Only scientific calculators were allowed during examinations. The textbook used for the course was A First Course in Probability by Sheldon Ross (Ross, 2006) and the following topics were covered: combinatorial analysis, probability, discrete and continuous random variables, jointly distributed random variables, properties of expectation and limit theorems.
Stat 100A covers exclusively probability with little statistics. In this class, students used SOCR to perform simulations involving probability theory, e.g. the Monty Hall experiment, the birthday experiment, and the die-coin experiment. Because some of the experiments involve two random variables, SOCR was also used to enhance the understanding of joint distributions. Later in the course, students used SOCR to learn about different distributions such as the binomial, Poisson, geometric, hypergeometric, normal, exponential, beta, and gamma. SOCR was also incorporated in topics such as the normal approximation to binomial and Poisson, and the Poisson approximation to binomial. Traditional lectures, not utilizing technology, primarily address auditory learners who learned by seeing and listening. The interactive SOCR demonstration applets and visualization tools, expand this to visual, kinesthetic and interactive-feedback learners.
iv. Student Learning Outcome
In this experiment, there was a noticeable difference in the way the two groups learned. We also observed between-group differences in the quantitative outcome measures, Table 7. In this study, these differences may be attributed to self-selection, the amount of instruction received per week or the treatment itself. The SOCR tools seem to impact student motivation by allowing the students to experiment with new statistical concepts hands on using the SOCR simulation applets, games and visualization.
Table 7.
Quantitative Results measuring student learning in the two groups of Christou’s Stat 100A course.
| Group | High | Low | Median | Mean | Standard Deviation | Statistics | |
|---|---|---|---|---|---|---|---|
| Quiz1 | Control | 96 | 41 | 70 | 72.61 | 16.84 | to = 2.644 t(42) p=0.0058 |
| Treatment | 100 | 58 | 93 | 87.67 | 14.72 | ||
| Quiz2 | Control | 100 | 32 | 73 | 72.61 | 16.78 | to = 2.063 t(42) p<0.0227 |
| Treatment | 100 | 58 | 89 | 84.11 | 13.25 | ||
| Exam1 | Control | 100 | 40 | 89 | 85.74 | 13.64 | to =0.7617 t(42) p=0.225 |
| Treatment | 100 | 47 | 96 | 89.56 | 16.62 | ||
| Exam2 | Control | 100 | 36 | 80 | 80.23 | 15.98 | to =1.342 t(42) p= 0.0935 |
| Treatment | 100 | 68 | 88 | 87.22 | 11.09 | ||
| Exam3 | Control | 100 | 46 | 82 | 82.45 | 14.13 | to =0.2725 t(42) p=0.3933 |
| Treatment | 100 | 60 | 88 | 83.78 | 13.66 | ||
| Overall Performance | Control | 94.31 | 44.93 | 80.09 | 80.23 | 11.87 | to =1.606 t(42) p=0.058 |
| Treatment | 96.26 | 60.65 | 90.59 | 86.76 | 11.06 |
Students’ satisfaction was assessed at the end of the course using an exit survey asking feedback on SOCR as an enhancement to the traditional lecture and whether or not students would be interested in having this software available for the next course in the sequence. The complete survey can be found at http://wiki.stat.ucla.edu/socr/index.php/SOCR_EduMaterials_Surveys_Fall2005Christou.
According to this exit survey given at the end of the course, students in the treatment group thought that the software was extremely helpful to them and suggested that SOCR should be used to further enhance, clarify, and expand on theories taught in lectures. Over 90% of the students felt that the SOCR tools helped them understand the material taught in class. All students in the treatment group also indicated that SOCR should be included in their future statistics class (in particular the sequence course Statistics 100B). Table 7 shows the summary statistics for all the exams, quizzes, and the overall performance of the class. All the exams and quizzes were based on a 0–100 scale, but weighted differently towards the overall performance (each exam was worth 20% of the final grade, each quiz was worth 15% of the final grade and homework was worth 10%).
Some of the observed differences in the group means (Table 7) are statistically significant at the 5% level (Quiz1 and Quiz2), and some are not. However, in all quantitative measures the treatment group again consistently outperformed the control group, even though some differences between group means were not statistically significant. An overall non-parametric test (sign-test) that pools together all quantitative measures clearly discriminates between the two groups, p-value=0.031, xo=5, X~B(n=5, p=0.5).
III. Conclusion and Discussion
Many contemporary approaches for enhancing K-College education involve blending of advanced pedagogical methodologies with modern information technology tools. The need for the integration of teaching and technology is driven by various social, economic and behavioral factors. This need is ubiquitously recognized and accepted, however, there is no uniformly agreed upon approach to achieving this merger that is satisfactory for all disciplines, educational levels or instructional styles. Furthermore, the aim of unifying all possible directions of integrating technology in education into a single pedagogical theory may not be achievable in a completely consistent framework (Chaitin, 2006). Our approach to interfacing science education and IT technology is based upon a bidirectional feedback mechanism of developing novel and enhancing existent pedagogical instruments at the same time that we design and engineer new technology tools. More specifically, our educational needs in the classroom heavily direct the types of technologies that we develop specifically to meet the instructor’s demands. On the other hand, our broad research interests in finance, statistical modeling and biomedical computing have resulted in the engineering and deployment of a suite of tools used for computational and demonstration purposes. These research oriented developments then impact back our core education curriculum and instructional styles. In this article, we demonstrated one aspect of this integrated technology- and pedagogy-based educational effort–utilizing SOCR tools in the instruction of probability and statistics courses.
Many leading educational research findings suggest that well-designed and integrated technology tools have the potential to improve significantly student motivation, learning and concept retention in various probability and statistics college-level courses. In this paper, we described our experience in utilizing the Statistics Online Computational Resource (http://www.socr.ucla.edu) in two types of undergraduate probability and statistics courses. The SOCR resource provides a number of interactive tools that can be used by the instructors, during lecture and/or discussion, and by the students for self-learning and to complete assignments. These tools bridge between the introductory and the more advanced computational and applied probability and statistics courses.
We believe that more testing should be performed to validate the effectiveness of the SOCR tools in enhancing probability and statistics instruction. We observed good outcomes in student satisfaction and use of technology in all three courses. In statistics 13, we found that the SOCR-based instruction slightly improved the overall performance in the class, compared to a traditional instruction. In this study, the two sections of Stat 13 were not significantly different in terms of student demographics and their learning styles. There was no statistically significant group difference with respect to the overall quantitative measures of learning, which may be attributed to lack of statistical power. However, we saw a consistent trend of improvement in the SOCR treatment group. Furthermore, taking in account all assignments (8) and exams (2) for this study, the lack of overall significant group difference is immensely magnified, as none of the 10 measures was higher for the control group. This consistency is indicative of a very strong treatment effect in this study, sign-test p-value<10−3.
The observed increase in student satisfaction (for all three studies) in using the SOCR tools is an indicator of the student preference of using technology to enhance instruction, in general. The variability in the quantitative measurements in the treatment group was consistently smaller, which suggests that SOCR may benefit the majority of the students not only the top students. In Stat 100A (Sanchez) it was the moderate intensity of the use of SOCR what might explain the lack of significant difference in learning outcomes, as measured solely by the group median and the mean exam scores. Pooling the results from all three studies, however, yields strong evidence suggesting the SOCR-based instruction did potentiate learning. None of the examinations we had recorded had the control groups scoring at the level of, or higher than, the corresponding treatment groups. Using the sign test and assuming independence of the examinations and the sections we obtain a p-value<0.00098, x0=10, X~B(n=10, p=0.5). Consequently, we believe the results obtained in this study demonstrate that SOCR utilization impacts students’ learning and their attitude towards technology-based instruction. In the future, we plan to conduct stricter and more intense experiments using the SOCR tools, at different course levels, which will include treatment for homework, laboratory discussions and lectures to see how exposure to technology correlates with learning, satisfaction and concept retention.
Some of the observed differences between the treatment and control groups (within each course) maybe due to small sample sizes, the self-selection bias, and/or the fact that some treatment and control groups were dependent. For example, Christou’s Stat 100A received an additional hour of instruction using SOCR and was composed of honors students. It will be interesting to use SOCR as an enhancement to lecture material during discussion or with extra lab hours and direct SOCR guidance by the instructors. We think that the teaching model with an extra lab hour using SOCR is worth exploring in future experiments. The three studies reported here represent a first attempt to validate the efficacy of using the SOCR online interactive tools as pedagogical instruments in probability and statistics classes.
A qualitative assessment of the utilization of the SOCR resources by students and the community comes in three other forms. First, (undergraduate and graduate) students report that they use some (typically a small collection) SOCR tools to complete projects in other disciplines, including work on their theses/dissertations. Second, over 70% of students that opted to use SOCR utilities to complete their open-ended end-of-quarter research papers in the classes we taught. Third, there are a number of feature and functionality requests that constantly arrive from student and research users from academia and the industry.
Acknowledgments
The SOCR resource is funded in part by an NSF grant DUE 0442992, under the CCLI mechanism, an NIH Roadmap for Medical Research, NCBC Grant U54 RR021813 and by UCLA OID Grant 0318. The SOCR resource is designed, developed and maintained by faculty and graduate students in the departments of Statistics, Computer Science, LONI, Neurology and Biomedical Engineering at UCLA.
Many people have contributed to this effort in one form or another over the years. SOCR contributors include: Jenny Cui, Annie Che, Sam Prabhu Rubandhas, Dushyanth Krishnamurthy, Fotios Konstantinidios, Jianming Hu, Don Ylvisaker, Rob Gould, Jason Landerman, Hui Wang, Petros Efstathopoulos, Linda Capetillo-Cunliffe, Anuradha Sachdev, Blake Haas. A number of outside academic, non-profit and industrial resource were also utilized in the SOCR development. We have used ideas, design, resources and models from Elementary Statistics Java Applets, Statlets, Rice Virtual Lab in Statistics, WebStat, Statiscope, PsychStat, BisinessStat, Probability by Surprise, Web Interface for Statistics Education, CUWU Stats, PSOL, StatLab, Virtual Labs in Probability & Statistics, JavaStat, Vistac, JSci, CyberStat, and many other groups, organizations, student projects, research, clinical and teaching resources. Our Fall 2005 teaching assistants (Xuelian Wei, Kisten Johnson, Wei Sun and Ming Zheng) were invaluable in the process of instruction and SOCR evaluation. We are also indebted to the anonymous reviewers for their constructive recommendations for further research and for their suggestions that made this article much more consistent and complete.
Footnotes
Publisher's Disclaimer: This is a PDF file of an unedited manuscript that has been accepted for publication. As a service to our customers we are providing this early version of the manuscript. The manuscript will undergo copyediting, typesetting, and review of the resulting proof before it is published in its final citable form. Please note that during the production process errors may be discovered which could affect the content, and all legal disclaimers that apply to the journal pertain.
V. References
- Anderson-Cook CM, Dorai-Raj S. Making the concepts of power and sample size relevant and accessible to students in introductory statistics courses using applets. Journal of Statistics Education. 2003;11 online. [Google Scholar]
- ARTIST. https://app.gen.umn.edu/artist/about.html.
- ASA . http://www.amstat.org/
- Becta. Primary schools–ICT and Standards. An analysis of national data from Ofsted and QCA by Becta. Coventry: Becta; 2003. http://www.becta.org.uk/research/research.cfm?section=1&id=538. [Google Scholar]
- Becta Ia. 2006 http://www.becta.org.uk/
- CAUSEWEB. http://www.causeweb.org.
- Chaitin G. The Limits of Reason. Scientific American. 2006:75–81. doi: 10.1038/scientificamerican0306-74. [DOI] [PubMed] [Google Scholar]
- ChanceProject. http://www.dartmouth.edu/~chance/index.html.
- Cohen S, Chechile RA. Probability Distributions, Assessment and Instructional Software: Lessons learned from an Evaluation of Curricular Software. In: Gal JBGaI., editor. The Assessment Challenge in Statistics Education. IOS Press; 1997. p. 223. [Google Scholar]
- Cox DR. Some remarks on statistical education. Journal of the Royal Statistical Society Series D-the Statistician. 1998;47:211–213. [Google Scholar]
- Dinov I, Sanchez J. Assessment of the Pedagogical Utilization of the Statistics Online Computational Resource. Introductory Probability Courses: A Quasi-experiment, to appear in ICOTS-7 Proceedings; Salvador, Brazil. July 2-July 7, 2006.2006. [Google Scholar]
- ENC. http://www.enc.org/
- Felder RM, Silverman LK. Learning and teaching styles in engineering education. Engineering Education. 1988;78:674–681. [Google Scholar]
- Felder RM, Silverman LK. Learning and Teaching Styles in Engineering Education. Journal of Engineering Education. 1998;78:674–681. [Google Scholar]
- Felder RM, Soloman BA. [Accessed December 24, 2005];Index of learning styles questionnaire. 2003 http://www.engr.ncsu.edu/learningstyles/ilsweb.html. http://www.engr.ncsu.edu/learningstyles/ilsweb.html.
- FIPSE. http://www.ed.gov/programs/fipsecomp/index.html.
- GAISEReport. http://www.amstat.org/education/gaise/GAISECollege.htm.
- GEM. http://www.thegateway.org.
- Hawkins A. Discussion: Forward to basics! A personal view of developments in statistical education. International Statistical Review. 1997;65:280–287. [Google Scholar]
- Honey P, Mumford A. The manual of learning styles. Peter Honey; Maidenhead: 1992. [Google Scholar]
- Kolb DA. Learning style inventory: technical manual. Boston, MA: McBer & Company; 1976. [Google Scholar]
- Leslie M. Statistics Starter Kit. Science. 2003;302:1635. [Google Scholar]
- Lovett MC, Greenhouse JB. Applying cognitive theory to statistics instruction. American Statistician. 2000;54:196–206. [Google Scholar]
- MERLOT Multimedia Educational Resource for Learning and Online Teaching (MERLOT) doi: 10.1016/s0140-6736(05)73497-8. http://www.merlot.org/ [DOI] [PubMed]
- Metz KE. Dimensions in the Assessment of Students’ Understanding and Application of Chance. In: Gal JBGaI., editor. The Assessment Challenge in Statistics Education. IOS Press; 1997. p. 223. [Google Scholar]
- Pearl D. Cooking for the Buffet-How to Individualize the Multisection Course. Breakout Session Paper presented at ICOTS-7; Ohio. May 19–21, 2005.2005. [Google Scholar]
- Ross S. A first Course in Probability. Prentice Hall; 2006. [Google Scholar]
- RTEC. Regional Technology and Education Consortium http://www.rtec.org/
- SurfStat. http://www.anu.edu.au/nceph/surfstat/surfstat-home/surfstat.html.
- Taplin RH. Teaching statistical consulting before statistical methodology. Australian & New Zealand Journal of Statistics. 2003;45:141–152. [Google Scholar]
- Teugels JL. Discussion: Forward to basics! A personal view of developments in statistical education. International Statistical Review. 1997;65:287–288. [Google Scholar]
- USCOTS. http://www.causeweb.org/uscots/
- Whitley E, Ball J. Statistics review 1: presenting and summarising data. Crit Care. 2002a;6:66–71. doi: 10.1186/cc1455. [DOI] [PMC free article] [PubMed] [Google Scholar]
- Whitley E, Ball J. Statistics review 2: samples and populations. Crit Care. 2002b;6:143–8. doi: 10.1186/cc1473. [DOI] [PMC free article] [PubMed] [Google Scholar]
- Whitley E, Ball J. Statistics review 3: hypothesis testing and P values. Crit Care. 2002c;6:222–5. doi: 10.1186/cc1493. [DOI] [PMC free article] [PubMed] [Google Scholar]
- Whitley E, Ball J. Statistics review 5: Comparison of means. Crit Care. 2002d;6:424–8. doi: 10.1186/cc1548. [DOI] [PMC free article] [PubMed] [Google Scholar]
- Whitley E, Ball J. Statistics review 6: Nonparametric methods. Crit Care. 2002e;6:509–13. doi: 10.1186/cc1820. [DOI] [PMC free article] [PubMed] [Google Scholar]