

Abstract
Surface electrode recordings cannot delineate the activation within the human or canine sinoatrial node (SAN) because they are intramural structures. Thus, the site of origin of excitation and conduction pathway(s) within the SAN of these mammals remains unknown. Canine right atrial preparations (n=7) were optically mapped. The SAN 3D structure and protein expression were mapped using immunohistochemistry. SAN optical action potentials had diastolic depolarization and multiple upstroke components that corresponded to the separate excitations of the node and surface atrial layers. Pacing-induced SAN exit block eliminated atrial optical action potential components but retained SAN optical action potential components. Excitation originated in the SAN (cycle length, 557±72 ms) and slowly spread (1.2 to 14 cm/sec) within the SAN, failing to directly excite the crista terminalis and intraatrial septum. After a 49±22 ms conduction delay within the SAN, excitation reached the atrial myocardium via superior and/or inferior sinoatrial exit pathways 8.8±3.2 mm from the leading pacemaker site. The ellipsoidal 13.7±2.8/4.9±0.6 mm SAN structure was functionally insulated from the atrium. This insulation coincided with connexin43-negative regions at the borders of the node, connective tissue, and coronary arteries. During normal sinus rhythm, the canine SAN is functionally insulated from the surrounding atrial myocardium except for 2 (or more) narrow superior and inferior sinoatrial exit pathways separated by 12.8±4.1 mm. Conduction failure in these sinoatrial exit pathways leads to SAN exit block and is a modulator of heart rate.
Keywords: sinoatrial node, optical mapping, sinoatrial exit block, connexin43
Sinoatrial node (SAN) dysfunction is a common and potentially life-threatening disease.1,2 The clinical signs of SAN dysfunction include bradycardia, sinus pauses, sinus arrest, sinus exit block, and reentrant arrhythmias.3,4 Although the syndrome may have many causes and commonly affects elderly persons, it usually is idiopathic.5 Studies of human SAN function are complicated by the inability of epi- or endocardial mapping to detect the origin and slow propagation of action potentials (APs) within the SAN before it activates adjacent atrial myocardium.6,7
Sinus rhythm (SR) is physiologically controlled by autonomic modulation of pacemaker ion channels,8 calcium handling,9 and shifts of the leading pacemaker site.10-12 Anatomic structure and electrophysiological heterogeneity play important roles in SAN excitation under various conditions.6 Recently, we investigated activation patterns in the rabbit SAN using optical mapping,13 which is the only available technology that allows the resolution of simultaneous changes in the activation pattern and AP morphology from multiple sites. In that study, we demonstrated that the rabbit SAN is functionally insulated from the atrial septum.13 However, the rabbit SAN is essentially a 2D structure14 in contrast to the 3D structure of the canine7,15,16 and human17,18 SANs. Bromberg et al7 suggested that the canine SAN may be functionally insulated from the surrounding atrial myocytes, except for a limited number of exit sites. The Boineau—Schuessler SAN model6,19 hypothesized discrete sinoatrial exit pathways (SEPs), which can explain how the atrial surface activation can be initiated from multiple sites simultaneously, as well as explain the complex conduction within the SAN. However, this hypothesis has not been confirmed with direct experimental measurements because of the intramural location of the SAN structure and the inability of surface electrodes to delineate the activation within the SAN.7
In the present study, we have extended high-resolution optical mapping13 to obtain optical AP (OAP) recordings and developed a new analytic approach to resolve the intramural activation pattern of the canine SAN.
Materials and Methods
The protocol was approved by the Washington University Animal Care and Use Committee. The isolated perfused canine right atrium,12 as well as the experimental techniques,13 have been previously described in detail.
An expanded Materials and Methods section is available in the online data supplement at http://circres.ahajournals.org.
Results
Functional and Anatomic Definition of the Canine SAN
Figure 1 shows epi- and endocardium photographs and activation maps of a right atrial preparation during normal SR (NSR), reconstructed using the maximum of the first derivative (dV/dtmax) of the OAPs. OAPs attributable to light scattering and attenuation carry information from a depth of 1 to 2 mm.20,21 Therefore, OAPs collected from either the epicardium or endocardium contain contributions from the surface and intramural layers, including the SAN, and represent a weighted average of the transmembrane APs throughout the entire canine atrial wall, which is 1 to 2 mm thick. However, the activation maps in Figure 1 show only the activation of the atrial myocardium and do not reflect the SAN activity because of relatively low amplitudes of the SAN OAP components. The sites of the earliest atrial activation (breakthrough) did not coincide with an anatomically defined SAN.
Figure 1.
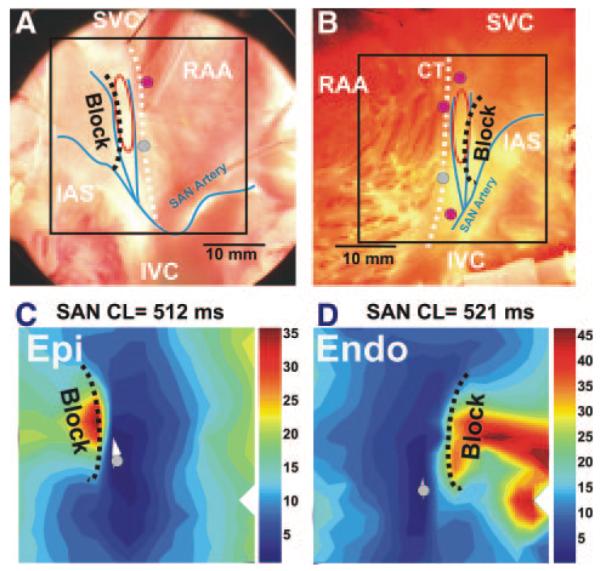
Epicardial and endocardial optical mapping of the canine right atrial preparation. A and B, Epicardial and endocardial photographs of a perfused right atrial preparation with 36×36 mm optical fields of view (OFV). C and D, Epicardial and endocardial atrial activation maps. In all images, the beginnings of the atrial activation sequence (breakthrough) during SR during different conditions are shown by gray and pink circles. The gray circles in A and B correspond to those in C and D, respectively. The SAN arteries are shown by blue curves. The dashed white line shows the location of the sulcus terminalis, which is the medial epicardial edge of the CT. The red ovals show the approximate border of the SAN region. In all images, the dashed black line shows the location of the IAS block zone (Block). SVC and IVC indicate superior and inferior vena cava, respectively; RAA, right atrial appendage.
Figure 2A through 2C illustrates the functional and anatomic boundaries of the canine SAN. It was structurally identified by cell morphology, fiber organization, and a lack of connexin (Cx)43 expression. It was defined functionally from OAP morphologies with slow diastolic depolarization and multiple component upstrokes corresponding to different layers of conduction (Figure 2D). During NSR, OAP upstrokes contained several components that corresponded to asynchronous activation of several tissue layers, including the SAN and atrial layers. However, during SAN exit block, we recorded OAPs with only 1 upstroke and typical SAN OAP morphology (Figure 2E). The lack of atrial excitation permitted the exclusive recording of the SAN OAPs, which coincided with the Cx43-negative region.
Figure 2.

Anatomic and functional definition of the canine SAN. A, Endocardial photograph of the coronary-perfused right atrial preparation with 9×9 mm OFV (blue dotted square). SVC and IVC indicate superior and inferior vena cava, respectively; RAA, right atrial appendage. B, Parallel histology section close to the epicardial (Epi) surface is shown by a dark blue dotted rectangle on A. B shows a single 2D histology section through a layer of tissue that contains the SAN, superior breakthrough site, and coronary arteries. C, Immunofluorescent labeling of Cx3 (green), vimentin (blue), and α-actinin (red). Mosaic images were created to reconstruct immunostaining from the adjacent tissue section of the histology presented in B. Red lines in B and C show the border of the Cx43-negative area. Black (B) and white (C) dots represent the holes made by pins that were inserted through the tissue after each experiment and were used as space markers to register the optical mapping data with the histological sections. D and E, Endocardial optical APs from the center of the SAN (1) and the CT (2) and a bipolar electrogram recording from the CT recorded from sites 1 and 2 in B and C during normal SR and exit block from the SAN. Optical recordings show complex morphology (D) that reflects electric activity from multiple layers of the tissue, including slowly rising upstrokes of the SAN (SAN Component) and rapidly rising upstrokes of the atrial myocardium (Atrial Component) above the SAN layer. During exit block (E), only SAN potentials were recorded. Pink dotted lines show the slope of the slow diastolic depolarization.
As previously shown,7 we found that the canine SAN artery sweeps cephalad, then bifurcates, forming the medial and lateral boundaries of the SAN. These correlate with conduction blocks from the SAN in the direction of the intraatrial septum (IAS) and crista terminalis (CT), and were consistently observed in all canine preparations (n=7). However, we found that not only the arteries themselves, but also connective tissue surrounding the SAN and arteries, electrically insulate the SAN from the atrium.
Figure 3 shows the detailed analysis that was used to separate the SAN component from the atrial components in multiphasic OAPs. See also the expanded Materials and Methods section in the online data supplement. Traditional criteria for detecting activation times (50% of the OAP amplitude [AP50%] or dV/dtmax) did not detect SAN activation (Figure 1) because of the relatively small, slow SAN upstroke components in the OAPs (Figure 2D). Only by separating the upstroke components was it possible to distinguish SAN activation (Figure 3). The OAPs recorded in the SAN region were separated into the SAN and atrial components using the maximum second derivative (d2V/dtmax2) of the signal. Separation of the components allowed for measurement of the dV/dtmax, OAP amplitude, and conduction velocity (CV) in individual tissue layers. We also found that AP50% maps more precisely reflected the SAN activation than the dV/dtmax map because of effects of noise on the dV/dtmax during the slow SAN upstroke.7,14 AP amplitude of each component was measured as the difference between the minimum and maximum fluorescence in this component. In most cases, the amplitude of the SAN component of the OAP was less than the atrial, because of light attenuation and scattering during propagation from deeper SAN structures. The slope of the slow diastolic depolarization (SDD) was determined by calculating the slope of a linear fit during SDD and normalizing it to the OAP amplitude. CV maps for each SAN and atrial layer were separately made by calculating the difference in activation times as determined by the AP50% of the SAN and atrial components.13,22
Figure 3.

Analysis of optical transmembrane potentials from canine the SAN. OAP traces and their first (dV/dt) and second (d2V/dt2) derivatives during NSR from photodiodes recordings from 4 sites are shown: site 1, from the leading pacemaker site in the (SAN p); site 2, from the superior exit site from the SAN (SAN l); site 3, from the CT; site 4, from the intraatrial septum block zone region (IAS). Each OAP was analyzed to calculate AP amplitude (APA), 50% of AP amplitude, at the optical upstroke (AP50%), SDD, maximum upstroke dV/dtmax, and d2V/dtmax2. OAPs recorded in the SAN region were separated into the SAN and atrial components using the d2V/dtmax2 of the signal as the transition point (see Figure 4 and 5).
Mechanism of Multifocal Atrial Activation During NSR
The sinus cycle length (CL) ranged from 427 to 812 ms during control conditions. Blebbistatin did not significantly change CL (479±73 versus 499±76 ms, or 127±16 versus 122±15 bpm) or atrial effective refractory period (138±18 versus 140±8 ms, P=0.83). Staining with di-4-ANEPPS induced a transient (10 to 20 minutes) 58±28 ms CL increase. The site of the leading pacemaker remained stable for 3 to 5 hours. Changes in the CL were <30 ms/h and were similar to results seen in the work of Bleeker et al14 and Bromberg et al.7
In control conditions, most SAN preparations (5 of 7) had a superior origin of atrial activation (Figure 1). However, following 1 to 5 minutes of overdrive atrial pacing, inferior and/or multifocal types of patterns of the origin of excitation were observed in all preparations from at least from 1 surface: epi- or endocardial. Figure 4 shows 2 endocardial activation patterns, which were recorded before and after 5 minutes of pacing. Before pacing, the atrial activation pattern was bifocal, originating from the superior SEP. Atrial pacing slowed conduction in the superior SEP and the pacemaker shifted 2 mm inferiorly, reaching the inferior SEP faster than the superior with a corresponding change in the atrial activation pattern. Inferior breakthrough abruptly switched to superior breakthrough within 1 minute after pacing was stopped.
Figure 4.

Endocardial optical mapping of the canine SAN excitation during superior and inferior atrial breakthrough pattern. A, Photograph of the preparation with an optical field of views of 36×36 mm (same preparation as Figure 3). The beginning of the control activation sequence during SR is shown by a dark blue oval. The red circles show superior and inferior atrial breakthrough regions recorded by optical mapping (see C). The dashed black line shows the location of the IAS block zone. SVC and IVC indicate superior and inferior vena cava, respectively; RAA, right atrial appendage. B, OAPs from recordings from sites 1 to 4 on the activation map during SR (A, C, and D): sites 1 and 2 are from the superior and inferior part of the SAN, near the exit pathways (SEPs); site 3 is from the leading pacemaker site (SAN cent); site 4 is from the IAS block zone region. Vertical lines show the beginning of the SAN, CT, and IAS activation, respectively. SCL indicates CL. C and D, Activation maps of the SAN and atrial components of the OAPs. In all maps, the gray arrows represent the SEPs.
In all SAN preparations (n=7), epi- and endocardial optical mapping revealed 2 main atrial breakthrough sites superior and inferior to the node, separated by 20.9±3.1 mm (Figure 4). Atrial breakthrough was 49±22 ms after the earliest SAN activation, 8.8±3.2 mm superior or inferior to the site of the earliest activation within the SAN. Excitation originated from this region, slowly spread (2 to 14 cm/sec) along the SAN parallel to the CT before exiting, and failed to conduct in a perpendicular direction into the IAS and the CT. The conduction delay between the SAN and IAS was attributable to a lateral conduction block, similar to the rabbit SAN.13 Unlike the rabbit SAN, the canine SAN failed to directly excite the CT. The block correlated anatomically with the location of the SAN arteries. The areas of block lateral to the SAN (17±2 mm) completely insulated the SAN from the atrial myocardium except for 2 to 3 superior and inferior SEPs separated by 12.8±4.1 mm (n=7), which were observed with both epicardial and endocardial mapping (Figure 4).
Conduction Properties of SAN
Under control conditions, CV within 2 to 3 mm of the leading pacemaker site (n=5) was 8.9±3.1 and 8.6±3.2 cm/sec in the superior and inferior directions, respectively; 4.6±2.0 cm/sec in the lateral direction toward the CT; and 2.7±1.6 cm/sec medially toward the septum (Figure 5A and 5B). Conduction significantly slowed as it spread within the SAN and blocked in the lateral directions.
Figure 5.

High-resolution sinoatrial activation in control conditions and during exit block from the node. A, Photograph of the preparation with 2 optical fields of view (OFV): 36×36 mm and 9×9 mm (same preparation as Figures 1 through 4). The beginning of the activation sequence in the SAN during control conditions and during exit block is shown by dark blue and red ovals, respectively. The red oval shows the approximate border of the SAN. In all images, the gray arrows show the SEPs from the SAN to the CT. SVC and IVC indicate superior and inferior vena cava, respectively; RAA, right atrial appendage. B (top left and top center), OAPs from 6 sites (top left) and a bipolar electrogram during NSR (OFV: 9×9 mm) (top center). Vertical lines show beginning of the SAN, CT, and IAS activation, respectively. B (maps), Activation maps of separate SAN and atrial components (Comp#1 and Comp#2) of the OAPs; map of amplitude of SAN component 1 of OAPs, maps of the slope of the SDD, and dV/dtmax. C (left), OAPs from the same recording sites shown in panel B. C (maps), Activation map of the SAN only; map of amplitude of SAN OAPs, maps of SDD, and dV/dtmax.
In 4 SAN preparations, atrial pacing not only induced a shift of the dominant pacemaker and changed the atrial activation pattern but also caused transient SAN exit block, which lasted for several seconds in 2 SANs. Figure 5C illustrates such exit block. Before pacing, excitation originated in the top third of the SAN, propagated through the superior exit pathway, and 87 ms later, excited the atrium, thereby producing a bifocal atrial activation pattern. Pacing-induced uncoupling of the SAN from the atrial myocardium induced a pacemaker shift of 2 mm inferiorly and transiently decreased CL (589 versus 561 ms). The leading pacemaker sites were approximately 1 mm from the area that demonstrated the maximum SDD in both maps. The maximum dV/dtmax of the SAN OAPs were at least 6 times less than the atrial component of OAPs upstroke.
Figure 6 shows transient SAN exit block following 10 minutes of pacing. OAP tracings demonstrate slow, small amplitude signals, which reflect only SAN APs without an atrial component. This SAN wave originated near the same site observed before pacing but was blocked superiorly and slowly propagated to the inferior aspect of the SAN. However, the second SAN activation exited from both SEPs and simultaneously excited the CT with a sinoatrial conduction time of 107 ms. During 1 minute of SR, sinoatrial conduction time and CL recovered to control values of 47 and 789 ms, respectively.
Figure 6.

Pacing-induced exit conduction block from SAN. A, Photograph of the preparation with OFV of 36×36 mm. The beginning of the activation sequence during SR in control is shown by a dark blue oval. In all images, the gray arrows symbolize the SEPs from the SAN to the CT. SVC and IVC indicate superior and inferior vena cava, respectively; RAA, right atrial appendage. B, OAPs from 3 recording sites shown in the activation maps (C) following the termination of atrial pacing with an S1S1= 300 ms and recovery of spontaneous SAN activity. OAPs recordings from the SAN region demonstrate a small region of slow activation (C, middle) from the pacemaker layer without any atrial component. The sinoatrial conduction time (SACT) is 107 ms. C, Activation maps during atrial pacing, first and second spontaneous SAN excitations after termination of pacing. The first SAN excitation after pacing was stopped showed slow propagation, with an average CV of 1.8 cm/sec from the head to tail of the SAN body. This activation did not excite the atrial myocardium. The black dotted line shows conduction block to the IAS, which is correlated with one of the SAN artery branches near the IAS. See text for details.
Both Figures 5C and 6C illustrate decremental conduction from the leading pacemaker site to the terminal parts of the SAN. These observations were consistent in all preparations (n=4) in which SAN exit block was observed.
Immunofluorescence Labeling
The SAN previously has been identified as a Cx43-negative region.13,15,23,24 Therefore, we used a lack of Cx43 to identify the SAN. Four SAN preparations were sectioned parallel to the epicardium (Figure 2B and 2C) and 1 was sectioned perpendicular to the CT (Figure 7). Sections were labeled by immunofluorescence for Cx43, α-actinin, and vimentin (Figure 7 and Figure I in the online data supplement). Following optical mapping, 0.3-mm pins were inserted around the SAN to precisely register optical mapping with histology data. Figures 2 and 7 show parallel and perpendicular immunolabeled sections, which clearly demonstrate that the functionally defined SAN corresponds to the Cx43-negative area. The Cx43-negative tissue was located in the intercaval region and ended at the epicardial surface near the superior SEP and endocardial surface near inferior SEP, which were determined by optical mapping and histology (Figures 2 through 7 and supplemental Table II). In addition, there were generally increased ratios of fibroblasts to cardiomyocytes in the SAN as compared to the CT and IAS, as shown by the vimentin to α-actinin density ratios (supplemental Figure I and Table III). Cx43-positive bundles were also found in the SAN periphery at the endocardial and epicardial CT surfaces. See supplemental Figure II for Cx43 density in the superior, central, and inferior areas of the SAN at 5 transmural layers from 4 preparations. SEPs appear as narrow (200 to 400 μm) muscular bundles, which contain both Cx43 positive and negative transitional cells (Figures 2 and 7). These bundles merge with the larger muscular bundles of the CT.
Figure 7.

An example of the transmural distribution of Cx43 near exit pathway from the SAN. A (top), Transmural histology section from the superior part of the SAN and exit conduction pathway (SEP). This image shows a single 2D histology section through layers of the tissues that contain the SAN, superior break-through site, parts of the CT and IAS, and coronary arteries. In all images, the dashed black line shows the location of the IAS block zone (Block). A (left), Immunofluorescent labeling of Cx43 (green) and α-actinin (red). Mosaic images were created to reconstruct immunostaining from the adjacent tissue section of the histology presented in B (top). A (bottom), Two-dimensional map of Cx43 density as a function of signal area divided by tissue area. Red dotted rectangles in all images in B show area of Cx43 measurements. Pink lines in all images in B show the border of the Cx43-negative area. The SAN arteries are shown by white ovals. B, The superior SEP. This images shows a part of a 2D histology section from A (top). This section was done through layers of tissues that contain the SAN, parts of the CT and IAS, and superior SEP as shown by the green arrows. The pink dotted line shows the border of the Cx43-negative area.
Figure 8 shows a 3D model of the canine SAN, which is based on electrophysiological, histological, and immunohistochemical data. Coronary arteries are landmarks of the canine SAN. The SAN and these arteries are sandwiched within epi- and endocardial atrial layers that thicken near the CT. The structural data suggest that the SAN connects with these atrial layers at an oblique angle between the superior and inferior SEPs. The SAN was almost entirely encapsulated in fibrotic tissue except for these pathways.
Figure 8.
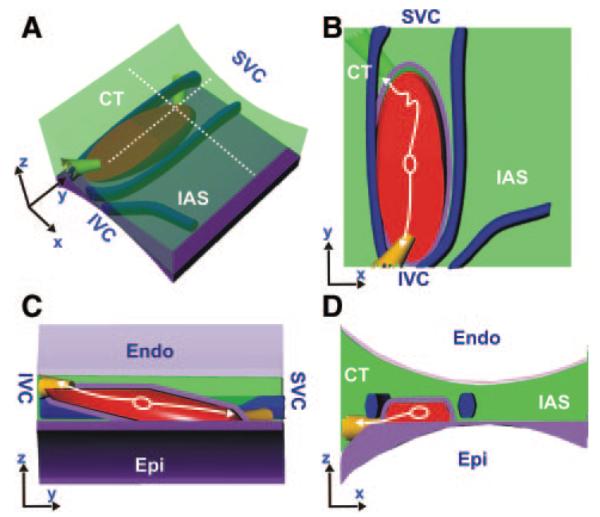
Three-dimensional model of SAN. A, Three-dimensional model of the SAN based on the functional and structural data were created using the Rhinoceros 3D software (McNeel). The light green area represents the atrial myocardium. The fibrotic tissue (purple) and coronary arteries (blue) encase the SAN (red). The immunohistochemistry in Figure 7 and the preparation images in Figures 1 through 6 were used to accurately position the SAN in relationship to these 3 distinct coronary arteries. The beginning of the activation sequence during SR in control conditions is shown by a white oval. The white arrows show the 2 main directions of the excitation propagation within the SAN. The yellow bundles show the SEPs observed from the functional and structural data. A and B show side and top projections, respectively. C and D show cross-sections in the z-y and z-x plane, respectively.
Discussion
In the present study, we have demonstrated that the canine SAN is a specialized structure that is anatomically and functionally isolated from the atrial myocardium (CT and IAS) except for 2 (or more) superior and inferior SEPs. This insulation is composed of the SAN arteries and connective tissue, which creates an extended conduction block zone around the SAN. This insulation isolates the weak SAN current source from the significant resistive load of the adjacent atrium.25 Multiple SEPs explain why, during NSR, atrial breakthroughs can arise from a region (20.9±3.1 mm) along the CT that is larger than the area of the anatomic SAN (13.7±2.8 mm). We also found that in this experimental model that 5 to 15 minutes of atrial pacing can induce transient (<5 seconds) SAN exit block and slowing of pacemaker activity, thus modulating heart rate.
Structural and Functional Characteristics of the Canine SAN
The present study extends a methodological approach, introduced earlier in the rabbit SAN,13 that allows structure/function mapping of the SAN in a large mammalian species. Optical mapping is a powerful methodology, which simultaneously resolves the activation pattern and AP morphology of the SAN. We also introduced a novel excitation—contraction uncoupler Blebbistatin,26 which now can be used in the canine heart.
In a previous study, we demonstrated in the rabbit that the entire region located between the superior and inferior vena cava and between the CT and the IAS contains pacemaker tissue, which is electrically uncoupled from the IAS by a block zone.13 The heterogeneous expression of connexins and other proteins determines the location of the leading pacemaker site under various physiological conditions. We found that the IAS block zone in the rabbit plays an important role protecting the function of the SAN from hyperpolarization of the atrium but can also contribute to atrial reentrant arrhythmias.13,27,28 Although the rabbit SAN is a convenient model for in vitro studies, because of its size and thickness (100 to 300 μm), the paucity of connective tissue, and the viability of a superfused preparation,13,14 it lacks the complexity of the 3D human SAN. The canine SAN is, however, histologically and functionally similar to the human SAN.17 Additionally, optical recordings from the canine SAN are significantly more complicated than the rabbit SAN because of its complex 3D structure. In the present study, we show for the first time direct mapping of conduction inside the canine SAN and in the atrium.
Our observations support the main hypothesis of the Boineau—Schuessler model of the SAN.6,19 In addition, we present evidence for the presence of specialized narrow (≈300 μm) SEPs (Figures 2 through 7). Estimation of the CVs within 2 to 3 mm of the leading pacemaker site in the 5 preparations shows values of 1.2 to 14 cm/sec with an anisotropy ratio of 3.8±0.8 (Figure 5). The CV could be slowed down to 2 cm/sec in the SEPs. This slowing is likely attributable to source—sink mismatch when excitation passes through the narrow exit pathways, as was shown in cell culture.25 We conclude that in our experimental model, multifocal atrial activation patterns do not originate from multiple simultaneous pacemakers, but rather correspond to a single leading pacemaker site within the SAN and the simultaneous atrial excitation from the 2 or more SEPs.
SAN Exit Block
Sick sinus syndrome is characterized by sinus bradycardia, exit block from the SAN, or cardiac arrest. Different etiologies have been suggested as causes of sick sinus syndrome with and without cardiovascular disease.1,5,29 It has been shown in the dog30,31 and human32,33 that fast atrial rhythm attributable to arrhythmias or pacing can significantly increase SAN recovery time. However, it was impossible to recognize exit block from SAN arrest because of the inability to directly assess SAN electric activity. Thus, because of exit block, estimation of SAN recovery time using only atrial electrograms is not a reliable estimate of recovery of SAN intrinsic activity. Our data showed that atrial pacing induced SAN dysfunction attributable to exit block (Figures 5 and 6), which is consistent with clinical evidence.31-34 Two general hypotheses of pacing-induced SAN dysfunction have been proposed34: (1) suppression is caused by release of neurotransmitters; and (2) overdrive pacing directly disrupts ionic mechanisms of the pacemaker automaticity. It is well known that atrial overdrive pacing does result in a release of autonomic neurotransmitters, presumably acetylcholine (ACh).35,36 Vagal stimulation or ACh administration does prolong SAN recovery.13,37 Our data are consistent with the ACh hypothesis,38 because release of ACh could induce exit block from SAN.28 It is also likely that the mechanism of SAN exit block may also be related to short-term (<1 minute) changes in properties of atrial tissue near the exit pathways attributable to changes in extracellular potassium, intracellular calcium, and phosphorylation states of some proteins induced by rapid pacing.
Study Limitations
Duration of optical recordings is limited because of washout of the dye and/or photobleaching.39 Use of optical mapping required application of Blebbistatin, which had been previously applied in rat and rabbit models26 and human heart.40 However, it is possible that suppression of mechanical contractions by Blebbistatin prevented activation of stretch-activated channels, which can play a role in pacemaker activity of SAN.41,42 We also cannot exclude the potential influence of edema that may develop in a mechanically silent preparation and thus may affect SAN activity. Moreover, staining with di-4-ANEPPS, as in our previous study of the in the rabbit SAN,13 may cause a transient effect on pacemaking and conduction properties of the canine SAN. However, our observation of pacing-induced SAN dysfunction is in agreement with several clinical observations.30,34,35
Conclusion
The present study demonstrates functional insulation of the canine SAN from the atria, except for the 2 (or more) superior and inferior SEPs. These pathways are important in the modulation of SR in health and disease.
Supplementary Material
Sources of Funding
The work was supported by American Heart Association Grant BGIA 0860047Z (to V.V.F.); NIH grants R01 HL0322257 and R01 HL085113 (to R.B.S.); the Lucy & Stanley Lopata Endowment, Coulter Foundation, and NIH R01 HL085369 (to I.R.E.).
Footnotes
Presented in part at the 80th Scientific Sessions of the American Heart Association, November 4–7, 2007, Orlando, Fla, and published in abstract form (Circulation. 2007;116[suppl II]:II-119).
Disclosures None.
References
- 1.Rodriguez RD, Schocken DD. Update on sick sinus syndrome, a cardiac disorder of aging. Geriatrics. 1990;45:26. [PubMed] [Google Scholar]
- 2.Dobrzynski H, Boyett MR, Anderson RH. New insights into pacemaker activity: promoting understanding of sick sinus syndrome. Circulation. 2007;115:1921–1932. doi: 10.1161/CIRCULATIONAHA.106.616011. [DOI] [PubMed] [Google Scholar]
- 3.Mandel WJ, Jordan JL, Karagueuzian HS. Disorders of sinus function. Curr Treat Options Cardiovasc Med. 1999;1:179–186. doi: 10.1007/s11936-999-0021-9. [DOI] [PubMed] [Google Scholar]
- 4.Ross RA, Kenny RA. Pacemaker syndrome in older people. Age Ageing. 2000;29:13–15. doi: 10.1093/ageing/29.1.13. [DOI] [PubMed] [Google Scholar]
- 5.Adan V, Crown LA. Diagnosis and treatment of sick sinus syndrome. Am Fam Physician. 2003;67:1725–1732. [PubMed] [Google Scholar]
- 6.Schuessler RB. Abnormal sinus node function in clinical arrhythmias. J Cardiovasc Electrophysiol. 2003;14:215–217. doi: 10.1046/j.1540-8167.2003.02229.x. [DOI] [PubMed] [Google Scholar]
- 7.Bromberg BI, Hand DE, Schuessler RB, Boineau JP. Primary negativity does not predict dominant pacemaker location: implications for sinoatrial conduction. Am J Physiol. 1995;269:H877–H887. doi: 10.1152/ajpheart.1995.269.3.H877. [DOI] [PubMed] [Google Scholar]
- 8.Barbuti A, DiFrancesco D. Control of cardiac rate by “funny” channels in health and disease. Ann N Y Acad Sci. 2008;1123:213–223. doi: 10.1196/annals.1420.024. [DOI] [PubMed] [Google Scholar]
- 9.Lakatta EG, Vinogradova TM, Maltsev VA. The missing link in the mystery of normal automaticity of cardiac pacemaker cells. Ann N Y Acad Sci. 2008;1123:41–57. doi: 10.1196/annals.1420.006. [DOI] [PMC free article] [PubMed] [Google Scholar]
- 10.Lewis T, Oppenheimer A, Oppenheimer BS. The site of origin of the mammalian heart beat: the pacemaker in the dog. Heart. 1910;II:147–169. [Google Scholar]
- 11.Opthof T, de Jonge B, Jongsma HJ, Bouman LN. Functional morphology of the mammalian sinuatrial node. Eur Heart J. 1987;8:1249–1259. doi: 10.1093/oxfordjournals.eurheartj.a062200. [DOI] [PubMed] [Google Scholar]
- 12.Schuessler RB, Bromberg BI, Boineau JP. Effect of neurotransmitters on the activation sequence of the isolated atrium. Am J Physiol. 1990;258:H1632–H1641. doi: 10.1152/ajpheart.1990.258.6.H1632. [DOI] [PubMed] [Google Scholar]
- 13.Fedorov VV, Hucker WJ, Dobrzynski H, Rosenshtraukh LV, Efimov IR. Postganglionic nerve stimulation induces temporal inhibition of excitability in the rabbit sinoatrial node. Am J Physiol. 2006;291:H612–H623. doi: 10.1152/ajpheart.00022.2006. [DOI] [PubMed] [Google Scholar]
- 14.Bleeker WK, Mackaay AJ, Masson-Pevet M, Bouman LN, Becker AE. Functional and morphological organization of the rabbit sinus node. Circ Res. 1980;46:11–22. doi: 10.1161/01.res.46.1.11. [DOI] [PubMed] [Google Scholar]
- 15.Kwong KF, Schuessler RB, Green KG, Laing JG, Beyer EC, Boineau JP, Saffitz JE. Differential expression of gap junction proteins in the canine sinus node. Circ Res. 1998;82:604–612. doi: 10.1161/01.res.82.5.604. [DOI] [PubMed] [Google Scholar]
- 16.James TN. Anatomy of the sinus node of the dog. Anat Rec. 1962;143:251–265. doi: 10.1002/ar.1091430310. [DOI] [PubMed] [Google Scholar]
- 17.James TN. Anatomy of the human sinus node. Anat Rec. 1961;141:109–139. doi: 10.1002/ar.1091410205. [DOI] [PubMed] [Google Scholar]
- 18.Boineau JP, Canavan TE, Schuessler RB, Cain ME, Corr PB, Cox JL. Demonstration of a widely distributed atrial pacemaker complex in the human heart. Circulation. 1988;77:1221–1237. doi: 10.1161/01.cir.77.6.1221. [DOI] [PubMed] [Google Scholar]
- 19.Boineau JP, Schuessler RB, Mooney CR, Wylds AC, Miller CB, Hudson RD, Borremans JM, Brockus CW. Multicentric origin of the atrial depolarization wave: the pacemaker complex. Relation to dynamics of atrial conduction, P-wave changes and heart rate control. Circulation. 1978;58:1036–1048. doi: 10.1161/01.cir.58.6.1036. [DOI] [PubMed] [Google Scholar]
- 20.Nikolski V, Efimov I. Fluorescent imaging of a dual-pathway atrioventricular-nodal conduction system. Circ Res. 2001;88:e23–e30. doi: 10.1161/01.res.88.3.e23. [DOI] [PubMed] [Google Scholar]
- 21.Baxter WT, Mironov SF, Zaitsev AV, Jalife J, Pertsov AM. Visualizing excitation waves inside cardiac muscle using transillumination. Biophys J. 2001;80:516–530. doi: 10.1016/S0006-3495(01)76034-1. [DOI] [PMC free article] [PubMed] [Google Scholar]
- 22.Fedorov VV, Hepmpill M, Kostecki G, Efimov IR. Low electroporation threshold, conduction block, focal activity and reentrant arrhythmia in the rabbit atria: possible mechanisms of stunning and defibrillation failure. Heart Rhythm. 2008;5:593–604. doi: 10.1016/j.hrthm.2008.01.026. [DOI] [PMC free article] [PubMed] [Google Scholar]
- 23.Dobrzynski H, Li J, Tellez J, Greener ID, Nikolski VP, Wright SE, Parson SH, Jones SA, Lancaster MK, Yamamoto M, Honjo H, Takagishi Y, Kodama I, Efimov IR, Billeter R, Boyett MR. Computer three-dimensional reconstruction of the sinoatrial node. Circulation. 2005;111:846–854. doi: 10.1161/01.CIR.0000152100.04087.DB. [DOI] [PubMed] [Google Scholar]
- 24.Verheijck EE, Wessels A, van Ginneken AC, Bourier J, Markman MW, Vermeulen JL, de Bakker JM, Lamers WH, Opthof T, Bouman LN. Distribution of atrial and nodal cells within the rabbit sinoatrial node: models of sinoatrial transition. Circulation. 1998;97:1623–1631. doi: 10.1161/01.cir.97.16.1623. [DOI] [PubMed] [Google Scholar]
- 25.Rohr S, Kucera JP, Fast VG, Kleber AG. Paradoxical improvement of impulse conduction in cardiac tissue by partial cellular uncoupling. Science. 1997;275:841–844. doi: 10.1126/science.275.5301.841. [DOI] [PubMed] [Google Scholar]
- 26.Fedorov VV, Lozinsky IT, Sosunov EA, Anyukhovsky EP, Rosen MR, Balke CW, Efimov IR. Application of blebbistatin as an excitation-contraction uncoupler for electrophysiologic study of rat and rabbit hearts. Heart Rhythm. 2007;4:619–626. doi: 10.1016/j.hrthm.2006.12.047. [DOI] [PubMed] [Google Scholar]
- 27.Vinogradova TM, Fedorov VV, Yuzyuk TN, Zaitsev AV, Rosenshtraukh LV. Local cholinergic suppression of pacemaker activity in the rabbit sinoatrial node. J Cardiovasc Pharmacol. 1998;32:413–424. doi: 10.1097/00005344-199809000-00012. [DOI] [PubMed] [Google Scholar]
- 28.Fedorov VV, Ripplinger CM, Hucker WJ, Voloshina AS, Ambrosi CM, Wolfe C, Foyil KV, Schuessler RB, Efimov IR. Sinoatrial reentry is a mechanism of atrial flutter. Heart Rhythm. 2008;5:S60. [Google Scholar]
- 29.Roberts-Thomson KC, Sanders P, Kalman JM. Sinus node disease: an idiopathic right atrial myopathy. Trends Cardiovasc Med. 2007;17:211–214. doi: 10.1016/j.tcm.2007.06.002. [DOI] [PubMed] [Google Scholar]
- 30.Hadian D, Zipes DP, Olgin JE, Miller JM. Short-term rapid atrial pacing produces electrical remodeling of sinus node function in humans. J Cardiovasc Electrophysiol. 2002;13:584–586. doi: 10.1046/j.1540-8167.2002.00584.x. [DOI] [PubMed] [Google Scholar]
- 31.Elvan A, Wylie K, Zipes DP. Pacing-induced chronic atrial fibrillation impairs sinus node function in dogs. Electrophysiological remodeling. Circulation. 1996;94:2953–2960. doi: 10.1161/01.cir.94.11.2953. [DOI] [PubMed] [Google Scholar]
- 32.Sparks PB, Jayaprakash S, Vohra JK, Kalman JM. Electrical remodeling of the atria associated with paroxysmal and chronic atrial flutter. Circulation. 2000;102:1807–1813. doi: 10.1161/01.cir.102.15.1807. [DOI] [PubMed] [Google Scholar]
- 33.Manios EG, Kanoupakis EM, Mavrakis HE, Kallergis EM, Dermitzaki DN, Vardas PE. Sinus pacemaker function after cardioversion of chronic atrial fibrillation: is sinus node remodeling related with recurrence? J Cardiovasc Electrophysiol. 2001;12:800–806. doi: 10.1046/j.1540-8167.2001.00800.x. [DOI] [PubMed] [Google Scholar]
- 34.Jordan JL, Yamaguchi I, Mandel WJ. Function and dysfunction of the sinus node clinical studies in the evaluation of sinus node function. In: Bonke FI, editor. The Sinus Node. Martinus Nijholff Medical Division; Boston: 1978. pp. 3–23. [Google Scholar]
- 35.Ehlert FA, Damle RS, Goldberger JJ, Kadish AH. Effect of stimulus intensity on atrial refractoriness and sinus node recovery. J Cardiovasc Electrophysiol. 1994;5:485–495. doi: 10.1111/j.1540-8167.1994.tb01289.x. [DOI] [PubMed] [Google Scholar]
- 36.Yu WC, Chen SA, Chiang CE, Tai CT, Lee SH, Chiou CW, Ueng KC, Wen ZC, Chen YJ, Huang JL, Feng AN, Chang MS. Effect of high intensity drive train stimulation on dispersion of atrial refractoriness: role of autonomic nervous system. J Am Coll Cardiol. 1997;29:1000–1006. doi: 10.1016/s0735-1097(97)00036-3. [DOI] [PubMed] [Google Scholar]
- 37.Watanabe H, Perry JB, Page P, Savard P, Nadeau R. Vagal effects on sinoatrial and atrial conduction studied with epicardial mapping in dogs: the influence of pacemaker shifts on the measurement of sinoatrial conduction time. Can J Physiol Pharmacol. 1985;63:113–121. doi: 10.1139/y85-021. [DOI] [PubMed] [Google Scholar]
- 38.Bluemel KM, Wurster RD, Randall WC, Duff MJ, O’Toole MF. Para-sympathetic postganglionic pathways to the sinoatrial node. Am J Physiol. 1990;259:H1504–H1510. doi: 10.1152/ajpheart.1990.259.5.H1504. [DOI] [PubMed] [Google Scholar]
- 39.Efimov IR, Nikolski VP, Salama G. Optical imaging of the heart. Circ Res. 2004;95:21–33. doi: 10.1161/01.RES.0000130529.18016.35. [DOI] [PubMed] [Google Scholar]
- 40.Hucker WJ, Fedorov VV, Foyil KV, Moazami N, Efimov IR. Images in cardiovascular medicine. Optical mapping of the human atrioventricular junction. Circulation. 2008;117:1474–1477. doi: 10.1161/CIRCULATIONAHA.107.733147. [DOI] [PMC free article] [PubMed] [Google Scholar]
- 41.Lange G, Lu HH, Chang A, Brooks CM. Effect of stretch on the isolated cat sinoatrial node. Am J Physiol. 1966;211:1192–1196. doi: 10.1152/ajplegacy.1966.211.5.1192. [DOI] [PubMed] [Google Scholar]
- 42.Cooper PJ, Kohl P. Species- and preparation-dependence of stretch effects on sino-atrial node pacemaking. Ann N Y Acad Sci. 2005;1047:324–335. doi: 10.1196/annals.1341.029. [DOI] [PubMed] [Google Scholar]
Associated Data
This section collects any data citations, data availability statements, or supplementary materials included in this article.