

I. Introduction to Carbonic Anhydrase (CA) and to the Review
1. Introduction: Overview of CA as a Model
Carbonic anhydrase (CA, EC 4.2.1.1) is a protein that is especially well-suited to serve as a model in many types of studies in biophysics, bioanalysis, the physical-organic chemistry of inhibitor design, and medicinal chemistry. In vivo, this enzyme catalyzes the hydration of CO2 and the dehydration of bicarbonate (eq 1).
| (1) |
The active site of α-CAs comprises a catalytic ZnII ion coordinated by three imidazole groups of histidines and by one hydroxide ion (or water molecule), all in a distorted tetrahedral geometry. This grouping is located at the base of a cone-shaped amphiphilic depression, one wall of which is dominated by hydrophobic residues and the other of which is dominated by hydrophilic residues.1 Unless otherwise stated, “CA” in this review refers to (i) various isozymes of α-CAs or (ii) the specific α-CAs human carbonic anhydrases I and II (HCA I and HCA II) and bovine carbonic anhydrase II (BCA II); “HCA” refers to HCA I and HCA II; and “CA II” refers to HCA II and BCA II.
CA is particularly attractive for biophysical studies of protein–ligand binding for many reasons. (i) CA is a monomeric, single-chain protein of intermediate molecular weight (~30 kDa), and it has no pendant sugar or phosphate groups and no disulfide bonds. (ii) It is inexpensive and widely available. (iii) It is relatively easy to handle and purify, due in large part to its excellent stability under standard laboratory conditions. (iv) Amino acid sequences are available for most of its known isozymes. (v) The structure of CA, and of its active site, has been defined in detail by X-ray diffraction, and the mechanism of its catalytic activity is well-understood. (vi) As an enzyme, CA behaves not only as a hydratase/anhydrase with a high turnover number but also as an esterase (a reaction that is easy to follow experimentally). (vii) The mechanism of inhibition of CA by ligands that bind to the ZnII ion is fairly simple and well-characterized; it is, therefore, easy to screen inhibitors and to examine designed inhibitors that test theories of protein–ligand interactions. (viii) It is possible to prepare and study the metal-free apoenzyme and the numerous variants of CA in which the ZnII ion is replaced by other divalent ions. (ix) Charge ladders of CA II—sets of derivatives in which acylation of lysine amino groups (−NH3+ → −NHAc) changes the net charge of the protein—allow the influence of charge on properties to be examined by capillary electrophoresis. Some disadvantages of using CA include the following: (i) the presence of the ZnII cofactor, which can complicate biophysical and physical-organic analyses; (ii) a structure that is more stable than a representative globular protein and, thus, slightly suspect as a model system for certain studies of stability; (iii) a function—interconversion of carbon dioxide and carbonate—that does not involve the types of enzyme/substrate interactions that are most interesting in design of drugs; (iv) a catalytic reaction that is, in a sense, too simple (determining the mechanism of a reaction is, in practice, usually made easier if the reactants and products have an intermediate level of complexity); and (v) the absence of a solution structure of CA (by NMR spectroscopy). The ample X-ray data, however, paint an excellent picture of the changes (which are generally small) in the structure of CA that occur on binding ligands or introducing mutations.
The most important class of inhibitors of CA, the aryl-sulfonamides, has several characteristics that also make it particularly suitable for physical-organic studies of inhibitor binding and in drug design: (i) arylsulfonamides are easily synthesized; (ii) they bind with high affinity to CA (1 μM to sub-nM); (iii) they share one common structural feature; and (iv) they share a common, narrowly defined geometry of binding that exposes a part of the ligand that can be easily modified synthetically. There are also many non-sulfonamide, organic inhibitors of CA, as well as anionic, inorganic inhibitors.
We divide this review into five parts, all with the goal of using CA as a model system for biophysical studies: (I) an overview of the enzymatic activity and medical relevance of CA; (II) the structure and structure–function relationships of CA and its engineered mutants; (III) the thermodynamics and kinetics of the binding of ligands to CA; (IV) the effect of electrostatics on the binding of ligands to and the denaturation of CA; and (V) what makes CA a good model for studying protein–ligand binding and protein stability.
1.1. Value of Models
CA serves as a good model system for the study of enzymes. That is, it is a protein having some characteristics representative of enzymes as a class, but with other characteristics that make it especially easy to study. It is a moderately important target in current medicinal chemistry: its inhibition is important in the treatment of glaucoma, altitude sickness, and obesity; its overexpression has recently been implicated in tumor growth; and its inhibition in pathogenic organisms might lead to further interesting drugs.2,3 More than its medical relevance, its tractability and simplicity are what make CA a particularly attractive model enzyme.
The importance of models in science is often underestimated. Models represent more complex classes of related systems and contribute to the study of those classes by focusing research on particular, tractable problems. The development of useful, widely accepted models is a critical function of scientific research: many of the techniques (both experimental and analytical) and concepts of science are developed in terms of models; they are thoroughly engrained in our system of research and analysis.
Examples of models abound in successful areas of science: in biology, E. coli, S. cerevisiae, Drosophila mela-nogaster, C. elegans, Brachydanio rerio (zebrafish), and the mouse; in chemistry, the hydrogen atom, octanol as a hydrophobic medium, benzene as an aromatic molecule, the 2-norbornyl carbocation as a nonclassical ion, substituted cyclohexanes for the study of steric effects, p-substituted benzoic acids for the study of electronic effects, cyclodextrins for ligand–receptor interactions; in physics, a vibrating string as an oscillator and a particle in a box as a model for electrons in orbitals.
Science needs models for many reasons:
Focus: Models allow a community of researchers to study a common subject. Solving any significant problem in science requires a substantial effort, with contributions from many individuals and techniques. Models are often the systems chosen to make this productive, cooperative focus possible.
Research Overhead: Development of a system to the point where many details are scientifically tractable is the product of a range of contributions: for enzymes, these contributions are protocols for preparations, development of assays, determination of structures, preparation of mutants, definition of substrate specificity, study of rates, and development of mechanistic models. In a well-developed model system, the accumulation of this information makes it relatively easy to carry out research, since before new experiments begin, much of the background work–the fundamental research in a new system–has already been carried out.
Recruiting and Interdisciplinarity: The availability of good model systems makes it relatively easy for a neophyte to enter an area of research and to test ideas efficiently. This ease of entry recruits new research groups, who use, augment, and improve the model system. It is especially important to have model systems to encourage participation by researchers in other disciplines, for whom even the elementary technical procedures in a new field may appear daunting.
Comparability: A well-established model allows researchers in different laboratories to calibrate their experiments, by reproducing well-characterized experiments.
Community: The most important end result of a good model system is often the generation of a scientific community–that is, a group of researchers examining a common problem from different perspectives and pooling information relevant to common objectives.
One of the goals of this review is to summarize many experimental and theoretical studies of CA that have established it as a model protein. We hope that this summary will make it easier for others to use this protein to study fundamentals of two of the most important questions in current chemistry: (i) Why do a protein and ligand associate selectively? (ii) How can one design an inhibitor to bind to a protein selectively and tightly? We believe that the summary of studies of folding and stability of CA will be useful to biophysicists who study protein folding. In addition, we hope that the compilation of data relevant to CA in one review will ease the search for information for those who are beginning to work with this protein.
1.2. Objectives and Scope of the Review
This review includes information relevant to the use of CA as a model system for physical-organic studies of protein–ligand interactions and for developing strategies for rational drug design. The problem of designing high-affinity ligands to proteins is essentially one of molecular recognition in aqueous solution and one that chemistry should, in principle, be able to solve. The problem has been intractable for 50 years, however, and one important reason seems to be deficiencies in our understanding of the underlying physical principles.4,5 CA is particularly valuable for approaching this problem because it allows studies of binding of molecules to regions of the active site adjacent to the principal binding site–that is, the arylsulfonamide binding site, with its clearly defined hydrophobic pocket centered on the (His)3ZnII group; this additional binding site localizes the –SO2NH− group of an inhibitor near the ZnII ion. CA is, thus, uniquely suited for studies of structural perturbations to binding (perturbational studies often provide the most profitable strategy for testing hypotheses in difficult fields of science, among which rational drug design is certainly one).
We also discuss the use of CA for studying the folding, unfolding, and aggregation of proteins, as well as for developing biophysical assays for the binding of substrates and ligands to proteins. This review will give only brief surveys of the biology, physiology, or catalytic activity of CA and the use of its inhibitors in medicine; these subjects are reviewed extensively and in depth elsewhere.2,6–15
2. Overview of Enzymatic Activity
CA catalyzes the reversible hydration of CO2 to bicarbonate (eq 1 and Figure 1) in a two-step “ping-pong” mechanism.14 The first step involves the direct nucleophilic attack of a ZnII-bound hydroxy group on CO2 to form a metal-bound bicarbonate, followed by displacement of bicarbonate by a molecule of water. In the second step, the ZnII-bound water molecule (see section 4.7) transfers a proton to molecules of buffer in the solvent and regenerates the zinc-hydroxide form of CA. CA is an extremely efficient catalyst: catalytic turnovers for several variants of CA are among the highest known (kcatCO2 ≈ 106 s−1), and the second-order rate constants for these enzymes approach the limit of diffusional control (kcat/KmCO2 ≈ 108 M−1 s−1).14 Snider et al. compiled a comprehensive list of values of kcat/Km for enzymes that have second-order rate constants that approach the limit imposed by diffusion.16 Table 1 lists kinetic constants for various isozymes of CA17–29 and (for comparison) other highly efficient enzymes.30–36
Figure 1.

Mechanism of catalysis of the hydration of CO2 by HCA II.14 The putative structures of the species CA–OH and CA–OH2+, discussed in detail in the text, are indicated. We show the formal charge only on the zinc-bound water (and not the histidine residues) to emphasize that this water ligand is acidic (analogous to a hydronium ion being acidic) and adopt this convention throughout the remainder of the review.
Table 1.
Steady-State Rate Constants for Hydration of CO2 by Isozymes of CA and Kinetic Constants, for Comparison, of Other Highly Efficient Enzymes
| Isozyme | Source | kcat × 10−5 (s−1) | kcat/Km × 10−7 (M−1 s−1) | Ref |
|---|---|---|---|---|
| CA I | human | 2 | 5 | 17 |
| CA II | human | 14 | 15 | 17 |
| CA III | human | 0.1 | 0.03 | 18 |
| CA III | bovine | 0.064 | 0.04 | 19 |
| CA IV | human | 11 | 5 | 20 |
| CA IV | murine | 11 | 3.2 | 21 |
| CA VA | murine | 3 | 3 | 22 |
| CA VB | human | 9.5 | 9.8 | 27 |
| CA VI | human | 3.4 | 4.9 | 28 |
| CA VI | rat | 0.7 | 1.6 | 23 |
| CA VII | murine | 9.4 | 7.6 | 24 |
| CA IX | human | 3.8 | 5.5 | 25 |
| CA XII | human | 4 | 7.4 | 25 |
| CA XIII | murine | 0.83 | 4.3 | 26 |
| CA XIV | human | 3.12 | 3.9 | 29 |
| acetylcholinesterase | eel electric-organ | 0.14 | 16 | 30–33 |
| catalase | human | 5.5 | 0.7 | 34 |
| catalase | horse liver | 380 | 3.5 | 30, 35 |
| β-lactamase | human | 0.02 | 10 | 30 |
| superoxide dismutase | human | 0.04 | 800 | 36 |
| triosephosphate isomerase | human | 0.043 | 24 | 30 |
The catalytic activity of CA is not limited to the hydration of CO2 (eqs 2–8). Although other activities may not be relevant to its principal biological role, CA can catalyze the hydration of aryl and aliphatic aldehydes37–39 and the hydrolysis of a wide variety of esters in vitro.40,41 Bovine CA II (BCA II) resolves mixtures of racemic N-acetylamino acids by selectively hydrolyzing the ester of only one enantiomer.42 Human CA I and CA II (HCA I and HCA II) catalyze the hydrolysis of 1-fluoro-2,4-dinitrobenzene43 and sulfonyl chlorides.44 HCA I and II also catalyze the hydration of cyanamide to urea.45
| (2) |
| (3) |
| (4) |
| (5) |
| (6) |
| (7) |
| (8) |
While understanding of the mechanism of catalysis by CA is most detailed for HCA II, the available evidence suggests that all members of the α-CA family (see section 4.1) share the same ping-pong mechanism. The active site of CA contains a ZnII ion with a bound hydroxyl group (ZnII–OH) surrounded by three histidine residues held in a distorted tetrahedral geometry. Computational studies suggest that carbon dioxide is not coordinated to the ZnII but instead binds weakly (Kd ≈ 100 mM) in a hydrophobic region 3–4 Å away from the ZnII complex.46,47 Evidence suggests that the ZnII-bound hydroxy group attacks CO2 to initiate hydrolysis and produce bicarbonate, which is displaced from the ZnII ion by a molecule of water.48 The ZnII-bound water (see section 4.8) loses a proton to generate a new ZnII–OH for another round of catalysis.46,49 It is generally accepted that this proton is shuttled to buffers in solution by a series of intramolecular and intermolecular proton-transfer steps.50,51
Perhaps unexpectedly, the transfer of a proton from ZnII-bound water to buffer molecules appears to be the rate-limiting step in catalysis.48 Proton transfer involves His64, which acts as a proton shuttle (see section 4.6).52 Mutation of His64 to Ala generates a protein having 6–12% of the activity of native enzyme for hydration of CO2, depending on the buffer used in the experiment.53 Increasing the concentration of buffer (from 0 to 0.5 M) enhances the rate by up to 25%. In several crystal structures, the side chain of His64 has been observed in two orientations, one pointed into the active site toward the ZnII ion, and the other pointed out of the active site.54 The dependence of these conformations on pH suggests a key role of His64 in the mechanism of proton shuttling.55
Figure 1 outlines the details of the mechanism of hydration of CO2 by HCA II.14 While rate constants for individual steps in the CA-catalyzed hydration of CO2 are unknown, steady-state rate constants have been determined for many isozymes of CA (Table 1). Many groups have addressed these concepts computationally; the results of these studies will not be reviewed here.47,56–64
3. Medical Relevance
Bicarbonate, a primary substrate of CA, is active in many biological processes: (i) as a counterion in sodium transport, (ii) as a carrier for CO2, (iii) as a buffer, and (iv) as a metabolite in biosynthetic reaction pathways.65 Although carbon dioxide reacts spontaneously with water at 37 °C to produce a proton and bicarbonate (eq 1), this reaction is not fast enough to accomplish the hydration of CO2 and the dehydration of that are required for respiration in living organisms.66
As far as we know, CA exists in all organisms. Its ubiquity reflects the fact that CO2 is the terminal product of the oxidative metabolism of carbon-based molecules. In mammals, CA catalyzes the reversible hydration of CO2 to bicarbonate (and the reverse reaction). These reactions are important to a variety of biological processes, including the following: (i) regulation of respiration and gas exchange,8,67,68 (ii) regulation of acid–base equilibria,67,69 (iii) vision,13,70,71 (iv) development and function of bone,72,73 (v) calcification,73 (vi) metabolism,7,10 (vii) signaling and memory,74,75 (viii) gustation,76 (ix) production of saliva,77 (x) production of pancreatic juices,78 (xi) intestinal transport of ions,78–81 (xii) muscle function82–84 and the nervous system,80 (xiii) regulation of seminal fluid,85 (xiv) adaptation to cellular stress,86,87 (xv) acidification of the extracellular environment around hypoxic tumor cells,88 and (xvi) several biosynthetic pathways.75,89
CA plays an important role in the eye, where it is present in the lens, vitreous body, cornea, and retina. Within the ciliary body, the CA II-catalyzed formation of bicarbonate is the primary mechanism for the transport of sodium into the eye.90 The influx of sodium ions into the eye is accompanied by the transport of water; both processes are important in maintaining the aqueous humor. Inhibition of carbonic anhydrase decreases the production of bicarbonate, which subsequently lowers intraocular pressure.91 Oral and topical arylsulfonamide inhibitors of CA dramatically reduce intraocular pressure; this activity has made them mainstays of the treatment of glaucoma.70,92,93 In addition to their use in treating glaucoma, inhibitors of CA are also used in treating both macular degeneration and macular edema, disorders that affect the central retina.94,95
In the nervous system, CA serves many functions. In the choroid plexus, CA contributes to the production of cere-brospinal fluid.96 In the brain, CA is found in oligodendro-cytes and glial cells but is at the highest concentrations in sensory neurons, where it is important in signal processing, long-term synaptic transformation, and attentional gating of memory storage.74,97 Activation of CA rapidly increases levels of bicarbonate in memory-related neural structures.98 Regulation of the flux of bicarbonate into synaptic receptor channels allows CA to function as a gate that regulates the transfer of signals through the neural network.74 Inhibitors of CA can (i) impair spatial learning without affecting other behaviors–this selective effect may be important for the temporary suppression of memory;97 (ii) act as anticonvulsant and antiepileptic agents;99 (iii) obviate or delay the use of shunts in the brains of hydrocephalic infants and other patients;100,101 and (iv) effectively prevent episodic hypokalemic periodic paralysis.102
Inhibitors of CA are important in renal pharmacology as diuretic agents. Sulfonamide inhibitors, such as acetazol-amide (137, Table 10), increase the excretion of sodium and bicarbonate by preventing the reabsorption of bicarbonate and produce a diuretic effect.103 The thiazide class of inhibitors are potent diuretics that affect intracellular pH and decrease the transport of sodium ions across the luminal membrane.103 As a consequence of their diuretic effect, inhibitors of CA are used to treat hypertension and congestive heart failure.104,105 Inhibitors of CA can suppress the secretion of gastric acid, which is important in treating ulcerogenesis,106–108 and they can normalize severe metabolic alkalosis.
Table 10.
Thermodynamic Data for the Binding of Ligands to CA II
| Compound | Structure | CA II Variant | Dissociation Constant (nM) | Kd or Kia | pKa | Ref. |
|---|---|---|---|---|---|---|
| Type: | ||||||
| 1 | R = H | HCA | 200–1500 | Kd | 10.1 | 389,458 |
| 2 | R = CI | HCA | 120 | Kd | 9.9 | 458 |
| 3 | R = NO2 | HCA | 63 | Kd | 9.0 | 458 |
| 4 | R = NH2 | BCA | 3000–23000 | Ki | 10.5 | 413,503 |
| 5 | R = NHCH3 | BCA | 15000 | Ki | 11.0 | 503 |
| 222 | R = CH2NH3+ | BCA | 36000 | Kd | 8.4 | 417 |
| 6 | R = CH3 | HCA | 82 | Kd | 10.2 | 389 |
| 7 | R = CH2CH3 | HCA | 29 | Kd | 10.4 | 389 |
| 8 | R = (CH2)2CH3 | HCA | 17 | Kd | 10.3 | 389 |
| 9 | R = (CH2)3CH3 | HCA | 5.0 | Kd | 10.4 | 389 |
| 10 | R = (CH2)4CH3 | HCA | 1.4 | Kd | -- | 389 |
| 11 |  |
HCA | 180 | Ki | -- | 384 |
| 12 |  |
HCA | 770 | Ki | -- | 384 |
| 13 | HCA | 130 | Ki | -- | 384 | |
| 14 | HCA | 59 | Ki | -- | 384 | |
| 15 | HCA | 84 | Ki | -- | 384 | |
| 16 |  |
BCA | 850 | Kd | 10.2 | 508 |
| 17 |  |
BCA | 720 | Kd | 9.9 | 508 |
| 18 |  |
BCA | 610 | Kd | -- | 508 |
| 19 |  |
BCA | 440 | Kd | -- | 508 |
| 20 | BCA | 230 | Kd | -- | 508 | |
| 21 | BCA | 190 | Kd | -- | 508 | |
| 22 |  |
BCA | 270 | Kd | 10.1 | 508 |
| 23 |  |
BCA | 140 | Kd | 9.8 | 508 |
| 24 | 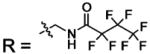 |
BCA | 85 | Kd | -- | 508 |
| 25 | 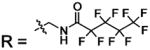 |
BCA | 44 | Kd | -- | 508 |
| 26 | BCA | 23 | Kd | -- | 508 | |
| 27 | BCA | 19 | Kd | -- | 508 | |
| 28 | R = CH2NHCO(CH2)4CO-NHC[CH2O(CH2)3SCH2COOH]3 | BCA | 6.1 | Kd | -- | 392 |
| Type: |  |
|||||
| 29 | X = OH | HCA | 270 | Ki | -- | 458 |
| 30 | X = OCH3 | HCA | 10 | Ki | 9.8 | 389 |
| 31 | X = OCH2CH3 | HCA | 3.2 | Ki | 9.7 | 389 |
| 32 | X = O(CH2)2CH3 | HCA | 1.7 | Ki | 9.8 | 389 |
| 33 | X = O(CH2)3CH3 | HCA | 0.77 | Ki | 9.7 | 389 |
| 34 | X = O(CH2)4CH3 | HCA | 0.41 | Ki | 10.1 | 389 |
| 35 | X = O(CH2)5CH3 | HCA | 0.41 | Ki | -- | 389 |
| 36 | X = NH2 | HCA | 120 | Kd | -- | 284 |
| 37 | X = NHCH3 | HCA | 83 | Ki | 10.3 | 389 |
| 38 | X = NHCH2CH3 | HCA | 30 | Kd | 10.1 | 389 |
| 39 | X = NH(CH2)2CH3 | HCA | 8.3 | Kd | 10.1 | 389 |
| 40 | X = NH(CH2)3CH3 | HCA | 3.3 | Kd | 10.1 | 389 |
| 41 | X = NH(CH2)4CH3 | HCA | 1.8 | Kd | 10.2 | 389 |
| 42 | X = NH(CH2)5CH3 | HCA | 1.3 | Kd | -- | 389 |
| 43 | X = NH(CH2)6CH3 | HCA | 1.2 | Kd | -- | 389 |
| 44 | X = NH(CH2)7CH3 | HCA | 2.5 | Kd | -- | 284 |
| 45 | X = NHCH2CF3 | BCA | 21 | Kd | -- | 508 |
| 46 | X = NHCH2CF2CF3 | BCA | 5.6 | Kd | -- | 508 |
| 47 | X = NHCH2(CF2)2CF3 | BCA | 0.91 | Kd | -- | 508 |
| 48 | X = NHCH2(CF2)6CF3 | BCA | 0.3 | Kd | -- | 284 |
| 49 |  |
HCA | 1.1 | Kd | -- | 284 |
| 50 |  |
HCA | 2.1 | Kd | -- | 284 |
| 51 |  |
HCA | 1.1 | Kd | -- | 284 |
| 52 |  |
HCA | 2.2 | Kd | -- | 284 |
| 53 |  |
HCA | 2.0 | Kd | -- | 284 |
| 54 | 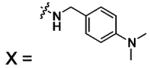 |
HCA | 1.4 | Kd | -- | 284 |
| 55 | 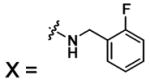 |
HCA | 0.36 | Kd | -- | 515,516 |
| 56 |  |
HCA | 0.29 | Kd | -- | 515,516 |
| 57 | 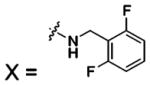 |
HCA | 0.91 | Kd | -- | 515,516 |
| 58 |  |
HCA | 1.5 | Kd | -- | 515,516 |
| 59 |  |
HCA | 4.3 | Kd | -- | 284 |
| 60 |  |
HCA | 4.0 | Kd | -- | 284 |
| 61 |  |
HCA | 1.4 | Kd | -- | 284 |
| 62 |  |
HCA | 0.6 | Kd | -- | 284 |
| 63 |  |
BCA | 300 | Kd | -- | 377 |
| 64 |  |
BCA | 260 | Kd | -- | 377 |
| 65 |  |
BCA | 330 | Kd | -- | 377 |
| 66 |  |
BCA | 370 | Kd | -- | 377 |
| 67 |  |
BCA | 370 | Kd | -- | 377 |
| 68 |  |
BCA | 340 | Kd | -- | 377 |
| 69 |  |
HCA | 71 | Kd | -- | 284 |
| 70 |  |
HCA | 75 | Kd | -- | 284 |
| 71 |  |
BCA | 210 | Kd | -- | 284 |
| 72 | BCA | 100 | Kd | -- | 377 | |
| 73 |  |
BCA | 130 | Kd | -- | 377 |
| 74 | BCA | 160 | Kd | -- | 377 | |
| 75 | BCA | 210 | Kd | -- | 377 | |
| 76 | BCA | 210 | Kd | -- | 377 | |
| 77 |  |
BCA | 28 | Kd | -- | 377 |
| 78 |  |
BCA | 33 | Kd | -- | 377 |
| 79 |  |
BCA | 41 | Kd | -- | 377 |
| 80 |  |
BCA | 36 | Kd | -- | 377 |
| 81 |  |
BCA | 36 | Kd | -- | 377 |
| 82 |  |
BCA | 54 | Kd | -- | 377 |
| 83 | HCA | 43 | Kd | -- | 185 | |
| 84 | HCA | 19 | Kd | -- | 185 | |
| 85 |  |
HCA | 14 | Kd | -- | 185 |
| 86 | HCA | 41 | Kd | -- | 185 | |
| 87 |  |
HCA | 100 | Kd | -- | 185 |
| 88 | HCA | 50 | Kd | -- | 185 | |
| 89 | X = Asp | HCA | 1100 | Kd | -- | 507 |
| 90 | X = Glu | HCA | 530 | Kd | -- | 507 |
| 91 | X = Asn | HCA | 380 | Kd | -- | 507 |
| 92 | X = Gln | HCA | 140 | Kd | -- | 507 |
| 93 | X = Ser | HCA | 240 | Kd | -- | 507 |
| 94 | X = Thr | HCA | 53 | Kd | -- | 507 |
| 95 | X = Gly | HCA | 310 | Kd | -- | 507 |
| 96 | X = Ala | HCA | 120 | Kd | -- | 507 |
| 97 | X = Arg | HCA | 220 | Kd | -- | 507 |
| 98 | X = Pro | HCA | 230 | Kd | -- | 507 |
| 99 | X = Val | HCA | 15 | Kd | -- | 507 |
| 100 | X = Met | HCA | 10 | Kd | -- | 507 |
| 101 | X=lle | HCA | 9 | Kd | -- | 507 |
| 102 | X = Leu | HCA | 9 | Kd | -- | 507 |
| 103 | X = Phe | HCA | 13 | Kd | -- | 507 |
| 104 | X = L-PheGlyGlyO− | HCA | 21 | Kd | -- | 284 |
| 105 | X = L-PheGlyGlyOBn | HCA | 5.3 | Kd | -- | 284 |
| 106 | X = L-PhgGlyGlyOBn | HCA | 0.9 | Kd | -- | 284 |
| 107 | X = D-PheGlyGlyOBn | HCA | 36 | Kd | -- | 284 |
| 108 |  |
HCA | 4 | Kd | -- | 506 |
| 109 | HCA | 0.03 | Kd | -- | 189b | |
| 110 |  |
HCA | 0.23 | Kd | -- | 189b |
| 111 |  |
BCA | 91 | Kd | -- | 508 |
| 112 |  |
BCA | 59 | Kd | -- | 508 |
| 113 |  |
BCA | 53 | Kd | -- | 508 |
| Type: |  |
|||||
| 114 | X = OCH3 | HCA | 700 | Kd | 9.8 | 389 |
| 115 | X = OCH2CH3 | HCA | 610 | Kd | 9.6 | 389 |
| 116 | X = O(CH2)2CH3 | HCA | 365 | Kd | 9.7 | 389 |
| 117 | X = O(CH2)3CH3 | HCA | 113 | Kd | 9.6 | 389 |
| 118 | X = O(CH2)4CH3 | HCA | 138 | Kd | 9.9 | 389 |
| Type: |  |
|||||
| 119 | X = OCH3 | HCA | 39000 | Kd | 9.3 | 389 |
| 120 | X = OCH2CH3 | HCA | 16000 | Kd | 9.5 | 389 |
| 121 | X = O(CH2)2CH3 | HCA | 5200 | Kd | 9.7 | 389 |
| 122 | X = O(CH2)3CH3 | HCA | 1800 | Kd | 9.8 | 389 |
| 123 | X = O(CH2)4CH3 | HCA | 660 | Kd | 9.9 | 389 |
| Type: | ||||||
| 124 |  |
HCA | 23 | Ki | -- | 510 |
| 125 |  |
HCA | 25 | Ki | -- | 510 |
| 127 |  |
HCA | 18 | Ki | -- | 510 |
| 128 |  |
HCA | 16 | Ki | -- | 510 |
| 129 |  |
HCA | 12 | Ki | -- | 510 |
| 130 | HCA | 15 | Ki | -- | 510 | |
| 131 |  |
HCA | 15 | Ki | -- | 229 |
| 132 | HCA | 1000 | Ki | -- | 430 | |
| 133 |
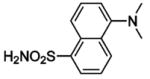
 (DNSA) (DNSA) |
HCA | 250 | Kd | 9.8 | 189,368,458 |
| 134 |  |
HCA | 300 | Kd | -- | 379 |
| 135 |  |
HCA | 220 | Kd | 9.7 | 458 |
| 136 |  |
HCA | 38 | Ki | -- | 232,233 |
| BCA | 1.0 | Ki | 7.5 | 366 | ||
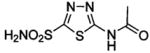
| 137 |  |
HCA | 12 | Ki | 7.4 | 232,233,521 |
| BCA | 7.6 | Ki | 7.5 | 366 | ||
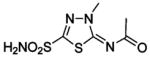
| 138 |  |
HCA | 14 | Ki | 7.4 | 232,233,521 |
| BCA | 7.6 | Ki | 7.5 | 366 | ||
| 139 | HCA | 9 | Ki | -- | 511 | |
| HCA | 8 | Ki | 8.0 | 232,233,521 | ||
| 140 | BCA | 0.2 | Ki | 7.5 | 366 | |
| 141 |  |
HCA | 11 | Ki | -- | 512 |
| 142 |  |
HCA | 2.3 | Kd | 8.1 | 517 |
| 143 | HCA | 3.0 | Ki | -- | 512 | |
| 144 | HCA | 1.2 | Kd | 9.2 | 518 | |
| 145 | HCA | 1.4 | Kd | 8.8 | 517 | |
| 146 | HCA | 0.46 | Kd | -- | 199 | |
| 147 | HCA | 0.49 | Kd | -- | 199 | |
| 148 | HCA | 0.83 | Kd | -- | 199 | |
| 149 | HCA | 4.0 | Ki | -- | 512 | |
| 150 | HCA | 2.7 | Kd | -- | 513 | |
| 151 | HCA | 1.1 | Kd | -- | 513 | |
| 152 |  |
HCA | 0.61 | Kd | -- | 514 |
| 153 |  |
HCA | 71 | Kd | -- | 514 |
| 154 |  |
HCA | 3.5 | Kd | 8.5 | 378 |
| 155 |  |
HCA | 1.5 | Ki | -- | 214 |
| 156 |  |
HCA | 1.9 | Ki | -- | 214 |
| 157 |  |
HCA | 0.37 | Ki | -- | 214 |
| 158 |  |
HCA | 0.20 | Kd | -- | 199 |
| 159 |  |
HCA | 0.16 | Kd | -- | 199 |
| 160 |  |
HCA | 0.32 | Kd | -- | 199 |
| 161 |  |
HCA | 0.13 | Kd | -- | 199 |
| 162 |  |
HCA | 0.10 | Kd | -- | 199 |
| 163 |  |
HCA | 0.10 | Kd | -- | 199 |
| 164 |  |
HCA | 1.7 | Kd | -- | 199 |
| 165 |  |
HCA | 0.13 | Kd | -- | 199 |
| 166 |  |
HCA | 1.2 | Kd | 8.5 | 509 |
| 167 |  |
HCA | 130 | Kd | -- | 458 |
| 168 | HCA | 2.9 | Kd | -- | 458 | |
| Type: |  |
|||||
| 169 | R = CH3 X = OH | BCA | 460 000 | Ki | -- | 519 |
| 170 | R = CH3 X = SH | BCA | 10 000 | Ki | -- | 519 |
| 171 | R = CH3 X = N3 | BCA | 45 000 | Ki | -- | 519 |
| 172 | R = CH3 X = NO | BCA | 24 000 | Ki | -- | 519 |
| 173 | R = CH3 X = NCS | BCA | 18 000 | Ki | -- | 519 |
| 174 | R = CH3 X = NHNH2 | BCA | 53000 | Ki | -- | 519 |
| 175 | R = CH3 X = NHOH | BCA | 9 000 | Ki | -- | 519 |
| 176 | R = CH3 X = NHOMe | BCA | 170 000 | Ki | -- | 519 |
| 177 | R = CH3 X = NHCl | BCA | 2 100 | Ki | -- | 519 |
| 178 | R = COOH X = NCl2 | BCA | 3 600 | Ki | -- | 519 |
| 179 | R = CH3 X = NHCN | BCA | 130 000 | Ki | -- | 519 |
| 180 | R = CH3 X = NHOCH2COO− | BCA | 85 000 | Ki | -- | 519 |
| 181 |  |
HCA | 0.8 | Ki | -- | 522 |
| 182 | HCA | 2 | Ki | -- | 520 | |
| 183 | BCA | 120 | Ki | 8.0 | 504 | |
| 184 |  |
BCA | 42 | Ki | 9.1 | 504 |
| 185 | BCA | 69 | Ki | 8.9 | 504 | |
| 186 |  |
HCA | 10 | Ki | -- | 523 |
| 187 |
 (RWJ) (RWJ) |
HCA | 36 | Ki | -- | 216 |
| 187a |  |
HCA | 5 | Ki | -- | 233 |
| 187b | 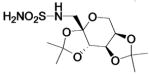 |
HCA | 2100 | Ki | -- | 232 |
| 188 | H2NO2S-CF3 | HCA | 2–13 | Ki | 6.3 | 505,528 |
| 189 | H2NO2S-CF3 | HCA | 70000–320000 | Ki | 10.8 | 505,528 |
| 190 | 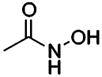 |
HCA | 47000 | Ki | -- | 200 |
| 191 | 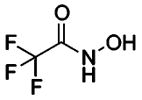 |
HCA | 3800 | Ki | -- | 200 |
| 192 | H2NSO3− | HCA | 390000 | Ki | -- | 413 |
| 192 | H2NSO3− | BCA | 390000 | Ki | -- | 519 |
| 193 | F− | BCA | 1.2 × 10⁹ | Ki | 3.2c | 157 |
| 194 | Cl− | BCA | 1.9 × 10⁸ | Ki | −7.0c | 157 |
| 195 | Br− | BCA | 6.6 × 10⁷ | Ki | −9.0c | 157 |
| 196 | l− | BCA | 8.7 × 10⁶ | Ki | −10.0c | 157 |
| 197 | HS− | BCA | 1.1 × 10⁴ | Ki | 7.0c | 157 |
| 198 | CN− | BCA | 2.6 × 10³ | Ki | 9.2c | 157 |
| 199 | N3− | BCA | 5.9 × 10⁵ | Ki | 4.7c | 157 |
| 200 | NCO− | BCA | 1.1 × 10⁵ | Ki | 3.5c | 157 |
| 201 | SCN− | BCA | 5.9 × 10⁵ | Ki | 0.9c | 157 |
| 202 | OAc− | BCA | 8.5 × 10⁷ | Ki | 4.7c | 157 |
| 203 | HCO3− | BCA | 2.6 × 10⁷ | Ki | 6.5c | 157 |
| 204 | NO3− | BCA | 4.8 × 10⁷ | Ki | −1.5c | 157 |
| 205 | ClO4− | BCA | 1.6 × 10⁷ | Ki | −10.0c | 157 |
| Type: | ||||||
| 207 | 2-fluoro | BCA | 230 | Kd | 9.6 | 182 |
| 208 | 3-fluoro | BCA | 75 | Kd | 9.7 | 182 |
| 209 | 4-fluoro | BCA | 590 | Kd | 10.0 | 182 |
| 210 | 2,6-difluoro | BCA | 190 | Kd | 9.1 | 182 |
| 211 | 3,5-difluoro | BCA | 57 | Kd | 9.4 | 182 |
| 212 | pentafluoro | BCA | 25 | Kd | 8.2 | 182 |
| Type: | ||||||
| 213 | BCA | 620 | Kd | -- | 415 | |
| 214 |  |
BCA | 300 | Kd | -- | 415 |
| 215 | BCA | 340 | Kd | -- | 415 | |
| 216 | BCA | 410 | Kd | -- | 415 | |
| 217 | BCA | 450 | Kd | -- | 415 | |
| 218 | HCA | 27 | Kd | -- | 181 | |
| 219 | 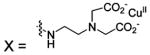 |
HCA | 28 | Kd | -- | 181 |
| 227 |  |
BCA | 1738 | Ki | 7.5 | 366 |
| 228 |  |
BCA | 93 | Ki | 7.5 | 366 |
| 229 | BCA | 1.4 | Ki | 7.5 | 366 | |
| 278 |  |
HCA | 35 | Ki | -- | 231 |
| 279 | H2NO2S-NH2 | BCA | 1.1 × 10⁶ | Ki | 10.9 | 227,519 |
| 280 | H2NO2S-NHOH | HCA | 570 | Ki | 13.9 | 227 |
| 281 | 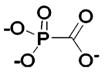 |
HCA | 1.4 × 10⁷ | Ki | -- | 225 |
Values of Kd were determined either by fluorescence titration (directly or with DNSA as the competitor) or by calorimetry; values of Ki were determined by monitoring the hydratase (pH) or esterase (cleavage of p-nitrophenyl acetate) activity of CA II as a function of added ligand.
Note that the structures are accidentally switched in the original paper.189
Value is the pKa of the conjugate acid.
CA is involved in the extracellular acidification required for bone resorption at the osteoclast–bone interface.109,110 Defective bone resorption and a general failure of bone remodeling characterize osteopetrosis, a rare disease that produces dense, brittle bone and can be caused by a hereditary deficiency in HCA II.111 Inhibition of CA has been shown to reduce bone loss in postmenopausal osteoporosis, a disease in which bones become extremely porous, are subject to fracture, and heal slowly.112
CA provides bicarbonate as a substrate for a variety of enzyme-catalyzed carboxylation reactions. Gluconeogenesis requires mitochondrial CA V to provide bicarbonate for pyruvate carboxylase, a key enzyme that replenishes intermediates in the synthesis of fatty acids, amino acids, neurotransmitters, and porphyrins. Inhibition of CA V can reduce gluconeogenesis,113,114 ureagenesis, and lipogenesis.115,116 Inhibitors of CA are used to treat acute mountain sickness,117,118 to improve the arterial oxygenation of patients suffering from chronic obstructive pulmonary disease (COPD),119,120 and as antimicrobial agents.121
Supuran, Chegwidden, and others have recently observed that inhibitors of carbonic anhydrase inhibit the growth of several types of tumors in cell culture and in vivo.10,122–128 In addition, some isozymes of CA (in particular CA IX) and CA-related proteins are overexpressed in tumors.129–135 The exact connection between carbonic anhydrase and cancer is currently under investigation. For example, HCA IX is responsible for the hypoxia-induced acidification of the extracellular environment of hypoxic tumor cells.88 Acidification (due to the activity of overexpressed HCA II, IX, or XII) increases the invasive behavior of cancer cells.136 Acetazolamide decreases both the acidification around and the invasiveness of certain cancer cells.88,136 Several sulfonamides are currently being tested clinically for their effects on tumor suppression.137,138
II. Structure and Structure–Function Relationships of CA
4. Global and Active-Site Structure
4.1. Structure of Isoforms
The CAs are ubiquitous throughout nature and are expressed in eukaryotes (e.g., animals and plants), eubacteria, and archaea. CAs are divided into at least three classes based on amino acid homology: (i) α-CAs from animals (all mammalian CAs), plants, eubacteria, and viruses; (ii) β-CAs from plants, bacteria, and animals (e.g., C. elegans); and (iii) γ-CAs from bacteria and plants.139,140 There are two other possible classes of CA: (i) δ-CA TWCA1 from a marine diatom, Thalassiosira weissflogii, which is possibly a homolog of α-CAs;141,142 and (ii) ε-CAs from bacteria, which probably represent a subclass of β-CA that has diverged such that only one of its two domains has retained a viable active site.143,144 This review covers only the α-CAs because they are the most thoroughly studied and are the only class present in humans. There are at least 16 members of the α-CA family: CA I, II, III, IV, VA, VB, VI, VII, VIII, IX, X, XI, XII, XIII, XIV, and XV.26,145,146 They have wide-ranging cellular localizations: cytosolic (CA I, II, III, VII, and XIII), membrane-bound (CA IV, IX, XII, XIV, and XV), mitochondrial (CA VA and VB), and salivary secretions (CA VI).145,146
We focus on HCA I, HCA II, and bovine carbonic anhydrase II (BCA II) because they are soluble, monomeric, of relatively low molecular weight (~30 kDa), and extremely well-characterized biophysically. There is a wealth of structural information available on HCA I and HCA II (Figure 2); this information makes them particularly well-suited for biophysical studies. While BCA II is not as well-characterized structurally as HCA I and HCA II (only two crystal structures are available for BCA II147), these structures, and the high degree of sequence homology between BCA II, HCA I, and HCA II (Figure 3), suggest a very similar global and active site architecture of these isoforms. BCA II is the least expensive pure commercial variant of CA and often the one used in physical-organic studies.
Figure 2.

Ribbon rendering of HCA II from two perspectives, with α-helices in red and β-sheets in blue. The N- and C-termini, the C-terminal knot, and the primary residues involved in the initiation of folding and of coordinating the ZnII cofactor are indicated.
Figure 3.
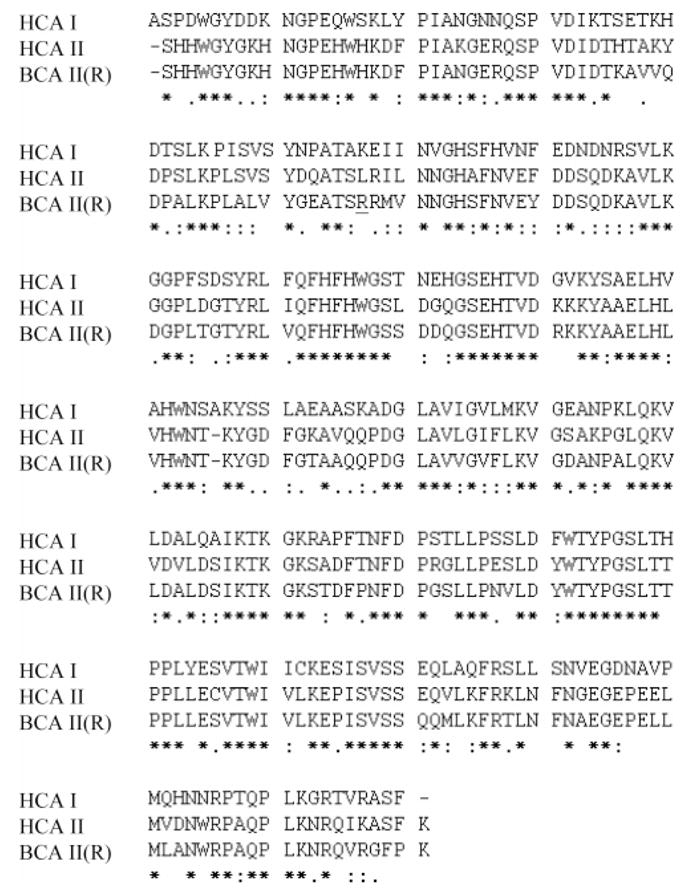
Amino acid sequences of HCA I, HCA II, and BCA II. Sequence homology is denoted by the symbols “*”, “:”, and “.”; “*” represents identical residues, “:” represents charge/polarity conserved residues, and “.” denotes polarity conserved residues. BCA II exists as two variants: an “R” form (shown here), where residue 56 exists as an Arg, and a “Q” form, where it exists as Gln. This residue is underlined above.
An overlay of crystal structures of these isoforms shows their high structural homology (Figure 4). The extensive homology in amino acid sequence between these isoforms is the basis for their similar physical properties and number and types of chemically reactive side chains (Table 2).148–150 Details of the active site, as well as changes in the structures of HCA I and HCA II (and by extension BCA II) upon binding of ligands, are known from many structural studies by X-ray crystallography. In addition, numerous complexes of CA with bound inhibitors have been characterized structurally, thermodynamically, and kinetically. We discuss these topics in sections 9–11.
Figure 4.
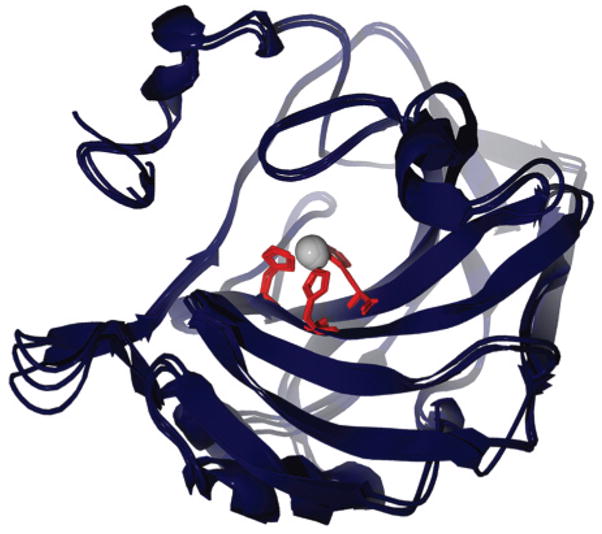
Overlay of X-ray structures of HCA I, HCA II, and BCA II, with His residues in the active site highlighted. This image was rendered using POV-Ray 3.5 (www.povray.org). The accession numbers from the protein data bank (PDB) for the rendered structures are 2CAB (HCA I), 2CBA (HCA II), and 1V9E (BCA II).147,184,239
Table 2.
Abundance of Reactive Amino Acid Side Chains in HCA I, HCA II, and BCA II
| HCA I | HCA II | BCA II (R)a | BCA II (Q)a | |||||
|---|---|---|---|---|---|---|---|---|
| Mb (g mol−1) | 28 846.4 | 29 227.9 | 29 089.9 | 29 061.9 | ||||
| ε280c (M−1 cm−1) | 47 000 | 54 700 | 55 300 | 55 200 | ||||
| pId | 6.60 | 7.40 | 5.90 | 5.40 | ||||
| amino terminus | NHCOCH3 | NHCOCH3 | NHCOCH3 | NHCOCH3 | ||||
| carboxy terminus |
|
|
|
|
||||
| no. of amino acids | 260 | 259 | 259 | 259 | ||||
| modifiable groups:e | ||||||||
| Lys | 18 | 24 | 18 | 18 | ||||
| Arg | 7 | 7 | 9 | 8 | ||||
| His | 11 | 12 | 11 | 11 | ||||
| Asp/Glu | 27 | 32 | 30 | 30 | ||||
| Cys | 1 | 1 | 0 | 0 | ||||
| Tyr | 8 | 8 | 8 | 8 | ||||
| Ser | 30 | 18 | 16 | 16 | ||||
| Thr | 14 | 12 | 14 | 14 | ||||
| Trp | 6 | 7 | 7 | 7 | ||||
| Phe | 11 | 12 | 11 | 11 | ||||
R or Q variant at position 56.
Average isotopic mass calculated from the primary sequence (with ZnII and with post-translational modifications) with all residues in their neutral (un-ionized) forms.
Nyman and Lindskog reported the extinction coefficients at 280 nm (in units of L g−1 cm−1) to be 1.63 for HCA I, 1.87 for HCA II, and 1.90 for BCA II (assuming that M = 30 000 g mol−1, ε280 would be 48 900 for HCA I, 56 100 for HCA II, and 57 000 for BCA II).148 The values reported here use the extinction coefficients from Nyman and Lindskog together with the values of M in this table.
Values of pI were from Sigma Aldrich, Inc. (http://www.sigmaaldrich.com). These data agree with those of Funakoshi and Deutsch (pI = 6.57 for HCA I, pI = 7.36 for HCA II)149 and Jonsson and Pettersson (pI = 5.9 for BCA II).150
Data from Swiss Prot (http://au.expasy.org/sprot/).
4.2. Isolation and Purification
Methods for isolating and purifying CA are well-established and widely accessible. Commercial sources usually isolate isozymes HCA I, HCA II, and BCA II from red blood cells, in which CA is the second most abundant protein after hemoglobin. Academic laboratories typically produce HCA II and BCA II by recombinant technology in E. coli;151,152 this method provides the structural flexibility and specificity of site-directed mutagenesis, which is useful for biophysical and biochemical studies. The blood protein and the wild-type recombinant construct are identical except for the N-terminus, which is a post-translationally acetylated Ser in the native CA and exists as Met-Ala or Ala in the recombinant version.153
The laboratory procedure for the purification of HCA from red blood cells involves lysis of the cells and removal of the cellular remnants by centrifugation, followed by separation of hemoglobin from HCA on a sulfonamide-modified agarose affinity column.154,155 Divalent anions (e.g., sulfate in 0.1 M tris-SO4/0.2 M Na2SO4, pH 9.0 buffer) do not bind appreciably in the active site of HCA, and thus, they are used to remove nonspecifically bound protein by screening ionic interactions. The two isozymes of HCA can then be eluted consecutively from the column. HCA I, which has a higher dissociation constant for sulfonamides than HCA II, is eluted with tris-SO4 buffer containing 0.2 M KI; HCA II elutes with tris-SO4 buffer containing 0.4 M NaN3. Osborne and Tashian showed that CA isozymes from other species can be purified in a similar way, with only minor modifications.154 Commercial suppliers do not use the chromatographic methods, but their exact procedures are proprietary.
The purification of recombinant protein proceeds in a similar manner, with cell lysis, DNA digestion by DNase, and centrifugation as the initial steps. CA can then be purified by affinity chromatography, as described above, with only one isozyme present in the lysate. Fierke and co-workers developed another procedure for purifying recombinant HCA II and its less active mutants.46,153,156 The procedure consists of the following: (i) agarose-based, cation-exchange column chromatography and (ii) gel filtration column chromatography. The latter procedure eliminates the need for extensive dialysis to remove the azide ions used for elution in affinity chromatography. These procedures routinely produce HCA II at >90% purity, as determined by SDS-PAGE;156 these purities are high enough for crystallization for X-ray diffraction.
4.3. Crystallization
The limiting factor in the ability to solve three-dimensional structures by single-crystal X-ray diffraction analysis is the growth of protein crystals. Because of the large number of crystal structures solved for CA and its excellent stability under standard laboratory conditions, methods for growing diffraction-quality crystals of CA and complexes of CA with bound inhibitor are well-developed.
One typically uses the hanging-drop or sitting-drop method to crystallize HCA II. These methods involve combining a drop of a solution of the protein, methyl mercuric acetate (MMA), and tris-sulfate with a precipitant buffer of ammonium sulfate and tris-sulfate. The pH used in the buffer depends on the desired conditions and has been reported in the range of 4.7–10 (see Table 4). Sodium azide is sometimes added to the drop and the precipitant buffer in order to prevent microbial growth. Azide (199) is a weak inhibitor of CA (Ki) 0.59 mM with BCA II), and so interpretations of electron density cannot ignore the possibility of binding of azide or the competition of azide with other weakly bound ligands (see section 9.2.5).157 The mercury from MMA coordinates to the Cys206 residue in HCA II,158 prevents aggregation of the crystals, and facilitates the growth of diffraction-quality crystals that grow faster and to a larger size than crystals grown in the absence of MMA.159 Although the mercury does not perturb the structure of the enzyme (beyond a conformational change of the side chain of Cys206), it can be removed from the sample by dialyzing the crystals against cysteine and ammonium sulfate for 3 days, or by treatment of the crystals with 2-mercap-toethanol.158,159 When preparing enzyme–inhibitor complexes, the CA crystals may be cross-linked by adding a solution of glutaraldehyde, ammonium sulfate, and tris-sulfate to the hanging drop, followed by solution of the inhibitor. BCA II has been crystallized simply in tris buffer, pH 7.5, with 2.4 M ammonium sulfate as precipitant, without the necessity for engineered cysteine residues and MMA.147
Table 4.
X-ray Crystal Structures of Native Carbonic Anhydrases of Human Origin
| Compound | Complexed Ligand/Metal Substitute | Isoform | pH | PDB ID | Res (Å) | Ref. |
|---|---|---|---|---|---|---|
| Apoa | HCA II | 8.0 | 2CBE | 1.82 | 184 | |
| — | HCA I | 2CAB | 2.0 | 239 | ||
| — | HCA II | 7.8 | 2ILI | 1.05 | 54 | |
| — | HCA II | 1 CA2 | 2.0 | 240 | ||
| — | HCA II | 7.8 | 2CBA | 1..54 | 184 | |
| — | HCA II | 6.0 | 2CBB | 1.67 | 184 | |
| — | HCA II | 7.0 | 1TBT | 2.00 | 183 | |
| — (OH−) | HCA II | 9.0 | 1TEQ | 2.00 | 183 | |
| — | HCA II | 10.0 | 1TEU | 2.00 | 183 | |
| — | HCA IIb | 8..5 | 1XEV | 2.20 | n/ac | |
| — | d-HCA II d | 7..5 | 2AX2 | 1..50 | 241 | |
| — | HCA III e | 8.0 | 1Z93 | 2.10 | 242 | |
| Type: | ||||||
| 282 | R=(CH2)2NH3+ | HCA II | 7.7 | 2NNG | 1.20 | 234 |
| 283 | R=(CH2)2NHCOCH3 | HCA II | 7.7 | 2NNS | 1.03 | 234 |
| HCA I | 7.0 | 2NMX | 1.55 | |||
| 284 | R=(CH2)2CO2− | HCA II | 7.7 | 2NNO | 1.01 | 234 |
| HCA I | 7.0 | 2NN1 | 1.65 | |||
| 285 | R=(CH2)2CO2CH2CH3 | HCA II | 7.7 | 2NNV | 1.10 | 234 |
| HCA I | 7.0 | 2NN7 | .85 | |||
| 131 |  |
HCA II | 8.2 | n/a | 1.9 | 229 |
| 292 |  |
HCA II | 7.7 | 2Q1Q | 1.90 | 238 |
| 230 |  |
HCA II | 8.2 | 1OQ5 | 1.50 | 204 |
| 231 |  |
HCA II | 8.4 | 2AW1 | 1.46 | 205 |
| 232 | HCA II | 8.5 | 2F14 | 1.71 | 206 | |
| 233, 205 |  |
HCA II | 8.5 | 1ZE8 | 2.00 | 207 |
| 234 |
|
HCA II | 7.7 | 2FOQ | 1.25 | 181 |
| 235 |
|
HCA II | 7.7 | 2FOU | 0.99 | 181 |
| Type: | ||||||
| 51 | 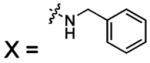 |
HCA II | 8.0 | n/a | 2.3 | 202 |
| 55 | 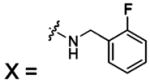 |
HCA II | 8.0 | 1G1D | 2.04 | 180 |
| 56 | 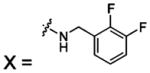 |
HCA II | 8.0 | 1G52 | 1.80 | 180 |
| 57 | 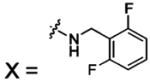 |
HCA II | 8.0 | 1G53 | 1.94 | 180 |
| 58 |  |
HCA II | 8.0 | 1G54 | 1.86 | 180 |
| 277 |  |
HCA II | 8.0 | n/a | 2.0 | 202 |
| 70 |  |
HCA II | 8.0 | n/a | 2.4 | 202 |
| 83 | HCA II | 1CNX | 1.90 | 185 | ||
| 84 | HCA II | 1CNW | 2.00 | 185 | ||
| Type: | ||||||
| 85 |  |
HCA II | 1CNY | 2.30 | 185 | |
| 109 |  |
HCA II | 8.0 | 1IF7 | 1.98 | 189 |
| 110 |  |
HCA II | 8.0 | 1IF8 | 1.94 | 189 |
| 236 |  |
HCA II | 8.0 | 1IF9 | 2.00 | 189 |
| 237 | HCA II | 1OKM | 2.20 | 208 | ||
| 238 | HCA II | 1OKN | 2.40 | 208 | ||
| 218 |
|
HCA II | 7.7 | 2FOS | 1.10 | 181 |
| 219 |
 (BR30) (BR30) |
HCA II | 7.7 | 2FOV | 1.15 | 181 |
| HCA I | 6.4 | 2FOY | 1.55 | 181 | ||
| Type: | ||||||
| 239 |  |
HCA II | 8.2 | 2HD6 | 1.80 | 209 |
| 240 |  |
HCA II | 8.0 | 1ZFK | 1.56 | n/ac |
| 241 |  |
HCA II | 8.0 | 1ZH9 | 1.70 | n/ac |
| 287 |  |
HCA II | 8.4 | 2HL4 | 1.55 | 235 |
| Type: | ||||||
| 207 | 4-fluoro | HCA II | 8.0 | 1IF4 | 1.93 | 182 |
| 210 | 2,6-difluoro | HCA II | 8.0 | 1IF5 | 2.00 | 182 |
| 211 | 3,5-difluoro | HCA II | 8.0 | 1IF6 | 2.09 | 182 |
| 133 |
 (DNSA) (DNSA) |
HCA II | 1OKL | 2.10 | 203 | |
| 137 |
 (acetazolamide, AZM) (acetazolamide, AZM) |
HCA I | 1AZM | 2.00 | 211 | |
| HCA XII | 4.8 | 1JDO | 1.50 | 210 | ||
| 138 |
 (methazolamide) (methazolamide) |
HCA I | 1BZM | 2.00 | 211 | |
| 242 |  |
HCA II | 8.2 | 2HOC | 2.10 | 212 |
| 243 |  |
HCA II | 8.2 | 2HNC | 1.55 | 212 |
| 244 |  |
HCA II | 8.0 | 2EU3 | 1.60 | 213 |
| 245 |  |
HCA II | 8.0 | 2EU2 | 1.15 | 213 |
| 246 | HCA II | 8.0 | 1ZFQ | 1.55 | n/ac | |
| 146 | HCA II | 10.0 | 1BN1 | 2.10 | 199 | |
| 147 | HCA II | 10.0 | 1BN4 | 2.10 | 199 | |
| 148 | HCA II | 10.0 | 1BNW | 2.25 | 199 | |
| 155 |  |
HCA II | 1CIM | 2.10 | 214 | |
| 156 |  |
HCA II | 1CIN | 2.10 | 214 | |
| 157 |  |
HCA II | 1CIL | 1.60 | 214 | |
| 158 |  |
HCA II | 10.0 | 1BNU | 2.15 | 199 |
| 159 |  |
HCA II | 10.0 | 1BNT | 2.15 | 199 |
| 160 | 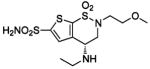 |
HCA II | 10.0 | 1BNQ | 2.40 | 199 |
| 161 |
 (brinzolamide) (brinzolamide) |
HCA II | 8.0 | 1A42 | 2.25 | 162 |
| 247 |  |
HCA II | 8.0 | 1190 | 2.00 | 215 |
| 162 |  |
HCA II | 10.0 | 1BNN | 2.30 | 199 |
| 163 |  |
HCA II | 10.0 | 1BNM | 2.60 | 199 |
| 164 |  |
HCA II | 10.0 | 1BNV | 2.40 | 199 |
| 165 |  |
HCA II | 10.0 | 1BN3 | 2.20 | 199 |
| 248 |  |
HCA II | 8.0 | 1I8Z | 1.93 | 215 |
| 249 |  |
HCA II | 8.0 | 1I91 | 2.00 | 215 |
| 186 |
 (EMATE) (EMATE) |
HCA II | 8.2 | n/a | 1.5 | 230 |
| 186a |  |
HCA II | 8.5 | 2GD8 | 1.46 | 128 |
| 187 |
 (RWJ-37947) (RWJ-37947) |
HCA II | 8.8 | 1EOU | 2.10 | 216 |
| 187a |
 (topiramate) (topiramate) |
HCA II | 8.2 | n/a | 1.8 | 233 |
| 187b |  |
HCA II | 7.7–7.8 | 2H15 | 1.9 | 232 |
| 250 |
 (667-coumate) (667-coumate) |
HCA II | 8.0 | 1TTM | 1.95 | 217 |
| 251 |  |
HCA II | 8.0 | 1XPZ | 2.02 | 218 |
| 252 |  |
HCA II | 8.0 | 1XQO | 1.76 | 218 |
| 253 |  |
HCA II | 3CA2 | 2.00 | 186 | |
| HCA I | 1CZM | 2.00 | 211 | |||
| 254 |  |
HCA II | 8.5 | 1KWR | 2.25 | 219 |
| 255 |  |
HCA II | 8.0 | 1KWQ | 2.60 | 219 |
| 256 |  |
HCA II | 8.0 | 1Z9Y | 1.66 | n/ac |
| 257 |  |
HCA II | 8.0 | 1ZGF | 1.75 | n/ac |
| 258 |  |
HCA II | 8.0 | 1ZGE | 1.65 | n/ac |
| 288 |  |
HCA II | 8.2 | 2POU | 1.60 | 236 |
| 289 | 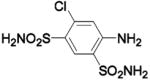 |
HCA II | 8.2 | 2POV | 1.60 | 236 |
| 290 | 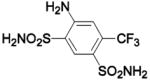 |
HCA II | 8.2 | 2POW | 1.75 | 236 |
| 291 |
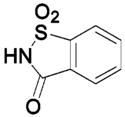 (saccharin) (saccharin) |
HCA II | 8.5 | 2Q1B | 1.70 | 237 |
| 8.0 | 2Q38 | 1.95 | 237 | |||
| 278 |
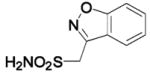 (zonisamide) (zonisamide) |
HCA II | 8.2 | n/a | 1.70 | 231 |
| Type: | Organic Small Molecules | |||||
| 188 | H2NO2S-CF3 | HCA II | 8.5 | 1BCD | 1.90 | 201 |
| 192 | H2NO2S-O− | HCA II | 8.2 | n/a | 1.4 | 228 |
| 279 | H2NO2S-NH2 | HCA II | 8.2 | n/a | 1.6 | 228 |
| 280 | H2NO2S-NHOH | HCA II | 7.8 | 2O4Z | 2.1 | 227 |
| 281 | 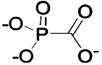 |
HCA I | 9.0 | 2IT4 | 2.0 | 225 |
| 190 | 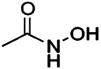 |
HCA II | 8.0 | 1AM6 | 2.10 | 200 |
| 259 | 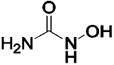 |
HCA II | 7.7 | 2GEH | 2.00 | 220 |
| 260 | HCOOHf | HCA II | 2CBC | 1.88 | 184 | |
| 261 | CH3COO− | HCA II | 8.5 | 1XEG | 1.81 | n/ac |
| 262 | CH3COOHf | HCA II | 8.5 | 1C AY | 2.10 | 179 |
| 262 | CH3COOH | HCA XII | 4.8 | 1JCZ | 1.55 | 210 |
| 263 | 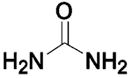 |
HCA II | 7.7 | 1BV3 | 1.85 | 45 |
| 264 | H2N-CN | HCA II | 7.7 | 1F2W | 1.90 | 221 |
| 265 |  |
HCA II | 1CRA | 1.90 | 222 | |
| 266 | L-Histidine g | HCAI | 9.0 | 2FW4 | 2.00 | 191 |
| HCAII | 7.7 | 2ABE | 2.00 | 190 | ||
| 267 | D-Histidine g | HCA II | 7.7 | 2EZ7 | 2.00 | 192 |
| 268 | L-Phenylalanine g | HCA II | 7.7 | 2FMG | 1.60 | 193 |
| 269 | D-Phenylalanine g | HCA II | 7.7 | 2FMZ | 1.60 | 193 |
| 199, 270 | N3− Histamine g | HCA II | 7.7 | 1AVN | 2.00 | 194 |
| 286 | L-Adrenalineg | HCA II | 7.7 | 2HKK | 1.90 | 226 |
| Type: | Inorganic Anions | |||||
| 194 | Cl−f | HCA II | 6.1 | 1TBO | 2.00 | 183 |
| 194 | Cl−f | HCA II | 7.8 | 1TES | 2.00 | 183 |
| 194 | Cl−/HgII | HCA I | 1CRM | 2.00 | 223 | |
| 195 | Br− | HCA II | 8.5 | 1RAZ | 1.90 | 195 |
| 196 | I− | HCA I | 1HUH | 2.20 | 196 | |
| 197 | HS− | HCA II | 8.5 | 1CAO | 1.90 | 197 |
| 199 | N3− | HCA II | 8.5 | 1RAY | 1.80 | 195 |
| 201 | SCN− | HCA II | 2CA2 | 1.90 | 186 | |
| 203 | HCO3− | HCA I | 1HCB | 1.60 | 198 | |
| 203 | HCO3−/CoII | HCA II | 8.0 | 1CAH | 1.88 | 188 |
| 204 | NO3− | HCA II | 1CAN | 1.90 | 197 | |
| 271 | HSO3− | HCA II | 2CBD | 1.67 | 184 | |
| 272 | SO42− | HCA II | 5.1 | 1T9N | 2.00 | 183 |
| 272 | SO42−/CoII | HCA II | 8.5 | 1RZB | 1.80 | 187 |
| 272 | SO42−/MnII | HCA II | 8.5 | 1RZD | 1.90 | 187 |
| 272 | SO42−/NiII | HCA II | 8.5 | 1RZE | 1.90 | 187 |
| 272 | 2 SO42−/2 ZnII | HCA IV | 5.1 | 1ZNC | 2.80 | 224 |
| 273 | 02/CoII | HCA II | 8.5 | 1RZA | 1.90 | 187 |
| 273 | 02/Cu11 | HCA II | 8.5 | 1RZC | 1.90 | 187 |
| 274 | Au(CN)2−f | HCA I | 1HUG | 2.00 | 196 | |
The active site is free in this structure.
New crystal form.
Not published.
Perdeuterated HCA II.
Mutations C183S and C188S (opposite the active site) were made to enhance crystallization and did not affect catalysis.
The species is located in or near the active site but does not directly complex the metal.
CA activator.
4.4. Structures Determined by X-ray Crystallography and NMR
4.4.1. Structures Determined by X-ray Crystallography
X-ray structural analysis has established the structure of wild-type CA, with and without bound inhibitors. The environment of the catalytic ZnII ion in the active site and how inhibitors interact with this ion and with the adjacent amino acid residues are well-established. X-ray crystallography has also demonstrated how site-specific mutations affect the local and global structures of CA. These mutant structures have been used to infer the mechanism of binding and catalysis for the wild-type (w.t.) enzyme.
As of December 2007, there were 279 X-ray structures of CA in the Protein Data Bank (PDB);160 of these, 245 were isoforms of HCA. HCA II, with 221 structures, is by far the most commonly studied (unless otherwise stated, this review numbers residues according to the structure of HCA II). Structures for CAs from several non-human species also exist (Table 3).144,147,161–178 Considering the widespread usage of the relatively inexpensive BCA II, it is surprising that there exists only one high-resolution crystal structure for BCA II (PDB accession number 1V9E, at 1.95 Å resolution)147 and one structure for the Gln253Cys mutant of this enzyme (1V9I, 2.95 Å).
Table 3.
X-ray Crystal Structures for CA of Non-Human Species
| Species | Common name | CA isoform | CA class | PDB ID(s)a | Res (Å) | Ref |
|---|---|---|---|---|---|---|
| Bos Taurus | cow | II | α | 1V9E, 1V9Ib,c | 1.95–2.95 | 147 |
| III | α | n/a | 2.0 | 161 | ||
| Mus musculus | mouse | IV | α | 2ZNC, 3ZNCd | 2.80 | 162 |
| V | α | 1DMX, 1DMY, 1KEQ, 1URT | 1.88–2.8 | 163–165 | ||
| V–MIf | α | n/a | 1.88 | 164 | ||
| XIVe | α | 1RJ5, 1RJ6g | 2.81–2.9 | 166 | ||
| Rattus norvegicus | rat | III | α | 1FLJ | 1.80 | 167 |
| Neisseria gonorrheae | gonorrhea | α | 1KOP, 1KOQ | 1.90 | 168 | |
| Dunaliella salina | green alga | II | α | 1Y7W | 1.86 | 169 |
| Porphyridium purpureum | red alga | β | 1DDZ | 2.20 | 170 | |
| Pisum sativum | pea | β | 1EKJ | 1.93 | 171 | |
| Escherichia coli | E. Coli | β | 1I6O, 1I6P, 2ESF, 1T75c | 2.00–2.5 | 172, 173 | |
| Mycobacterium tuberculosis | M. tuberculosis | Rv3588c | β | 1YM3, 2A5V | 1.75–2.2 | 174, 175 |
| Rv1284 | β | 1YLK | 2.0 | 175 | ||
| Haemophilus influenzae | β | 2A8C, 2A8D | 2.20–2.3 | 173 | ||
| Halothiobacillus neapolitanus | CsoSCA | β | 2FGY | 2.20 | 144 | |
| Methanobacterium thermoautotrophicum | β | 1G5C | 2.10 | 176 | ||
| Methanosarcina thermophila | γ | 1QQ0, 1QRE, 1QRF, 1QRG, 1QRL, 1QRM, 1THJ | 1.46–2.8 | 177, 178 |
The structure with the highest resolution is bold.
1V9I is a site-specific mutant (Gln253Cys) of BCA II.
Not published: 1V9I, 1T75.
3ZNC is complexed with brinzolamide (161).
Extracellular domain.
This isoform is a double mutant (Phe65Ala, Tyr131Cys) of MCA V in which the introduced Cys residue was modified with 4-chloromethylimidazole to introduce a methylimidazole (MI) group.164
1RJ6 is complexed with acetazolamide (137).
Studies using inhibitors and mutations have motivated the majority of crystal structures of HCA I and II. The resolution of most of these structures is in the range of 2.0 ± 0.5 Å, which is adequate for modeling the interactions of the inhibitors in and around the active site, as well as for observing the effects of mutations on structure. X-ray structures of both native and mutant isozymes of HCA provide useful information on how inhibitors bind in the active site and at nearby hydrophobic sites (see section 4.6). Table 4 lists all of the structures in the PDB of native HCA with45,128,162,179–238 and without54,183,184,239–242 bound ligands. Table 5 lists the structures of mutant HCAs and the motivation for constructing each mutation.153,156,158,179,180,183,242–268
Table 5.
X-ray Crystal Structures of Mutant Carbonic Anhydrases of Human Origin
| Isoform | Mutation | Engineereda | Complex;Metal (non-ZnII) | PDB ID | Res. (Å) | pH | Ref | |
|---|---|---|---|---|---|---|---|---|
| Hydrophobic Pocket and Wall | ||||||||
| HCA II | V121A | widens hydrophobic pocket | 12CA | 2.40 | 153 | |||
| HCA II | V143F | hydrophobic pocket depth affects catalytic activity | 6CA2 | 2.50 | 158 | |||
| HCA II | V143G | idem | 7CA2 | 2.40 | 158 | |||
| HCA II | V143H | idem | 8CA2 | 2.40 | 158 | |||
| HCA II | V143Y | idem | 9CA2 | 2.80 | 158 | |||
| HCA II | L198R | altered mouth of hydrophobic pocket, catalytic efficiency | 1HEA | 2.00 | 253 | |||
| HCA II | L198E | idem | 1HEB | 2.00 | 253 | |||
| HCA II | L198H | idem | 1HEC | 2.00 | 253 | |||
| HCA II | L198A | idem | 1HED | 2.00 | 253 | |||
| HCA II | L198E | side-chain mobility, charge and hydrophobicity affect substrate affinity | AZMb | 1YDA | 2.10 | 254 | ||
| HCA II | L198R | idem | AZMb | 1YDD | 2.10 | 254 | ||
| HCA II | L198F | idem/HCA III mimic | AZMb | 1YDB | 1.90 | 254 | ||
| HCA II | L198F | idem/idem | 1YDC | 1.95 | 254 | |||
| HCA III | F198Lc | increased catalytic activity/HCA II mimic | 1Z97 | 2.10 | 242 | |||
| HCA II | F131V | electrostatics of ligand benzyl/Phe131 interaction | sulfamoyl benzamidesd | see belowd | 1.8–1.96d | 180 | ||
| HCA II | F131V | intermolecular interactions between bound ligands | sulfamoyl benzamidese | see belowe | 1.8–1.93e | 249 | ||
| HCA II | P202A | decreased folded-state stability, maintained activity | 1MUA | 1.70 | 255 | |||
| Direct and Indirect Ligands of ZnII | ||||||||
| HCA II | T200H | HCA I mimic | HCO3 | 1BIC | 1.90 | 256 | ||
| HCA II | T200S | increased esterase activity | 5CA2 | 2.10 | 257 | |||
| HCA II | T199C | tight Zn binder, engineered Zn coordination polyhedron | 1DCA/1DCB | 2.20/2.10 | 244 | |||
| HCA II | T199D | fM ZnII binder; fourth ZnII ligand | 1CCS | 2.35 | 243 | |||
| HCA II | T199E | idem | 1CCT | 2.20 | 243 | |||
| HCA II | T199H | weak ZnII binder |
|
1CCU | 2.25 | 243 | ||
| HCA II | T199P, C206S | novel binding interactions: ZnII-bound sulfur of ligand | 2-ME | 1LG5 | 1.75 | 258 | ||
| HCA II | idem | tetrahedrally coordinated SCN− binding to ZnII | SCN− | 1LG6 | 2.20 | 258 | ||
| HCA II | idem | new bicarbonate binding site | HCO3 | 1LGD | 1.90 | 258 | ||
| HCA II | T199V | disrupts zinc OH-T199-E106 hydrogen bond network |
|
1CVA/1CVB | 2.25/2.40 | 156 | ||
| HCA II | T199A | idem | none/HCO3 | 1CAL/1CAM | 2.20/1.70 | 247 | ||
| HCA II | E106A | idem |
|
1CAI | 1.80 | 247 | ||
| HCA II | E106D | alters ZnII-OH-T199-E106 hydrogen bond network |
|
1CAJ | 1.90 | 247 | ||
| HCA II | E106Q | idem |
|
1CAK | 1.90 | 247 | ||
| HCA II | E106Q | alters hydrogen bond network and ligand binding | acetic acid | 1CAZ | 1.90 | 179 | ||
| HCA II | H94C | engineering ZnII affinity, discrimination, functionality | apo | 1HVA | 2.30 | 250 | ||
| HCA II | H94A | metal-binding site plasticity | apo | 1CVF | 2.25 | 245 | ||
| HCA II | H94C | idem | 2-ME; apo | 1CNB | 2.35 | 245 | ||
| HCA II | H94C | idem | 1CNC | 2.20 | 245 | |||
| HCA II | H119C | idem | 1CVD | 2.20 | 245 | |||
| HCA II | H119D | idem | 1CVE | 2.25 | 245 | |||
| HCA II | H96C | idem | 1CVH | 2.30 | 245 | |||
| HCA II | H94D | redesigned ZnII binding site | 1CVC | 2.30 | 246 | |||
| HCA II | H94N | electrostatic effects on ZnII binding affinity, coordination | tris (buffer)/AZMb | 1H4N/2H4N | 2.00/1.90 | 259 | ||
| HCA II | H119N | idem | 1H9N | 1.85 | 259 | |||
| HCA II | H119Q | idem | 1H9Q | 2.20 | 259 | |||
| HCA II | E117Q | indirect ligand increases ZnII complexation kinetics | apo | 1ZSA | 2.50 | 252 | ||
| HCA II | E117Q | idem/decreases ligand affinity | AZMb | 1ZSB | 2.00 | 252 | ||
| HCA II | E117Q | idem/decreases catalytic activity | 1ZSC | 1.80 | 252 | |||
| HCA II | E117A | indirect ligand–metal network | Cl− | 1CNG | 1.90 | 248 | ||
| HCA II | Q92E | idem | 1CNH | 2.05 | 248 | |||
| HCA II | Q92A | idem | 1CNI | 1.80 | 248 | |||
| HCA II | Q92N | idem | 1CNJ | 1.80 | 248 | |||
| HCA II | Q92L | idem |
|
1CNK | 2.15 | 248 | ||
| Hydrophobic Core Residues | ||||||||
| HCA II | F95M, W97V | influence of hydrophobic core on metal binding, specificity | 1FQL | 2.00 | 251 | |||
| HCA II | F93I, F95M, W97V | idem | 1FQM | 2.00 | 251 | |||
| HCA II | idem | idem | apo | 1FQN | 2.00 | 251 | ||
| HCA II | idem | idem | CoII | 1FQR | 2.00 | 251 | ||
| HCA II | idem | idem | CuII, | 1FR4 | 1.60 | 251 | ||
| HCA II | F93S, F95L, W97M | idem | 1FR7 | 1.50 | 251 | |||
| HCA II | idem | idem | apo | 1FSN | 2.00 | 251 | ||
| HCA II | idem | idem | CoII | 1FSQ | 2.00 | 251 | ||
| HCA II | idem | idem | CuII | 1FSR | 2.00 | 251 | ||
| Proton Shuttle | ||||||||
| HCA II | Y7H | altered rate of proton transfer by proton shuttle H64 | 1LZV | 2.30 | 262 | |||
| HCA II | Y7F | removed hydrophilicity of proton-shuttle residues |
|
2NXR | 1.70 | 8.2 | 266 | |
| HCA II | idem | idem |
|
2NXS | 1.80 | 10.0 | 266 | |
| HCA II | idem | idem | 2NXT | 1.15 | 9.0 | 266 | ||
| HCA II | N62L | idem | 2NWO | 1.70 | 8.2 | 266 | ||
| HCA II | idem | idem |
|
2NWP | 1.80 | 6.0 | 266 | |
| HCA II | N67L | idem | 2NWY | 1.65 | 8.2 | 266 | ||
| HCA II | idem | idem |
|
2NWZ | 1.80 | 6.0 | 266 | |
| HCA II | H64A | loss of the catalytic proton shuttle | 1G0F | 1.60 | 260 | |||
| HCA II | idem | chemical (4-MI) rescue of the catalytic proton shuttle | 4-methyl imidazole | 1G0E | 1.60 | 260 | ||
| HCA II | idem | idem | 4-methyl imidazole | 1MOO | 1.05 | 261 | ||
| HCA II | H64W | idem | 2FNK | 1.80 | 267 | |||
| HCA II | W5A, H64W | idem | 2FNM | 1.80 | 267 | |||
| HCA II | idem | idem | 4-methyl imidazole | 2FNN | 1.80 | 267 | ||
| HCA II | H64A, N62H | effect of proton shuttle location and pH on H+ transfer |
|
1TG3 | 1.80 | 6.0 | 183 | |
| HCA II | idem | idem | 1TG9 | 1.90 | 7.8 | 183 | ||
| HCA II | H64A, N67H | idem |
|
1TH9 | 1.63 | 6.0 | 183 | |
| HCA II | idem | idem | 1THK | 1.80 | 7.8 | 183 | ||
| HCA II | H64A, T200H | idem | Cl− | 1YO0 | 1.80 | 6.0 | 263 | |
| HCA II | idem | idem |
|
1YO1 | 1.70 | 7.8 | 263 | |
| HCA II | idem | idem | 1YO2 | 1.80 | 9.3 | 263 | ||
| HCA III | K64H, R67Nc | partial recovery of the proton-transfer rate of HCA II | 2HFW | 2.50 | 268 | |||
| HCA III | K64Hc | idem | 2HFX | 1.70 | 268 | |||
| HCA III | R67Hc | idem | 2HFY | 2.60 | 268 | |||
| HCA II | A65F | residue size, not polarity, hinders proton transter | 1UGA | 2.00 | 264 | |||
| HCA II | A65G | idem |
|
1UGB | 2.00 | 264 | ||
| HCA II | A65H | idem | 1UGC | 2.00 | 264 | |||
| HCA II | A65S | idem | 1UGD | 2.00 | 264 | |||
| HCA II | A65L | idem | 1UGE | 1.90 | 264 | |||
| HCA II | A65T | idem |
|
1UGF | 2.00 | 264 | ||
| HCA II | A65S | idem | 1UGG | 2.20 | 264 | |||
| HCA I | H67R | enhanced esterase activity, second ZnII binding site | ethylene glycol | 1J9W | 2.60 | 265 | ||
| HCA I | idem | idem | ZnII; ethylene glycol; Cl− | 1JV0 | 2.00 | 265 | ||
If the crystal structure corresponds to a mutation that has been engineered into the isoform, this column describes the purpose of this mutation.
5-Acetamido-1,3,4-thiadiazole-2-sulfonamide (137).
Two additional mutations opposite the active site, Cys183Ser (Cys182Ser) and Cys188Ser, were made to enhance crystallization and did not affect catalysis.
Compounds, PDB IDs, and resolutions: none, 1G3Z, 1.86; 55, 1G45, 1.83; 56, 1G46, 1.84; 57, 1G48, 1.86; 58, 1G4J, 1.84; and 51, 1G4O, 1.96.
Compounds (4-(aminosulfonyl)-N-[(X-phenyl)methyl]benzamide), PDB IDs, and resolutions: X) 4-fluoro, 1I9L, 1.93; X) 2,4-difluoro, 1I9M, 1.84; X) 2,5-difluoro, 1I9N, 1.86; X) 2,3,4-trifluoro, 1I9O, 1.86; X) 2,4,6-trifluoro, 1I9P, 1.92; and X) 3,4,5-trifluoro, 1I9Q, 1.80.
Information gained from studies on mutants of HCA (mainly HCA II) has been invaluable in elucidating the mechanism of catalytic hydration of CO2. Mutations of Thr199 alter the coordination sphere of ZnII and create proteins that bind zinc both more strongly and more weakly than the w.t. enzyme.243,244 Mutations of the ZnII-binding histidine residues have clarified the importance of plasticity of the ZnII-binding site; these mutations often lead to loss (i.e., weak binding) of the ZnII ion.245,246 Other studies have explored the importance of indirect ligands–that is, residues that interact with the ZnII-bound residues but not directly with the ZnII–by introducing mutations into the ZnIIOH-Thr199-Glu106 triad156,179,247 and into the rest of the indirect ligand–metal248,269 hydrogen-bonding network (see section 6 and Table 5).
Certain mutations enhance the binding of metal ions to HCA, and some metal ions bind readily to the native apoenzyme. To date, crystallized metallovariants include apo-HCA (protein with no metal in the binding site), ZnII (w.t.), CdII, CoII, CuII, HgII, MnII, and NiII. Tables 4 and 5 include many of these structures. Section 5 and Table 6 contain a more detailed discussion of these and other metallovariants of CA.
Table 6.
X-ray Crystal Structures of Metallo Mutants of HCA IIa
| Metal | Residue mutation | Purpose of study | Coordination | Binding affinityb (Kd, nM) | pHc | PDB ID | Res. (Å) | Ref |
|---|---|---|---|---|---|---|---|---|
| ZnII | natural enzyme | 4, tetrahedral | 4 × 10⁻³ | 7.0 | 2CBA | 1.54 | 184, 246 | |
| Apo | structural analysis | n/a | n/a | n/a | 2CBE | 1.82 | 184 | |
| ZnII | metal binding to native enzyme | 4, tetrahedral | 8 × 10⁻⁴ | 7.0 | 2CBA | 1.54 | 184, 321 | |
| CdII | idem | 2.3 | 7.0 | 317 | ||||
| CoII | idem | 4, tetrahedral | 20 | 7.0 | 1RZA, 1RZB | 1.90, 1.80 | 187, 311 | |
| CuII | idem | 5, trigonal bipyramidal | 1.7 × 10⁻⁵ | 7.0 | 1RZC | 1.90 | 187, 311 | |
| MnII | idem | 6, octahedral | 1RZD | 1.90 | 187 | |||
| NiII | idem | 6, octahedral | 16 | 7.0 | 1RZE | 1.90 | 187, 317 | |
| HgII | idem | 4, octahedral | 1CRM | 2.00 | 223 | |||
| CoII | bicarbonate binding | 6, octahedral | 1CAH | 1.88 | 188 | |||
| Apo | H94C | engineering Zn affinity, functionality and discrimination | n/a | n/a | n/a | 1HVA | 2.30 | 250 |
| Apo | H94C | metal-binding site plasticity | n/a | n/a | n/a | 1CNB | 2.35 | 245 |
| Apo | H94A | idem | n/a | n/a | n/a | 1CVF | 2.25 | 245 |
| Apo | E117Q | indirect ligand increases Zn complexation kinetics | n/a | n/a | n/a | 1ZSA | 2.50 | 252 |
| ZnII | H94N | electrostatic effects on Zn binding affinity, coordination | 5, trigonal bipyramidal | 40 | 7.0 | 1H4N | 2.00 | 259 |
| ZnII | H119N | idem | 5, trigonal bipyramidal | 11 | 7.0 | 1H9N | 1.85 | 259 |
| ZnII | H119Q | idem | 4, tetrahedral | 69 | 7.0 | 1H9Q | 2.20 | 259 |
| ZnII | F95M, W97V | structural influence of hydrophobic core on metal binding | 4, tetrahedral | 1.6 × 10⁻³ | 7.0 | 1FQL | 2.00 | 251, 321 |
| ZnII | F93I, F95M, W97V | idem | 4, tetrahedral | 1.1 × 10⁻² | 7.0 | 1FQM | 2.00 | 251, 321 |
| Apo | idem | idem | n/a | n/a | n/a | 1FQN | 2.00 | 251, 311 |
| CoII | idem | idem | 4, tetrahedral | 66 | 7.0 | 1FQR | 2.00 | 251, 311 |
| CuII | idem | idem | 5, square pyramidal | 3 × 10⁻⁶ | 7.0 | 1FR4 | 1.60 | 251, 311 |
| ZnII | F93S, F95L, W97M | idem | 4, tetrahedral | 2.9 × 10⁻² | 7.0 | 1FR7 | 1.50 | 251, 321 |
| Apo | idem | idem | n/a | n/a | n/a | 1FSN | 2.00 | 251, 311 |
| CoII | idem | idem | 5, trigonal bipyramidal | 145 | 7.0 | 1FSQ | 2.00 | 251, 311 |
| CuII | idem | idem | 5, trigonal bipyramidal | 2 × 10⁻⁶ | 7.0 | 1FSR | 2.00 | 251, 311 |
| CdII | binding to HCA I | 6.3 × 10⁻¹ | 5.5 | 314 | ||||
| CoII | idem | 6.3 × 101 | 5.5 | 314 | ||||
| CuII | idem | 2.5 × 10⁻³ | 5.5 | 314 | ||||
| MnII | idem | 1.6 × 10⁵ | 5.5 | 314 | ||||
| MnII | idem | 1.6 × 10³ | 8.5 | 318 | ||||
| NiII | idem | 3.2 × 10⁻¹ | 5.5 | 314 | ||||
| ZnII | idem | 3.2 × 10⁻² | 5.5 | 314 | ||||
| InIII | γ- and K X-ray nuclear studies | not reported | — | 5.7–7.7 | 315, 316 |
Unless otherwise stated.
Binding affinity for the metal to the apo-protein.
The pH at which the binding affinity was measured.
4.4.2. Structure Determined by NMR
While X-ray studies have provided useful structural data for mutated and native CA, both with and without bound ligands, they cannot provide information on solution-phase structural dynamics of the enzyme or its bound inhibitors. For this kind of information, researchers have thus far turned to NMR. Most of the NMR studies involving complexes of benzenesulfonamides with CA have explored the stoichiometry,270–275 coordination,273,275–277 and internal motion270–274 of ligands bound to the active site. We discuss those studies here.
 | |
| number | fluorination |
| 51 | none |
| 55 | 2-fluoro |
| 4-fluoro | |
| 56 | 2,3-difluoro |
| 2,4-difluoro | |
| 2,5-difluoro | |
| 57 | 2,6-difluoro |
| 2,3,4-trifluoro | |
| 2,4,6-trifluoro | |
| 3,4,5-trifluoro | |
| 58 | pentafluoro |
To the best of our knowledge, there are no high-resolution solution structures of CA determined by NMR-based techniques, as CA is marginally too large for NMR to be practical. Recent advances in NMR spectroscopy, however, may now make such structures obtainable.278,279 So far, only triple resonance experiments (1H, 13C, 15N) and 15N hetero-nuclear NOE data on HCA I and perdeuterated HCA II with site-specific 15N-labeling have aided in the assignment of backbone and side-chain resonances, as well as in the determination of the secondary structure and global fold for HCA I and HCA II.280,281 These studies provide the foundation for a complete solution structure, as well as for understanding the kinetics and pathway of folding, of HCA I and HCA II.
Kanamori and Roberts used 15N NMR to demonstrate that arylsulfonamides bind as the anion (ArSO2NH−) to the ZnII ion of HCA I, primarily through the sulfonamide nitrogen.276 Binding in this form requires deprotonation of the sulfonamide group. The pKa of this group (e.g., 10) is, therefore, an important factor in binding. In sections 9 and 10, we describe in detail the influence of this pKa on the observed binding affinity.
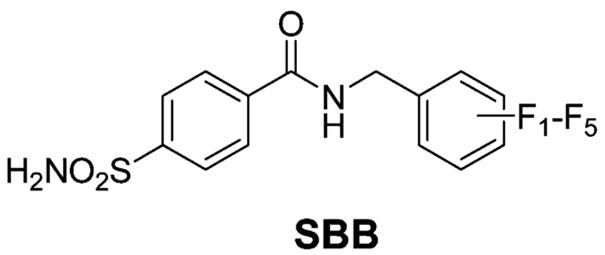
Arylsulfonamide inhibitors typically form 1:1 ligand/protein complexes with CA.270–273 Kim et al. observed 2:1 binding of fluoroaromatic ligands (SBB) to the Phe131Val mutant of HCA II (but not to native HCA II, which only formed 1:1 complexes with these inhibitors); X-ray structures showed that one sulfonamide bound to the active site of HCA II and the other sulfonamide bound at the interface between two HCA II proteins in the crystal lattice.180,249 NMR experiments, however, showed that these sulfonamides bound in a 1:1 complex in solution.249 By X-ray crystallography, Jude et al. observed 2:1 complexes for the binding of the two-pronged (sulfonamide and CuII ion) inhibitors 218, 219, 234, and 235 to HCA I and HCA II.181 One of these inhibitors coordinated to ZnII and His64, while the other bound at the rim of the active site near the N-terminus of the enzyme. This secondary binding site differs from the site that Kim et al. observed.180,249 Jude et al. confirmed that the 2:1 stoichiometry persists in solution by isothermal titration calorimetry (ITC). Dugad et al. proposed 2:1 complexes for the binding of compounds 207–209 and 2,5-difluorobenzene-sulfonamide to HCA I and HCA II with a pentacoordinated ZnII ion in the active site, on the basis of 19F NMR experiments.274,275 Krishnamurthy et al. observed only 1:1 complexes for the binding of 209 to BCA II and HCA I by 19F NMR and confirmed this 1:1 stoichiometry for the binding of ligands 207–212 to BCA II by ITC and for the binding of 209 to HCA II by X-ray crystallography.182 In addition to structural information, NMR also characterizes the internal motion of bound inhibitors270–274 and of the enzyme active site itself.272 Except for pentafluorobenzene-sulfonamide (212), which contains magnetically distinct environments for each fluorine atom when bound to HCA II,271 the aromatic ring of benzenesulfonamides rotates rapidly on the NMR time scale about its C(1)–C(4) axis.270,273,274 BCA II forms a 1:1 complex with p-methylbenzenesulfon-amide (6, Table 10) at pH 6.0.272 While 13C–1H NOE experiments suggested that the internal mobility of the α-carbons in the enzyme is restricted upon binding of the inhibitor, 15N[1H] NOE experiments qualitatively indicated the existence of some internal mobility of the bound inhibitor.
Metal substitution facilitates the study of inhibitor binding. Metals that have a spin-1/2 nucleus (67Zn, the only naturally occurring isotope of Zn with nonzero spin, has a spin of 5/2) provide a mechanism for efficient dipolar relaxation of 15 N bound to the metal atom in the active site. 111Cd and 15N NMR have shown that both arylsulfonamides and N-hy droxyarylsulfonamides bind to HCA I, BCA, and 111Cd-BCA via an anionic nitrogen.276,277 15N NMR alone cannot detect the binding of the N-hydroxyarylsulfonamide, since these species have no NMR-active atoms on the bound nitrogen to yield a nitrogen signal. Metal variants such as 111Cd are, therefore, required for this study and other studies of this type. Metallovariants are discussed further in section 5.
These studies suggest that one must consider factors other than the static structure of an enzyme in the design of inhibitors. Upon binding of a ligand, the steric constraints in the active site may change, and the resulting structure is difficult to predict. In addition, the internal motion of ligands and of amino acid residues in the active site may influence the manner in which ligands bind. For example, ligands may form contacts with the protein that change as the ligands rotate within the active site and as the active site relaxes around the ligands. Thus, while X-ray structures are enormously useful, they alone do not completely detail the factors that should be included in the design of ligands for a given protein.
4.5. Global Structural Features
CA is a globular protein with a high degree of tertiary and secondary structural homology between isoforms. HCA II is roughly ellipsoidal in shape and has well-defined secondary structural elements. The enzyme has diameters of 40 and 42 Å along the minor axes and 56 Å along the major axis. (We estimated these values by measuring the distance between nuclei of farthest lying atoms along each axis using Deep View/Swiss-PdbViewer 3.7.)282 These dimensions agree with those that Pocker and Sarkanen40 and Eriksson et al.240 measured for HCA II: 40 × 42 × 55 Å and 39 × 42 × 55 Å, respectively. The structure of α-CAs is dominated by a central, ten-stranded, twisted β-sheet, βA to βJ (running from front-left to back-right in Figure 4; see also Figure 2) and also contains seven α-helices surrounding the sheet.40,240 Another interesting structural feature of CA is the C-terminal knot (Figure 2)–that is, the knot that would form near the C-terminus if one were to grab both ends of the native structure and pull. Knots of this sort are rare (see section 15).
The global structure of HCA II changes minimally over a wide range of values of pH (5.7–8.4), upon binding of ligands and upon the removal of the ZnII ion. The root-mean-square (rms) deviation of Cα atoms in the superposition of structures with and without bound inhibitors for HCA II is 0.2 Å; few side chains have shifts > 1 Å.283,284 Most importantly, His64 undergoes a relatively large shift in position when the pH is reduced below 7 by rotating 64° about the χ1 torsion angle.183 Nair and Christianson measured an rms difference of 0.2 Å between their structure at pH 5.7 and that reported by Eriksson et al. for pH 8.5.240,285 Håkansson et al. observed that the structure of native HCA II at pH 6.0 is almost indistinguishable from that at pH 7.8; the rms deviation of Cα atoms between the two structures is 0.044 Å.184 Moreover, they measured an rms deviation of 0.098 Å for the Cα atoms of the native and apo forms of the enzyme at pH 7.8.
Figure 5 shows maps of acidic and basic residues (parts A and B) as well as hydrophobic and polar residues (parts C and D) of HCA II. While the surface of the enzyme opposite the active site (parts B and D of Figure 5) shows a majority of polar residues (Figure 5D), these residues are not arranged in any obvious pattern in terms of local acidity. In striking contrast, the “front” side of HCA II (i.e., the same side as the active site, which is marked by arrows in parts A and C of Figure 5) shows a large basic patch (blue) that surrounds the active site. On the other side of this patch, there is a large hydrophobic pocket (yellow, Figure 5C), which has been posited to be the binding site for carbon dioxide,47 and below which lies a large acidic patch. These large polar patches may facilitate entry and exit of bicarbonate to and from the active site, where the substrate binds in the hydrophobic pocket.
Figure 5.
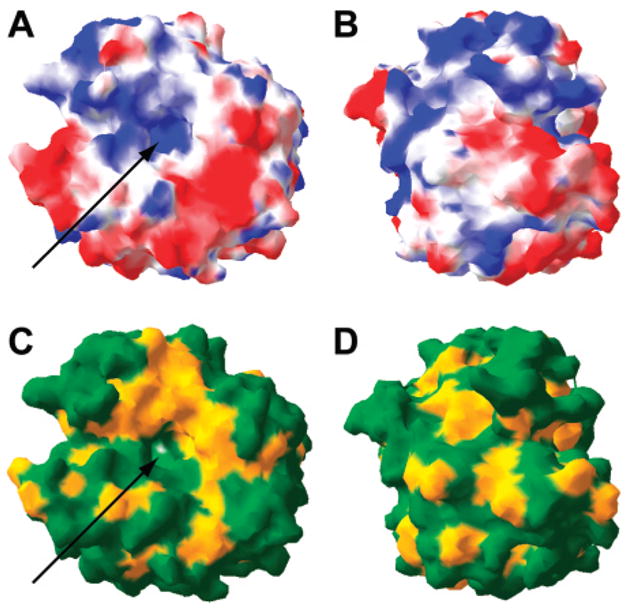
Surface rendering of opposite faces of HCA II (PDB/2CBA184) showing (A and B) acidic residues in red and basic residues in blue and (C and D) hydrophobic residues in yellow and polar residues in green. At pH 7–8, the red regions have a negative charge; the blue regions have a positive charge. The arrows indicate the active site.
The robust structure of CA makes the protein easy to manipulate. Invariance of the structure of CA (at least HCA II) as a function of pH suggests that changes in the binding properties of ligands at various values of pH are due to chemical effects in the active site (e.g., protonation of the enzyme or ligand) rather than to global structural effects. The structural homology between α-CA isozymes implies that findings for one isozyme are likely to be relevant for other isozymes and other species.
4.6. Structure of the Binding Cavity
The binding cavity of CA is a complex space surrounding the catalytic ZnII ion and has been the focus of much research for the past three decades. The binding cavity includes three functional regions: (i) the primary coordination sphere around ZnII, comprising histidine residues and a hydroxide ion or water (see section 4.7); (ii) the primary and secondary hydrophobic faces that bind ligands and substrates; and (iii) a hydrophilic face that is believed to regenerate the catalytic activity of the protein through a proton shuttle. Understanding the structure of this part of the protein is essential for effective biophysical and physical-organic studies of ligand binding.
All isoforms of CA have a conical cavity at the active site; this cavity is roughly 15 Å in diameter at its mouth and 15 Å deep.40,240 This conical cavity is visible at the centers of parts A and C of Figure 5. The catalytic ZnII ion, Zn262, lies at the apex of the cone near the center of the protein and is coordinated in a distorted tetrahedral arrangement to a hydroxide ion or water molecule (water263) and three histidine residues, His94, His96, and His119, which are located on the central β-sheet–His94 and His96 on βD and His119 on βE.240,286,287
There are small but noticeable changes in the geometry of the active site as a function of pH. The presence and location of various water molecules in and around the active site changes as the pH increases from 6.0 to 7.8.184,288 The geometry of the part of the active site comprising water263, Zn262, His94, His96, and His119, however, remains similar with bond distances and angles varying at most by 0.04 Å and 2.7°, respectively.184 Perhaps the most important influence of pH on the structure of CA is that of water263, which is bound at the active site to ZnII. The pKa of this group, and its influence on the binding of ligands, are discussed further in sections 4.7 and 10, respectively.
The binding cavity of CA has hydrophobic and hydrophilic faces (Figure 5C). The residues of the hydrophobic face that make up primary and secondary binding sites are located above and to the right of the active site in Figure 5C. The primary site, known as the hydrophobic pocket, consists of Val121, Val143, Leu198, and Trp209289 and is believed to bind CO2 adjacent to the ZnII-bound hydroxide.47,289,290 Silverman and Lindskog suggest that Val207 also contributes to this pocket.14
The secondary hydrophobic binding site is located farther from the active site than the primary hydrophobic pocket. Many inhibitors of CA bind to this region of the hydrophobic face in addition to the active site ZnII itself. For example, Figure 6 shows an arylsulfonamide inhibitor with a triethylene glycol tail (Table 10, compound 84) that contacts residues in the hydrophobic pocket.185 Interactions with the secondary hydrophobic binding site require the use of long-chain linkers between a hydrophobic tail and a ZnII-binding head group.
Figure 6.
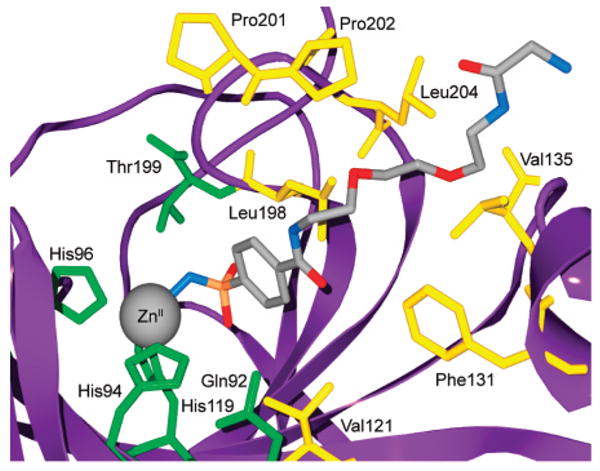
Model for the binding of compound 84 to HCA II based on the deposited X-ray crystallographic coordinates (PDB/1CNW).185 Catalytically important residues and residues that contribute to the primary and secondary hydrophobic binding sites for this ligand are shown.
The hydrophilic face of the binding cavity was characterized first by Eriksson et al. (Figure 7).240 Of the eight residues on this face, Thr199 and Thr200 are nearest to the entrance to the cavity, while His64 is located on the opposite side of this entrance. The other five active site residues, Tyr7, Asn62, Asn67, Gln92, and Glu106, are involved in an intricate network of hydrogen bonds with nine ordered water molecules in the active site.240,287 Residues Tyr7, Asn62, and Asn67 refine the efficiency of proton transfer between the ZnII-bound water and His64.266 Residues Glu117, His107, Asn244, and Arg246, which lie buried in the vicinity of the active site, are involved indirectly in the network. These residues orient the side chains that line the active site cavity and support their stable conformation.240
Figure 7.
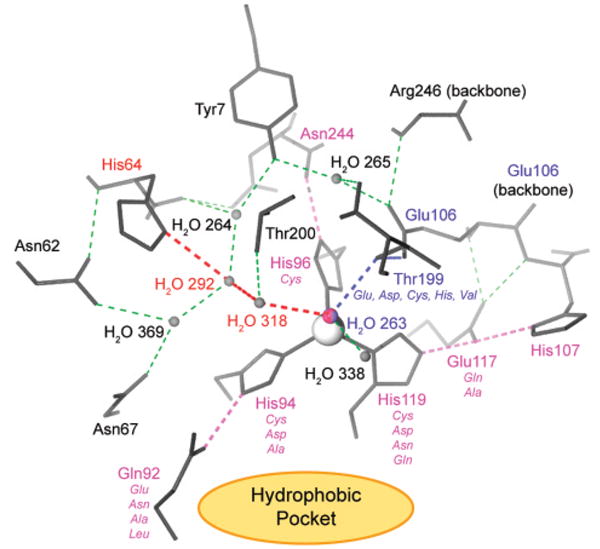
Hydrogen bonding in the active site of HCA II. All hydrogen bonds are shown in dashed lines. In pink are the hydrogen bonds and residues involved in orienting the imidazole rings of His94, His96, and His119. In blue are the residues involved in orienting the lone pairs on the zinc-bound hydroxyl ion for optimal nucleophilic attack. In red are the water molecules and His64 that make up the proton shuttle that regenerates the zinc-bound hydroxyl ion via deprotonation of the zinc-bound water molecule. The thin green dashed lines represent other, less crucial hydrogen bonds within the active site and further buried residues adjacent to the active site. The view is down an axis made up of the catalytic ZnII cofactor (gray) and the zinc-bound hydroxyl ion (H2O 263). The hydrophobic pocket (see Figure 6) lies in the area indicated by the orange ellipse and extends to the space above His119, His96, and Thr200. In italics are mutations of direct (Thr199, His119, His96, His94) and indirect (Glu117, Gln92) ligands to ZnII, carried out by Fierke and Christianson (section 6). Modified with permission from ref 706. Copyright 2004 American Chemical Society.
Figure 7 shows a network of hydrogen bonds among amino acid side chains and water molecules within the active site of HCA II. This network contributes to the catalytic activity of the enzyme, as well as to the affinity of the enzyme for ZnII. Hydrogen bonds from the direct (those residues that coordinate ZnII) to the indirect ligands, which orient the imidazole rings of the His residues coordinated to Zn, include the following: (i) Nδ1 of His94 to Oε1 of Gln92; (ii) Nδ1 of His96 to O of Asn244; and (iii) Nδ2 of His119 to Oε2 of Glu117, which also accepts a hydrogen bond from Nδ1 of His107 that orients Glu117. The Oε1 atom of Glu106 accepts a hydrogen bond from the proton on the Oγ1 atom of Thr199. This bond aligns the Oγ1 atom on Thr199 to accept a hydrogen bond from the Zn-bound hydroxide ion and to orient the lone pair of the hydroxide ion for nucleophilic attack on CO2.184,240 When an inhibitor binds in the active site of CA, the Oγ1 atom on Thr199 can accept a hydrogen bond from the inhibitor. If, however, the inhibitor cannot donate a hydrogen bond to Thr199 (as is the case for SCN−), then Thr199 can repel the ligand and cause it to bind the ZnII in a distorted pentagonal geometry.186 A very high-field ligand, such as CN−, can also cause distortion to a pentagonal geometry.291
When CO2 binds to CA, computational,47 13C NMR292,293 and X-ray188,198,294 studies suggest that the CO2 binds in the hydrophobic pocket and displaces the “deep water” (water338) that forms a hydrogen bond to the amide NH backbone of Thr199. Håkansson et al.184 proposed that CO2 binds to HCA II in the same location and orientation as cyanate.294 X-ray structures with HCA II showed that both cyanate (NCO−), which is isostructural and isoelectronic with CO2, and cyanide (CN−) accept a hydrogen bond from the amide NH backbone of Thr199 but do not displace the zinc-bound water.294 Interestingly, cyanamide (264), which is also isostructural and isoelectronic with CO2, binds to HCA II in a completely different manner: 264 coordinates to ZnII, points away from the hydrophobic pocket, and forms hydrogen bonds with the Oγ1 atoms of Thr199 and Thr200.221
Perhaps the most important catalytic feature involving the water molecules in the active site is the His64 residue, which acts as a “proton shuttle” that aids in the transfer of a proton from the ZnII-bound water263 to buffer molecules in the final step of the catalytic mechanism of CO2 hydration (see section 2 and Figure 7: bold, red, hydrogen-bonded network).53 A change in pH causes an important structural change in the conformation of His64 in HCA II that suggests the role of this residue in the mechanism of proton shuttling.55,183,240,285 For example, at pH 5.7, His64 appears to occupy an alternate conformation, in which the imidazole side chain is directed away from the active site by a 64° rotation about the χ1 torsion angle.
While the hydrophilic face is essential for catalysis, the hydrophobic face remains the part of the active site to which most drugs are targeted. Understanding the structure of the hydrophobic face is, therefore, important in designing inhibitors with optimal affinities. Knowledge of the structure of the hydrophilic face is necessary for understanding the catalytic activity of CA.
4.7. ZnII-Bound Water
The catalytic ZnII cofactor in the active site of CA is coordinated in a tetrahedral geometry by three histidine residues and water263 (see Figures 2, 6, and 7). As a universal feature of all known ZnII-metalloenzymes, the ZnII ion activates this water molecule for catalysis; in the case of CA,295 this activation is believed to be carried out via deprotonation of the Zn-bound water (ZnII–OH2+) to yield a ZnII–hydroxide (ZnII–OH). The pKa of the ZnII–OH2+ (pKa(CA–ZnII–OH2+)) is believed to be 6.8 for HCA II,269 and defining this value has been the subject of substantial research, because it is important in understanding both the catalytic hydration of CO2 and the binding of inhibitors. This section discusses both processes and focuses on the importance of the pKa(CA–ZnII–OH2+) in the study of CA–ligand interactions.
The currently accepted mechanism for catalysis by CA of the hydration of CO2 involves several steps:14 (i) attack on CO2 by the ZnII-bound hydroxide (deprotonated water263) to form bicarbonate; (ii) binding of a water molecule to the ZnII at a position adjacent to the bicarbonate ion; (iii) leaving of bicarbonate; and (iv) transfer of a proton from the newly bound water (now water263, or ZnII–OH2+) to the buffer (Figure 1). The last step, in which water263 loses H+, is believed to be the rate-limiting step in this process.48 The pH-dependence of the catalytic activity of CA, both as a hydratase and an esterase, strongly suggests the influence of a single ionizable group with pKa 6.8 (for HCA II), and this group is widely believed to be water263.14,48,269,296,297 Lipton et al., however, used solid-state 67Zn-NMR to infer that the species coordinated in the fourth position of ZnII is hydroxide from pH 5 to 8.5.298 This proposal suggests a pKa for the zinc-bound water that is <5. It is the only study that disagrees with a value of 6.8 for pKa(CA–ZnII–OH2+). Fisher et al. observed ZnII-bound water in a high-resolution (1.05 Å) X-ray structure of HCA II crystallized at pH 7.8; assuming a pKa of 6.8, at this pH, water263 should be deprotonated to hydroxide.54 The authors noted, however, that the ionization state of titratable groups in a crystal and in solution may be different.
Values for pKa(CA–ZnII–OH2+) vary slightly among the different isozymes: Kiefer et al. estimated a value of 6.8 for HCA II by monitoring esterase activity as a function of pH;269 Coleman found a value of 8.1 for HCA I (also for CoII–HCA I); and Kernohan inferred a value of 6.9 for BCA II using a similar procedure.296,297,299 Values ranging from 6.4 to 7.1 have been reported for CoII–BCA II,300–302 with 6.8 prevailing as the accepted value.291
The protein environment surrounding the ZnII cofactor can have a significant influence on the value of pKa(CA–ZnII–OH2+). For HCA II, mutations of Thr199,303 and of the residues involved directly304 and indirectly269 in coordinating ZnII, modulate the value of pKa(CA–ZnII–OH2+). Computer simulations of HCA II suggest that Glu106, Glu117, and Arg246 make the greatest contributions to the value of pKa(CA–ZnII–OH2+).305 The linear relationship observed between pKa(CA–ZnII–OH2+) and log(kcat/Km) for CO2 hydration among a series of mutants of HCA II implies that stabilization of the negative charge on the oxygen atom in ZnII–OH is a critical factor in catalysis.269 The effective charge on the ZnII, which is influenced by all ligands in its coordination sphere, is believed to be an important factor in this stabilization.289
In parallel with studying the effects of the pKa(CA–ZnII–OH2+) on the catalytic properties of CA, several groups explored the influence of the pKa(CA–ZnII–OH2+) on the binding of ligands to CA.291,297,299,301,302,306 Several of these studies297,299,301 used enzymatic activity as a measure of binding. Since enzymatic activity falls off at and below pH ~7, presumably because of the protonation of ZnII–OH with formation of ZnII–OH2+, these studies cannot unambiguously determine the effects of the pKa(CA–ZnII–OH2+) on binding. Therefore, it is important that these effects were studied by nonenzymatic assays.
In an early study on the mechanism of arylsulfonamide inhibitors, Lindskog used stopped-flow fluorescence to monitor the kinetics and thermodynamics of the binding of several arylsulfonamides to CoII–BCA II.307 The investigators used the CoII variant because the UV–visible spectrum of the cobalt changes significantly on binding the sulfonamide, providing a spectroscopic handle. Their results suggest that ligand binding depends on two ionizable groups—one on the inhibitor, and one on the protein. The pKa values of the inhibitors were easy to confirm. The remaining pKa value was consistent at 6.6 across a series of inhibitors. This value, within the error of their experiments, correlates remarkably well to the accepted pKa(CA–ZnII–OH2+) of 6.8 for CoII–BCA II. Taylor et al. observed the same dependence of kinetics of association and affinity of sulfonamides on pH in HCA II with ZnII.302 The important conclusion is that both ligand binding and catalysis depend on the same ionizable group on the protein, which is very likely to be that of the ZnII-bound water263.
Deerfield II et al. used density functional theory to evaluate the Zn-binding site in CA.308 Using the tetrahedral complex Zn(imidazole)3(H2O) as their basic model, the investigators calculated a value for the pKa of the ligated water of ~7; this value is lower than the pKa of the zinc-coordinated imidazoles, and so, preferential deprotonation of the H2O ligand should result.
5. Metalloenzyme Variants
Metallo variants of proteins present an interesting subject of study in order to rationalize why one metal is preferable for a catalytic function over another, what structural features of a protein determine metal specificity, and what structural changes occur upon substitution of a metal in enzymes. Different metal substituents are also useful as magnetic spin labels and scattering centers. CA is particularly well-suited for studies of metallo variants of the enzyme and their properties. The ZnII ion can be easily extracted from the active site without denaturation of the protein and can be readily replaced by a number of other divalent ions. There is minimal conformational change upon either removing the ZnII ion or adding the non-zinc metal ions.
Hunt et al. developed a method for preparing apo-CA (BCA and HCA I) using flow dialysis against dipicolinic acid (pyridine-2,6-dicarboxylic acid).309 Flow dialysis removes >97% of the ZnII from CA in <2 h, compared to the removal of 95% in 7–10 d using the original method developed by Lindskog and Malmström (using BCA II).309,310 Hunt et al. measured the presence of residual ZnII by measuring the esterase activity of the enzyme—one commonly uses p-nitrophenyl acetate as the substrate—and by atomic absorption spectroscopy.309 A modified method using ultrafiltration is still used today.250 Alternatively, one can simply dialyze away the ZnII by soaking CA in dipicolinic acid for 10–12 days.184,251 Metal derivatives are prepared by incubating the apoenzyme with a buffered solution of the chloride or sulfate salt of the desired metal for 24–48 h.187,188,311 The formation of cobalt complexes can be quantified by measuring esterase activity; the formation of other metal complexes (e.g., CuII) may be quantified by performing a colorimetric 4-(2-pyridylazo)resorcinol assay.188,311–313
Table 6 lists the metallo variants of HCA II reported to date.184,187,188,223,245,246,250–252,259,311,314–318 Metals that bind to CA consist primarily of transition metals in the +2 oxidation state: ZnII (w.t.), CdII, CoII, CuII, FeII, HgII, MnII, and NiII. InIII from InCl3 also binds to the active site of apo-BCA II.315,316 HCA II has been crystallized incorporating CoII, CuII, HgII, MnII, and NiII ions.159,187,188,251,311,319
Of these variant metalloenzymes, only the native ZnII shows high enzymatic activity. The CoII variant displays ~50% of the activity of the native protein. Lindskog and Nyman314 formed various metal complexes with HCA I, HCA II, and BCA II and measured their activity. Proteins with FeII, MnII, and NiII show only 4%, 8%, and 2% activity, respectively, at 10–100 μM concentrations of the metal ions. Similar concentrations of CdII, CuII, and HgII show no activity beyond the residual Zn-activity (1–3% due to incomplete removal of ZnII). Inhibition of the residual Zn-activity occurs at high concentrations (>10–100 μM) of CoII, FeII, MnII, NiII, CdII, CuII, and HgII. No levels of MgII, CaII, or BaII—concentrations ranging from 10 μM to 2 mM—affect activity or inhibition; all three complexes are inactive.314
The catalytically active metal ions, ZnII and CoII, coordinate to histidine residues in the active site of HCA II with distorted tetrahedral geometries, regardless of pH.187 The CoII variant of HCA II, however, when complexed with bicarbonate ion, showed nearly octahedral coordination, with the cobalt ion coordinated to the three histidine ligands, bicarbonate O-2 and O-3 oxygen atoms, and a water molecule.188,320 This propensity of CoII to form expanded coordination complexes may explain the reduced CO2 hydration activity of the CoII-containing enzyme via reduction of the rate of product release.320 Other metals result in increased coordination number: CuII binds to HCA II in trigonal-bipyramidal and square-pyramidal geometries, while both NiII and MnII coordinate octahedrally.187 These nontet-rahedrally coordinated metals also perturb the solvent structure in the active site: water 318, which is usually hydrogen bonded to the Zn-bound water, is absent. From their thorough analysis of crystal structures of metal-substituted HCA II, Håkansson et al. concluded that the choice of ZnII for catalysis by nature is due to the tetrahedral coordination chemistry of zinc, its natural abundance, and its weak interaction with other anions that may inhibit the enzyme in vivo.187
Fierke and co-workers conducted a series of studies in which they measured the affinities of different metals to HCA II and its active site mutants to determine the basis of selectivity for zinc in this protein.251,311,321,322 The investigators looked at the influence of hydrophobic core residues Phe93, Phe95, and Trp97 on binding of metals and found that substitution of those residues with smaller side chains reduced the affinity of the protein to ZnII and CoII but increased the affinity to CuII.311,321 X-ray analysis of the mutants revealed new cavities formed in the core of the protein and shifts in the positions of metal-coordinating His94 and second-shell ligand Gln92.251 The investigators concluded that the aromatic residues, although they do not directly coordinate the metal, preorient the metal-binding side chains in such a fashion as to favor tetrahedral zinc-binding geometry and to destabilize alternative geometries.
McCall and Fierke continued the study of factors that influence binding of metals by mutating the side chains of HCA II that directly coordinate the metal.322 The investigators varied the polarizability of the coordinating atom, the relative size of the binding site and the metal ion, and the geometry of the binding site to determine which of these three was most important in determining the selectivity of HCA II for ZnII over other metals. The investigators found that the selectivity for metals correlated with the geometry of the ligands in the active site and with the preferred coordination number of the metal (the investigators were able to vary the number of chelating residues by mutating Thr199 to Cys, Glu, or His, all of which can coordinate the metal). The polarizability of the coordinating atom (S vs O) or the size of the active site and the metal ion did not affect the selectivity as strongly as the coordination number and geometry. These series of studies emphasize the importance of number of direct ligands to the metal and of the core residues that support and orient the direct ligands in the design of a metal-binding site with high selectivity and specificity.
The high affinity of binding of transition metals to apo-carbonic anhydrase and to its mutants323 can be utilized to construct sensors for low concentrations (~pM) of those metals.323–327 Fluorescent aryl sulfonamide inhibitors of CA, such as dansyl amide and others, can serve as probes for the zinc ion.323 Fluorophores that are covalently attached to a side chain of HCA II can serve as reporters for other metals, since their fluorescent properties (intensity, emission maximum, polarization, and lifetime) are sensitive to the presence of metal in the binding site.324,325,327 Since MgII and CaII are prevalent divalent cations in biological systems but do not bind to HCA II and interfere with the assay, these HCA II-based sensors are particularly useful for biological applications.328–330
The ability to tune the affinity of various metals for HCA II allows one to perform a wider variety of experiments to probe the binding of inhibitors to HCA II than if the enzyme were restricted to complexing only ZnII. The agreement of multiple assays, calculations, and fluorescence spectroscopic studies suggests that the binding of metals to CA is well-characterized, even if it is not yet completely understood.
6. Structure–Function Relationships in the Catalytic Active Site of CA
The structure of the binding pocket of CA is highly conserved among isozymes of CA. This high degree of structural homology suggests that evolution has given each residue in the binding pocket a specialized and optimized function in the catalytic processes. Since CA is a well-characterized enzyme, and CO2 is among the simplest possible substrates, CA represents an ideal model system for examining the roles of active-site residues in the network of catalytic steps (see Figure 1). An extensive program of site-directed mutagenesis, evaluation of catalytic properties, and X-ray crystallography by Fierke and Christianson has assigned specific functions to the active-site residues in CA; this body of work has been reviewed previously.289 Here, we briefly summarize this work and suggest its relevance to the construction of artificial catalytic sites.
6.1. Effects of Ligands Directly Bound to ZnII
Modifications of residues directly coordinated to the ZnII ion (Figure 7) provide clues to the importance of cooperativity, geometrical constraints, and stereochemistry in the binding of the metal ion and its catalytic efficiency. Table 7 indicates that substitution of any of the directly zinc-bound His residues by Ala results in substantially increased dissociation constants for the ZnII ion. Mutation of each His residue to Cys in the binding pocket of HCA II, and determination of the crystal structure of the mutants, revealed that His94Cys and His119Cys can coordinate to the metal ion while His96Cys does not.245,304 The β-sheet secondary structure around Cys96 is not sufficiently plastic to allow the thiolate to coordinate to ZnII. In general, introduction of an acidic residue (Asp, Cys, or Glu) in place of one of the neutral His residues improves affinity to ZnII by an order of magnitude relative to the introduction of an Ala (neutral) residue, but the catalytic activity (kcat/Km) of the mutants with acidic residues is still 3 orders of magnitude lower than that of the wild type. The decrease in catalytic activity may be due to electrostatics: an additional negative charge in the binding pocket should increase the pKa of the ZnII-bound water molecule and destabilize both ZnII–OH and the transition state for the hydration of CO2. Although the values of kcat/Km for hydration of CO2 of these variants of HCA II are lower than kcat/Km of the wild type, they still exceed those of small molecule Zn-complexes.331 These data indicate that the histidine ligands, although not essential for catalysis, are optimal for maximizing the electrostatic stabilization of both the ground-state zinc–hydroxide and the negatively charged transition state.
Table 7.
Properties of HCA II Mutants with Altered ZnII Binding Site
| Ligand type | Substitutiona | pKab | kcat/Km ×10−5c (M−1 s−1) | Kd for ZnII (nM) | Ref |
|---|---|---|---|---|---|
| direct | |||||
| wild type | 6.8 | 1100 | 0.004 | ||
| His94Ala | n/ad | 0.12 | 270 | 245, 304 | |
| His94Asp | ≥9.6 | 1.1 | 15 | 246, 304 | |
| His94Cys | ≥9.5 | 1.1 | 33 | 245, 250, 304 | |
| His94Glu | n/a | ≤0.1 | 14 | 304 | |
| His96Ala | 8.4 | ≤0.1 | 100 | 304 | |
| His96Cys | 8.5 | 0.73 | 60 | 245, 304 | |
| His119Ala | n/a | 1.2 | ≤1000 | 304 | |
| His119Cys | 1.1 | 50 | 245, 304 | ||
| His119Asp | 8.6 | 38 | 25 | 245, 304 | |
| additional ligand: | |||||
| Thr199Cys | n/a | 1.1 | 0.0011 | 244, 332 | |
| Thr199Asp | n/a | 0.4 | 0.004 | 243 | |
| Thr199Glu | n/a | 0.4 | 0.0002 | 243 | |
| Thr199His | n/a | 0.2 | 0.08 | 243 | |
| indirect: | |||||
| Gln92Ala | 6.8 | 290 | 0.018 | 248, 269 | |
| Gln92Leu | 6.4 | 300 | 0.03 | 248, 269 | |
| Gln92Asn | 6.9 | 270 | 0.005 | 248, 269 | |
| Gln92Glu | 7.7 | 120 | 0.005 | 248, 269 | |
| Glu117Ala | 6.9 | 190 | 0.04 | 248, 269 | |
| Glu117Asp | 6.7 | 270 | 0.012 | 269 | |
| Glu117Gln | ≥9.9 | 0.02 | 4.4 | 252 | |
| Gln92Ala/Glu117Ala | 6.8 | 280 | 0.160 | 269 | |
| Thr199Ala | 8.3 | 11 | 0.06 | 269, 156 | |
See Figure 7 for explanation of nomenclature.
Refers to pKa(CA–ZnII–OH2+) (see sections 4.7 and 10).
Values for hydration of CO2 at pH 8.9.
Data not available or not applicable.
Because Thr199 is close to the ZnII ion (in the wild-type enzyme, Thr199 accepts a hydrogen bond from the zinc-bound hydroxide group), and because the surrounding polypeptide chain is flexible, Thr199 can be replaced with another amino acid capable of coordinating to the metal. Fierke and Christianson243,244,332 generated four such mutants: Thr199Cys, Thr199Asp, Thr199Glu, and Thr199His, with the first three having identical or higher affinity for ZnII than the wild-type enzyme. A Thr199Glu mutation, in particular, resulted in a very high affinity for binding of ZnII (Kd = 20 fM). The Thr199Glu mutant bound ZnII more tightly than the Thr199Asp mutant by 1 order of magnitude in Kd; this result emphasizes the significance of the distance of separation between the metal and the ligand. The lack of improvement in metal affinity with the Thr199His mutation is presumably due to rotation of the imidazole side chain away from the metal. Although all of these mutations eliminate the essential ZnII–OH group and, thus, the CO2 catalytic activity, these studies suggest principles useful in the de novo design of metal-binding sites of particularly high affinity.
6.2. Effects of Indirect Ligands
The data in Table 7 indicate that altering the residues directly chelating the metal in the active site results in a decrease in the catalytic activity of the enzyme by factors from 102 to 105. Indirect ligands—that is, those residues that interact with the ligands bound to the metal rather than with the metal itself—provide another option for modulating the properties of a protein or of an artificially designed binding site. There are three important indirect ligands in the binding site of CA; these amino acid side chains hydrogen bond to the imidazole group of His residues and to the hydroxide group (Figure 7): (i) Gln92; (ii) Glu117; and (iii) Thr199. Christianson and Fierke examined the effects of these hydrogen bonds on the thermodynamics and kinetics of metal binding, the pKa of the water molecule bound to ZnII, and the catalytic efficiency of HCA II.156,248,252,269
Substituting any of the indirect ligands with an Ala residue (Gln92Ala, Glu117Ala, Thr199Ala) decreased the affinity of the protein for ZnII by 1 order of magnitude. The investigators suggest that this effect is mostly entropic in origin: indirect ligands favorably preorient the metal-binding site and minimize the conformational change that the direct ligands undergo upon binding the metal. In addition to the favorable entropic contribution, indirect ligands also provide some electrostatic stabilization for the binding of the metal.289 The network of hydrogen bonds also plays a role in the kinetics of association of ZnII. Substituting residue Glu117 with Ala, Gln, or Asp reduces the rate of association with ZnII by a factor of 102–104.252,269
Changes in direct ligands have a greater effect on catalytic activity than do changes in indirect ligands: in contrast to mutations of direct ligands (which often practically abolish catalytic activity), the catalytic activity of indirect mutants persists with only a modest 10-fold loss in kcat/Km relative to the wild type (Table 7). An exception is the Glu117Gln mutation, which increases the pKa of ZnII–OH2+ and abolishes catalytic activity. Since the mutation is essentially isosteric with the wild-type side chain, the investigators attributed the loss of activity to four processes: (i) reversal of polarity of the hydrogen bond between His119 and residue 117, (ii) stabilization of the negatively charged histidinate ligand, (iii) elevation of the pKa of Zn-bound water, and (iv) elimination of the reactivity of ZnII.252 By site-directed mutagenesis, the investigators also determined the role of Thr199 in catalysis: via a hydrogen bond, Thr199 stabilizes the ground state ZnII–OH and the transition state of the reaction pathway.156 Removing the hydrogen bond by substituting Ala for Thr significantly reduced the catalytic activity.
These detailed studies of structure–function relationships of secondary ligands in an enzyme demonstrate the significance of position and orientation of side chains in the structure of the enzyme and of the level of optimization achieved by nature for a given catalytic function. Those who design artificial catalytic centers need to consider both the groups immediately and indirectly linked to the reaction site in order to achieve optimal binding and catalytic properties.
7. Physical-Organic Models of the Active Site of CA
Recreating the function of enzymes in small molecules is a way to test our understanding of the structural and mechanistic features of the enzyme. The wealth of information on carbonic anhydrase has stimulated multiple efforts to model its active site and to test hypotheses related to structure and catalytic activity of the enzyme and of molecules substantially simpler than the enzyme. Most work has focused on the most obvious part of the problem: that is, mimicking the ZnII–OH group to carry out the usual functions of CA—hydration of CO2 and the reverse dehydration of HCO3−, as well as hydrolysis of esters. Although this type of physical-organic chemistry is tangential to the central objective of this review, we include a brief overview. Several reviews exist that summarize the field of synthetic analogues of carbonic anhydrase and of other zinc enzymes.333–336
A successful small-molecule mimic of the active site of CA should preserve as many of the features of the protein as possible: (i) tetrahedral geometry of coordination of the ZnII ion to the molecule, with H2O of pKa ≈ 7 as one of the ligands; (ii) formation of 1:1 complexes between the small molecule and the metal; (iii) catalytic activity and pH profile of the enzyme; and (iv) binding of arylsulfonamides in the anionic form. Here, we summarize several examples that satisfy several of these criteria.
The groups of Vahrenkamp and Parkin developed a series of tris(pyrazolyl)borate complexes (Tp–ZnII–OH) as mimics of the active site of CA (Figure 8A).337–342 These tripodal ligands bind ZnII in a tetrahedral geometry and reduce the pKa of the fourth aqua ligand to ~6.5.343 More importantly, the hydrophobic pocket, created by the pyrazole rings and the substituents at the 3-position, prevents the zinc ion from bridging two molecules of the ligand or a proton from bridging two zinc-containing complexes.336,339 These complexes, however, are not water-soluble, and since water cannot be introduced into the solution as a reagent, these complexes react stoichiometrically with esters (or amides and phosphates) according to eq 9, rather than catalyzing their hydrolysis.344,345
Figure 8.
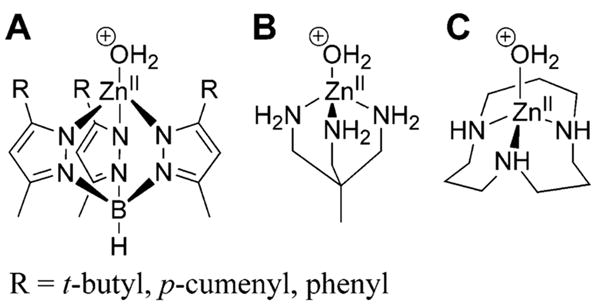
Examples of ZnII-containing metallo-organic models of the active site of CA: (A) tris(pyrazolyl)borate family of ligand, (B) 1,1,1-tris(aminomethyl)ethane, and (C) 1,5,9-triazacyclododecane.
| (9) |
Tp–ZnII–OH also reacts with CO2 to form a complex with a bicarbonate ion according to eq 10 (to parallel the native function of CA— hydrolysis of CO2):338,346
| (10) |
Using the Tp–ZnII–OH complex as a mimic of the active site of CA, the investigators were able to show unequivocally that it is only the deprotonated form of the ZnII–OH group that is able to carry out the catalysis of CO2.347 Protonation of Tp–ZnII–OH using simple acids always resulted in irreversible displacement of the aqua ligand by the counterion of the acid. The investigators, however, were able to protonate the Tp–ZnII–OH complex with (C6H5)3B(OH2) — a strong Brønsted acid that was unable to displace water due to steric constraints.348 The deprotonated form Tp–ZnII–OH, as expected, was in equilibrium with the bicarbonate as Tp–ZnII–OCOOH, while its conjugate acid Tp–ZnII–OH2+ showed no reactivity toward CO2.347,348
Sprigings and Hall reported a simple water-soluble tripodal complex of 1,1,1-tris(aminomethyl)ethane with ZnII (Figure 8B), with water of pKa = 8.0 as the fourth ligand.349 This complex exhibited enzyme-like Michaelis–Menten saturation kinetics during the hydrolysis of p-nitrophenyl acetate, but its second-order rate constant for the hydrolysis was 2 orders of magnitude lower than that of the native enzyme. The investigators did not report any kinetic study of the hydrolysis of CO2 by this compound.
Kimura and co-workers developed a series of macrocyclic polyamine ligands as mimics of hydrolytic metalloenzymes: specifically, 1,5,9-triazacyclododecane ([12]aneN3, Figure 8C) as a model of the active site of carbonic anhydrase.331,335,350,351 The investigators measured potentio-metrically the value of pKa to be 7.3 for the Zn-bound water in this complex; this value is very close to that found in CA II (~6.9 for BCA II, 6.8 for HCA II).331 Using either the tri(amine) or tetra(amine) macrocyclic scaffold, the investigators could vary the number of nitrogen ligands to ZnII from 3 to 4 and, thus, were able to demonstrate that increasing the coordination state of ZnII increased the value of pKa of ZnII–OH2+. Thus, they were able to show that the value of pKa of the ZnII–OH2+ group in the native protein is mainly determined by the coordination number of ZnII, rather than by the hydrophobic environment in the binding pocket.331 Kimura et al. also demonstrated that [12]aneN3, like CA, was able to catalyze the hydration of acetylaldehyde and hydrolysis of methyl acetate or p-nitrophenyl acetate, albeit with second-order rate constant 1 order of magnitude lower than those of BCA II. The pH profile of the rate of these reactions showed an inflection point near pH = 7.3, agreeing with potentiometric measurements for the value of pKa and indicating that the reaction mechanism involves a nucleophilic attack by ZnII–OH.331
The macrocyclic complex [12]aneN3 with ZnII also exhibited catalytic enhancement for the hydration of CO2 and dehydration of HCO3−, with a pH profile that showed that the deprotonated form [12]aneN3–ZnII–OH is the active species in the hydration reaction, while the protonated form [12]aneN3–ZnII–OH2+ is the active species in dehydration reaction, as in the native enzyme.351 The rate constant for hydrolysis of CO2, catalyzed by [12]aneN3–ZnII–OH (kcat, hyd ≈6 × 10³ M−1 s−1), is, however, ~4 orders of magnitude lower than the rate constant in the presence of CA (kcat/Km ≈107 M−1 s−1; see Table 1). The difference clearly indicates the importance of the hydrophobic pocket of the enzyme, which may help preassociate CO2 or facilitate the proton transfer.
Koike et al. also demonstrated the binding of sulfonamides (acetazolamide and others) as anions to [12]aneN3–ZnII–OH, with dissociation constants on the order of ~100 μM.350 Since, in this case, there are no effects of hydrophobicity or hydrogen bonding of the binding pocket of a protein, this value provides a measure of the strength of the ZnII–N bond between CA and sulfonamide. The lower dissociation constants of a CA–sulfonamide system (to low and sub μM) must, thus, reflect a hydrophobic component of binding (we discuss partitioning of affinities of sulfonamides to CA in greater detail in section 10). This mimic of CA by Kimura and co-workers, however, appears to be the most successful one as it satisfies many criteria of the native enzyme (i.e., coordination of the metal, solubility in water, pKa, activity, and sulfonamide binding).
In addition to the inorganic small molecule mimics of the active site of CA, there have been reports on using active sites of other proteins as templates for binding sites containing tetrahedrally coordinated ZnII.352–355 These approaches were based on the mutation of three native residues to His residues in order to approximate the tripodal geometry in CA. Although these studies demonstrated the affinity of these mutated proteins for ZnII and other divalent metal ions, the significance of these models has been solely structural—that is, no CA-type catalytic activity has been reported.
III. Using CA as a Model to Study Protein–Ligand Binding
Part 3 (sections 8–13) presents the use of CA as a model to study the thermodynamics and kinetics of protein–ligand binding in solution, at the surface of a solid, and in the gas phase. Section 8 presents the enzymatic and binding assays that have been useful in this effort. Sections 9 and 10 present the thermodynamics of CA–ligand binding. Section 9 presents an overview of the different ligands that bind to CA and the different approaches taken to discover those ligands. Section 10 focuses on the binding of arylsulfonamides (in particular, substituted benzenesulfonamides) and overviews the physical-organic chemistry of arylsulfonamide ligand design. It attempts to use the system of CA and arylsulfonamides as a model for the rational design of high-affinity ligands for proteins. Section 11 surveys the kinetics of binding of arylsulfonamides to CA in solution and presents models for the mechanism of association that are consistent with the data. Sections 12 and 13 discuss the kinetics and thermodynamics of binding of ligands to CA where one component is immobilized on the surface of a solid and where both components are in the gas phase, respectively.
8. Assays for Measuring Thermodynamic and Kinetic Parameters for Binding of Substrates and Inhibitors
8.1. Overview
Several assays have been used to study the interactions of CA with its substrates and ligands (Tables 8 and 9). CA has also been used as a model enzyme with which to develop new techniques for use with CA and other proteins (e.g., affinity capillary electrophoresis, sections 8.3.3 and 8.4.2). In this section, we discuss the most frequently used assays for determining the enzymatic activity of CA (section 8.2), as well as for the thermodynamics (section 8.3) and the kinetics (section 8.4) of the binding of ligands to CA. These assays measure the binding of ligands to CA directly or indirectly by measuring competitive binding or inhibition of the catalytic activity of CA. The most popular assays use the inhibition of the CA-catalyzed hydrolysis of p-nitrophenyl acetate (p-NPA) (sections 8.3.2 and 8.4.1) and the difference in fluorescence of CA when bound to dansylamide (DNSA, 133) and when bound to other ligands (sections 8.3.1 and 8.4.1) to determine the thermodynamics and kinetics of the binding of ligands to CA. We present the experimental details and results of these assays in sections 10–13.
Table 8.
Comparison of Techniques Used to Measure Binding to CA
| Technique | Observable | Advantages | Disadvantages | Useful range of concentration (M) | Ref |
|---|---|---|---|---|---|
| fluorescence | emission of light | high sensitivity | |||
| rapid measurements | |||||
| large dynamic range | |||||
| intrinsic | tryptophan residues | no chemical modification of CA or ligand is required | strong background | 5 × 10⁻⁵–10−8 (CA) | 366, 367, 458 |
| interactions may not alter the fluorescence of indoles | |||||
| extrinsic | extrinsic luminophores | excitation in the visible and near-UV regions | may require chemical modification of CA or the ligand | 10−2–10−10 (luminophore) | 317, 368, 373–375 |
| dansylamide competition | bound dansylamide | no chemical modification of CA or ligand is required | indirect observation of binding | 10−4–10−8 (competitor) | 180, 189, 368, 377, 378 |
| enables a large range of binding affinities to be measured | |||||
| spectrophotometry | UV/visible absorption | rapid | small dynamic range | 10−4–10−7 (chromophore) | 41, 269, 291, 296, 297, 301, 317, 390, 425, 612, 613 |
| shift in CoII absorbance | widely accessible | must use CoII in place of ZnII | |||
| hydrolysis of p-nitrophenyl acetate | CoII method directly measures binding | ||||
| pH stat assay | rate of NaOH addition needed to keep pH constant | no chemical modification needed | indirect observation of binding | 10−5–10−8 (CA) | 509, 517, 518 |
| widely accessible | |||||
| CDa spectroscopy | ellipticity due to the absorption of: | large concentrations required | |||
| far UV | peptide bonds | monitors changes in the secondary structure of CA | slow narrow dynamic range | 10−5–10−3 (amino acid residue) | 426–429 |
| near UV | aromatic residues | monitors changes in the tertiary structure of CA | slow | 10−5–10−3 (amino acid residue) | 426–429 |
| disulfide bonds | narrow dynamic range | ||||
| ICDb | extrinsic chromophore incorporated in asymmetric environment | good signal-to-noise ratio reflects binding affinity | limited by the optical density of the chromophore | 10−6–10−3 (chromophore) | 430 |
| ACEc | electrophoretic mobility | multiple isoforms can be studied at once | neutral ligands require competitive assays | ~10−6 (CA) | 391–398, 653 |
| calorimetry | generation of heat | information about enthalpy, entropy, and heat capacity | requires large amounts of protein | 405 | |
| ITCd | heat change during binding | constant temperature | high binding (i.e., Kd < ~ 10−10 M) cannot be measured directly | 10−3–10−9 | 182, 409, 412, 415 |
| measures enthalpy directly | |||||
| PACe | pressure wave generated from fast nonradiative decay of electronically excited chromophore | rapid measurement localized heating | requires presence of a chromophore | >~10−5 (CA) | 375, 418 |
| SPRf | change in refractive index at a surface upon binding | measures binding at a surface real-time observation | mass-transport issues | 10−3–10−8 | 412, 467, 468, 620 |
| kinetics and thermodynamics | |||||
| mass spectrometry | m/z | high resolution | qualitative | >~10−12 (CA) | 443–446 |
| small amount of sample | solvent-free environment can distort structure of CA | ||||
| fast | destroys sample | ||||
| magnetic resonance (NMR, ESR) | nuclear or electronic spin resonance | structural information | low sensitivity | >10−4 | 182, 270, 271, 273–277, 298, 377, 419–422, 424, 425 |
CD = circular dichroism.
ICD = induced circular dichroism.
ACE = affinity capillary electrophoresis.
ITC = isothermal titration calorimetry.
PAC = photoacoustic calorimetry.
SPR = surface plasmon resonance.
Table 9.
Techniques Used to Measure the Catalytic Activity of CA
| Technique | Observable | Advantages | Disadvantages | Ref |
|---|---|---|---|---|
| production of H+: | ||||
| pH indicator dyes | color/absorbance change | spectrophotometric detection | slow response | 17 |
| sensitive (±0.001 pH units) | some dyes inhibit CA | |||
| activity is pH-dependent | ||||
| pH electrodes | potential | sensitive (0.001 pH units) | activity is pH-dependent | 359, 360 |
| rapid (ms) | ||||
| requires small volumes | ||||
| pH stat | used in conjunction with one of the above methods | requires small volumes activity measured at constant pH | slow response | 357 |
| consumption of CO2: | ||||
| pCO2 manometer | volume change | slow | 362 | |
| cumbersome | ||||
| requires large volumes | ||||
| pCO2 electrode | potential | sensitive | slow (response time ≥ 10 s) | 358 |
| requires small volumes | ||||
| continuous-flow mixing apparatus | used in conjunction with one of the methods above | fast | expensive | 363 |
| stopped-flow apparatus | used in conjunction with one of the methods above | fast | expensive | 364 |
| calorimetry | heat of reaction | rapid (0.01 ms) sensitive (±0.00002 °C) | also measures the heat from dilution, fluid friction, and heat conduction to/from thermocouples | 365 |
| isotope exchange | disappearance of 18O | measures activity at constant pH | instrumentation (mass spectrometer) | 361 |
| sensitive (>0.1 nM) | ||||
| can measure activity inside cells | ||||
| magnetic resonance | 13C exchange ( ) causes 13C line broadening | lends structural information | instrumentation (NMR) | 48 |
| hydrolysis of 4-nitrophenyl acetate | absorbance change | spectrophotometric detection | measures rate of esterase activity, not hydratase | 356 |
8.2. Enzymatic Catalysis
Various assays measure the enzymatic activity of CA (Table 9).17,48,356–365 These assays fall into three main categories: (i) detection of the release of protons, (ii) measurement of the consumption of CO2, and (iii) observation of the esterase activity of CA. Carbon dioxide and carbonates are frequently used as substrates for measuring the enzymatic activity of CA. In addition to its hydration of CO2, α-CA displays esterase activity, which has led to spectrophotometric methods based on the hydrolysis of p-NPA (section 8.3.2).356
Since protons are released at physiological pH in the CA-catalyzed hydration of CO2, methods for measuring the change in the pH of the media are the basis for a simple assay of the catalytic activity of CA. These methods typically rely on measuring a change in pH using indicators or pH electrodes, or on keeping the pH constant by continuous titration (pH stat).357 Carbon dioxide electrodes are also widely used to measure the catalytic activity of CA.358
The use of stopped-flow spectrophotometry to measure the ionization state of a dye dramatically improved these methods.17 The use of pH electrodes avoids inhibition of CA by some dyes; both continuous-flow and stopped-flow mixing instruments can incorporate them.359,360
Silverman estimated the activity of HCA II and BCA II in intact cells using mass spectrometry to detect the exchange of 18O between CO2 and water at equilibrium.361 Alternatively, 13C NMR can assess the activity of CA by measuring the exchange of 13C between CO2 and .48
8.3. Thermodynamic Assays for Ligand Binding
The equilibrium dissociation constant (Kd) and the inhibitory constant (Ki) are among the most commonly used metrics for comparing the in vitro efficacies of the binding of small-molecule-based ligands to their macromolecular targets. In choosing a technique for measuring these constants, there are two main requirements: (i) the binding constant should be within the reliable dynamic range of the technique and (ii) a statistically significant change in the observable signal should occur upon binding. Table 8 provides a summary of techniques used for measuring binding constants of CA to various ligands. A brief description of these techniques follows.
8.3.1. Fluorescence and Luminescence Spectroscopy
The principal advantages of emission spectroscopy (fluorescence and phosphorescence) are its high sensitivity and large linear dynamic range (up to 12 orders of magnitude). A major limitation, however, is the requirement for a reporter molecule that has a large quantum yield of fluorescence or luminescence and that is sensitive to the binding event. Despite the advantages of fluorescence spectroscopy, there are relatively few reports that have used the intrinsic fluorescence of CA to measure the binding of ligands.302,366,367 The principal fluorophore in CA is the indole ring of tryptophan residues; it has an excitation wavelength of 280–290 nm (using 290 nm minimizes absorption by tyrosine residues) and a broad emission band of 330–350 nm (λmax = 336 nm).368 Because of differences in chemical environment, there is a large difference in the contributions of the individual fluorophores to the total emission of the protein. For example, 90% of the intensity of fluorescence of HCA II results from the radiative decays of Trp97 and Trp245.369 The substantially lower values of quantum yields of fluorescence of the other five tryptophans are due either to electron transfer to a nearby protonated histidine or arginine or to energy transfer to a tryptophan that is adjacent to a quencher.
A compound must alter (usually quench) the fluorescence of the tryptophans of CA in order to detect binding of that compound or a competitive compound to CA. The significant quenching of the fluorescence of apo-BCA upon binding CoII, CuII, and HgII (ZnII increases the fluorescent yield) demonstrates the sensitivity of the properties of the excited-state indoles to changes in their microenvironments.367 Kernohan studied four sulfonamide ligands (227–229 and 140) that, upon binding to BCA, quenched 58–84% of the fluorescence of its tryptophan residues.366 Direct titration of fluorescence is sufficiently sensitive that it can measure dissociation constants of ~10 nM. Kernohan used indirect techniques that employed competitive binding to study more strongly binding compounds that quench fluorescence. Indirect techniques are also suitable for measuring the binding properties of nonquenching ligands (e.g., 136–138).366
Measurements of phosphorescence quenching370,371 and delayed fluorescence372 are alternative emission techniques for investigating the binding properties of CA. The low quantum yields of phosphorescence, due to intersystem crossing and to the requirement for cryogenic conditions, diminish the practical importance of methods involving the triplet excited state.
Using extrinsic luminophores in emission assays increases sensitivity and allows the probe of interest to be selectively excited. Binding assays can make use of emissive probes that are (i) covalently bound to the protein, (ii) part of the ligand or competitor, or (iii) indicators for monitoring changes in the sample (e.g., pH) during an assay. Binding assays that employ fluorescent ligands are technically straightforward, easy to perform, and can achieve high sensitivity.317,368,373–375 The binding of DNSA (133) to BCA II results in (i) quenching of the tryptophan fluorescence, (ii) increasing the quantum yield of fluorescence of DNSA from 0.055 to 0.84, and (iii) blue-shifting the emission of DNSA from 580 to 468 nm.368 Banerjee et al. obtained similar results upon binding of other naphthalenesulfonamide derivatives to HCA I and HCA II.376 Simultaneous monitoring of any of these changes during the fluorescence titration improves the reliability of the recorded data and can result in expansion of the dynamic range of this method. Jain et al. reported the binding constant for dansylamide to BCA II as 0.38 μM,377 and Grzybowski et al. reported a Kd value of 0.83 μM for DNSA in its complex with HCA II.189 We recommend these values of Kd for binding studies with these isoforms.
The change in fluorescence intensity upon binding of CA by DNSA is the basis for a widely used competition binding assay, in which the ligand of interest is titrated into a sample of the CA–DNSA complex. The displacement of DNSA by the ligand of interest is monitored, as a function of the concentration of the ligand, by following the decrease in intensity of fluorescence at 460–470 nm upon excitation of the sample at either 280–290 nm (to excite the Trp residues of CA) or 320 nm (to excite directly the bound DNSA).180,189,368,377,378 This assay has all the benefits of fluorescence assays, with three additional advantages: (i) it requires no chemical labeling of the ligand or CA; (ii) it enables the measurement of dissociation constants as low as pM; and (iii) when the wavelength used for excitation is 280–290 nm, there is almost no background fluorescence.
An alternative emission assay involves monitoring the increase in fluorescence anisotropy of a fluorescent ligand upon binding to CA. Thompson et al. described an assay for the binding of ZnII ions to apo-HCA II that measured the change in the anisotropy of the emission of a fluorophore, ABD-M (134), that was added to the samples.379
Baltzer and co-workers reported an interesting example of the use of fluorescence to characterize the binding of a sulfonamide ligand to HCA II.380,381 They used a small helix-turn-helix peptide that was conjugated at one of its Lys residues to a p-hexylamidobenzene sulfonamide (similar to compound 28) and at another of its Lys residues to a dansyl group. Upon binding to HCA II via the sulfonamide group, the local environment around the dansyl group changed such that its fluorescence increased by 60–80%, depending on the peptide sequence. This study provides a unique method for the fluorescent sensing of proteins using synthetic constructs and demonstrates how CA can be used to develop new types of assays for protein–ligand recognition.
Binding assays can also use auxiliary fluorophores that are covalently bound to the enzyme. Viappiani observed quenching of the emission of fluorescein isothiocyanate (FITC)-labeled CA (unspecified isozyme) upon the addition of iodide.375 The measured binding constant from Stern–Volmer analysis was 0.2 M; this value is significantly higher than the Ki of 8.7 mM that Pocker and Stone measured (see section 9) for iodide using the inhibition of the BCA-catalyzed hydrolysis of p-NPA (section 8.3.2).157 More recently, Bozym et al. developed an assay to measure the intracellular concentration of exchangeable zinc at picomolar levels.382 This assay used a fluorescent label, Alexa Fluor 594 (AF594), covalently attached to apo-HCA II double mutant (Cys206Ser and His36Cys) via an engineered residue. Excitation at 365 nm, followed by fluorescent resonance energy transfer (FRET) to AF594 from a bound ligand, dapoxyl sulfonamide (this ligand binds to HCA II but not to apo-HCA II), leads to fluorescent emission at 617 nm from the AF594. Increased emission at 617 nm indicates the presence of zinc bound to HCA II.
8.3.2. Absorption Spectrophotometry
Although absorption spectrophotometry is less sensitive than fluorescence spectroscopy, absorption studies have the advantage that they do not require the chromophores to be fluorescent. The speed and widespread availability of absorption spectrophotometers make spectrophotometric assays convenient tools for screening large numbers of ligands.383,384 There are two major approaches used in spectrophotometric assays of CA: (i) the chromophore is an indicator of changing pH in the medium upon consumption of or CO2 by the enzyme; and (ii) the ligand contains a chromophore whose absorption (e.g., the wavelength of maximum absorption or the extinction coefficient at a particular wavelength) changes upon binding. The former approach has been a basis for kinetic assays using stopped-flow spectrophotometry.
A popular spectrophotometric assay that detects a change in pH uses the Brinkman approach, which has been widely commercialized.385,386 This method consists of adding CA to a solution that is saturated with CO2 and monitoring the change in the color of a pH indicator.387 The change in pH results from the enzymatic activity of CA. The indicator that Brinkman originally used was phenol red (pKa = 7.4), which changes color from red to yellow when the pH of the media drops below ~7.387 Coleman used bromothymol blue (pKa = 8.9) to monitor the change in the pH caused by CA-catalyzed hydrolysis.297
Another popular and convenient spectrophotometric assay measures the esterase activity of CA by monitoring the CA-catalyzed hydrolysis of p-NPA.269,291,296,297,301,302 The formation of p-nitrophenolate is monitored by the appearance of its absorption band at 410 nm. Wilson et al. used this approach to monitor the inhibition of BCA II by saccharin and o- and p-carbobenzoxybenzene sulfonamide.388
An important spectroscopic technique monitors binding of ligands to the CoII variant of CA by using the fact that the UV–visible spectrum of CoII is highly sensitive to changes in its coordination sphere and to changes in pH.291,301,302,389 This technique has the advantage that it monitors binding directly, rather than as a function of enzymatic activity. It has the disadvantages that the CoII metalloenzyme requires preparation and only indirectly represents the native protein.
While the p-NPA and CoII assays are the most commonly reported techniques for measuring binding, several other assays have been demonstrated. Difference absorption spectroscopy is a technique for measuring weak signals in samples with high optical density. King and Burgen studied the difference spectra of eight sulfonamide ligands bound to HCA I and HCA II, in which the reference sample was a solution of pure enzyme.390 Nguyen and Huc described an interesting approach for generating bifunctional ligands of BCA II using the binding site and the surface of the enzyme as a “mold” (see section 9.4).384 In this study, they used spectrophotometric high-performance liquid chromatography (HPLC) methods to monitor the affinities of various ligands to BCA II. McCall and Fierke developed spectrophotometric and fluorometric assays for measuring the concentration of metal ions in solution. These assays employed ligands (PAR and Fura-2) that had absorption and fluorescence properties that changed drastically upon chelation of various metal ions. The investigators used these assays to measure the affinity of apo-HCA II for NiII and CdII (see section 5).317
8.3.3. Affinity Capillary Electrophoresis
Affinity capillary electrophoresis (ACE) is a technique for measuring binding constants between proteins and ligands based on the difference in the electrophoretic mobility of the free protein and the ligand-bound protein.391–394 ACE can also separate chemically modified derivatives of CA to determine the role of electrostatics in the binding of ligands to proteins (see section 14.1). The electrophoretic mobility, μ (eq 11), of a molecule is proportional to its charge, Z, and inversely proportional to its molecular weight, M,395 where the exponent α relates the molecular weight of the protein to its hydrodynamic drag and CP is a proportionality constant.394,396–398 Equation 11 shows that a change in the electrophoretic mobility of the protein can be altered by a ligand that changes (i) the charge of the receptor, (ii) the hydrodynamic drag of the receptor, or (iii) both.
| (11) |
When CA binds to an arylsulfonamide, the change in the hydrodynamic drag of the protein is negligible, and the assay relies on having a charged ligand to produce a significant change in the charge of the protein–ligand aggregate and, thus, a change in the electrophoretic mobility of the receptor (Figure 9A). Experimentally, μ is measured by capillary electrophoresis and calculated using eq 12,394 where Ld and Lt are lengths of the capillary from the inlet to the detector and to the outlet, respectively; V is the applied voltage; tnm is the migration time of an electrically neutral, noninteracting molecule, used as an internal standard to monitor electroosmotic flow; and t is the migration time of the analyte.
Figure 9.
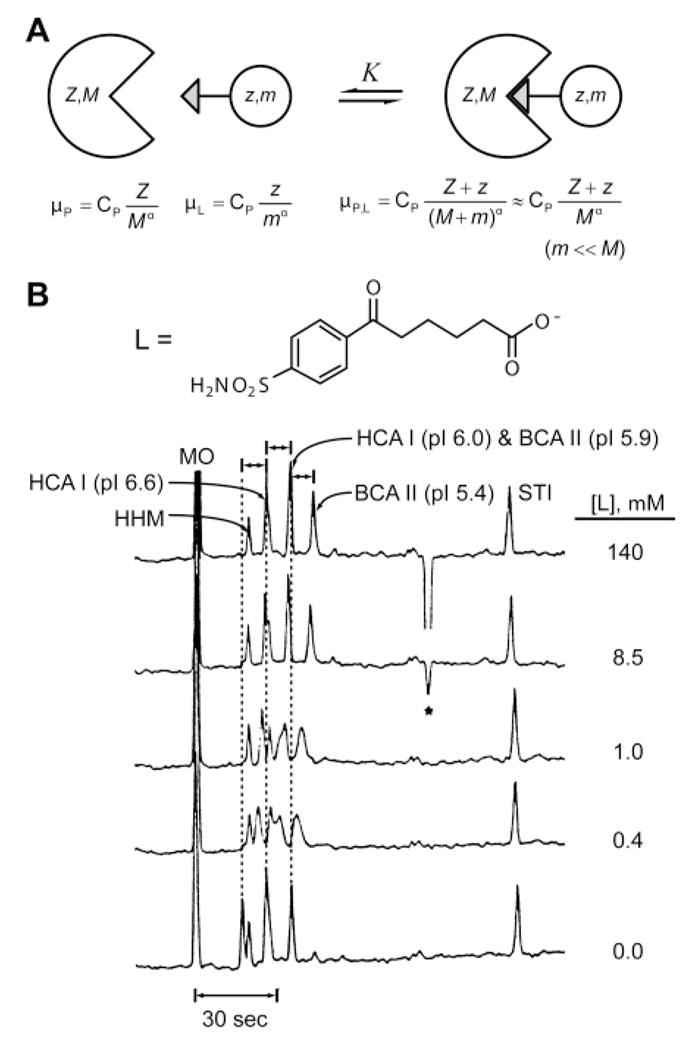
(A) Diagram sketching the species involved in an experiment comprising a receptor of molecular weight M and charge ±Z and a ligand of molecular weight m (m ≪ M) and charge z (both Z and z can be either positive or negative). (B) Electropherograms (by ACE) conducted on the mixture of isozymes of carbonic anhydrase: HCA I (pI = 6.6), HCA I (pI = 6.0), BCA II (pI = 5.9), and BCA II (pI = 5.4). An electrically neutral marker (mesityl oxide, MO) and two noninteracting proteins (soybean trypsin inhibitor (STI) and horse heart myoglobin (HHM)) were added to the mixture. Shifts in mobility were observed for the isozymes of carbonic anhydrase with increasing concentration of negatively charged ligand L (shown), while the mobility of noninteracting proteins remained constant. The dissociation constant Kd between BCA II and the ligand was determined to be 1.7 μM. Adapted with permission from ref 398. Copyright 1998 Wiley-VCH.
| (12) |
A Scatchard plot of ΔμP,L/[L] versus ΔμP,L results in a line with slope equal in magnitude to the binding constant, where ΔμP,L is the difference between the mobility of the protein (P) at a given concentration of ligand, [L], and the mobility the protein without the ligand.394,396–398
Determination of the binding constant of CA to neutral ligands requires a competitive binding assay because small neutral ligands do not cause a shift in the mobility of the protein. The competitive assay involves the addition of a neutral ligand to a sample of CA containing a fixed concentration of a charged ligand of known affinity. The mobility of CA is then a concentration-weighted average of the mobility of the complex of CA with the charged ligand and of the complex of CA with the neutral ligand. Scatchard analysis leads to the binding constant of the neutral ligand.
Figure 9B shows a set of ACE experiments with various isozymes of CA and a negatively charged sulfonamide. The elution time (and, thus, the mobility) of the protein increases with increasing concentration of ligand. The figure illustrates the ability of ACE to determine simultaneously values of Kd for multiple isoforms of CA. Another advantage of ACE is that it requires only small quantities of the protein (nanoliters of ~10 μM solution and tens of picograms of protein per run). ACE also does not require knowledge of precise concentrations of the protein because the assay is based on mobilities and concentrations of ligand, rather than on peak areas.
Affinity gel electrophoresis (AGE) is a technique similar to ACE. In AGE, a change in the migration of a protein through a slab gel is measured as a function of ligand immobilized in the gel.399 When compared to the capillary-based assay, AGE has a number of disadvantages, which include the necessity for (i) immobilized ligands in the gel, (ii) larger quantities of both the protein and the ligand than in the ACE assay, (iii) significantly longer times for analysis than required by ACE, and (iv) difficulty in numerical quantitation of values of Kd.
8.3.4. Calorimetry
Calorimetry is the only technique that directly measures the enthalpy of binding. Calorimetric measurements yield useful information about the contributions of enthalpy and entropy to binding, as well as about the effects of compensation between entropy and enthalpy.400–403 Flow- or batch-calorimeters are able to measure the binding of metals (see section 5)404 and sulfonamides (see section 10.6)405 to CA.
Differential scanning calorimetry (DSC) measures the temperature dependence of the heat capacity of a sample.406 DSC has proven to be a good technique for studying equilibria between folded and molten-globule conformations of BCA II.407 One disadvantage of using DSC for studies of binding is the difficulty in decoupling the unfolding process from the effects of temperature on the conformation of the protein.
Isothermal titration calorimetry (ITC) is the method of choice for conducting calorimetric binding assays.5,182,402,406,408–417 In an ITC experiment, a sample cell, which contains enzyme, and a reference cell are heated slightly and kept at a constant, equal temperature.408 As ligand is titrated into the sample cell, heat is produced from an exothermic binding event and is consumed by an endothermic binding event. The calorimeter compensates by providing less power (exothermic binding) or more power (endothermic binding) to the sample cell in order to keep the two cells at the same temperature. The power is integrated over time to provide the heat of the binding event, and normalizing this heat to the amount of ligand added gives the enthalpy (ΔH∘) of binding. Titrating the ligand over many aliquots results in a binding isotherm, from which the binding constant (Kd) and, thus, the standard free energy of binding (ΔG∘) are obtained. The entropy of interaction (ΔS∘) is given by eq 13.
| (13) |
ITC is capable of measuring the binding of metals (section 5)411 and ligands (section 10.6)409 to CA.
Photoacoustic calorimetry (PAC) is applicable to assays in which the binding of a ligand to CA results in a change in the ratio between the radiative and nonradiative rates of decay of electronically excited species that are part of either the enzyme or the ligand. The observable signal is the intensity of a pulse of pressure generated from a local heat gradient, which is formed when a chromophore decays nonradiatively after flash-excitation. Jain et al. used BCA and dansylamide to investigate the reliability of PAC for binding assays.418 They monitored the increase in the quantum yield of fluorescence of dansylamide upon binding to BCA and obtained a Kd for the BCA–dansylamide complex that was about one-half of the value measured for the same system by fluorescence titration.368 Similarly, the values for the dissociation constant of iodide to CA (unspecified isozyme) modified with FITC was about one-half of the value for the same constant measured by fluorescent emission assays.375 The origin of this discrepancy remains unclear, but it is, in any event, small relative to the uncertainties in many binding assays.
8.3.5. Magnetic Resonance Spectroscopy
Techniques based on magnetic resonance are useful for studying the solution-phase structure and dynamics of protein–ligand interactions, although these techniques have relatively low sensitivity and typically require the concentrations of the samples to be 100 μM or larger. Various nuclear magnetic resonance (NMR) studies—for example, 1H and 13C NMR,419 1H NMR with Ni–BCA II,420,421 3H NMR,270 15N NMR,276 19F NMR,182,271,273–275 and 111Cd NMR277—have determined the stoichiometry, coordination, and internal motion of ligands bound to CA. We present the details of these studies in section 4.4.2.
Anelli et al. used nuclear magnetic relaxation dispersion (NMRD) to study the binding of a GdIII–diethylaminetri-aminepentaacetic acid (DTPA) chelate, Gd–DTPA–benzenesulfonamide, to BCA.422 The investigators reported the NMRD profiles from plots of the relaxation time of the protons as a function of the strength of the applied magnetic field.
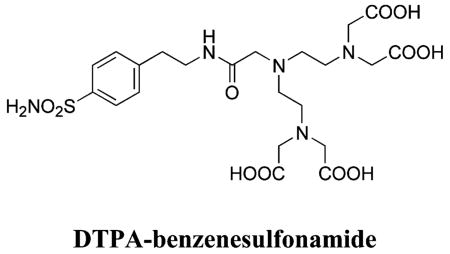
Cleland and Randolph used electron spin resonance (ESR) spectroscopy to observe the nonspecific, weak binding of PEG to BCA II in the molten-globule form, where either the PEG or the BCA II were spin-labeled.423 Two other groups have also used ESR with spin-labeled ligands (TEMPO-benzenesulfonamides) to study binding to CA.424,425
8.3.6. Circular Dichroism Spectroscopy
The rotatory strength of proteins is extremely sensitive to alterations in their secondary structure. Circular dichroism (CD) is, therefore, a useful tool for assaying binding.426–429 The optical activity of CA in the far-UV region (λ < ~230 nm) results from electronic transitions in the amide bonds, while absorption of the aromatic residues is responsible for the ellipticity observed in the near- and middle-UV (about 320 and 240 nm). Gianazza et al. reported an extensive study on binding of acetazolamide (137), dorzolamide (156), and methazolamide (138) to BCA II in the presence and absence of sodium dodecyl sulfate (SDS).427 Although the molar ellipticity of CA in the far-UV region is significantly higher than in the 300 nm region, the binding of ligands to CA leads to minor changes in the spectra in the 200–230 nm region; under the same conditions, the CD bands ~280–300 nm change not only shape but also sign.427 One must, however, approach the interpretation of such results with caution. Most arylsulfonamide ligands exhibit moderate or strong absorption in the near-UV region, and hence, the observed spectral changes may result from changes in either the environment of the aromatic residues or from the induced CD (ICD) signal of the ligand.
ICD can achieve high sensitivities because of the capacity to generate complexes with high molar ellipticities (~1 × 10⁵ deg cm2 dmol−1) in the visible region, where possible impurities in the samples would not have any optical activity. The sensitivity of CD spectrometers is higher in the near-UV and visible regions than in the far-UV. For example, Coleman reported the use of optical rotatory dispersion and CD spectroscopy to study the binding of the azo-chromophore 132 to ZnII and CoII derivatives of HCA I.430 The extinction coefficient of this dye at 500 nm is ~2.5 × 10⁴ M−1 cm−1, and the value of the molar ellipticity at 486 nm reached 105 deg cm2 dmol−1 upon binding to HCA I.
8.3.7. Mass Spectrometry
The analysis of proteins by mass spectrometry has been reviewed extensively.431–442 To study protein–ligand complexes in the gas phase, it is important to vaporize the complexes without dissociation and to dissociate them without destroying the protein (the mass of the protein must not be affected). The system of CA and arylsulfonamides has provided a model for studies of protein–ligand binding in the gas phase. We discuss the experimental data in section 13 and here only discuss the technical aspects of these experiments.
Electrospray ionization followed by Fourier transform ion cyclotron resonance mass spectrometry (ESI-FTICR-MS) allowed the generation and trapping of ions of CA II–ligand complexes (HCA II or BCA II).443–446 The relative intensities of BCA II–ligand complex ions gave the relative abundances of the BCA II–ligand complexes in the gas phase (and also in solution).443 Whitesides, Smith, and co-workers demonstrated that these BCA II–ligand complex ions could be completely dissociated by the application of an electromagnetic pulse in the presence of nitrogen gas molecules.443,444 This process generated free ligand ions, which could be quantified to determine the relative abundances of the precursor protein–ligand complex ions. The investigators also demonstrated that sustained off-resonance irradiation CID (SORI-CID)—the application of an electromagnetic pulse with a frequency lower than the cyclotron frequency of the protein in the presence of nitrogen gas—induced the loss of some of the ligands from the protein–ligand complex ions, in a manner that scaled with the intensity of the pulse.445,446 The intensity of the pulse that generated equal ion intensities for the CA II–ligand complex and free CA II was termed E50 and was used to compare the relative stabilities of different CA II–ligand complexes in the gas phase.445,446
8.4. Kinetic Assays for Ligand Binding
8.4.1. Fluorescence and Absorbance Spectroscopy
The earliest experiments to determine the kinetics of CA measured the rate of CO2 hydration either directly, by monitoring the absorption of gas in a sealed container,447–449 or indirectly, by measuring the change in pH of the solution.450–452 Binding of a ligand is measured by a change in the rate of hydration of CO2 in the presence of the ligand. Many studies used stopped-flow methods with a pH indicator to increase the accuracy of the measure of the rate of hydration.296,299,300,307,453,454
Pocker and Stone reported that BCA acts as an esterase and measured the hydrolysis of p-NPA by monitoring the absorption of the product, p-nitrophenolate, at 400 nm (ε ≈2.1 × 10⁴ M−1 cm−1).455 Using this technique, Pocker measured the kinetics of binding of many ligands by determining the decrease in esterase activity as a function of time.38,157,456,457
Other stopped-flow experiments, based on fluorescence quenching of tryptophan residues, have been used to measure the kinetics of binding of sulfonamides to CA directly (see section 11 for further discussion).389,390,458 Any sulfonamide with spectral transitions overlapping the tryptophan emission band is an effective quencher of the native fluorescence of the protein. The binding of these sulfonamides, including the azo-sulfonamides, DNSA (133), and many nitro- and aminosulfonamides,368,390,458 leads to a decay in fluorescence intensity as a function of time; this decay is a direct measure of ligand binding. If a ligand does not quench the enzyme fluorescence sufficiently, the kinetics can be determined by competition with either p-nitrobenzenesulfonamide (3) or DNSA.368,389
Ligands with much more rapid kinetics of binding have been studied using temperature-jump relaxation, which exploits the absorbance of CoII–BCA II.291 Joule heating induces a sudden increase in the temperature of the analyte mixture, after which the absorption of CoII at 599 nm is measured as a function of time. In the absence of ligand, the absorption of CoII–BCA II has an intrinsic relaxation rate on the millisecond time scale. Hence, this technique is appropriate only for ligands with relaxation rates faster than milliseconds, including cyanate, thiocyanate, and cyanide. It is not clear what causes the millisecond relaxation because the molecular details of this intrinsic relaxation have not been reported.
8.4.2. Affinity Capillary Electrophoresis
Section 8.3.3 outlined the principles of ACE. The binding constants of a charged ligand (or an uncharged ligand in competition with a charged ligand) can be determined by measuring the change in mobility of a protein as a function of the concentration of ligand(s). In addition to determining binding constants, ACE can, in some circumstances, be used to determine the on- and off-rates of complex formation.392 If the off-rate is comparable to the time required to obtain the electropherogram, the peaks in the electropherogram shift and broaden as the concentration of a charged ligand increases, until the protein is saturated with ligand. The broadening of peaks is due to equilibration between species with different electrophoretic mobilities (free and complexed protein). At saturating concentrations of ligands, in which all of the enzyme has bound ligand, the peak narrows again. The broadening is most pronounced when the dissociation time is of the same magnitude as the migration time of the protein. Therefore, ACE can be used only to analyze the kinetics of ligands with a dissociation time similar to the migration time, typically where koff ≈ 0.01–0.1 s−1. Fitting the displacement and shape of the peak in the electropherogram gives the rate constants of association (kon) and dissociation (koff). The values of kon and koff are constrained to give the experimentally obtained binding constant (Kd).
8.4.3. Surface Plasmon Resonance Spectroscopy
Surface plasmon resonance spectroscopy (SPR) measures the rates of molecular association (kon) and dissociation (koff) at surfaces—provided that the rates are not mass-transport limited—and the thermodynamic dissociation constant, Kd. The dependence of binding on temperature must be determined in order to separate ΔG∘ into ΔH∘ and ΔS∘ (see section 10). SPR is based on the measurement of the intensity of monochromatic, plane-polarized light reflected from the backside of a semitransparent, gold-coated glass slide (Figure 10a). The reflected light has a minimal intensity at a specific angle of incident light, θm. The instrument monitors θm as a function of time while the surface is treated with an analyte. Changes in θm correlate to changes in the refractive index at the interface between the gold surface and the solution; the distance from the surface at which the change occurs is within approximately one-quarter wavelength of the incident visible light.459,460 For a family of compounds (e.g., proteins), changes in θm correlate linearly with the mass of compound adsorbed per unit area of the surface.461,462 For proteins, a change in θm of 1° corresponds to an adsorption of ~10 ng mm−2.463
Figure 10.
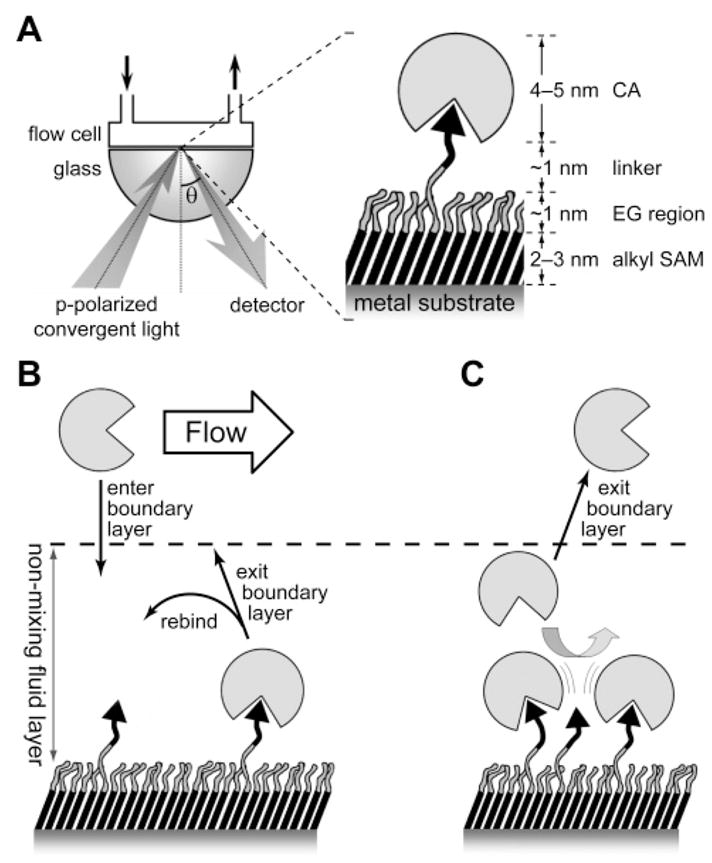
Measuring the binding of CA to self-assembled monolayers using surface plasmon resonance: (A) schematic of the apparatus and the overall molecular structure at the solid–liquid interface, (B) effects of mass transport on measurements of binding, and (C) effects of lateral sterics on binding of CA at densely populated surfaces.
Instruments for SPR464 are capable of measuring values of kon (103–107 M−1 s−1) and koff (10−6–10−1 s−1) at temperatures between 4 and 40 °C.465 The corresponding equilibrium dissociation constant, Kd (10−13 – 10−4 M), can be determined by calculating the ratio koff/kon or by constructing a Scatchard plot to values of θm at different concentrations of ligand.
The two types of model surfaces commonly used for studying protein–ligand interactions (especially by SPR) are as follows: (i) commercially available dextran-coated substrates466 and (ii) self-assembled monolayers (SAMs) of alkanethiolates on gold or palladium.467–473 The dextran-coated surfaces are convenient to use, but they have disadvantages, including (i) the influence of the gel on mass transport of the analyte, (ii) rebinding of analyte molecules that become “trapped” in the gel environment, (iii) exclusion of macromolecular analytes from the gel matrix, and (iv) nonspecific binding.469,474
Exposing a clean, gold surface to a solution of alkanethiols forms SAMs. These compounds are bound to the gold surface as alkanethiolates with their ω-terminal functional group oriented into the bulk solution. This functional group defines the interface between the solid and the solution. SAMs of alkanethiolates on gold have three characteristics that make them particularly well-suited to the study of protein–ligand interactions at surfaces. SAMs (i) allow flexibility in both the composition and reactivity of the surface,467,468,474–480 (ii) can be designed to resist the nonspecific adsorption of proteins,481–486 and (iii) provide excellent compatibility with the techniques of SPR467,468,487–490 and quartz crystal micro-balance (QCM).489,491
SAMs presenting oligo(ethylene glycol) are particularly important in studies of protein–ligand interactions at surfaces, since they effectively resist the nonspecific adsorption of proteins and cells481,483–485 and provide an excellent baseline against which the specific binding of proteins to surface-bound ligands,467–469,492 or the nonspecific binding of proteins to hydrophobic sites, can be measured.493
8.5. Most Convenient Assays
As an aside, to researchers new to this area, our experience suggests that the most convenient assays for thermodynamic binding studies are the dansylamide displacement assay (section 8.3.1) and the inhibition of CA-catalyzed hydrolysis of p-NPA (section 8.3.2), and, if the ligand is charged, affinity capillary electrophoresis (section 8.3.3). For kinetics, we find that SPR (section 8.4.1) and stopped-flow fluorescence spectroscopy (section 8.4.1) are the most convenient.
9. Structure–Activity Relationships for Active-Site Ligands
9.1. Overview of Structure–Activity Relationships
CA has been a therapeutic target for many years, as gauged by the considerable effort focused on developing high-affinity inhibitors of CA and the more recent development of activators of CA. Activators of CA (e.g., L- and D-histidine,190–192 L- and D-phenylalanine,193 β-Ala-His,494 histamine,194 tri- and tetrasubstituted pyridinium azole compounds,495,496 and L-adrenaline226) bind to the entrance of the active site (near His64) and increase kcat for the hydration of CO2 by enhancing the activity of the proton shuttle (see section 4.6). We will not focus on activators in this review because Supuran and co-workers have comprehensively reviewed them.497–499 In addition, the development of inhibitors of CA has been well-reviewed elsewhere.2,15,500–502 Previous reviews on inhibitors of CA have focused mainly on in vivo activity, as determined by the effect of topically administered inhibitors on the reduction in intraocular pressure. We focus here on in vitro approaches that develop tight-binding (low Kd) sulfonamide inhibitors. In this section, we discuss relationships between the structure of an inhibitor and its affinity, and in section 10, we discuss the use of CA as a model for physical-organic studies in the design of ligands.
We classify the myriad inhibitors of CA into three main groups: (i) sulfonamides (R–SO2NH2), (ii) other sulfonic acid derivatives (R–SO2–X, X ≠ NH2), and (iii) small monoanions (e.g., halides, azide, and thiocyanate). The sulfonamides and sulfonic acid derivatives have values of Kd in the picomolar to micromolar range, whereas the inorganic monoanions bind CA with values of Kd in the micromolar to millimolar range. We describe each class of inhibitors in more detail below, with representative examples listed in Table 10 (see also refs 157, 181, 182, 185, 189, 199, 200, 214, 216, 225, 227, 229–233, 284, 366, 368, 377–379, 384, 389, 392, 413, 415, 417, 430, 458, 503–523). Although this table contains many structures, it is not a comprehensive listing of inhibitors for CA: those compilations are elsewhere.2,15,500,501 Instead, it lists compounds, and families of compounds, that are (in our opinion) particularly relevant to understanding the physical-organic chemistry of CA–ligand binding: What ligands bind tightly and why? What is the mechanism of association and dissociation?
The structure of a sulfonamide inhibitor can be divided into four parts (Figure 11). Each part can be varied in structure independently, and each has an important characteristic or functionality that can modulate the affinity of the ligand for CA. Perhaps the most significant region of the molecule is the sulfonamide head group, which binds as the RSO2NH−monoanion to the ZnII ion in the active site of CA.276 Deprotonation of the sulfonamide is, therefore, necessary for binding, and so the pKa of the sulfonamide group often correlates with the rate constant of association and with the equilibrium dissociation constant for binding to CA. This relationship is particularly strong within classes of similar compounds and is elaborated in section 9.2.2.389
Figure 11.
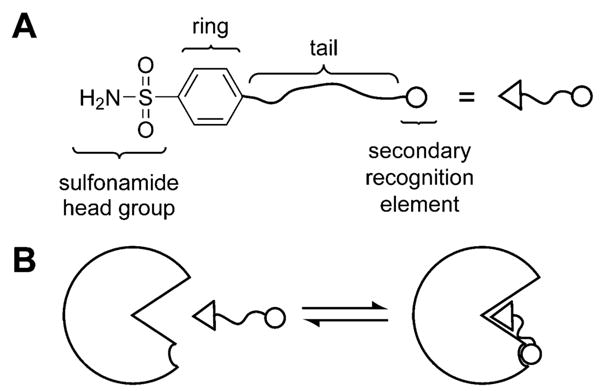
Binding of arylsulfonamide to carbonic anhydrase (CA). (A) Structure of a general arylsulfonamide ligand showing the structural features that can be modified (to a first approximation) independently. (B) The interactions between the different structural components of a general arylsulfonamide ligand and CA.
In addition to aromatic sulfonamides, there are now several examples of powerful aliphatic sulfonamide and sulfamate inhibitors. Typically, however, the group attached to the sulfonamide is a 5- or 6-membered aromatic ring or fused ring system, often containing nitrogen, oxygen, and/or sulfur heteroatoms.2 In order to modulate the properties of the inhibitor (such as pKa and solubility), many functional groups have been conjugated to the aromatic rings; these groups are often called “tails”.
Tail groups may vary in length from 1 to 100 Å and may affect the in vitro and in vivo activity of the inhibitor by changing the solubility, flexibility, polarity, and biocompatibility of the compound.2 Additionally, tails may be used as linkages to secondary recognition elements (SREs), which target sites on the protein that are adjacent to the primary binding site. This approach can significantly modulate the affinity of an inhibitor by effectively creating a bivalent ligand (see section 10). In addition, tails have been used as a convenient variable region in several combinatorial studies of sulfonamide inhibitors.
9.2. Thermodynamic Binding Data
We divide the many approaches to developing inhibitors of CA into four categories: (i) lead-based design, (ii) combinatorial approaches, (iii) rational design, and (iv) computational approaches. Lead-based design, which is the most common approach in the development of pharmaceuticals, uses particularly active compounds—that is, leads— as the starting point in an iterative process of varying the structure of the lead and selecting, from the small library resulting from this variation, new lead compounds that have improved properties (e.g., efficacy in predictive disease models, profile of absorption, distribution, metabolism and excretion (ADME), and toxicity). This approach has been applied successfully to the development of sulfonamide-based inhibitors of CA.
9.2.1. Inhibitors with Aromatic Rings
In 1940, Mann and Keilin observed that sulfanilamide (4) can inhibit CA.524 This compound was the early lead in the eventual development of the four systemic drugs now used for the treatment of glaucoma: acetazolamide (137), methazolamide (138), ethoxzolamide (140), and dichlorophenamide (136) (see Table 10). A common approach used in the early design of sulfonamide-based inhibitors involved modifying the aromatic ring system attached directly to the sulfonamide group. Supuran and co-workers coined this tactic the “ring approach”, and they provide an excellent review of the clinical relevance of ~500 compounds generated using the ring and tail approaches.2 The phenyl moiety of sulfanilamide has been changed to many different rings, including furan (142), thiophene (145), thiadiazole (137 and 138), indole (141), benzofuran (143), benzothiophene (149), benzothiazole (140), thienofuran (144), thienothiophene (149 and 150), thienothiopyran (152, 153, 156, 157, 160, 161, 163, and 164), and thienothiazine (166). Table 10 includes representative compounds from each of these classes that were among the most effective inhibitors of CA. It is clear from this list, and the references included therein, that most of these compounds tested were bicyclic, contained at least one sulfur atom, and had similar, nanomolar dissociation constants but different in vivo activities. Affinity, therefore, is not the primary factor in developing an effective therapeutic; essential criteria also include, among other factors, pKa, hydrophobicity, and solubility (and other properties that contribute to ADME/TOX/PK/PD).
Although the systemic drugs, 136–138 and 140, were effective antiglaucoma agents, they inhibit several CA isozymes in tissues outside of the eye and cause wide-ranging side effects. Topical antiglaucoma agents circumvent this shortcoming. Compound 140 was the lead used to develop the two topical antiglaucoma agents, dorzolamide (157) and brinzolamide (161). HCA II was the primary target of inhibition because it is the critical CA isozyme that controls the secretion of ocular aqueous humor.2,525 In section 9.2.4, we describe attempts to develop isozyme-specific inhibitors.
9.2.2. Sulfamates and Non-aromatic Sulfonamides
While initially it was believed that only aromatic sulfonamides could serve as potent inhibitors of CA,500 it was discovered subsequently that a “spacer” between the sulfonamide moiety and the ring could be incorporated into tight-binding inhibitors. The tight binding of zonisamide (278) to HCA II (Ki = 35 nM) demonstrates that the aryl ring of a sulfonamide inhibitor can also be separated from the sulfonamide moiety by a methylene group.231 In another example, a series of aryl sulfamates (183–185, compounds of the type R–O–SO2NH2 where R represents a substituted benzene ring) was synthesized and gave values of IC50 in the range of 40–100 nM.504 Contrary to results with substituted benzenesulfonamides, the meta-substituted sulfa mates (184 and 185) were more potent inhibitors than their para-substituted analogues (183) (Table 10). In the same study, aryloxyalkyl sulfamates (compounds of the type R–O–CH2CH2–O–SO2NH2, e.g., 185), in which methylene units intervene between the aryl ring and the sulfamate, gave compounds with roughly the same values of Ki as did the aryl sulfamates (cf. 185 and 184; Table 10).
More recent examples of aryl sulfamates (EMATE, 186; 2-MeOE2bisMATE, 186a; RWJ-37947, 187; topiramate, 187a; 667-coumate, 250; 251; and 252) were crystallized with HCA II.128,216–218,230,233 Although the values of Ki for EMATE (10 nM) and topiramate (5 nM) were similar, these two sulfamates bound with different geometries in the active site of HCA II.230,233,523 Whereas topiramate made several hydrogen bonds to the hydrophilic face of the active site,233 EMATE bound entirely to the hydrophobic wall (Val121, Phe131, Val135, and Pro202).230 Interestingly, although 2-MeOE2bisMATE (186a) is similar in structure to EMATE (186, see Table 4), and although ionization of the sulfamate on the aryl ring is more favorable than ionization of the sulfamate on the cyclopentyl ring, 186a binds to HCA II by means of the sulfamate on the cyclopentyl ring (presumably because of steric interactions between the enzyme and the methoxy group on the aryl ring of 186a).128
EMATE and 667-coumate bind to HCA II with similar geometries, but the ZnII–N bond is 0.36 Å shorter in the EMATE–HCA II complex.217 The short ZnII–N bond (1.78 Å) with the sulfamate nitrogen atom of EMATE, contrary to most substituted benzenesulfonamides (1.9–2.15 Å), may contribute to the high affinity of EMATE for HCA II.230 A similarly shortened ZnII–N bond exists for compounds containing fluorinated benzene rings 55, 57, 210, and 211, as well as the tight-binding compound 110 (Kd = 0.23 nM).180,182,189
The next step in violating the conventional dogma for inhibitors of CA was the complete removal of the aromatic moiety. Supuran and co-workers investigated the binding of sulfamic acid (192, Ki = 0.39 mM, HCA II) and sulfamide (279, Ki = 1.13 mM, HCA II) to HCA I, HCA II, BCA II, and BCA IV,228,233,413,519 and, more recently, of N-hydroxy-sulfamide (280, Ki = 566 nM, HCA II) to HCA I, II, IX, and XII.227 X-ray structures of these compounds with HCA II show new hydrogen bonds (not observed with aryl sulfonamides) in an intricate hydrogen-binding network between the inhibitor, enzyme, and solvent molecules.227,228 Tight binding to HCA I and II is restored for arylsulfonyl-and arylsulfonylureido-derivatives of sulfamates and sulfamides.228,526 Many of these derivatives bind more tightly to some isozymes than do the arylsulfonamides with the same aromatic moiety.527 Some derivatives have a higher affinity for HCA I than for HCA II; thus, arylsulfamates and arylsulfamides may be useful as isozyme-specific inhibitors (see section 9.2.4).
Scholz et al. first characterized trifluoromethanesulfonamide (188) as an inhibitor of HCA II.505 The surprising result was that this relatively simple molecule had a very high affinity (IC50 = 13 nM, Kd = 50 nM). The result was all the more astonishing given the low affinity of methane-sulfonamide (189) (IC50 = 70 μM). The greater potency of the fluorinated sulfonamide 188 was attributed to the fact that it has a much lower value of pKa than does 189 (6.3 vs 10.8) (current understanding of the high affinity of 188 also includes contacts between the trifluoromethyl group and the enzyme; see section 10.3.4). Further work by Maren et al. found a linear dependence between log Ki and pKa across a number of fluorine- and chlorine-substituted methanesulfonamides528 (Figure 12). Such a trend had been found previously for the para-substituted benzenesulfonamides.503 The dependence of affinity on pKa is discussed in detail in section 10.3.
Figure 12.
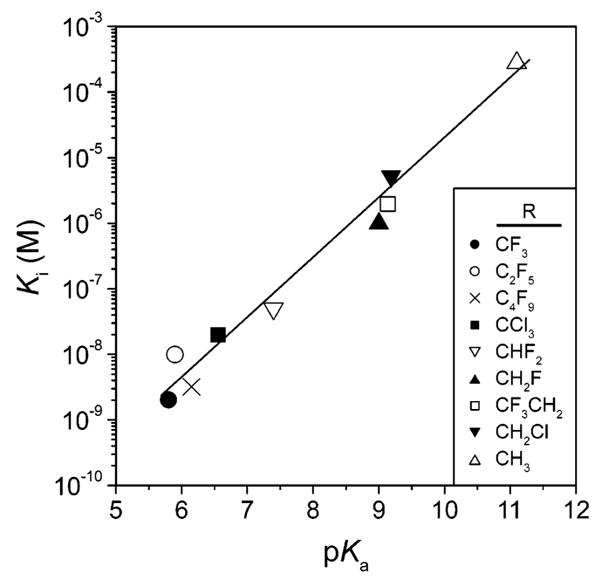
Linear dependence between Ki (on a logarithmic scale) and p Ka for a series of halogen-substituted unbranched aliphatic sulfonamides (R–SO2NH2). Data taken from ref 528.
Scholz et al. suggested a more extensive, quantitative structure–activity relationship (QSAR) to describe the binding of aliphatic sulfonamides to HCA II.505 In their model, inhibitory activity is determined by the inductive effects of substituents vicinal to the sulfonamide moiety (these substituents presumably influence the pKa of the sulfonamide) combined with the steric bulk of these substituents (steric repulsion in the congested active site region near the ZnII cofactor). The third term in the QSAR represents an increase in affinity with increasing hydrophobicity (log P) of the aliphatic chain attached to the sulfonamide. Increasing the hydrophobicity of the chains was hypothesized to increase the interaction of the inhibitor with the hydrophobic wall of the active site of the enzyme (see section 4) and, thus, to contribute to the stability of the complex. The influence of log P and hydrophobic surface area on affinity are discussed in detail in section 10.4.
9.2.3. Tail Approach
The “tail approach”—a term coined by Supuran and coworkers2—is an approach to the development of leads that is complementary to the “ring approach” described in section 9.2.1. The goal of this approach was to increase aqueous solubility at neutral pH in order to obviate the clinical side effects of such inhibitors as dorzolamide, which are only soluble in acidic media. It involved the derivatization of well-characterized aromatic sulfonamides with ionizable moieties, such as secondary or primary amines or carboxylates. The intent of this approach was to optimize characteristics required for applications in vivo (e.g., to ensure penetration via the cornea for topical therapeutic applications) and so is outside of the scope of this review. We, therefore, present only a few comments here.
The first example of this approach involved modifying the exocyclic acetyl group of acetazolamide by the attachment of a variety of amino acids.529 Antonaroli et al. adopted a similar approach but utilized dioic fatty acids as their acylating agents.530 Values of Ki on the order of low micromolar were observed in both cases. Supuran et al. developed this approach by using a range of ionizable moieties and precursor molecules and by characterizing the inhibitors using in vivo models. This material has been reviewed elsewhere.2,15
9.2.4. Isozyme-Specific Inhibitors
When targeting isozymes other than HCA II, most of the side effects of the clinically used sulfonamides—for example, acetazolamide (137), methazolamide (138), ethoxzolamide (140), dorzolamide (157), and brinzolamide (161)—are probably due to inhibition of HCA II; many tissues and organs, in which targeting HCA II may be undesirable, contain large amounts of this isozyme.15 It is, therefore, desirable to design inhibitors that bind more weakly to HCA II than to other isozymes. The high degree of sequence and structural homology among HCA I, II, and IV (see section 4) has made the synthesis of isozyme-selective inhibitors very difficult. The initial generalization (from the use of HCA I and BCA II and IV)531 that sulfonamides appear to bind more tightly to CA II and IV than to CA I, while inorganic anions seem to bind more tightly to CA I than to CA II and IV, seems to hold.2 HCA II and BCA IV show remarkably similar affinities to inhibitors.528 Distinguishing between these two major drug targets (specifically, HCA II and HCA IV) has, therefore, proven particularly difficult; attempts to design inhibitors selective for CA IV over CA II are presented briefly here.
Given their extensive structural homology, including a similar orientation of His64 in the proton shuttle (see section 4.6), the most successful approaches to designing inhibitors capable of differentiating between CA II and IV have involved exploiting their different subcellular locations. CA II is a cytosolic protein, while CA IV is membrane-associated, with its active site oriented toward the extracellular space. Thus, membrane-impermeable inhibitors should be capable of inhibiting CA IV without affecting CA II. This possibility has been realized both in vitro and in vivo by using polymeric532,533 and cationic2,7 sulfonamides.
Isozyme-specific inhibitors may also be useful for targeting isozymes involved in tumorigenesis (such as HCA IX and XII)88,534 or in lipogenesis (HCA VA and HCA VB).27,535 Supuran and co-workers employed sugar tails (e.g., 124–130) to design sulfonamides that were water-soluble and specific for isozyme IX.510,536 Winum et al. investigated the inhibition of 10 isozymes of HCA by the sulfamide analogue (187b) of topiramate (187a).232 Compound 187b was a less potent inhibitor of HCA II than 187a (by a factor of ~102) but effectively inhibited isozymes VA, VB, VII, XIII, and XIV (with Ki values in the range 21–35 nM). The X-ray structure of 187b with HCA II showed that its weak inhibition of HCA II was due to a clash between a methyl group of the inhibitor and Ala65, which is a residue unique to HCA II139 (e.g., the corresponding residue is Ser in HCA I,239 IV,224 VB,537 VII,538 IX,539 XII,210 and BCA II;147 Thr in HCA III,242 VI,540 and VIII;541 and Leu in HCA VA;537 see Table 4 for the PDB numbers of HCA I–IV and XII and Table 3 for BCA II). Other compounds may, therefore, be designed to have a low affinity for HCA II by exploiting this interaction.
9.2.5. Inhibition by Small Monoanions
Simple monoanions can inhibit CA, although more weakly than arylsulfonamides (192–205, Table 10). These studies are important not only for understanding protein–ligand interactions but also for knowing how anions present as constituents in the buffer medium may influence binding studies. Roughton and Booth first showed that small inorganic anions could inhibit CA.448 In 1965, Kernohan reported the use of stopped-flow fluorescence to measure the kinetics of the binding of Cl− and NO3− to BCA II as a function of pH.299 Lindskog examined a larger series of anionic inhibitors (F−, Cl−, Br−, I−, NO3−, and NCO−) of CoII–BCA II using the CO2 kinetic assay and spectrophotometric titrations.301 Prabhananda et al. reported values of Kd, determined by spectrophotometric titration, for CoII–BCA II binding to NCO−, SCN−, and CN−.291
Pocker et al. reported values of Kd for a large series of small, anionic inhibitors, and these values are listed in Table 10.157 X-ray structural data (Table 4) show that most anions (e.g., Br− and N3−,195 I−,196 HS−,197 HCO3−,198 HSO3−,184 H2NSO3−,228 SO42−,183 and foscarnet (− O2C–PO32−)225) displace the ZnII-bound water and bind to the ZnII cofactor in a tetrahedral geometry, whereas SCN−186 and NO3 −197 do not displace the water. These two anions expand the coordination sphere of the ZnII cofactor and bind to ZnII in a distorted pentagonal geometry (see section 4.6). A trend in the values of Kd for the halides favors binding of the largest, most polarizable, least strongly solvated ion, iodide. The obvious outlier in the series, CN−, is the best σ-donor of all the compounds listed, and although d10 metals are relatively poor electron donors, the cyanide ligand is also the strongest π-acceptor in the series. Moreover, due to the strong ligand field of the CN− ion, two equivalents can bind to the ZnII cofactor and distort the tetrahedral geometry.291
Studies of protein–ligand interactions are typically performed in buffered solution. The binding data discussed in this section indicate that the identity and concentration of the small, anionic component(s) of the buffer are important in the analysis of binding constants and X-ray structures (see section 4.3). In a buffer containing a concentration of inorganic anion that approximates or exceeds its Kd, one must consider the binding of a ligand, such as an arylsulfonamide, to be a competition reaction—that is, the observed equilibrium involves exchange of inorganic anion with sulfonamide anion.
9.2.6. Derivatives of Arylsulfonic Acids
Binding of the sulfonamide group, R–SO2NH2, as its anion, R–SO2NH−, to the ZnII ion in the binding site of CA has been the basic foundation for the design of CA inhibitors for over 50 years.542 Other functional groups are, however, not only possible but moderately effective. Supuran and coworkers have explored a wide range of alternative arylsulfonic acid derivatives of formula R–SO2–X (168–179, Table 10), and they have reviewed this topic elsewhere.2 Among the R = p-MePh series, the most potent inhibitor of HCA II was X = NHCl with Ki = 2.1 μM.519 Although these compounds are relatively weak inhibitors of CA, they were used as leads to develop numerous nM inhibitors of HCA II (138–140, Table 10). In contrast to sulfonamide-based inhibitors, which have little isozyme selectivity, numerous sulfonic acid derivatives showed significant selectivity (up to 20-fold) for either HCA I or HCA II (see sections 9.2.2 and 9.2.4). These examples serve to illustrate that the sulfonamide head group is not necessary for effective inhibition of CA.
9.3. Kinetics of Binding
Studies of the kinetics of binding for inhibition of CA have revealed important features regarding the mechanism of inhibition by arylsulfonamide inhibitors and their derivatives. We outlined methods for measuring the kinetics of binding in section 8.3. Burgen and co-workers reported several important experiments that used stopped-flow fluorescence to establish a correlation between the pH of the inhibitor and the dissociation constant (Kd) and between Kd and the apparent rate constant for bimolecular association (kon).302,389,458 In addition, the rates of binding measured by affinity capillary electrophoresis (ACE; see sections 8.3.3 and 14) and surface plasmon resonance spectroscopy (SPR; see section 12) have been reported. These data are discussed further, along with possible mechanisms for CA–sulfonamide binding, in section 11.
9.4. Combinatorial Approaches to Ligand Design
An approach to the design of effective inhibitors of CA involves combinatorial methods—that is, the generation of libraries of possible candidates and the selection of interesting compounds from these libraries. Several combinatorial approaches have utilized CA as the model enzyme. Supuran and co-workers reported the synthesis and screening of a library of arylsulfonamide inhibitors of HCA I and II using solid-phase synthesis; interestingly, their screening method assayed the resin-bound inhibitors.543
Burbaum et al. used BCA II as the model enzyme to test the concept of encoded combinatorial libraries for small-molecule drug discovery due to the synthetic accessibility of arylsulfonamides and the extensive structural and medicinal knowledge of their interactions with BCA II.506 They constructed two libraries based on benzenesulfonamide–one containing 1143 compounds and the other containing 6727 compounds. Using the dansylamide (DNSA, 133) displacement assay to measure binding affinity, their technique identified two inhibitors, one of which (108) had a Kd of 4 nM.
Sigal et al. reported a library of peptide conjugates based on para-substituted derivatives of compound 36.507 The compounds of general formula, H2NSO2C6H4–(Gly)n–AA, kept the benzene sulfonamide portion constant while varying the number of Gly residues (n = 0–3) and the identity of the terminal amino acid residue (AA). For the most effective series (n = 0, 89–103), hydrophobic amino acids increased the affinity by 1–2 orders of magnitude (from Kd ≈ 100–1000 nM to Kd ≈ 10 nM), whereas hydrophilic residues did not enhance affinity. The series with n = 1–3 displayed little change in affinity as a function of the amino acids incorporated (see section 10.5).
Huc and Lehn described the use of virtual combinatorial libraries—the reversible formation of inhibitors from a library of components or fragments—to form sulfonamide inhibitors from amine and aldehyde components.544 They used BCA II as the model system to develop this technique because the mechanism of binding is well-understood and because arylsulfonamide inhibitors are structurally simple and synthetically accessible.544 The presence of BCA II enhanced the production of certain combinations, suggesting specificity of the enzyme for particular sulfonamides. This “dynamic combinatorial library” approach was extended to include irreversible covalent interactions as the basis for combining components of the library to generate compounds of structure H2NSO2C6H4CH2SCH2R (11–15) from the fragment thiols and alkyl chlorides.384 For a given pair of sulfonamide products, the presence of BCA II in the reaction mixture enhanced the formation of the product with the higher affinity for BCA II. In addition, the labs of Sharpless, Wong, and Kolb have developed inhibitors for HCA II using “click chemistry” (the [1,3]-dipolar cycloaddition reaction between azides and acetylenes)545 in combination with selection methods.546
DNA-based libraries have been useful in identifying inhibitors of BCA.414,547 Doyon et al. reported a technique for using BCA to enrich the concentration of their target inhibitors within a small library of inhibitors.547 They linked each inhibitor to a unique sequence of DNA, which served as a means to amplify and identify the enriched species. They used para-phenylglycine-linked benzenesulfonamide, which is similar to the highly effective compound 106, as the target for BCA. Among the seven proteins in their study, BCA was among the most effective in terms of needing a minimum quantity of protein in order to provide an enrichment factor of >50-fold. This type of study illustrates how CA, among other proteins, can be used as a model for developing new methods in combinatorial selection.
Smith, Whitesides, and co-workers described the use of electrospray ionization Fourier transform ion cyclotron resonance spectrometry (ESI-FTICR-MS; see section 8.3.7) to select for high-affinity ligands for BCA II.443,444 We discuss this approach in section 13.2.
9.5. Computational Approaches to Ligand Design
With the increase in availability of high-resolution structures of proteins, computational chemistry is becoming a useful approach to designing drugs and to understanding the basis for drug–protein interactions.5,548–553 Grzybowski et al. reported an in silico combinatorial method (CombiSMoG554,555) that employs simulation to generate a virtual library of inhibitors and then to rate the candidate inhibitors by their binding free energies generated using knowledge-based potential functions.189 HCA II was used as the model enzyme for this study for several reasons: (i) The location of the benzenesulfonamide group could be specified. (ii) The inhibitors were small, uncharged, and easy to test experimentally. (iii) The enzyme is relatively rigid, and the active site is relatively plastic. (iv) The inhibitors have low molecular weight, and the benzenesulfonamide moiety is rigid. (v) The orientation of the inhibitor in the active site is well-defined. The first demonstration of this technique produced 109 (Table 10), which is the highest-affinity inhibitor of CA known to date (Kd = 0.03 nM as measured by the DNSA competitive binding assay). This compound bound to HCA II approximately 8-fold more tightly than its enantiomer, 110, in agreement with relative ordering of affinities for these two ligands from the CombiSMoG approach. In addition, the calculated structure of the HCA II–ligand complex was in satisfactory agreement with the observed X-ray crystal structure of the complex, for both of the ligands. This technique demonstrated the potential for the combination of structure and computation in the design of high-affinity inhibitors of proteins. We discuss the binding of this ligand to HCA II in detail in section 10.5.
Rossi et al. reported the use of HCA II to assess the efficacy of using the free energy perturbation (FEP) method to predict relative free energies (ΔΔG) and the concomitant structural changes among different complexes of HCA II with arylsulfonamides.60 FEP is a computational approach that starts with one molecule (e.g., a CA–sulfonamideA complex) and slowly modifies it to another molecule (e.g., CA–sulfonamideB) by adjusting the parameters that describe the molecule. In the reported study, they compared the complexes of HCA II with several inhibitors that were closely related in structure. They found that, although FEP did not accurately predict the exact structural perturbation of HCA II, it did predict the energetic trends among the three compounds with acceptable accuracy. FEP predicted the best inhibitor in the small set examined, but it did not predict the structural details of that complex as effectively. While this study shows that the FEP method is applicable to studies in ligand design, it suggests caution in such studies.
Grüneberg et al. reported the use of structure-based algorithms to score the relative predicted binding affinities for a group of compounds with HCA II.556 They found, however, that there was relatively little correlation between the predicted affinities and the measured inhibition constants.
9.6. Conclusions
Ligands of very diverse structure (e.g., small monoanions, alkyl sulfamates, etc.) bind to and inhibit CA. There do not seem to be any “essential components” for moderate-affinity (~μM) ligands: the sulfonamide, aryl ring, tail, and secondary recognition element can all be removed to generate ligands with some affinity (indeed, can there be any structurally simpler ligands than the small inorganic monoanions?). In spite of the broad structural diversity of ligands that have been examined, the highest-affinity class of ligands remains the arylsulfonamides. In section 10, we attempt to determine why the arylsulfonamides bind with such high affinity. Further, we use the system of arylsulfonamides and CA as a model to understand how to design high-affinity ligands for proteins rationally (or, more precisely, what the opportunities and challenges of designing ligands rationally are).
10. Using CA to Study the Physical-Organic Chemistry of Protein–Ligand Interactions
10.1. Overview
We have four objectives in this section: (i) to review why the system comprising carbonic anhydrase (CA) and aryl-sulfonamides is a good choice for a model system with which to study protein–ligand binding; (ii) to clarify details of the thermodynamic model of binding of arylsulfonamides to CA; (iii) to explain how to use CA and arylsufonamides as a model for ligand design through the separation of the influence on affinity of the different structural components of the arylsulfonamide; and (iv) to use that understanding to explore methods for using CA to test methods in ligand design (e.g., Lewis basicity, hydrophobicity, and multivalency).
Section 9 describes the different classes of ligands for CA. Here, we focus on para-substituted arylsulfonamides (particularly p-substituted benzenesulfonamides, p-RC6H4SO2-NH2; Figure 11A), because (i) these compounds are easy to synthesize in great variety, (ii) the mode of binding of these sulfonamides to CA is essentially conserved for all arylsulfonamides and many isozymes of CA, and (iii) for p-RC6H4SO2NH2, the mode of binding is independent of the substituent R. We focus our analysis on the binding of arylsulfonamides to carbonic anhydrase II (both the human, HCA, and bovine, BCA, versions), because this isozyme is the best characterized biophysically of the carbonic anhydrases (see section 2). The important interactions (Figures 11 and 12; see sections 4.6–4.8) between the sulfonamide and CA are between (i) the ionized sulfonamide and the ZnII cofactor of CA (forming p-RC6H4SO2NH–ZnII–CA and resulting in displacement of the zinc-bound water, CA–ZnII–OH2+/CA–ZnII–OH), (ii) the sulfonamide head group, SO2NH, and hydrogen-bond acceptors and donors of residues of the active site of CA, (iii) the aryl ring and the hydrophobic pocket of CA, (iv) the tail region and a nonpolar surface of CA just outside of the active site, and (v) the secondary recognition element (SRE) and a surface outside of the active site and near the periphery of the conical cleft of the enzyme (the so-called “hydrophobic wall”).
In this section, we exploit the conserved mode of binding of arylsulfonamides to CA to examine these different interactions separately as the structure of the ligand is changed. This analysis suggests that all of the interactions listed above (i–v) contribute to the affinity of arylsulfonamides for CA. For instance, using an aryl ring larger than a phenyl ring (iii), a tail (iv), and/or an SRE (v) in ligand design can generate ligands with affinities higher than a hypothetical benzenesulfonamide with the same value of pKa (and, thus, with the same strengths of the ZnII–N bond and hydrogen bonds) as the ligand.
Since we are only examining arylsulfonamides in this section, the –SO2NH2 moiety of the ligand is conserved. We do not separate structural perturbations that affect the hydrogen-bond network of the SO2NH from those that affect the ionized sulfonamide, ArSO2NH−; instead, we consider perturbations that affect the total “head group” together (Figure 11A).
We adopt a four-part organization in this section:
we discuss briefly the challenges in the rational design of ligands that bind with high affinity to proteins based on structural information, the utility of the system comprising CA and arylsulfonamides in developing rules or principles useful in this kind of design, and the interactions that make arylsulfonamides good ligands for CA (section 10.2);
we explore separately the influence of variations in the structure of arylsulfonamides that affect the head region (section 10.3), aryl ring (section 10.3), tail region (section 10.4), and secondary recognition element (the concept of multivalency, section 10.5) on the affinity ( ) of arylsul fonamides for CA (Figure 11B);
we dissect the thermodynamics of binding of arylsulfonamides to CA into enthalpy and entropy of binding and separately discuss the influence of perturbations in the regions of the head, ring, and tail on these observed thermodynamic parameters (section 10.6); and
we summarize what the study of the system of CA/arylsulfonamides teaches us about the rational design of ligands that can (in principle) be applied to other systems (section 10.9).
10.2. Challenges in Rational Ligand Design
We only discuss the challenges of designing high-affinity ligands for proteins (and the system of CA and arylsulfonamides as a model in this effort) and do not discuss those of designing drugs. There are a number of issues involved in converting a high-affinity ligand into a drug, but these issues have more to do with physiology and in vivo pharmacology than with physical-organic chemistry. There are several worthwhile reviews that discuss CA as a drug target.2,15
10.2.1. General Concepts
Although the subject of more than 50 years of study, designing high-affinity ligands for proteins of known structure—a problem of molecular recognition in aqueous solution that is presumably tailor-made for chemistry— remains an elusive goal. The primary reason for our inability to do so seems to be our lack of adequate understanding of the physical principles that underlie the association of protein and ligand in water.4,5
Water and the hydrophobic effect: The hydrophobic effect—the propensity of hydrophobic molecular surfaces to coalesce in aqueous solution—is dominated by entropy at room temperature and is accompanied by a large negative change in the specific heat capacity.4,557 The hydrophobic effect has been rationalized by invoking the entropically favorable release of ordered water molecules (which surround hydrophobic surfaces) when the hydrophobic surfaces coalesce and/or the energetic penalty of creating a cavity in water; the relative importance of the two is still unclear.4,557–560 Conceptually, we still do not understand the structure of water around hydrophobic groups or the influence of hydrogen bonding (as opposed to the size) of water on the hydrophobic effect. Since many protein–ligand binding events are believed to be dominated by the hydrophobic effect, understanding the origin of this effect is clearly important in efforts to engineer these interactions rationally.
Electrostatic interactions in water: In vacuum, the free energies of attraction of unlike point charges, and of repulsion of like ones, are given by Coulomb’s law.561 In solution, solvation complicates the calculation of such free energies. The key issues that have not been clearly addressed include the dielectric constant at the interface of protein and ligand (crucial because the energy of association is inversely proportional to the dielectric constant), the thermodynamic driving force for electrostatic interactions (while, intuitively, it might be expected to be enthalpy, recent analyses reviewed by Gitlin et al.397 suggest that it is, in fact, entropy), and the charge compensation between ionizable residues of a protein.4,397,561
Protein plasticity: As Beece562 stated, “A protein is not like a solid house into which the visitor (the ligand) enters by opening doors without changing the structure. Rather it is like a tent into which a cow strays.” Many proteins undergo large conformational changes upon binding ligands or substrates; this plasticity is one reason why rationally designing a ligand to bind to a protein—a flexible structure— has been difficult.563–565 Vamvaca et al. reported that a monomeric, structurally disordered chorismate mutase could be ordered into a structured binding site with catalytic activity by binding a transition-state analogue ligand.564 Benkovic and Hammes-Schiffer analyzed the catalytic activity of a number of mutants of dihydrofolate reductase and demonstrated that amino acid residues far (~20 Å) from one another in the tertiary structure of a protein can influence the binding of ligands in a cooperative (or synergistic) fashion.565 This idea of structural, energetic coupling of well-separated amino acid residues is still a difficult one to understand and makes the rational design of high-affinity ligands particularly difficult.
Estimating the change in entropy: The entropy of protein–ligand complexation is an aggregate value taking into account the losses in translational and rotational entropy of the ligand (and the protein, see (3) above),5,566,567 the loss in conformational mobility of the ligand (and the protein),5,566–568 new vibrational modes of the protein–ligand complex,566 loss of vibrational modes of the free protein,566 the burial of hydrophobic surface area upon complexation,4,557 and the release of solvent (and, perhaps, buffer or additive) molecules.566 The inability to estimate theoretically, or at the least to ascribe the observed change in entropy to, these individual components has been one of the more intractable problems in this area.
Enthalpy/entropy compensation: In many cases of protein–ligand binding, the enthalpies of binding of a series of ligands are positively correlated with their entropies of binding; that is, as the structure of the ligand varies, changes in enthalpy are compensated by changes in entropy.403,569–573 This compensation has the effect of reducing changes in the free energy of binding with modifications to ligand structure and can even make the free energy of binding constant (although the fundamental thermodynamics and interactions vary) within a series of ligands. While qualitative theoretical models have been proposed,571,572 the quantitative physical basis for this phenomenon, and even the qualitative aspects of the model, remain undefined and are still subjects of debate.573–576 Understanding when and why enthalpy/entropy compensation should be expected (and the role, if any, of solvent and solvent release in the process) would facilitate the rational design of high-affinity ligands.
10.2.2. Enthalpy and Entropy of Binding
10.2.2.1. Why Separate Enthalpy and Entropy? Why Not Just Use Free Energy?
The free energy of binding (ΔG∘), which is directly proportional to the logarithm of the dissociation constant (Kd), has components of enthalpy (ΔH∘) and entropy (ΔS∘) of binding, although it is common that ΔH∘ and ΔS∘ are not distinguished in discussions of binding processes. In noncovalent interactions, complexation is often assumed to be driven by ΔH∘, but ΔS∘ can play a major— even dominating—role in the thermodynamics of binding in water (see section 10.2.1). A primary contributor to a favorable ΔS∘ is the hydrophobic effect.4,557–560 Another contributor to a favorable ΔS∘ can be the residual mobility of the protein–ligand complex.403 For instance, the ligand can maintain significant mobility (and, thus, maintain a favorable entropy) in the complex, because good binding often seems to be surprisingly loose (in stark contrast to the historically honored model for the binding of a ligand to an enzyme30—the insertion of a key into a lock or a hand into a glove (“induced fit”)).
Many investigators have argued that separating ΔH∘ and ΔS∘ is neither possible (due to experimental artifacts and theoretical issues related to the temperature dependence of both terms) nor worthwhile and that the only important thermodynamic parameter is ΔG∘.30 We believe, however, that separating the two is possible with current experimental techniques (in particular, isothermal titration calorimetry)408 and that understanding the separate influence of ΔH∘ and ΔS∘ on protein–ligand binding should improve our ability to design high-affinity ligands. For instance, we must know accurately the magnitude of ΔS∘ in order to test models for protein–ligand binding based on hydrophobic contacts or on the residual mobility of the ligand in the protein–ligand complex.
The remainder of this section covers the two major techniques used to measure ΔH∘ and ΔS∘ of protein–ligand interactions—van’t Hoff analysis and isothermal titration calorimetry (ITC)—as well as the compensation often observed between ΔH∘ and ΔS∘. Section 10.5 discusses systematic studies of the separated thermodynamics of binding of arylsulfonamides to CA.
10.2.2.2. van’t Hoff Analysis to Estimate Enthalpy and Entropy of Binding
Most estimates of enthalpy and entropy of binding of arylsulfonamides to CA (and, in general, of most ligands to proteins) have measured the temperature-dependence of the dissociation constant (Kd) and analyzed the data using the method of van’t Hoff (eq 14),
| (14a) |
| (14b) |
where T is the temperature in K, R is the ideal gas constant in kcal mol−1 K−1, ΔH∘ is the enthalpy of binding in kcal mol−1, and ΔS∘ is the entropy of binding in kcal mol−1 K−1. Plotting ln Kd vs T−1 provides ΔH∘ from the slope and ΔS∘ from the y-intercept.
Because ΔH∘ and ΔS∘ are assumed to be temperature-independent, this analysis is predicated on a negligible change in heat capacity (ΔCp) upon binding.577 Large changes in heat capacity are often observed for hydrophobic interactions in water (see section 10.2.1)4,557 and can result in deviations from eq 14 and in curvature in van’t Hoff plots. Further, the dielectric constant of water has an anomalously strong dependence on temperature; this dependence changes the magnitude of electrostatic interactions with temperature.397 Only a limited range of temperatures can be examined by van’t Hoff analysis of proteins (because the structure of the protein can itself be temperature-dependent), and extrapolation to a very distant y-intercept is necessary to estimate the entropy of binding. This sort of extrapolation notoriously yields uncertain values of enthalpy and entropy.574
Equation 15 shows a more complicated form of eq 14a that allows for a nonzero, temperature-independent change in heat capacity (ΔCp) upon binding577,578
| (15) |
where T0 is an arbitrarily selected reference temperature (usually 298 K), is the dissociation constant at T0, and ΔH0 is the enthalpy of binding at T0. This equation, however, can still give thermodynamic parameters that differ from those obtained calorimetrically,578–580 and it is still subject to errors from probing a limited range of temperature.
10.2.2.3. Isothermal Titration Calorimetry to Measure Directly Enthalpy and Entropy of Binding
Isothermal titration calorimetry is currently the most accurate technique for estimating the dissected thermodynamic contributions to binding because it measures directly the heat released (and so, the enthalpy of binding) when protein is titrated with ligand at constant temperature.408 The sensitivity of commercially available microcalorimeters (see section 8.2.4) allows for the measurement of heat released at each step during a titration and, thus, provides ΔG∘ in addition to ΔH∘, from which ΔS∘ can be calculated.
10.2.2.4. Enthalpy/Entropy Compensation
As mentioned in section 10.2.1, the correlation between the enthalpy of binding for a series of ligands and the entropy of binding— a correlation that often minimizes changes in Kd with ligand structure403,569–573—has complicated the rational design of high-affinity ligands. Gilli et al. undertook an extensive literature survey of values of enthalpy and entropy, determined by van’t Hoff analysis, that characterized receptor–ligand binding.569 Their results revealed that enthalpy and entropy of binding were almost perfectly compensating for the association of 136 structurally unrelated, but therapeutically useful, ligands with 13 distinct macromolecular targets. They speculated that the limit in affinity (Kd ≈ 10 pM) resulted (somehow) from this compensation between the entropy and enthalpy of binding.
Dunitz and Williams and co-workers sketched a theoretical framework for enthalpy/entropy compensation by approximating a protein–ligand complex as a potential energy well.571,572 Dunitz approached the issue semiquantitatively and used the Morse potential to estimate the dependence of the entropy of the complex (primarily due to the residual mobility of the ligand in the complex) on its enthalpy (bond dissociation energy).571 From this analysis, he concluded that enthalpy/entropy compensation is associated with weak, intermolecular interactions in general and is not merely restricted to complexation in water. This theoretical model suggests an origin for the compensation between enthalpy and entropy of binding: a more tightly held protein–ligand complex (one with a more favorable enthalpy of binding) has less residual mobility (and a less favorable change in entropy due to greater entropic cost of complexation) than a less tightly held one.
Williams and co-workers have explored the dimerization of glycopeptide antibiotics in water as a model system for understanding protein–ligand complexation.581,582 They probed the “tightness” of the dimer interface (that is, the physical separation of monomer subunits) by NMR. They demonstrated that a tighter dimer interface was associated with both a more favorable free energy and a more favorable enthalpy of dimerization than a looser one.581,582 The more favorable enthalpy of dimerization was partially compensated by a more unfavorable entropy of dimerization: enthalpy/entropy compensation.582 The observed compensation was not exact: the free energy of binding decreased (became more favorable) with decreasing (more favorable) enthalpy and with increasing tightness of the dimer interface.
10.2.3. Utility of the System of CA/Arylsulfonamides in This Effort
The system of carbonic anhydrase and arylsulfonamides offers four advantages in exploring approaches to the rational design of high-affinity ligands for proteins:
CA is readily available from commercial sources (HCA I, HCA II, and BCA II) and its site-specific mutants from facile overexpression in E. coli (see section 4.2).
CA does not undergo gross conformational changes upon binding sulfonamides (see section 4.5). This lack of plasticity (see section 10.2.1) allows for a relatively straightforward interpretation of thermodynamic and kinetic data because the protein, to a first approximation, can be treated as rigid (rms deviation ≈ 0.2–0.3 Å between ligand-free and ligand-bound forms of HCA II).283,284 The individual amino acid side chains lining the active site, particularly His64, are, however, still conformationally mobile. Subtle conformational changes or dynamics of these residues might affect affinity in ways that are hard to predict.
There are several convenient assays to measure binding (e.g., the inhibition of catalysis and the competitive displacement of fluorescent sulfonamides from the active site) (see section 8).
Compounds of structure p-RC6H4SO2NH2 (Figure 11A), para-substituted benzenesulfonamides, are easy to synthesize in great variety (see section 10.1). All of the relevant regions (head, ring, tail, and secondary recognition element) of their structure can be changed independently, and the influence of these changes on binding to CA can be assessed separately. For example, the system allows the separate study, and evaluation of importance to affinity, of the influence of substituents (R) on the nucleophilicity of RC6H4SO2NH− toward the ZnII cofactor and on the hydrophobicity of the ligand.
10.2.4. Why Are Arylsulfonamides Such Good Ligands for CA?
10.2.4.1. Sulfonamides as Transition-State Analogues for the Hydration of Carbon Dioxide
In this section, we address the particular structural features that make sulfonamides superior to other classes of molecules for binding to CA. For many enzymes, molecules that mimic the transition state of the catalyzed reaction make good ligands.30 This concept seems to apply to CA. The structure of CA with a bound sulfonamide resembles the structure of CA with the native substrates, hydroxide and CO2 (putative) or HCO3−, bound in its active site (Figure 13).64,184,198,199,583 In a CA–sulfonamide complex, the sulfonamide nitrogen anion coordinates to the ZnII cofactor, the sulfonamide NH donates a hydrogen bond to the Oγ of Thr199, one sulfonamide oxygen accepts a hydrogen bond from the backbone NH of Thr199, and the other sulfonamide oxygen coordinates weakly at a fifth position on the ZnII (Figures 11B and 12B). This arrangement mimics the structure of CA bound to bicarbonate (Figure 13C), where the bicarbonate oxygen coordinates to the ZnII cofactor, the bicarbonate OH donates a hydrogen bond to the Oγ of Thr199, one bicarbonate oxygen accepts a hydrogen bond from the backbone NH of Thr199, and the other bicarbonate oxygen coordinates weakly at a fifth position on the ZnII cofactor.
Figure 13.

Diagram comparing (A) carbon dioxide (putative interactions), (B) an arylsulfonamide, and (C) bicarbonate bound in the active site of HCA II. The arylsulfonamide can be viewed as a transition-state analogue of the hydratase reaction (H2O + CO2 ⇆ HCO3− + H+.
10.2.4.2. ZnII–N Bond
Upon binding, the ionized sulfonamide nitrogen displaces the zinc-bound water (ZnII–OH/ZnII–OH2+) and interacts directly with the ZnII cofactor (see section 4). To our knowledge, all high-affinity ligands that have been reported make use of the ZnII–N bond. For instance, Scolnick et al. have shown that hydroxamic acids (RCONHOH), which bind to ZnII-containing metalloproteases by bidentate chelation of the ZnII by the carbonyl and hydroxyl groups of the ligand, bind to HCA II in a mode similar to that used by sulfonamides: the ionized nitrogen binds directly to ZnII and the carbonyl group of the ligand accepts a hydrogen bond from the backbone NH group of Thr199.200
10.2.4.3. Hydrogen-Bond Network
The “hydrogen-bond network” between ligand and CA is also crucial for high-affinity binding (Figure 7). On the basis of free-energy perturbation simulations of the binding of a benzenesulfonamide and a benzenesulfonate to HCA II, Merz et al. argued that an important reason that sulfonates are weaker ligands for HCA II than are sulfonamides is because a sulfonate bound to HCA II lacks the ability of a sulfonamide to donate a hydrogen bond to Oγ of Thr199.584 Their simulations suggested that binding of the sulfonate results in a repulsive O—O interaction between the anionic sulfonate oxygen and Oγ of Thr199, and that, in order to reduce this repulsion, Thr199 rotates and loses its hydrogen bond with Glu106.584 They concluded that the interaction between the sulfonamide NH and Oγ of Thr199 is an essential component of the specificity of HCA II for sulfonamides. While their results qualitatively supported one possibility for why sulfonates have lower affinities than sulfonamides, their simulations could not quantitatively explain the data. The experimental difference in free energy of binding (~10 kcal mol−1) between benzenesulfonate and benzenesulfonamide is much greater than their calculated value (~5 kcal mol−1).584 A large contribution to this difference could be the difference in energies between the ZnII–N bond (for sulfonamides) and the ZnII–O bond (for sulfonates); their simulations could probably not calculate these energies accurately because of difficulties in treating the ZnII cofactor computationally.584 Regardless, Thr199 is believed to make important contacts to ZnII-bound ligands, and this central role in determining ligand accessibility to the active site has led to Thr199 being termed the “doorkeeper residue”.184,289,294,585
Suitable data to enable a direct estimate of the contribution of the hydrogen bond network to the free energy of binding of arylsulfonamides have not been reported. Liang et al. have reported that dansylamide (133) binds to a Thr199Ala mutant (a mutation that abolishes the hydrogen bond between the sulfonamide NH and Oγ of Thr199) of HCA II with a 4-fold lower affinity (difference in ΔG∘ of ~0.8 kcal mol−1) than to wild-type HCA II.303 No estimate is available for the hydrogen bond between the backbone NH of Thr199 and the sulfonamide oxygen.
As mentioned in section 10.1, we do not explicitly discuss structural perturbations that affect the hydrogen-bond network alone, but rather discuss the influence of structural perturbations on the head group of the arylsulfonamide as a whole (Figure 11A).
10.2.4.4. Interactions between the Aryl Ring and the Hydrophobic Pocket of CA
Crystal structures of HCA II complexed with arylsulfonamides have revealed contacts between the aryl ring of the sulfonamide and the hydrophobic pocket of the enzyme (section 4.6).47,289,290 These contacts are believed to be primarily hydrophobic and to contribute to the free energy of binding;182 for instance, benzene-sulfonamide (1) binds to HCA II with ~103-fold higher affinity than does methanesulfonamide (189). While QSAR analyses have suggested that the hydrophobicity of the aryl ring of the sulfonamide is important in affinity (see section 9.2.1),9,503,586,587 this idea has not been tested rigorously through a systematic examination of the affinity of simple sulfonamides of varying hydrophobicity. Most reports have complicated the issues of hydrophobicity and Lewis basicity of the sulfonamide on affinity. We attempt to examine these factors separately in section 10.3.
10.2.5. Conclusions
Rational ligand design has been, and remains, challenging because we do not understand the fundamental, underlying thermodynamic principles of molecular recognition in water. Using isothermal titration calorimetry to separate the influence of enthalpy and entropy on affinity will, we believe, make it possible to begin to understand (or rationalize) the thermodynamics of these systems. The system of CA and arylsulfonamides provides a useful model system to try to understand this subject because so many biophysical and thermodynamic (binding) data are available for it. It is a “simple” system (e.g., negligible conformational change of CA upon complexation with arylsulfonamides, conformationally rigid ligand, and relatively well-defined protein–ligand interactions) that generates as uncomplicated thermodynamic data as any system of protein and ligand now available. Even so, accurate and extensive thermodynamic data will be necessary, but not sufficient, for understanding even this simplest example of protein–ligand interactions. A complete description will also require physical models, statistical mechanics, perhaps molecular dynamics, and direct observation of water.
10.3. Influence of the Head Group of Arylsulfonamides on Their Binding to CA
10.3.1. General Approach
This section summarizes the influence of the sulfonamide head group on the affinity of arylsulfonamides for CA (Figure 11A); section 10.4 examines the influence of the tail region on affinity. Section 10.5 discusses the influence of structural perturbations on the enthalpy and entropy of binding of the sulfonamide head group. We conclude that much of the reported variation in affinity of arylsulfonamides can be explained by the influence of the pKa of the arylsulfonamide on the head group; sulfonamides that deviate from our analysis are likely taking advantage of contacts (especially hydrophobic contacts) between the aryl ring and CA.
10.3.2. pKa Determines the Fraction of Arylsulfonamide Present in the Active, Ionized (ArSO2NH−) Form
We wish to separate the influence of the pKa (a value that is affected by the structure of the ligand) of the arylsulfonamide on the fraction available in the “active” form (either anion or neutral) and on the Lewis basicity of ArSO2NH− toward CA (toward the ZnII cofactor and toward hydrogen-bond acceptors and donors in the active site; Figure 13B). Our objective in this section is to summarize the literature and to rationalize future efforts to design ligands that have the “best” pKa for binding.
There are four possible schemes, which vary in the protonation states—that is, the active forms—of the two components, that might describe the binding of arylsulfonamides to CA (eqs 16–19). While the ionizable group (value of pKa ≈ 6.6–7.0 for CA II) on the enzyme has not been unambiguously identified and has been the subject of controversy in the literature, here we adopt the prevailing view that ionization occurs at the zinc-bound hydroxide/water (CA–ZnII–OH/CA–ZnII–OH2+).302,307,454,588
| (16) |
| (17) |
| (18) |
| (19) |
Figure 14A shows the fractions of arylsulfonamide and CA–ZnII–OH2+ in the protonated and deprotonated forms, as a function of pH. Figure 14B shows simulated curves for the pH-dependence of the affinity of arylsulfonamides for CA II: the product of fractions of CA II and arylsulfonamide in the active forms specified in eqs 16–19. This figure also shows experimental data for the pH-dependence of for the complex between HCA II and p-nitrobenzenesulfonamide (3). Only the simulations to eqs 17 and 18 are compatible with these data; eqs 16 and 19 are not compatible with this pH-dependence, and so we rule out these thermodynamic models.
Figure 14.
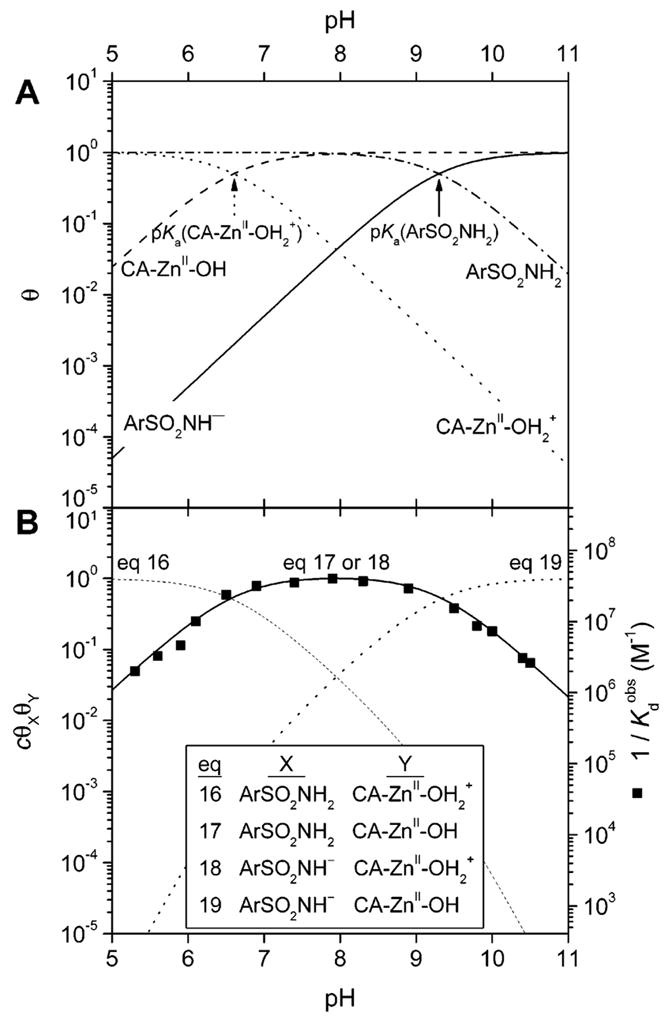
Fractions of arylsulfonamide and carbonic anhydrase II in their protonated and deprotonated forms, and the affinity of arylsulfonamides for HCA II, as a function of pH. (A) pH-dependence of the fractions (θ) of arylsulfonamide (ArSO2NH2 and ArSO2NH−, eq 20a) and carbonic anhydrase II (CA–ZnII–OH2+ and CA–ZnII–OH, eq 20b) in protonated and deprotonated forms. The values of pKa used were 6.6 for CA–ZnII–OH2+ and 9.3 for ArSO2NH2. (B) Simulations (shown as lines) and experimental data (shown as black squares for p-nitrobenzenesulfonamide, 3; data taken from ref 302) of the affinity of arylsulfonamides for HCA II. The simulated curves are the products of the fractions of HCA II and arylsulfonamide in the reactive forms given in eqs 16–19 (see text). The curves have been scaled to give a maximum value of unity (using constant c) to facilitate comparisons between curves. Simulated curves using eqs 17 and 18 are identical, and thus, the two equations are thermodynamically indistinguishable.
10.3.3. Selection of Standard Reaction for the Binding of Arylsulfonamides to CA
Scheme 1 shows the equilibria between the active forms of CA and arylsulfonamide specified in eqs 17 and 18. Equations 17 and 18 are thermodynamically indistinguishable (Figure 14B). We take the pathway involving KdArSO2NH−as the predominant one (although analyzing the pathway involving KdArSO2NH2 would lead to the same conclusions for the “best” sulfonamides to bind to CA). We then calculate values of KdArSO2NH−using eqs 20 and 21, with literature values of pKa for arylsulfonamides and for CA– ZnII–OH2+(we take this pKa to be 6.8 for HCA II and 6.9 for BCA II;269,296,299 see section 4.7), the dissociation constant of binding( ; Table 10), and the pH at which binding was measured:
| (20a) |
| (20b) |
| (21) |
Scheme 1.

Equilibria for the Association of Arylsulfonamide (ArSO2NH2/ArSO2NH−) with Carbonic Anhydrase (CA–ZnII–OH2+/CA–ZnII–OH) (Reproduced with Permission from Ref 182; Copyright 2007 Wiley-VCH)
This analysis allows us to calculate a dissociation constant for the reaction between CA–ZnII–OH2+ and the ionized (anionic) form of the sulfonamide, ArSO2NH− (eq 18; Table 11 24) or inorganic ligand, L− (Table 12).157,589–591
Table 11.
Dissociation Constants, and KdArSO2NH− (Calculated for the Binding of the Anion to CA–Zn2+–OH2+; eq 18)
| Compound | Structure | pKa | pHa | CA II Variant | Kdobsb (nM) | KdArSO2NH−c(nM) | Ref. |
|---|---|---|---|---|---|---|---|
| Type: | |||||||
| 1 | R=H | 10.1 | 6.5 | HCA | 200 | 0.033 | 389,458 |
| 2 | R = CI | 9.9 | 6.5 | HCA | 120 | 0.032 | 458 |
| 3 | R=NO2 | 9.0 | 6.5 | HCA | 63 | 0.13 | 458 |
| 4 | R=NH2 | 10.1 | 7.5 | BCA | 300 | 0.13 | 413,503 |
| 222 | R = CH2NH3+ | 8.4 | 7.0 | BCA | 36000 | 690 | 417 |
| 6 | R = CH3 | 10.2 | 6.5 | HCA | 82 | 0.011 | 389 |
| 7 | R = CH2CH3 | 10.4 | 6.5 | HCA | 29 | 0.0024 | 389 |
| 8 | R = (CH2)2CH3 | 10.3 | 6.5 | HCA | 17 | 0.0018 | 389 |
| 9 | R = (CH2)3CH3 | 10.4 | 6.5 | HCA | 5.0 | 0.00042 | 389 |
| Type: | |||||||
| 30 | X = OCH3 | 9.8 | 6.5 | HCA | 10 | 0.0033 | 389 |
| 31 | X = OCH2CH3 | 9.7 | 6.5 | HCA | 3.2 | 0.0013 | 389 |
| 32 | X = O(CH2)2CH3 | 9.8 | 6.5 | HCA | 1.7 | 0.00057 | 389 |
| 33 | X = O(CH2)3CH3 | 9.7 | 6.5 | HCA | 0.77 | 0.00032 | 389 |
| 34 | X = O(CH2)4CH3 | 10.1 | 6.5 | HCA | 0.41 | 0.000069 | 389 |
| 37 | X = NHCH3 | 10.3 | 6.5 | HCA | 83 | 0.0088 | 389 |
| 38 | X = NHCH2CH3 | 10.1 | 6.5 | HCA | 30 | 0.0050 | 389 |
| 39 | X = NH(CH2)2CH3 | 10.1 | 6.5 | HCA | 8.3 | 0.0014 | 389 |
| 40 | X = NH(CH2)3CH3 | 10.1 | 6.5 | HCA | 3.3 | 0.00055 | 389 |
| 41 | X = NH(CH2)4CH3 | 10.2 | 6.5 | HCA | 1.8 | 0.00024 | 389 |
| Type: | 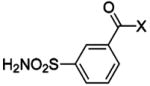 |
||||||
| 114 | X = OCH3 | 9.8 | 6.5 | HCA | 700 | 0.23 | 389 |
| 115 | X = OCH2CH3 | 9.6 | 6.5 | HCA | 610 | 0.32 | 389 |
| 116 | X = O(CH2)2CH3 | 9.7 | 6.5 | HCA | 370 | 0.15 | 389 |
| 117 | X = O(CH2)3CH3 | 9.6 | 6.5 | HCA | 110 | 0.060 | 389 |
| 118 | X = O(CH2)4CH3 | 9.9 | 6.5 | HCA | 140 | 0.037 | 389 |
| Type: | 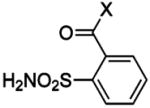 |
||||||
| 119 | X = OCH3 | 9.3 | 6.5 | HCA | 39000 | 41 | 389 |
| 120 | X = OCH2CH3 | 9.5 | 6.5 | HCA | 16000 | 11 | 389 |
| 121 | X = O(CH2)2CH3 | 9.7 | 6.5 | HCA | 5200 | 2.2 | 389 |
| 122 | X = O(CH2)3CH3 | 9.8 | 6.5 | HCA | 1800 | 0.60 | 389 |
| 123 | X = O(CH2)4CH3 | 9.9 | 6.5 | HCA | 660 | 0.17 | 389 |
| 133 |
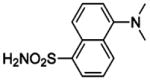 (DNSA) (DNSA) |
9.8 | 7.4 | HCA | 826 | 0.66 | 189,368,458 |
| 135 | 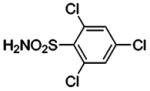 |
9.7 | 6.5 | HCA | 220 | 0.092 | 458 |
| 137 | 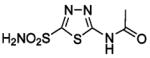 |
7.2 | 7.5 | HCA | 7 | 0.78 | 528 |
| 138 |  |
7.4 | 7.5 | HCA | 7 | 0.65 | 528 |
| 140 | 8.1 | 7.5 | HCA | 0.5 | 0.017 | 528 | |
| 142 |  |
8.1 | 7.4 | HCA | 2.3 | 0.077 | 517 |
| 144 | 9.2 | 8.3 | HCA | 1.2 | 0.0041 | 518 | |
| 145 |  |
8.8 | 7.4 | HCA | 1.4 | 0.011 | 517 |
| 154 |  |
8.5 | 8.3 | HCA | 3.5 | 0.042 | 378 |
| 166 | 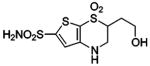 |
8.5 | 8.3 | HCA | 1.2 | 0.014 | 509 |
| 183 | 9.1 | 8.2 | BCA | 42 | 0.18 | 504 | |
| 184 | 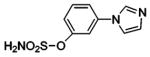 |
8.0 | 8.2 | BCA | 100 | 2.3 | 504 |
| 185 | 8.9 | 8.2 | BCA | 70 | 0.45 | 504 | |
| 188 | H2NO2S-CF3 | 6.3 | 7.5 | HCA | 2 | 0.31 | 528 |
| 189 | H2NO2S-CH3 | 10.5 | 7.5 | HCA | 300 000 | 50 | 528 |
| Type: | |||||||
| 207 | 2-fluoro | 9.6 | 7.5 | BCA | 230 | 0.39 | 182 |
| 208 | 3-fluoro | 9.7 | 7.5 | BCA | 75 | 0.11 | 182 |
| 209 | 4-fluoro | 10.0 | 7.5 | BCA | 590 | 0.40 | 182 |
| 210 | 2,6-difluoro | 9.1 | 7.5 | BCA | 190 | 1.0 | 182 |
| 211 | 3,5-difluoro | 9.4 | 7.5 | BCA | 57 | 0.16 | 182 |
| 212 | Pentafluoro | 8.2 | 7.5 | BCA | 25 | 0.80 | 182 |
Table 12.
Thermodynamics of Binding of Anions to CA II
| BCA II |
HCA II |
|||||||||
|---|---|---|---|---|---|---|---|---|---|---|
| Compound | Anion (L−) | pKaa | pHb | c(mM) | d(mM) | pHb | (mM) | d(mM) | ||
| 193 | F− | 3.2 | 7.55 | 1200 | 220 | 6.9 | >300 | e | 130 | |
| 194 | Cl− | −7.0 | 7.55 | 190 | 35 | 6.9 | 200 | e | 89 | |
| 195 | Br− | −9.0 | 7.55 | 66 | 12 | 6.9 | 200 | e | 89 | |
| 196 | I− | −10.0 | 7.55 | 8.7 | 1.6 | 6.9 | 26 | e | 12 | |
| 9.2 | 500 | f | 2.0 | |||||||
| 197 | HS− | 7.0 | 7.55 | 0.011 | 0.001 6 | 7.5 | 0.04 | g | 0.005 1 | |
| 198 | CN− | 9.2 | 7.55 | 0.002 6 | 0.000 010 | 7.5 | 0.02 | g | 0.000 065 | |
| 199 |
|
4.7 | 7.55 | 0.59 | 0.11 | 8.7 | 21 | f | 0.26 | |
| 200 | NCO− | 3.5 | 7.55 | 0.11 | 0.020 | 6.9 | 0.02 | e | 0.008 9 | |
| 8.7 | 0.3 | f | 0.003 7 | |||||||
| 201 | SCN− | 0.9 | 7.55 | 0.59 | 0.11 | 9.0 | 25 | f | 0.16 | |
| 7.4 | 1.8 | f | 0.36 | |||||||
| 6.9 | 0.6 | e | 0.27 | |||||||
| 6.4 | 0.32 | f | 0.23 | |||||||
| 202 | OAc− | 4.7 | 7.55 | 85 | 16 | 6.9 | 70 | e | 31 | |
| 203 |
|
6.5 | 7.55 | 26 | 4.4 | 6.9 | 70 | e | 22 | |
| 204 |
|
−1.5 | 7.55 | 48 | 8.8 | 6.9 | 35 | e | 15 | |
| 205 |
|
−10.0 | 7.55 | 16 | 2.9 | 6.9 | 1.3 | e | 0.58 | |
pKa of the conjugate acid.
pH at which was reported.
Values of were taken from values of Ki reported in ref 157.
Values of were taken from values of IC50 reported in ref 589.
Values of were taken from values of Ki reported in ref 590.
Values of were taken from values of Ki reported in ref 591.
10.3.4. Brønsted Relationships Reveal the Role of Basicity of the Sulfonamide Anion
A Brønsted relationship between the logarithm of KdArSO2NH− and pKa of ArSO2NH2 (with a slope of β) would establish the extent to which the interactions of ArSO2NH− with the ZnII cofactor of CA and with a proton are related. Deviations of individual arylsulfonamides from the general linear relationship would suggest the contribution of other factors (e.g., hydrophobicity) to affinity. We consider the key question of “What is the value of β?” first.
While the maximum value of β is plausibly unity for this type of reaction, we anticipate that it is probably significantly lower because we expect the CA–ZnII–NHSO2Ar bond to be significantly more ionic (less covalent) than the H–NHSO2− Ar bond. We attempted to determine the value empirically by constructing a plot of log KdArSO2NH− vs pKa for the binding of a number of structurally related arylsulfonamides to CA II (Figure 15). Linear fits to these data gave values of β between 0.4 and 0.7, but the quality of the fits was poor (R2= 0.20–0.26), presumably because of the heterogeneity in the interaction of these ligands with CA II.
Figure 15.

Brønsted plot for the variation of KdArSO2NH− (defined in eq 21) for the binding of substituted benzenesulfonamide anions to carbonic anhydrase II (CA II) with pKa of the sulfonamide (see Table 11). The y-axis is plotted such that tighter-binding ligands are at the top of the graph. We included substituted benzenesulfonamides that we presume do not have hydrophobic contacts with CA II other than a conserved interaction of their phenyl rings. Compounds 6, 30, and 37 (shown as open squares) contain methyl groups attached to the phenyl ring and so could have additional hydrophobic contacts with CA II. The solid line shows a fit to all of the experimental points and gives a value for β of 0.7 with R2 of 0.26. The dashed line shows a fit to the data omitting the open squares; it gives a value for β of 0.4 with R2 of 0.20. The poor fits for both lines suggest that the binding of these compounds to CA II involves substantially different balances of contributions from different types of interactions (e.g., ZnII–N bond, hydrogen-bond network, and hydrophobic effects).
We consider three model studies that should allow more reliable estimates of β; these studies explore the binding of (i) arylsulfonamides and simple monoanions to a small-molecule model of the active site of CA, (ii) anionic nitrogen heterocycles to HCA I, and (iii) fluorinated benzenesulfonamides to BCA II. From these studies, we believe that the best estimate for the value of β is ~0.6.
Kimura and co-workers examined the binding of arylsulfonamides and anions to a macrocyclic triamine chelated to ZnII (206) in aqueous buffer (with 10% acetonitrile for solubility).335,350 This small molecule (206) seems to provide a good model for the active site of CA because it (i) has a distorted tetrahedral geometry about ZnII with the fourth site occupied by a water molecule with a pKa of 7.3 (similar to the pKa of CA–ZnII–OH2+; section 10.3.3), (ii) catalyzes the hydrolysis of p-nitrophenyl acetate (a model substrate for CA), and (iii) binds arylsulfonamides as anions with concomitant displacement of the ZnII-bound water. A Brønsted plot derived from their data for the dependence of log KdArSO2NH− on pKa (R2 = 0.88) reflects only the effect of pKa (e.g., Brønsted or proton basicity) on the strength of the ZnII–N bond because the arylsulfonamide cannot engage in hydrophobic contacts of its aryl ring or hydrogen bonds of its head group, in the bound complex. They obtained a value for β of 0.29 ± 0.05.
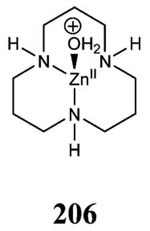
Khalifah et al. undertook a Brønsted analysis of the binding of four aromatic nitrogen heterocycles (imidazole analogues) to HCA I. They observed a linear dependence of the logarithm of Kd N–on the pKa of the neutral species for these ligands; the best-fit line gave a value for β of 0.43 ± 0.07 with R2 = 0.95.409 This low value for β is in reasonable agreement with that from the small-molecule study of Koike et al. and suggests that the ZnII of CA is a hard acid and that the interaction of ArSO2NH− with ZnII of CA is more ionic than is its interaction with a proton.
While these studies are interesting, they are far from ideal as models for the binding of the arylsulfonamide anion to CA II: Koike et al. used a small-molecule model of the active site of CA in which the ZnII was chelated by secondary amines and not His residues (and their study neglects the pKa-dependence of the hydrogen-bond network), and Khalifah et al. examined the binding of aromatic nitrogen heterocycles (not arylsulfonamides) to HCA I (not CA II). In a study relevant to the binding of arylsulfonamides to CA II, Krishnamurthy et al. have recently reported the binding of fluorinated benzenesulfonamides (207–212) to BCA II.182 By constructing a quantitative structure–activity relationship (QSAR), the investigators separated the influence of fluorination of the ring on electrostatic–Lewis basicity of ArSO2NH− toward the ZnII cofactor and toward the hydrogen-bond network (interactions that they assumed were dependent on pKa)–and hydrophobic–contacts of the phenyl ring with the enzyme (an interaction that they assumed was dependent on log P, the logarithm of the octanol/aqueous buffer partition coefficient)–interactions (eq 22; Figure 16A). Their plot suggests a value for β of ~0.6 (with R2 = 0.83), which is consistent with the more ionic (less covalent) character of the ZnII–NHSO2Ar bond than of the H–NHSO2Ar bond.
Figure 16.

Quantitative structure–activity relationships (QSARs) between ΔG∘ ArSO2NH− (A), ΔH∘ ArSO2NH− (B), and −TΔS∘ ArSO2NH− (C) and pKa and log P for the binding of fluorine-substituted benzenesulfonamides (207–212) to BCA II. Data are shown for QSARs in which those for 4-fluorobenzenesulfonamide (209, 4-FBS) were omitted; Krishnamurthy et al. have suggested that this ligand interacts in a different way with the enzyme than do the other ligands.182 The y-error bars are uncertainties described in Table 14, and the x-error bars were obtained by propagating uncertainties in pKa and log P. The horizontal and vertical dotted lines in (C) separate favorable (−TΔS∘ < 0) from unfavorable (−TΔS∘ > 0) entropy of binding. Modified with permission from ref 182. Copyright 2007 Wiley-VCH.
| (22) |
From these simple studies, we take the value for β for the binding of arylsulfonamides to CA II to be ~0.6. This value takes into account the pKa-dependence of the Lewis basicity of the arylsulfonamide anion for the ZnII cofactor and of the hydrogen-bond network. We discuss the affinity of arylsulfonamides relative to a Brønsted plot constructed with that slope below.
10.3.4.1. Comparison of Affinity of Arylsulfonamides for CA Relative to Brønsted Relationships
Figure 17A shows a plot of the dependence of on the pKa of arylsulfonamides where values of pKa are available (Table 10). Figure 17B shows a similar plot for KdArSO2NH−. The values of KdArSO2NH− generally decrease (that is, 1/KdArSO2NH− and affinity increase) as values of pKa increase (that is, ArSO2NH− becomes a stronger Brønsted base). One sulfonamide (109) seems to bind with exceptional affinity. We discuss this ligand, which we believe is able to exploit both multivalency and hydrophobic contacts, further in section 10.6.2.
Figure 17.

Variation of (A) and (B) KdArSO2NH− (defined in eq 21) with pKa(ArSO2NH2) for the binding of arylsulfonamides (shown in Table 11) to human (HCA) and bovine carbonic anhydrase II (BCA). The filled circles and filled triangles are data for the binding of ligands to BCA; the other symbols are data for the binding of ligands to HCA. The pKa of compound 109 has not been reported in the literature; we take it to be 10 based on its structure. The open symbols represent the binding of three series of benzenesulfonamides with alkyl chains to HCA. These compounds demonstrate that the affinity of substituted benzenesulfonamides with alkyl chains for CA increases with the length (and, thus, hydrophobicity) of the chain. We placed the dashed and solid lines (with slopes of 0.6; see text) to pass through the value of Kd ArSO2NH− for unsubstituted benzenesulfonamide (1) complexed with HCA (solid line) and with BCA (dashed line). The dotted ellipse segregates compounds that bind more tightly than benzenesulfonamide by virtue of hydrophobic contacts with the surface of the conical cleft just outside of the active site. We discuss 109 separately in the text.
We have drawn two theoretical lines with slopes of 0.6 (based on our analysis for β in the previous section) in Figure 17B. The lines pass through unsubstituted benzenesulfonamide (1) and represent the affinities for a hypothetical set of arylsulfonamides that have variable pKa (and, thus, different strengths for the ZnII–N bond and hydrogen-bond network) but the same strengths for hydrophobic contacts (assumed to be pKa-independent) as benzenesulfonamide (see section 4.6); the solid line describes the binding of benzenesulfonamide to HCA II, and the dashed line describes binding to BCA II and only relates to the sulfonamides represented by closed triangles and closed circles. A number of arylsulfonamides lie above the solid line (that is, to higher affinities) and, we infer, are able to take advantage of interactions not available to benzenesulfonamide. For instance, the open symbols that lie above benzenesulfonamide (in the dotted ellipse in Figure 17B)–para-substituted benzenesulfonamides with alkyl tails–represent compounds that are probably able to exploit hydrophobic contacts between their alkyl tails and the surface of HCA II peripheral to, but outside of, the active site region (see section 10.4). The closed squares that lie above the solid line probably have more favorable contacts of their structurally complex aryl rings with HCA II than does benzenesulfonamide. Thus, interactions between arylsulfonamides and two hydrophobic sites on CA–the hydrophobic pocket in the active site (by using a large or hydrophobic aryl ring) and the hydrophobic wall along the surface of the conical cleft (by using a hydrophobic tail; see section 10.4)–can be used to generate high-affinity arylsulfonamides. We discuss the affinity of fluorinated benzene-sulfonamides (207–212; represented by filled circles) for BCA II relative to the dashed line at the end of this section.
The structurally simple sulfonamide trifluoromethane-sulfonamide (188) lies significantly above the solid line in Figure 17B (even though this compound lacks a phenyl ring) and far above a line with a slope of 0.6 that passes through methanesulfonamide (189). Håkansson and Liljas reported the X-ray crystal structure of trifluoromethanesulfonamide complexed with HCA II; the structure revealed that trifluoromethanesulfonamide was rotated by 180° around the sulfur–nitrogen bond relative to all arylsulfonamides.201 This rotation placed the trifluoromethyl moiety in a tight hydrophobic pocket (comprising Val121, Val143, Leu198, Thr199, and Trp209) of HCA II with which the bulky ring of arylsulfonamides could not interact and created new hydrogen bonds and van der Waals contacts for the sulfonamide oxygens. These contacts, particularly the hydrophobic contacts of the trifluoromethyl group, could explain the much higher than expected affinity of trifluoromethanesulfonamide for HCA II.
Some ligands lie below the solid line and, thus, bind with affinities lower than expected based on the Brønsted plot using benzenesulfonamide as the reference compound. These ligands might encounter steric repulsion with the active site of CA II (e.g., the series of ortho- and meta-substituted benzenesulfonamides with alkyl chains, shown as open symbols)389,586 or might not be able to interact hydrophobically with CA II (e.g., methanesulfonamide, 189). The observation that methanesulfonamide binds with an affinity that is ~103-fold lower than benzenesulfonamide, even though both have similar values of pKa (10.1–10.5), suggests that the phenyl ring makes a significant (~4 kcal mol−1) contribution to affinity.
As mentioned previously, Krishnamurthy et al. constructed a QSAR between the affinity (KdArSO2NH−) of fluorinated benzenesulfonamides (207–212) for BCA II and pKa and log P of the ligands (eq 22; Figure 16A).182 Assuming that the two hydrogen bonds between the enzyme and ligand were equal to one another in energy (Figure 13B), their analysis allows the partitioning of affinity to the structural interactions of the ZnII–N bond, the hydrogen-bond network, and the hydrophobic contacts of the phenyl ring between the ligand and enzyme (Figure 18; section 10.2.4). Their results suggest that electrostatic contacts play a dominant role (~75% of the free energy of binding) in affinity with ~65% (~−8 kcal mol−1) of the free energy being contributed by the ZnII–N bond and ~10% (~−1 kcal mol−1) by the hydrogen-bond network. Hydrophobic interactions between the phenyl ring and BCA II contribute the remaining ~25% (~−3.5 kcal mol−1); this result is consistent with the fact that benzenesulfonamide has an affinity for HCA II ~103-fold (~−4 kcal mol−1) greater than methanesulfonamide does (see above). Given the small range in KdArSO2NH− for the data obtained with the fluorinated benzenesulfonamides (Figure 16A), these conclusions cannot be quantitatively generalized to the binding of structurally complex arylsulfonamides to CA but should be qualitatively applicable (e.g., the ZnII–N bond should be the dominant interaction between CA and arylsulfonamide).
Figure 18.

Estimated free energies, enthalpies, and entropies (all in kcal mol −1) for the different structural interactions between fluorinated benzenesulfonamide anions and CA–ZnII–OH2+. Reproduced with permission from ref 182. Copyright 2007 Wiley-VCH.
10.3.5. What Value of pKa for Arylsulfonamides Gives the Highest Affinity for CA?
The value of the pKa of the arylsulfonamide has two effects on the affinity of the sulfonamide for CA, it (i) controls the fraction of sulfonamide in the active form (eqs 17 and 18) and (ii) controls the Lewis basicity of the sulfonamide anion (and, thus, the strength of the ZnII–N bond and hydrogenbond network). A lower pKa would result in a greater fraction of the sulfonamide in the ionized form but would reduce the Lewis basicity of the anion (and the strength of the ZnII–N bond, as well as affect the hydrogen-bond network).
Equation 23 shows the expected dependence of the logarithm of on the pKa of the arylsulfonamide; this equation assumes a Brønsted relationship between log KdArSO2NH− and pKa with a slope of −β and y-intercept of −C (the negative signs are used to make both constants positive).
| (23) |
The terms are as defined in eq 21. Equation 24a shows the analytical solution for the value of pKa of the arylsulfonamide that results in the highest-affinity ligand (lowest value of ) for the reaction shown in eq 18. In order to generate this equation, we set the derivative of eq 23 with respect to pKa of the arylsulfonamide equal to zero and rearranged. Equation 24b shows an analogous analytical solution using the reaction in eq 17.
| (24a) |
| (24b) |
The variation of this optimal value of pKa with β (between 0.1 and 0.9) is relatively modest (pKa = pH of buffer ± 1 pH unit) for both equations.
Figure 19 shows a family of curves of eq 23 at different values of β. The key point is that, regardless of the value of β, a value of pKa for the arylsulfonamide near the pH of the buffer (usually ~7.4) will give the highest-affinity arylsulfonamide (all other factors being equal). Others have reached this same general conclusion by examining rate and equilibria for other reactions in water.592
Figure 19.

Variation of pKa of the arylsulfonamide that will theoretically give the highest affinity ligand (lowest value of ) to carbonic anhydrase II with β (eq 23). The curves were generated with a pH of the buffer of 7 (indicated by dotted vertical line).
10.3.6. Conclusions
The value of the pKa of the arylsulfonamide influences affinity in two ways, by varying (i) the fraction of the sulfonamide present in (or able to access) the reactive form and (ii) the Lewis basicity of the sulfonamide anion (and, thus, the strength of the ZnII–N bond and the bonds of the hydrogen-bond network). Because these effects compete with one another (one increases the affinity with a change in pKa, and the other decreases it), the highest-affinity arylsulfonamides will have a pKa near the pH of the buffered medium.
Some changes in the structure of arylsulfonamides actually decrease the affinities of these sulfonamides for CA II relative to benzenesulfonamide (points below the solid line in Figure 17B). This effect suggests that steric repulsion between CA II and substituents on the aryl ring and/or the aryl ring itself can reduce affinity. A number of sulfonamides bind with affinities higher than expected based on a Brønsted relationship using benzenesulfonamide as the reference ligand (points above the solid line in Figure 17B). We believe that these ligands take advantage of contacts (in particular, hydrophobic contacts) with CA II that unsubstituted benzenesulfonamide cannot. The contacts can be either at the hydrophobic pocket in the active site of CA II or at a secondary site at the surface of the conical cleft of the enzyme (see sections 10.4 and 10.5).
The ZnII–N bond plays a dominant role (~65% of the free energy) in the binding of benzenesulfonamide ligands (and, probably, also arylsulfonamide ligands) to CA II, with a smaller role played by the hydrogen-bond network (~10%) and hydrophobic contacts of the phenyl ring (~15%). Increasing the strength of hydrophobic contacts between the aryl ring of the arylsulfonamide and CA in ways that increase affinity, but that avoid steric repulsion and destabilization of the ZnII–N bond, could result in very high-affinity ligands to CA. Alternatively, the addition of hydrophobic elements to the benzenesulfonamide scaffold could accomplish this same objective (see section 10.4). For instance, we believe that the high-affinity ligand 109 (the outlier in Figure 17B) takes advantage of hydrophobic interactions from multivalent contacts involving a secondary site of the enzyme (see section 10.5.2).
10.4. Influence of the Sulfonamide Tail Group on the Binding of Arylsulfonamides to CA
10.4.1. General Approach
In this approach to increasing affinity of arylsulfonamides, the head region and the aryl ring are held constant, and the tail region is changed (Figure 11A). Most changes (within a homologous series with a common type of attachment to the aryl ring) have little influence on the value of pKa of p-RC6H4SO2NH2; as a result, we believe that the binding of the ArSO2NH− head group and the phenyl ring is constant within each series. Thus, variations in provide direct information about the interaction between the tail and the surface of CA outside of the region that binds the ArSO2NH− anion.
10.4.2. Interaction of Different Types of Tails with CA
10.4.2.1. Increasing the Length of Alkyl Tails Increased Affinity of Benzenesulfonamides for CA
King and Burgen, and Gao et al., examined the influence of the length of the tail for substituted benzenesulfonamides with alkyl tails on the observed dissociation constant ( ) for CA II.389,508 For the case of ortho- (119–123), meta- (114–118), and para-substituted (6–10, 30–35, and 37–43) benzenesulfonamides with alkyl tails, the affinity increased ( decreased) as the length of the tail increased and reached a plateau when there were six methylene units in the tail (a length at which the tail should exceed the length of the conical cleft of CA II; see section 4.6) (Table 10). The increase in affinity with tail length is probably due to hydrophobic contacts between the tail and the “hydrophobic wall” of CA II (see section 10.5). The ortho- and meta-substituted benzenesulfonamides, however, interacted with HCA II with lower affinities than unsubstituted benzene-sulfonamide (1) did (Figure 17). This result is probably due to steric constraints of the active site of HCA II that disfavor ortho- and meta-substitution on the phenyl ring and suggests that proper positioning of the alkyl tail is essential for high-affinity binding.586 Figure 17 shows all three series of alkyl tail-containing benzenesulfonamides as open symbols; each series lies roughly in a vertical line because of the similar values of pKa of its members.
10.4.2.2. Benzenesulfonamides with Fluoroalkyl Tails
Gao et al. determined that benzenesulfonamides with fluoroalkyl tails (22–27 and 45–48) interacted with higher affinities with BCA II than benzenesulfonamides with alkyl tails (16–21 and 37–44) of the same length did (Table 10).508 They observed different slopes in linear fits to plots of log or log P (the partition coefficient between octanol and aqueous buffer) vs tail length (n) for the alkyl-and fluoroalkyl-containing benzenesulfonamides (Figure 20 parts A and B). Both series, however, had the same slopes in linear fits to plots of either log or log P vs the molecular surface area of the ligand (Figure 20 parts C and D); this result suggests that the higher affinities of sulfonamides with fluoroalkyl tails for BCA II than of those with alkyl tails can be explained by the fact that fluorine is larger than hydrogen, rather than by some intrinsic difference in hydrophobic interactions between the two.
Figure 20.

Variation of the observed free energy of binding to BCA II (ΔG∘obs) and the free energy of partitioning between octanol and water (ΔG∘p) of benzenesulfonamides containing alkyl and fluoroalkyl tails with the length of the tail (A and B) and with the molecular surface areas of the ligands (C and D). The plots show linear fits to the data. The differences in slopes between the alkyl and fluoroalkyl series in plots of ΔG∘obs (A) or ΔG∘p (B) vs length of the tail were eliminated when these values were plotted vs molecular surface areas of the ligands (C and D). Gao et al. believe that the –NH– of the carboxamide (enclosed in the dotted box) forms hydrogen bonds with residues of the active site of BCA II.508 Modified with permission from ref 508. Copyright 1995 American Chemical Society.
Gao et al. proposed that the slight difference in y-intercepts of the plots (Figure 20 parts C and D) for sulfonamides with fluoroalkyl tails and with alkyl tails was due to the greater acidity of the proton of the carboxamide group adjacent to the tail (boxed in Figure 20) for the former than for the latter. A likely hypothesis is that this –CONH– group hydrogen bonds to residues of the active site of BCA II; the effectiveness of this hydrogen-bond donation would be higher for sulfonamides with fluoroalkyl tails than for those with alkyl tails and may explain the slightly (~1 kcal mol−1) more favorable free energy of binding of sulfonamides with fluoroalkyl tails than for those with alkyl tails.
10.4.2.3. Oligoethylene Glycol, Oligoglycine, and Oligosarcosine Tails: Values of Are Surprisingly Insensitive to the Length of the Tail
Jain et al. and Krishnamurthy et al. studied the binding of types of tails other than n-alkanes to CA II to explore the nature of the active site of the enzyme.377,415,593 Unlike benzenesulfonamides with alkyl and fluoroalkyl tails, para-substituted benzenesulfonamides with oligoethylene glycol (72–76), oligoglycine (63–68), and oligosarcosine (213–217) tails showed no variation of with the length of the tail (between one and five residues) for any of the series (Figure 21A), even though T2 relaxation times from 1H NMR and X-ray analysis of crystal structures of CA II–sulfonamide complexes demonstrated that these tails do interact with CA II.185,202,377 We discuss this surprising result further in section 10.6.3.
Figure 21.

Variation in (A) observed free energy of binding and dissociation constant, (B) enthalpy of binding, and (C) entropy of binding with the number of residues in the chain for para-substituted benzenesulfonamides with oligoethylene glycol (ArEGnOMe, 72–76), oligoglycine (ArGlynO–, 63–67), and oligosarcosine (ArSarnO−,213–217) chains to BCA II. Linear fits to the data in (B) and (C) are shown. The observed fitting parameters (slope in kcal mol−1 residue−1, y-intercept in kcal mol−1) are as follows: (for (B), in ΔH∘) ArGlynO− (0.58 ± 0.04, −14.0 ± 0.1), ArSarnO− (0.59 ±0.07, −12.4 ± 0.2), ArEGnOMe (0.30 ± 0.06, −10.6 ± 0.2); (for (C), in −TΔS∘) ArGlynO− (−0.54 ± 0.03, 4.8 ± 0.1), ArSarnO− (−0.61 ± 0.06, 3.7 ± 0.2), ArEGnOMe (−0.22 ± 0.05, 0.8 ± 0.2). Uncertainties were given by the linear least-squares fitting procedure. The horizontal dashed line in (C) separates favorable (−TΔS∘< 0) from unfavorable (−TΔS∘ > 0) entropy of binding. Reproduced with permission from ref 415. Copyright 2006 American Chemical Society.
10.4.3. Conclusions
The systematic studies of benzenesulfonamides with alkyl and fluoroalkyl tails demonstrate that longer hydrophobic “tails” can increase the affinity of sulfonamides for CA II. These studies also suggest that fluoroalkyl tails and alkyl tails make the same contribution to hydrophobic binding to CA II when normalized for differences in molecular surface area.
The principle of increasing surface area to increase the affinity of proteins for ligands is not completely general, however. The results with benzenesulfonamides with oligoethylene glycol, oligoglycine, and oligosarcosine tails shows that, in certain cases, increasing the surface area of contact does not increase the affinity. Understanding the thermodynamic basis for these anomalous data requires a separate examination of enthalpy and entropy of binding (see section 10.6).
10.5. Bivalent Approaches to CA Binding
10.5.1. General Approach: Addition of a Secondary Recognition Element to the Tail
Multivalency is the operation of multiple molecular recognition events or interactions between two entities (e.g., molecules, molecular aggregates, viruses, cells, and surfaces).416,594,595 It has been exploited extensively in the design of ligands for proteins.416,595 In principle, a multivalent ligand will benefit from two or more favorable interactions with the same translational and rotational entropic “cost” as a monovalent ligand with only one interaction.
Bivalency, the simplest form of multivalency, involves only two interactions between receptor and ligand. It has been used (incidentally or intentionally) in the design of para-substituted benzenesulfonamides to bind to CA: a secondary recognition element (SRE) is attached to the conserved arylsulfonamide primary recognition element (comprising the sulfonamide head group and phenyl ring) by a tail (Figure 11). The most successful bivalent arylsulfonamides have exploited contacts between the secondary recognition element and two hydrophobic patches in the conical cleft of CA II.284,377,507,508,596 As mentioned in section 10.2.3, the mode of binding of the head group and the phenyl ring (the primary recognition element) of the p-substituted benzenesulfonamide is conserved with variation of the para-substituent; this consistent binding allows a direct evaluation of the influence of the secondary recognition element on affinity.
10.5.2. Hydrophobic Secondary Recognition Elements Close to the Phenyl Ring of the para-Substituted Benzenesulfonamide
10.5.2.1. Aromatic and Alkyl Moieties as Secondary Recognition Elements
Using p-substituted benzenesulfonamides of the form p-H2NSO2C6H4CONHR where R was a hydrophobic group (e.g., substituted benzenes (52–54), pyridine- and naphthalene-containing heterocycles (59–62), and nonaromatic rings (49 and 50)), Jain et al. demonstrated that the R group contributed to the affinity of arylsulfonamides (e.g., R = CH3 (5), Kd = 150 nM; R = benzyl (51), Kd = 1.1 nM) for BCA II and HCA II and that affinity was independent of the exact structure of the hydrophobic group (e.g., for R = benzyl (51), cyclohexylmethyl (49), 1-ada-mantylmethyl (50), or 1-napthylmethyl (62), Kd ≈ 1 nM) (Table 10).284 This independence of affinity on the structure of the R group suggested that a hydrophobic secondary recognition element did not have to be carefully designed in order to contribute to the affinity. From an analysis of the X-ray crystal structure of the complex of HCA II with 51, Jain et al. and Cappalonga Bunn et al. concluded that the R group makes contact with a hydrophobic pocket of HCA II defined by Phe131, Val135, Leu198, and Pro202 (see section 4.6).202,284
Sigal and Whitesides examined the affinity of para-substituted benzenesulfonamides, with pendant amino acids (p-H2NSO2C6H4CONH-AA-OH) (89–103) as secondary recognition elements, for HCA II.507 They observed that hydrophobic amino acids increased the affinity of arylsulfonamides (Table 10) and that aliphatic amino acids contributed at least as much to affinity as aromatic ones (e.g., AA = Gly (103), Kd = 310 nM; AA = Ile (101) or Leu (102), Kd = 9 nM; AA = Phe (103), Kd = 13 nM). The investigators rationalized these results by concluding that, although the aromatic amino acids had greater hydrophobic surface areas than the aliphatic ones, this greater surface area of aromatic amino acids was partially compensated by their higher polarizability, which would stabilize these groups in polar solvents (that is, free in aqueous solution) and, thus, disfavor association with the enzyme.
10.5.2.2. Influence of Fluorination on the Secondary Recognition Element
Jain and co-workers examined the affinity of compounds of the form p-H2NSO2C6H4CONH-CH2C6HnF5−n (55–58), and the X-ray crystal structures of these ligands complexed with HCA II, to explore the nature of the interaction between the secondary phenyl ring of the ligand and Pro202 and Phe131 of CA II.180,249,515,516,597,598 Using HCA II and a mutant of HCA II where Phe131 was mutated to Val, the investigators claimed to dissect the interactions between the secondary recognition element and wild-type HCA II into (i) dipole–induced dipole interactions between the fluorinated ring of SRE and Pro202, (ii) dipole–quadrupole interactions between the fluorinated ring of SRE and Phe131, and (iii) quadrupole–quadrupole interactions between the fluorinated ring of SRE and Phe131.180 The investigators generated a linear free energy relationship (with R2 = 0.83) between affinity and these different multipole–multipole contributions for five of the ligands; their analysis suggested that the relative importance of the three terms varied within the series of ligands, with no single term being dominant for all of the ligands. While their correlation was impressive, the range in affinities of the arylsulfonamides for the two proteins (wild-type and mutant HCA II) was too narrow (variation in of ~20-fold), and the number of ligands too small, to provide a real test of the underlying hypothesis.
10.5.2.3. Highest Affinity Ligand for HCA II Reported to Date
Grzybowski et al. exploited bivalency to design the highest affinity ligand (109) for HCA II reported to date (Kd ≈ 30 pM).189 This arylsulfonamide was designed by combinatorial small-molecule growth (CombiSMoG), a computational approach based on a knowledge-based potential (from analyses of reported X-ray crystal structures of HCA/arylsulfonamide complexes) and a Monte Carlo ligand growth algorithm (see section 9.5). The X-ray crystal structure of 109 in complex with HCA II revealed that the indole moiety (a secondary recognition element) of the ligand made contacts with the hydrophobic pocket (Leu198, Pro202, Val135, and Phe131) of HCA II and that the N-methyl group fit into a tight pocket between Leu198 and Pro202 (Figure 22). This simulation successfully predicted the free energy and geometry of binding of 109 and of its enantiomer (110), which binds ~10-fold less strongly (Table 10).
Figure 22.

Structure of the active site of HCA II bound to compound 109 (shown as a chemical structure).189 The van der Waals surface of the enzyme is opaque gray, and that of the ligand is translucent purple. Relevant residues are indicated, most notably Leu198 and Pro202 on the hydrophobic wall.
10.5.3. Hydrophobic Secondary Recognition Elements Separated from the Phenyl Ring of the Arylsulfonamide
10.5.3.1. Benzyl Moieties as Secondary Recognition Elements for the “Hydrophobic Wall” of CA
Jain et al. examined the binding of bivalent para-substituted benzene-sulfonamides with benzyl moieties as secondary recognition elements and oligoglycine (69–71) or oligoethylene glycol (77–82) chains as tails.284,377 These ligands were engineered to allow the benzyl esters to interact with a second hydrophobic site of the enzyme, the “hydrophobic wall”, defined primarily by Leu198, Pro201, and Pro202 (and, to a lesser extent, by Phe20). The affinities for HCA II of benzyl-ester-terminated benzenesulfonamides with tails of two (69) and three (70) Gly residues were the same (Kd ~ 75 nM), only ~2 fold higher than that for p-H2NSO2C6H4CONHCH3 (37, Kd = 150 nM284) and ~4-fold higher than the affinities for BCA II of benzenesulfonamides with Gly tails without benzyl esters (64 and 65). The affinity for BCA II of the benzenesulfonamide with four Gly residues (71, Kd ≈ 210 nM) was ~3-fold lower than those for 69 and 70. The affinities of benzyl-ether-terminated benzenesulfonamides with tails of oligoethylene glycol (77–82) for BCA II decreased monotonically with increasing tail length, but only by a factor of 2 over the range of one (77) to six (82) residues. These affinities were only 4–5-fold higher than for methyl-ether-terminated benzenesulfonamides with oligoethylene glycol tails (72–76).
These results with oligoglycine and oligoethylene glycol tails suggest that the hydrophobic secondary recognition element must be close to the phenyl ring to exert a strong effect on affinity (e.g., for p-H2NSO2C6H4CONHCH2Ph, Kd ≈ 1.1 nM) and that the benzyl moieties well-separated from the phenyl ring of the substituted benzenesulfonamide were not interacting strongly with the hydrophobic wall of the enzyme. In line with these thermodynamic data, the crystal structure of the complex of HCA II with 70 revealed that the tail, and not the benzyl ester, interacted with Pro201 and Pro202; the benzyl ester could not be visualized in the structure due to disorder.202,284 Molecular dynamics simulations, however, have suggested a possible, transient interaction of the benzyl ester of 70 with Phe20 and Pro202 of HCA II.599
10.5.3.2. Hydrophobic Amino Acids as SREs
Boriack et al. examined the binding of arylsulfonamides of structure p-H2NSO2C6H4CONH(CH2CH2O)2CH2CH2NHCO-AA-NH3+ with amino acids (AAs) as secondary recognition elements and triethylene glycol as a tail (83–85).185 They observed that para-substituted benzenesulfonamides containing nonpolar amino acids (AA = Gly (84), Phe (85), or Leu, Kd ≈ 15 nM) bound with ~2-fold higher affinity than the unsubstituted compound (83, Kd ≈ 43 nM). X-ray crystal structures of complexes of the benzenesulfonamides with HCA II revealed that the oligoethylene glycol tail interacted with the hydrophobic wall of the enzyme and that, again, the secondary recognition elements (the pendant amino acids) were disordered and, thus, could not be visualized. This result, and the similar values of Kd for benzenesulfonamides with and without hydrophobic amino acids, are consistent with the results of Jain et al. presented above: hydrophobic secondary recognition elements make only a small contribution to affinity when separated from the phenyl ring of the benzenesulfonamide.
Sigal and Whitesides examined the affinity of para-substituted benzenesulfonamides containing hydrophobic amino acids separated from the phenyl ring by tails of zero (96 and 98–102), one, two, or three Gly residues.507 They observed that the increase in affinity contributed by the hydrophobic amino acid fell drastically as the tail length increased. For example, with Leu as the amino acid, the value of Kd increased from 9 nM for the benzenesulfonamides with zero Gly residues in the tail (102) to 130 nM with one Gly residue to 210 nM for the ligand with two or three Gly residues in the tail.
10.5.3.3. Unsuccessful Attempts to Design SREs to Interact with the Hydrophobic Pocket and Wall of CA
Attempts to design benzenesulfonamides that could interact with both the hydrophobic pocket and hydrophobic wall of the enzyme have been largely unsuccessful.284 For example, 106 was designed to contain a phenyl substituent (phenylglycine, Phg, residue) to interact with the hydrophobic pocket and a benzyl ester to interact with the hydrophobic wall of HCA II; the affinity of this ligand, however, was the same as that of 51, a substituted benzenesulfonamide with only a phenyl substituent. X-ray crystal structures demonstrated that the Phg residue of 106 interacted with the hydrophobic pocket of HCA II and that this interaction seemed to “steer” the benzyl ester away from the hydrophobic wall (the benzyl ester was not ordered enough to be located in the crystal structure).284
10.5.4. Hydrophilic or Charged Secondary Recognition Elements
A few studies have attempted to engineer contacts between hydrophilic or charged secondary recognition elements of substituted benzenesulfonamides and the hydrophilic half of the conical cleft of HCA II (see section 4.6).185,235,507 Sigal and Whitesides undertook the most rigorous study using amino acids as polar secondary recognition elements separated from the phenyl ring of the ligand by tails of zero (89–95 and 97), one, two, or three Gly residues.507 Their results demonstrated that charged or polar amino acids directly connected to the phenyl ring had either no effect on, or were deleterious to, affinity (e.g., Glu (90), Kd = 530 nM; Arg (97), Kd = 220 nM; Gln (92), Kd = 140; compared to Gly (95), Kd = 310 nM). The ligand with Thr as the secondary recognition element (94) demonstrated a ~6-fold increase in affinity (Kd = 53 nM) over that with Gly (95); the investigators attributed this effect to hydrophobic contacts of Thr with HCA II instead of polar ones because the ligand with Ser (93, Kd = 240 nM) as the secondary recognition element had an affinity comparable to the ligand with Gly (95). This lack of effect of charged or polar secondary recognition elements persisted as these elements were spaced farther from the phenyl ring. The investigators attributed this lack of success to the fact that it is more difficult to engineer hydrogen bonds and ionic interactions than hydrophobic contacts;507 this idea is consistent with the observation that hydrogen bonds and ionic interactions are often geometrically demanding.4,30,397
Boriack et al. also examined the affinity of polar or charged amino acids as secondary recognition elements, but their amino acids were linked to the benzenesulfonamide scaffold by triethylene glycol tails (86–88).185 Consistent with the results of Sigal et al., ligands with polar (Ser (86), Kd ≈ 41 nM) or charged (Glu (87), Kd ≈ 100 nM; Lys (88), Kd ≈ 50 nM) amino acids bound with affinities that were similar to, or slightly lower than, the control compound with no secondary recognition element (H (83), Kd ≈ 43 nM).
10.5.5. Metal Ions as Secondary Recognition Elements
Two metal ions, HgII and CuII, have served as secondary recognition elements in the binding of benzenesulfonamides to HCA. The complex of HCA II with 3-acetoxymercuri-4-aminobenzenesulfonamide (253) is of historical importance. This inhibitor complex initially served as a heavy atom derivative of HCA II to aid in the determination of the crystal structure of the enzyme.159,600 That the HgII ion served as a (somewhat fortuitous) secondary recognition element was not recognized until a pioneering study in which Eriksson et al. formed a complex between HCA II and 253; they noticed that the HgII ion of 253 bound to His64 of HCA II.186 Chakravarty and Kannan obtained similar results for the complex between 253 and HCA I.211 HgII has yet to be used as an explicit secondary recognition element to study the binding of ligands to CA.
Srivastava, Mallik, and co-workers examined the affinity of para-substituted benzenesulfonamides with CuII ions (coordinated by iminodiacetate moieties) serving as the secondary recognition elements (e.g., 218 and 219) for HCA I and II and BCA II.181,596,601,602 For 218, they observed a ~2–7-fold higher affinity than for benzenesulfonamides with triethylene glycol tails (83, which contains a primary amine, and 74, which contains a methyl ether), and for 219, they observed an affinity comparable to that for an benzene-sulfonamide with an ethyl tail (38).181,596,602 They believed that interactions between the CuII ion and a His of HCA were important because of the following: (i) the affinity of a metal-free version of 218 for HCA II was ~50-fold lower than that of 218 and the same as that of benzenesulfonamide (1); (ii) the absorbance maximum of the CuII ion of 218 shifted to longer wavelength when titrated with HCA II; (iii) the affinity of 218 for HCA II that had been treated with diethyl pyrocarbonate, a reagent that reacts with accessible His residues,603 was ~15-fold lower than that for HCA II.596,602
X-ray crystal structures of several complexes of CuII-containing ligands with HCA II revealed clear electron density of a CuII ion coordinated to the iminodiacetate (IDA) moiety of the ligand and to a His of the enzyme for only one of the ligands, 219.181 In this complex, the ligand-bound CuII was chelated by His64, which lies inside the conical cleft of HCA II and serves as the proton shuttle for the enzyme (see section 4.6). Compound 219 also formed a complex with HCA I in which the ligand-bound CuII bound to another His residue in the conical cleft of the enzyme (His200). For the other complexes, no electron density for the IDA moiety, or for the putatively bound CuII, of the ligand bound at the active site was apparent, although free CuII ions that were not bound by a sulfonamide ligand were observed to be bound by one or more of the His residues of HCA II. Interestingly, they noted a 2:1 stoichiometry of ligand to HCA II in all of their complexes; the second ligand interacted with residues of the amino terminus of HCA II at the rim of the conical cleft.
While the idea of using a chelated CuII ion as a secondary recognition element to coordinate surface His residues of HCA is interesting, the increases in affinity observed so far have been modest (factors of <10 in ). Further, the approach has only been validated by X-ray crystallography for one of the CuII-containing ligands. A next generation of ligands that demonstrates high affinities (higher than ligands with hydrophobic SREs) and validation of metal ion coordination to surface His residues of CA by X-ray crystallography is necessary to prove the validity and utility of this approach.
10.5.6. Reactive Epoxides as Secondary “Recognition” Elements: Covalent Labeling of CA
Chen et al. and Takaoka et al. reported the use of para-substituted benzenesulfonamides with epoxides as secondary “recognition” elements (220 and 221).604,605 They demonstrated that their ligands selectively labeled one (or two closely spaced) His residues of HCA II, and that the covalent reaction was directed by binding of the ligand to the active site of the enzyme: no labeling of HCA II was observed when a large excess of a high-affinity arylsulfonamide competitor was included in the reaction with the epoxide probe. Chen et al. demonstrated that their probe (220) labeled His64, a catalytically essential residue located in the conical cleft of HCA II (see section 4.6), and that it labeled HCA II selectively in the yeast proteome (when an extra, controlled amount of HCA II was added to the proteome).604 Using a probe (221) that lacked the fluorescein moiety (Fluor) of, and that was slightly longer than, 220, Takaoka et al. were able to label a His residue at the amino terminus of HCA II (His3 or His4), outside of the conical cleft.605 They were able to regenerate the catalytic activity of the enzyme by removal of the sulfonamide moiety of the tethered molecule by reaction with an alkoxyamine.
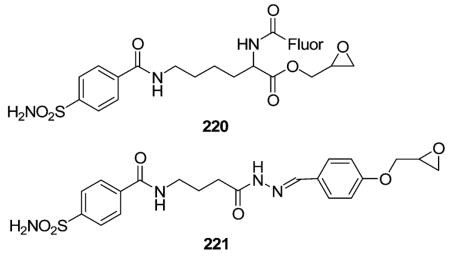
10.5.7. Conclusions
Multivalency can enhance binding, but this approach has only made significant increases in affinity (>10-fold) with hydrophobic groups that are connected directly to the arylsulfonamide ring. This observation suggests that only the design of contacts to the hydrophobic pocket (Phe131, Val135, Leu198, and Pro202) near the active site of the enzyme has been effective; attempts to design contacts with residues of the “hydrophobic wall” (Leu198, Pro201, Pro202, and perhaps Phe20) of the enzyme have not yielded significant increases in affinity.
Although half of the conical cleft of CA contains hydrophilic or charged residues, the use of polar or charged secondary recognition elements has not resulted in increases in affinity (even when these elements are directly connected to the arylsulfonamide ring). This ineffectiveness could originate from hydrophilic or ionic interactions being intrinsically weaker than hydrophobic interactions or from the more stringent geometric requirements for these interactions than for hydrophobic interactions. The use of metals as secondary recognition elements to chelate His residues of CA is a promising idea but one that has, practically, only shown small effects so far (certainly smaller than for hydrophobic SREs). X-ray crystal structures have only validated coordination of a His residue of HCA–His64 of HCA II, His200 of HCA I (residues inside the conical cleft of HCA)–for one of the metal-containing ligands.
The active site-directed covalent labeling of His residues of HCA by epoxides as secondary recognition elements has been demonstrated. This approach has been successful in targeting HCA in an artificial mixture of proteins and could represent a means of converting weak interactions into strong ones.
10.6. Enthalpy and Entropy of Binding of Arylsulfonamides to CA
10.6.1. Overview and General Approach
Up to this point, we have only discussed the binding of arylsulfonamides to CA in terms of the free energy of binding (or ). As we discussed in section 10.2.2, dissecting the free energy into its components of enthalpy and entropy will help us to understand the underlying physical principles of high-affinity binding. We believe that this understanding will ultimately facilitate the rational design of high-affinity ligands for proteins.
In this section, we survey the reported values of enthalpy and entropy of binding of arylsulfonamides to CA II. We adopt an organization similar to the one we used when discussing the free energy of binding: we explore the influence on the observed thermodynamics of binding of structural perturbations of the arylsulfonamide that affect the head group and the ring (sections 10.6.3–10.6.5) and the tail (section 10.6.6), separately. The observed values of enthalpy and entropy of binding depend on the experimental conditions: the pH, which determines the fractions of arylsulfonamide and CA II in the active forms (see section 10.3, Scheme 1), and the enthalpy of ionization of the buffer (since protons are taken up and released by the buffer). Thus, we only discuss the observed thermodynamic parameters for a series of arylsulfonamides reported under a given set of assay conditions (and often only those reported by one group of investigators).
To remove the dependence of the thermodynamic parameters on the assay conditions, in section 10.6.3 we calculate thermodynamic parameters for the binding of the arylsulfonamide anion to the CA–ZnII–OH2+ form of the enzyme (eq 18). This analysis allows us to compare directly values obtained by different investigators, by different techniques, and under different experimental conditions. We also compare the thermodynamic parameters that have been determined by van’t Hoff analysis and by microcalorimetry (section 10.6.4), when both sets of data are available.
10.6.2. Influence of Structural Perturbations of the Head and Ring Regions of the Arylsulfonamide on the Observed Enthalpy and Entropy of Binding
Taylor et al. were the first to determine the enthalpy and entropy of binding of a sulfonamide to CA; they measured the temperature-dependence of the affinity ( ) of p-nitrobenzenesulfonamide (3) for HCA II.458 Using van’t Hoff analysis (eq 14), they concluded that binding was driven by enthalpy with only a small contribution of entropy (Table 13). Their van’t Hoff plot showed slight curvature; this observation suggests that the change in heat capacity upon complexation was nonzero over this temperature range and brings into question the quantitative accuracy of their results (see section 10.2.2).
Table 13.
Separated Values of Enthalpy and Entropy for the Association of Arylsulfonamides with CA II
| Compound | CA II Variant | (kcal mol−1) | (kcal mol−1) | (kcal mol−1) | ΔCp,obs (cal mol−1 K−1) |
|---|---|---|---|---|---|
| 1 | HCA | −9.1a | −10.9 ± 0.2b,c | 1.8 | 30 ± 20b,c |
| 1 | BCA | −8.4 ± 0.05b,d | −9.9 ± 0.05b,c | 1.5 ± 0.1 | |
| 1 | BCA | −8.4 ± 0.05b,d | −9.8 ± 0.05b,e | 1.4 ± 0.1 | |
| 1 | BCA | −8.4 ± 0.05b,d | −9.0 ± 0.5b,d | 0.7 ± 0.6 | |
| 3 | HCA | −10.3f | −9.5f,g | −0.8 | |
| 4 | BCA | −7.1 ± 0.2b,h | −10.8 ± 0.12b,e | 3.7 ± 0.2 | |
| 4 | BCA | −7.1 ± 0.2b,h | −8.3 ± 3b,i | 1.2 ± 3.0 | −52 ± 20b,h |
| 4 | HCA | −6.6 ± 0.1j | −7.7 ± 0.2g,j | 1.1 ± 0.2 | |
| 6 | BCA | −9.7a | −10.8b,e | 1.1 | |
| 29 | BCA | −8.6 ± 0.13b,h | −9.6 ± 1.5b,h,k | 1.0 ± 1.5 | |
| 29 | BCA | −8.3 ± 0.3l | −11.6 ± 0.4g,l | 3.3 ± 0.5 | |
| 29 | BCA | −8.4 ± 0.2b,l | −11.9 ± 0.4b,l | 3.5 ± 0.4 | |
| 29 | BCA | −8.6 ± 0.02b,m | −14.8 ± 0.5b,m | 6.2 ± 0.5 | |
| 37 | BCA | −9.1 ± 0.03b,m | −10.8 ± 0.4b,m | 1.7 ± 0.4 | |
| 63 | BCA | −9.0 ± 0.02b,m | −13.3 ± 0.4b,m | 4.3 ± 0.4 | −24 ± 2b,m |
| 64 | BCA | −9.1 ± 0.03b,m | −12.9 ± 0.4b,m | 3.8 ± 0.4 | |
| 65 | BCA | −9.1 ± 0.03b,m | −12.3 ± 0.4b,m | 3.2 ± 0.4 | −18 ± 10b,m |
| 66 | BCA | −9.0 ± 0.02b,m | −11.5 ± 0.4b,m | 2.5 ± 0.4 | |
| 67 | BCA | −8.9 ± 0.04b,m | −11.1 ± 0.5b,m | 2.2 ± 0.5 | −20 ± 7b,m |
| 72 | BCA | −9.8 ± 0.03b,m | −10.2 ± 0.5b,m | 0.4 ± 0.5 | −40 ± 8b,m |
| 73 | BCA | −9.6 ± 0.03b,m | −10.0 ± 0.3b,m | 0.4 ± 0.3 | |
| 74 | BCA | −9.6 ± 0.06b,m | −10.0 ± 0.3b,m | 0.4 ± 0.3 | −47 ± 8b,m |
| 75 | BCA | −9.4 ± 0.05b,m | −9.4 ± 0.3b,m | 0.0 ± 0.3 | |
| 76 | BCA | −9.4 ± 0.05b,m | −9.0 ± 0.3b,m | −0.4 ± 0.3 | −40 ± 20b,m |
| 133 | BCA | −8.8 ± 0.9l | −5.7 ± 0.4g,l | −3.1 ± 1.0 | |
| 133 | BCA | −8.8 ± 0.9b,l | −4.8 ± 0.4b,l | −4.0 ± 1.0 | |
| 136 | BCA | −11.1 ± 0.2b,h | −5.2 ± 1.1b,h,k | −5.8 ± 1.1 | −155 ± 20b,h |
| 136 | HCA | −10.7b,h | −6.2b,h,k | −4.5 | −148b,h |
| 137 | BCA | −10.4 ± 0.07b,h | −10.2 ± 1.2b,h,k | −0.2 ± 1.2 | −107 ± 10b,h |
| 137 | HCA | −11.2b,h | −11.7b,h,k | 0.5 | −64b,h |
| 138 | BCA | −10.1 ± 0.07b,h | −14.5b,c | 4.4 | |
| 138 | BCA | −10.1 ± 0.07b,h | −9.1 ± 1.6b,h,k | −1.0 ± 1.6 | −79 ± 20b,h |
| 138 | HCA | −10.4b,h | −10.4b,h,k | 0.0 | −73b,h |
| 138 | HCA | −10.4 ± 0.1j | −10.7 ± 0.2g,j | 0.3 ± 0.2 | |
| 139 | BCA | −11.4 ± 0.2j,n | −14.4b,c | 3.0 | |
| 139 | HCA | −11.4 ± 0.2j | −15.0 ± 0.14b,c | 3.6 ± 0.2 | −30 ± 20b,c |
| 139 | HCA | −11.4 ± 0.2j | −11.0 ± 0.4g,j | −0.4 ± 0.4 | |
| 140 | HCA | −11.9 ± 0.1j | −8.6 ± 0.3g,j | −3.3 ± 0.3 | |
| 157 | HCA | −11.6 ± 0.1j | −10.3 ± 0.4g,j | −1.3 ± 0.4 | |
| 188 | BCA | −10.7 ± 0.02b,h | −8.9 ± 1.0b,h,k | −1.8 ± 1.0 | −35 ± 10b,h |
| 188 | HCA | −10.9b,h | −12.0b,h,k | 1.1 | −48b,h |
| 188 | HCA | −10.5 ± 0.1j | −11.4 ± 0.2g,j | 0.9 ± 0.2 | |
| 207 | BCA | −9.1 ± 0.06b,d | −10.2 ± 0.2b,d | 1.1 ± 0.2 | |
| 208 | BCA | −9.7 ± 0.07b,d | −9.0 ± 0.2b,d | −0.7 ± 0.2 | |
| 209 | BCA | −8.5 ± 0.05b,d | −7.8 ± 0.5b,d | −0.7 ± 0.5 | |
| 210 | BCA | −9.2 ± 0.05b,d | −9.4 ± 0.4b,d | 0.2 ± 0.4 | |
| 211 | BCA | −9.9 ± 0.14b,d | −9.6 ± 0.3b,d | −0.3 ± 0.3 | |
| 212 | BCA | −10.4 ± 0.1b,d | −8.9 ± 0.1b,d | −1.4 ± 0.1 | |
| 213 | BCA | −8.5 ± 0.03b,m | −11.7 ± 0.4b,m | 3.2 ± 0.4 | −43 ± 10b,m |
| 214 | BCA | −8.9 ± 0.02b,m | −11.5 ± 0.4b,m | 2.6 ± 0.4 | |
| 215 | BCA | −8.8 ± 0.02b,m | −10.4 ± 0.4b,m | 1.6 ± 0.4 | −45 ± 16b,m |
| 216 | BCA | −8.7 ± 0.03b,m | −10.0 ± 0.4b,m | 1.3 ± 0.4 | |
| 217 | BCA | −8.7 ± 0.03b,m | −9.5 ± 0.3b,m | 0.8 ± 0.3 | −49 ± 23b,m |
| 222 | BCA | −6.1 ± 0.2b,h | −2.4 ± 2.8b,h,k | −3.7 ± 2.8 | −50 ± 40b,h |
From references listed in Table 10.
Determined by calorimetry.
Measured in 50 mM Hepes buffer, pH 8.2.405
Measured in 20 mM sodium phosphate buffer, pH 7.5.182
Measured in 50 mM Tris buffer, pH 8.2.405
Measured in 20 mM sodium phosphate buffer, pH 7.6.458
Estimated by van’t Hoff analysis.
Data reported at pH 7.0 and T = 310 K417 have been extrapolated to T = 298 K.
Measured in 20 mM PIPES buffer, pH 7.0.417
Measured in 50 mM barbital buffer with “average” pH 7.5.608
Extrapolated to a buffer enthalpy of ionization of zero.417
Measured in PBS (10 mM phosphate pH 7.4, 150 mM NaCl).412
Measured in 20 mM sodium phosphate pH 7.5.415
Assumed to be equal to the value reported for HCA II.
Table 13 lists all of the reported values of enthalpy (ΔH∘obs) and entropy (−TΔS∘obs) for the binding of arylsulfonamides to HCA II and BCA II. We found no correlation between ΔH∘obs or −TΔS∘obs and pKa (data not shown); this observation indicates that there are more contributions to these thermodynamic parameters than simply the formation of ArSO2NH− from ArSO2NH2. We did, however, observe a reasonable correlation (R2 = 0.74) between ΔH∘obs and −TΔS∘obs (Figure 23A). We do not make too much of this linear plot, however. The range in ΔG∘obs spanned by the ligands is much smaller than that in ΔH∘obs or in −TΔS∘obs; this fact requires a linear relationship between ΔH∘obs and −TΔS∘obs (see section 10.2.2).574–576
Figure 23.

Variation of enthalpy with entropy for the association of arylsulfonamides with CA II. Plots for the (A) observed thermodynamic parameters and (B) those calculated for the association of the arylsulfonamide anion with CA –ZnII–OH2+ (eq 18; Scheme 1) using eq 25 are shown. The data are listed in Tables 13 and 14. The fitting parameters and correlation coefficients (slope, y-intercept in kcal mol−1, and R2) are as follows: for (A) −0.86 ± 0.07, −9.52 ± 0.17, and 0.74, and for (B) −1.03 ± 0.09, −12.85 ± 0.18, and 0.74. Uncertainties are from the least-squares fitting procedure. The dashed lines separate favorable (−TΔS∘ < 0) from unfavorable (−TΔS∘ > 0) entropy of binding, and the dotted lines are placed to signify “moderate” entropy of binding with a magnitude of TΔS∘ ≤ 2 kcal mol−1.
Consistent with the results of Taylor et al., the majority of arylsulfonamides bind to CA II with a small entropy of binding (|TΔS∘obs| < 2 kcal mol−1) and lie between the two vertical dotted lines in Figure 23A. The few that bind with a change in entropy more favorable than these “limits” are relatively hydrophobic (e.g., ethoxzolamide, 140; dansylamide, 133; and dichlorophenamide, 136) and could be taking advantage of hydrophobic contacts with CA II. An interesting outlier is p-aminomethylbenzenesulfonamide (222); this sulfonamide binds with the lowest exothermicity (ΔH∘obs = −2.4 kcal mol−1) of all of the arylsulfonamides studied to date. This low exothermicity could be a result of electrostatic repulsion of the positive charge of the –CH2NH3+ moiety of this sulfonamide by the positively charged active site of BCA II. Most of the arylsulfonamides that bind with very unfavorable entropies (−TΔS∘obs > 2 kcal mol−1) are negatively charged (e.g., carboxylates for 63, 64, 65, and 29); the unfavorable entropies could represent an entropic penalty for orienting the negative charges in the positively charged active site of BCA II.
The changes in heat capacity upon CA II–arylsulfonamide complexation (ΔCp) were relatively modest for all arylsulfonamides that have been examined. These values are negative for all arylsulfonamides (except benzenesulfonamide, 1); this observation suggests that hydrophobic (non-polar) surface area is buried upon complexation.566
10.6.3. Thermodynamics of Association of the Arylsulfonamide Anion (ArSO2NH−) with CA–ZnII–OH2+
We wish to remove the dependence of the enthalpy (ΔH∘obs) and entropy (−TΔS∘obs) of binding on the experimental conditions (e.g., pH and enthalpy of ionization of the buffer) and the physical properties (e.g., pKa and enthalpy of ionization) of the arylsulfonamides themselves, in order to explore the intrinsic thermodynamics of association of arylsulfonamides with CA II. For reasons that we have discussed in section 10.3.3, we have elected to use eq 18: the binding of the arylsulfonamide anion (ArSO2NH−) to the ZnII–water form of CA II (CA–ZnII–OH2+). We calculate ΔG∘ArSO2NH− from eq 21 and the well-known thermodynamic relation (ΔG∘ = −RT ln Keq = RT ln Kd), ΔH∘ ArSO2NH− from eq 25, and −TΔS∘ArSO2NH− through subtraction of the two.
| (25) |
In eq 25, θCA ZnII–OH2+ andθ ArSO2NH− are defined in eqs 20a and 20b, ΔH∘ion, buffer is the enthalpy of ionization of the buffer,606 ΔH∘ion, ArSO2NH− is the enthalpy of ionization of the arylsulfonamide, and ΔH∘ion, CA–ZnII–OH2+ is the enthalpy of ionization of the ZnII-bound water of the enzyme (estimated to be 6.9 kcal mol−1 from the temperature dependence of the esterase activity of BCA II; see section 8.3.2).607 Literature values of ΔH∘ion, ArSO2NH− are available for some arylsulfonamides (Table 14). For those sulfonamides for which literature values were not available, we estimated them by interpolation from a linear plot of literature values of ΔH∘ion, ArSO2NH− vs pKa.
Table 14.
Values of Enthalpy and Entropy for the Association of Arylsulfonamide Anion with CA–ZnII–OH2+
| Compound | CA II Variant | pKa | (kcal mol−1) | a(kcal mol−1) | b(kcal mol−1) | (kcal mol−1) |
|---|---|---|---|---|---|---|
| 1 | HCA | 10.1c,d | 9.1 ± 0.01d,e | −13.5c | −13.1e,f | −0.4 |
| 1 | BCA | 10.1c,d | 9.1 ± 0.01d,e | −12.8 ± 0.3e,g | −12.1 ± 0.1e,f | −0.6 ± 0.4 |
| 1 | BCA | 10.1c,d | 9.1 ± 0.01d,e | −12.8 ± 0.3e,g | −11.8 ± 0.1e,h | −1.0 ± 0.4 |
| 1 | BCA | 10.1c,d | 9.1 ± 0.01d,e | −12.9 ± 0.3e,g | −12.3 ± 0.6e,g | −0.6 ± 0.6 |
| 3 | HCA | 9.0c | 7.3i | −13.9j | −14.2j,k | 0.3 |
| 4 | BCA | 10.1c | 8.3i | −11.5 ± 0.4e,l | −12.0e,h | 0.5 |
| 4 | BCA | 10.1c | 8.3i | −11.8 ± 0.3e,l | −11.5e,l | −0.3 |
| 4 | HCA | 10.1c | 8.3i | −11.1 ± 0.3m | −9.3k,m | −1.8 |
| 6 | BCA | 10.2c | 8.3i | −14.2c | −12.1e,h | −2.1 |
| 29 | BCA | 9.6n | 4.8 ± 0.7e,n | −12.6 ± 0.3e,o | −10.5 ± 1.7e,o | −2.1 ± 1.7 |
| 29 | BCA | 9.6n | 4.8 ± 0.7e,n | −12.2 ± 0.4p | −10.9 ± 0.8k,p | −1.3 ± 0.9 |
| 29 | BCA | 9.6n | 4.8 ± 0.7e,n | −12.2 ± 0.3e,p | −11.2 ± 0.8e,p | −1.0 ± 0.9 |
| 29 | BCA | 9.6n | 4.8 ± 0.7e,n | −12.4 ± 0.3e,q | −13.8 ± 0.9e,q | 1.4 ± 0.9 |
| 37 | BCA | 10.3c | 8.4i | −13.9 ± 0.3e,q | −13.4e,q | −0.5 |
| 63 | BCA | 10.1r | 8.3i | −13.5 ± 0.3e,q | −15.7e,q | 2.3 |
| 64 | BCA | 10.1r | 8.3i | −13.6 ± 0.3e,q | −15.3e,q | 1.7 |
| 65 | BCA | 10.1r | 8.3i | −13.5 ± 0.3e,q | −14.7e,q | 1.2 |
| 66 | BCA | 10.1r | 8.3i | −13.5 ± 0.3e,q | −13.9e,q | 0.4 |
| 67 | BCA | 10.1r | 8.3i | −13.4 ± 0.3e,q | −13.5e,q | 0.1 |
| 72 | BCA | 10.1r | 8.3i | −14.3 ± 0.3e,q | −12.6e,q | −1.6 |
| 73 | BCA | 10.1r | 8.3i | −14.1 ± 0.3e,q | −12.4e,q | −1.7 |
| 74 | BCA | 10.1r | 8.3i | −14.0 ± 0.3e,q | −12.4e,q | −1.6 |
| 75 | BCA | 10.1r | 8.3i | −13.9 ± 0.3e,q | −11.8e,q | −2.1 |
| 76 | BCA | 10.1r | 8.3i | −13.9 ± 0.3e,q | −11.4e,q | −2.4 |
| 133 | BCA | 9.8c | 8.0i | −12.9 ± 0.9p | −8.2k,p | −4.7 |
| 133 | BCA | 9.8c | 8.0i | −12.9 ± 0.9e,p | −7.3e,p | −5.6 |
| 136 | BCA | 8.2n | 6.9 ± 0.4e,n | −13.2 ± 0.3e,o | −9.8 ± 1.2e,o | −3.4 ± 1.2 |
| 136 | HCA | 8.2n | 6.9 ± 0.4e,n | −12.8e,o | −8.8e,o | −4.0 |
| 137 | BCA | 7.3n | 5.4 ± 0.3e,n | −11.5 ± 0.2e,o | −11.6 ± 1.3e,o | 0.0 ± 1.3 |
| 137 | HCA | 7.3n | 5.4 ± 0.3e,n | −12.4e,o | −12.4e,o | 0.0 |
| 138 | BCA | 7.1n | 5.7 ± 0.2e,n | −11.9 ± 0.2e,o | −12.6 ± 0.1e,f | 0.7 ± 0.2 |
| 138 | BCA | 7.1n | 5.7 ± 0.2e,n | −11.0 ± 0.2e,o | −9.9 ± 1.7e,o | −1.1 ± 1.7 |
| 138 | HCA | 7.1n | 5.7 ± 0.2e,n | −11.4e,o | −10.3e,o | −1.1 |
| 138 | HCA | 7.1n | 5.7 ± 0.2e,n | −11.6 ± 0.1m | −9.8 ± 0.2k,m | −1.8 ± 0.2 |
| 139 | BCA | 8.3s | 6.3 ± 0.1s | −13.7 ± 0.3o | −13.2e,f | −0.4 |
| 139 | HCA | 8.3s | 6.3 ± 0.1s | −13.7 ± 0.3o | −13.9 ± 0.2e,f | 0.2 ± 0.4 |
| 139 | HCA | 8.3s | 6.3 ± 0.1s | −13.5 ± 0.3o | −10.6 ± 0.4k,m | −2.9 ± 0.5 |
| 140 | HCA | 8.1c | 6.5i | −13.8 ± 0.2m | −8.3k,m | −5.5 |
| 157 | HCA | 8.4c | 6.8i | −13.8 ± 0.3m | −10.3k,m | −3.6 |
| 188 | BCA | 6.3n | 5.0 ± 0.3e,n | −11.3 ± 0.1e,o | −6.5 ± 1.0e,o | −4.8 ± 1.0 |
| 188 | HCA | 6.3n | 5.0 ± 0.3e,n | −11.5e,o | −8.3e,o | −3.3 |
| 188 | HCA | 6.3n | 5.0 ± 0.3e,n | −11.5 ± 0.1m | −10.5 ± 0.2k,m | −1.1 ± 0.2 |
| 207 | BCA | 9.6d | 7.9 ± 0.03d,e | −12.8 ± 0.3e,g | −12.2 ± 0.2e,g | −0.6 ± 0.4 |
| 208 | BCA | 9.7d | 8.5 ± 0.06d,e | −13.6 ± 0.3e,g | −11.6 ± 0.2e,g | −2.0 ± 0.4 |
| 209 | BCA | 10.0d | 8.6 ± 0.03d,e | −12.8 ± 0.3e,g | −10.6 ± 0.5e,g | −2.2 ± 0.6 |
| 210 | BCA | 9.1d | 7.8 ± 0.14d,e | −12.3 ± 0.3e,g | −11.2 ± 0.5e,g | −1.1 ± 0.6 |
| 211 | BCA | 9.4d | 8.6 ± 0.04d,e | −13.4 ± 0.3e,g | −12.3 ± 0.3e,g | −1.1 ± 0.5 |
| 212 | BCA | 8.2d | 7.6 ± 0.03d,e | −12.4 ± 0.3e,g | −9.5 ± 0.5e,g | −2.9 ± 0.5 |
| 213 | BCA | 10.1r | 8.3i | −13.0 ± 0.3e,q | −14.1e,q | 1.2 |
| 214 | BCA | 10.1r | 8.3i | −13.4 ± 0.3e,q | −13.9e,q | 0.5 |
| 215 | BCA | 10.1r | 8.3i | −13.3 ± 0.3e,q | −12.8e,q | −0.5 |
| 216 | BCA | 10.1r | 8.3i | −13.2 ± 0.3e,q | −12.4e,q | −0.8 |
| 217 | BCA | 10.1r | 8.3i | −13.1 ± 0.3e,q | −11.9e,q | −1.2 |
| 222 | BCA | 8.4n | 6.7 ± 2.0e,n | −8.4 ± 0.3e,o | −6.5 ± 3.4e,o | −1.9 ± 3.4 |
From references listed in Table 10.
Measured in ref 182.
Determined by calorimetry.
Observed thermodynamic values measured in 50 mM Hepes buffer, pH 8.2.405
Observed thermodynamic values measured in 20 mM phosphate buffer, pH 7.5.182
Observed thermodynamic values measured in 50 mM Tris buffer, pH 8.2.405
Estimated from a linear plot of vs pKa for arylsulfonamides with experimental values of .
Observed thermodynamic values.458
Estimated by van’t Hoff analysis.
Observed thermodynamic values measured in 20 mM PIPES buffer, pH 7.0.417
Observed thermodynamic values measured in 50 mM barbital buffer with “average” pH 7.5.608
Measured in ref 417 and extrapolated to T = 298 K when necessary.
Observed thermodynamic values measured in 25 mM phosphate buffer, pH 7.0.417
Observed thermodynamic values measured in PBS (10 mM phosphate, pH 7.4, 150 mM NaCl).412
Observed thermodynamic values measured in 20 mM sodium phosphate, pH 7.5.415
Assumed to be equal to the value for compound 38 (see Table 10).
Measured in ref 405.
Table 14 lists the calculated thermodynamic data, and Figure 23B shows these data graphically. Similar to the results for the observed data, we observe no correlation between ΔH∘ArSO2NH− or −TΔS∘ArSO2NH− and pKa (data not shown). This result is compatible with the hypothesis that there are a number of structural interactions between the arylsulfonamide anion and CA II, each of which contributes to the enthalpy and entropy of binding. For the most part, values of ΔH∘ArSO2NH− measured calorimetrically by different research groups differ by <0.5 kcal mol−1 (Table 14). There are a few exceptions: values of ΔH∘ArSO2NH− for the binding of methazolamide (138) to BCA II differ by ~2.5 kcal mol−1 when measured by different investigators, and those for the binding of p-carboxybenzenesulfonamide (29) to BCA II differ by ~3 kcal mol−1 (Table 14). The different results for 138 could be due to the use of a low-sensitivity flow calorimeter by Binford et al.405 rather than a high-sensitivity isothermal titration calorimeter, as used by Matulis and Todd.417 The situation is more complicated for 29. The value of ΔH∘ArSO2NH− for 29 reported by Day et al.412 is significantly less exothermic (ΔΔH∘ArSO2NH− ~ 3 kcal mol−1) than that reported by Krishnamurthy et al.415 This difference could be due to the different experimental conditions: Day et al. used phosphate buffer containing sodium chloride (ionic strength ≈ 0.2 M), while Krishnamurthy et al. used phosphate buffer (ionic strength ≈ 0.05 M). The electrostatic interactions (and component thermodynamic parameters) between the carboxylate anion of the arylsulfonamide and BCA II would be expected to be sensitive to the ionic strength of the medium.
Enthalpy (ΔH∘ArSO2NH−) is a dominant factor in the binding of ArSO2NH− to CA–ZnII–OH2+ (eq 18) (as ΔH∘obs is in the observed binding of arylsulfonamides to CA II), but the entropy of binding (−TΔS∘ArSO2NH−) is favorable for almost all of the sulfonamides for which data are reported (Figure 23B). This observation is consistent with our intuition: −TΔS∘ArSO2NH− should be slightly favorable (and near zero) for this reaction, because the number of water molecules surrounding the free arylsulfonamide anion should be slightly greater than the number surrounding the displaced water (from the ZnII cofactor), while the intrinsic (translational and rotational) entropies of the arylsulfonamide anion and water are likely to be similar.594 This simple model assumes that the residual mobility and hydrophobic contacts of the arylsulfonamide anion when associated with CA II are the same as those of the water when associated with CA II. Differences in either of these two will give values of entropy of binding (−TΔS∘ArSO2NH−) that deviate significantly from zero.
Some arylsulfonamides bind with significantly favorable changes in entropy (−TΔS∘ArSO2NH− < −2 kcal mol−1; Figure 23B). Examining the structures of these ligands suggests that they are able to take advantage of hydrophobic contacts with CA II, although we cannot rule out the explanation that these ligands have greater residual mobility in complexes with CA II than do the other arylsulfonamides. An interesting example is the structurally simple trifluoromethanesulfonamide (188), which binds with a very favorable −TΔS∘ArSO2NH−.This observation is consistent with hydrophobic contacts of the trifluoromethyl moiety of the ligand with a hydrophobic pocket of HCA II revealed by X-ray crystallography (see section 10.3.4).201 At the other extreme, there are some arylsulfonamides that bind with unfavorable −TΔS∘ArSO2NH−. Most of these ligands are negatively charged, and their unfavorable entropies of binding could represent an entropic penalty for orienting their negative charges in the positively charged active site of CA II.
An interesting outlier in Figure 23B is p-aminomethylbenzenesulfonamide (222); this ligand binds with a lower exothermicity (less favorable ΔH∘ArSO2NH−) than anticipated and could suffer from electrostatic repulsion of its putative positive charge with the positively charged active site of BCA II (see section 10.6.2).
10.6.4. Comparison of ΔH∘ArSO2NH−from Calorimetry and van’t Hoff Analysis
As discussed in section 10.2.2, the two primary means of determining enthalpy and entropy of protein–ligand binding are calorimetry and van’t Hoff analysis. This section uses the system of CA II and arylsulfonamides as a testing ground to compare the thermodynamic parameters obtained by both techniques.
There are only five arylsulfonamides (139, 138, 188, 133, and 29) for which values of enthalpy of binding have been reported by both calorimetry and van’t Hoff analysis, and only two (133 and 29) for which these values have been reported under the same experimental conditions and by the same investigators (Table 14). There is no clear trend in the differences in values of ΔH∘ArSO2NH− from the two types of experiments. For the binding of benzolamide (139) to HCA II, ΔH∘ArSO2NH− from the calorimetric data of Binford et al. is ~3 kcal mol−1 more exothermic than that from the van’t Hoff data of Conroy and Maren (Table 14).405,608 While values of ΔH∘ArSO2NH− for the binding of methazolamide (138) to HCA II measured by calorimetry by Matulis and Todd and van’t Hoff analysis by Conroy and Maren showed good agreement (ΔΔH∘ArSO2NH− ≈ 0.5 kcal mol−1), the binding of trifluoromethanesulfonamide (188) to HCA II showed a significant discrepancy between values measured by the same two techniques (and in the direction opposite to that for 139: ΔH∘ArSO2NH− was ~2 kcal mol−1 less exothermic from calorimetry than from van’t Hoff analysis).417,608 In a study that allowed a direct comparison of the two techniques, Day et al. examined the thermodynamics of binding of dansylamide (DNSA, 133) and p-carboxybenzenesulfonamide (29) to BCA II in solution using ITC and to BCA II immobilized in a thin layer of dextran on a gold surface using surface plasmon resonance spectroscopy (SPR; see sections 8.4.3 and 12) and van’t Hoff analysis.412 They found that the values of enthalpy of binding determined by both techniques for both sulfonamides were within experimental error (ΔΔH∘ArSO2NH− < 1 kcal mol−1; Tables 12 and 13).
Because only a limited number of cases can be compared directly, we cannot draw clear conclusions about the correlation between values of enthalpy of binding determined by calorimetry and by van’t Hoff analysis–that is, we do not know whether these values are within error of one another or whether there is a consistent discrepancy between the values measured by the two techniques. A controlled study of the thermodynamics of binding of a number of arylsulfonamides to CA determined by both techniques under the same experimental conditions would be necessary to examine this issue. Nevertheless, we believe that calorimetry is the superior technique for measuring enthalpy and entropy of binding because it measures directly the heat released (and, thus, the enthalpy) upon protein–ligand complexation, and it is not subject to the experimental artifacts (most of which are caused by the limited range in temperature that can be examined in biological systems) that often plague van’t Hoff analyses (see section 10.2.2).
10.6.5. Influence of the Head Group: Fluorinated Benzenesulfonamides
Studies of the thermodynamics of binding of a heterogeneous set of arylsulfonamides (see sections 10.6.3 and 10.6.4) do not allow a direct estimate of the contributions of the head group or the aryl ring of the arylsulfonamide to the enthalpy and entropy of binding because of the heterogeneity of the interactions between each ligand and CA. This section highlights a well-controlled study by Krishnamurthy et al. that examines the thermodynamics of binding of a series of structurally similar ligands (fluorinated benzenesulfonamides, 207–212) to BCA II.182
As fluorination of the ring only slightly perturbs the size and shape of the ligands (and so they can be assumed to bind to the enzyme in a similar, conserved way), this study allowed the estimation of the magnitudes of the enthalpies (eq 26) and entropies (eq 27) of the different structural interactions between BCA II and benzenesulfonamide ligands. These equations were obtained from QSARs (Figure 16 parts B and C) between ΔH∘ArSO2NH− or −TΔS∘ArSO2NH− and pKa and log P by assuming that the pKa-dependent term included both the ZnII–N bond (ΔHiZnII–N for its enthalpy of binding and −TΔSi ZnII–N for its entropy of binding) and the hydrogen-bond network (ΔHiH–bonds for its enthalpy of binding and −TΔSiH–bonds for its entropy of binding), and the log P-dependent term consisted solely of the (mainly, hydrophobic) contacts between the phenyl ring and the enzyme (ΔHiring for its enthalpy of binding from van der Waals contacts and −TΔSiring for its entropy of binding from the “hydrophobic effect”4,557–560).
| (26a) |
| (26b) |
| (27a) |
| (27b) |
Figure 18 shows the ranges in values of the component enthalpies and entropies for the structural interactions between BCA II and the benzenesulfonamide ligands. ΔH∘ArSO2NH− is dominated by electrostatic interactions–the ZnII-bond and the hydrogen-bond network–and −TΔS∘ArSO2NH− is dominated by the hydrophobic contacts of the phenyl ring with the enzyme. The slightly unfavorable contribution of electrostatic interactions to −TΔS∘ArSO2NH− probably reflects enthalpy/entropy compensation: more enthalpically favorable interactions have less mobility at the protein–ligand interface (resulting in less favorable entropy of binding) than less enthalpically favorable interactions (see section 10.2.2).
10.6.6. Influence of the Tail Group: Oligoethylene Glycol, Oligoglycine, and Oligosarcosine Tails
This section addresses the enthalpic and entropic contributions of the tail region of the arylsulfonamide to affinity (Figure 11A). Specifically, it summarizes current understanding of the thermodynamic basis for the insensitivity of to chain length (n) for benzenesulfonamides containing tails of oligoethylene glycol (72–76), oligoglycine (63–67), and oligosarcosine (213–217) (see section 10.4.2; Figure 21A). Because the values of pKa of the sulfonamides are expected to be the same for all of these ligands, trends in the observed thermodynamic parameters (ΔH∘obs and –TΔS∘obs; Table 13) across the series are the same as trends in the thermodynamic parameters calculated for the binding of the sulfonamide anion to CA–ZnII–OH2+ (ΔH∘ArSO2NH− and −TΔS∘ArSO2NH−;Table 14).
Whitesides, Christianson, and co-workers202,377 previously rationalized this insensitivity of by invoking enthalpy/entropy compensation: the interaction of the tail with CA II increased as the length of the tail increased (more favorable enthalpy of binding due to increasing number of van der Waals contacts), but this increase was exactly compensated by the increasing conformational cost of restriction of freely rotating bonds (more unfavorable entropy of binding).416,594,609 The investigators found it astonishing that enthalpy and entropy of binding would be perfectly compensating for three different classes of tails.
Using isothermal titration calorimetry (ITC), Krishnamurthy et al. demonstrated that, although the data were reproducible, this mechanistic hypothesis was completely incorrect.415 They observed that the enthalpy of binding became less favorable, and the entropy of binding less unfavorable, as the length of the chain increased for arylsulfonamides with oligoethylene glycol, oligoglycine, and oligosarcosine tails, exactly counter to their expectations (Figure 21 parts B and C). In response to these data, the investigators proposed a different model in which the interface between the protein and the ligand became “looser” as the length of the tail of the sulfonamide increased; the looser interface would have greater entropic mobility and a less favorable enthalpy (due to fewer van der Waals contacts) than a “tighter” one (Figure 24). In their model, residues of the tail that are farther from the phenyl ring enthalpically destabilize the bound conformation of residues that are closer to the phenyl ring (Figure 24B). This effect results in the observed enthalpy/entropy compensation (Figure 24A).
Figure 24.
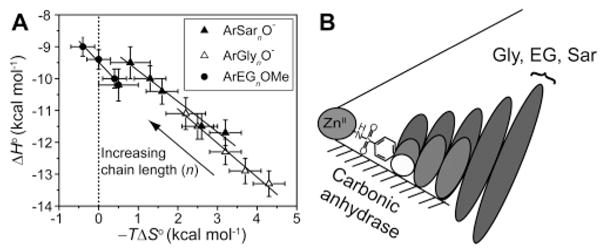
Association of para-substituted benzenesulfonamides with oligoethylene glycol (ArEGnOMe, 72–76), oligoglycine (ArGlynO–, 63–67), and oligosarcosine (ArSarnO−, 213–217) tails with bovine carbonic anhydrase II. (A) Enthalpy/entropy compensation plot for the association. The solid lines are linear fits to the data sets and give values for the compensation (from the slopes) as follows: −0.96 ± 0.08 (ArSarnO−), −1.07 ± 0.07 (ArGlynO−), and −1.32 ± 0.09 (ArEGnOMe); these observations demonstrate near-perfect compensation between enthalpy and entropy. The dotted vertical line separates favorable (−TΔS∘ < 0) from unfavorable (−TΔS∘ > 0) entropy of binding. (B) A schematic diagram for the association. This schematic diagram represents the catalytic cleft of the enzyme as a cone with the ZnII cofactor at the apex. The bottom surface (shaded) of the cleft is the “hydrophobic wall” of the enzyme. Ellipses depict the residues of the ligand; the sizes of the ellipses are qualitatively proportional to the mobility of the individual residues. Benzenesulfonamide ligands with one (white), three (light gray), and five (dark gray) residues in the tail are shown. Modified with permission from ref 415. Copyright 2006 American Chemical Society.
10.6.7. Conclusions
Microcalorimetry makes it possible to obtain believable data describing the thermodynamics of binding. Some of the values of enthalpy for the binding of arylsulfonamides to CA II obtained by microcalorimetry differ significantly from those obtained using van’t Hoff analysis (Tables 12 and 13). Such discrepancies have been reported previously in the literature for protein–ligand binding.578–580 While a rigorous comparison of thermodynamic values obtained from the two techniques is not possible because so few directly comparable data are available in the literature, we believe that calorimetry is the best technique for measuring the dissected thermodynamics for protein–ligand association for reasons discussed in section 10.2.2.
The observed binding of arylsulfonamides to CA II is strongly enthalpy (ΔH∘obs)-driven and generally opposed by a small-to-moderate (relative to the enthalpy) entropic (−TΔS∘obs) term (Table 13; Figure 23A). When the observed data are used to calculate values of the changes in enthalpy and entropy for the reaction of the arylsulfonamide anion (ArSO2NH−) with CA–ZnII–OH2+ (eq 18), the entropic (−TΔS∘ArSO2NH−) term is seen to be important (contributing up to 50% of the affinity), but ΔH∘ArSO2NH− is still dominant for the association of most arylsulfonamide anions (Table 14; Figure 23B). The electrostatic interactions of the ZnII–N bond and hydrogen-bond network are the dominant contributors to ΔH∘ArSO2NH−, while hydrophobic contacts between the ring and CA II are the dominant contributors to −TΔS∘ ArSO2NH−.
10.7. Overall Conclusions
10.7.1. Why Is CA a Good Model System for Rational Ligand Design?
The system of CA (especially HCA I, HCA II, and BCA II) and arylsulfonamides is a model in which it is possible to study separately the distinct components of binding of the arylsulfonamide: (i) the interaction of its head group with the enzyme (ZnII–NH bond and –SO2NH hydrogen-bond network), (ii) the interaction of its aryl ring with the hydrophobic pocket (active site) of CA, and (iii) the interaction of its tail and secondary recognition element with hydrophobic patches (adjacent to the active site) of CA (Figure 13B). This system of enzyme and ligand is well-suited for thermodynamic measurements because of the availability and ease of purification of CA (necessary for techniques that require large amounts of material), as well as the straightforward synthesis of arylsulfonamides.
10.7.2. Lessons in Design of Arylsulfonamide Ligands for CA
Arylsulfonamides are the most effective ligands of CA. The hydrogen-bond network around the sulfonamide group, and the ZnII–N bond, are both crucial components of the interaction. All high-affinity ligands for CA make use of the ZnII–N bond; this observation highlights its importance in determining affinity. While the sulfonamide class of molecules has proven effective as high-affinity ligands for CA, the design of ligands with moieties that bind more tightly to ZnII than sulfonamides do could result in the generation of even higher-affinity ligands.
Much of the extensive variation of the structure of arylsulfonamides has simply exemplified ways of varyingthe pKa of the arylsulfonamide. The separation of the two effects of the pKa of the arylsulfonamide on binding to CA– the fraction of sulfonamide present as the anion, ArSO2NH−, and the strength of the interaction of ArSO2NH− with CA (the ZnII–N bond and the hydrogen-bond network)–is essential for the rational design of high-affinity arylsulfonamides and for determining the importance of hydrophobic contacts between the arylsulfonamide and CA on affinity. Many arylsulfonamides have affinities higher than that expected from a Brønsted plot constructed using unsubstituted benzenesulfonamide (1) as a reference compound (Figure 17B); these arylsulfonamides are probably exploiting hydrophobic and/or multivalent contacts outside of the active site (contacts that benzenesulfonamide lacks) to increase affinity. Compound 109 exemplifies these design principles and is the highest-affinity sulfonamide known. At the lower end of affinity, certain sulfonamides (e.g., ortho-substituted alkyl series) bind more weakly than anticipated based on the Brønsted relationship, presumably because of unfavorable steric interactions between the aryl ring or substituents on the aryl ring and the cleft of CA. Understanding these high-and low-affinity deviations is crucial to furthering our ability to design high-affinity ligands rationally in this system.
A simple analysis (eqs 19 and 20) predicts a modest dependence of the pKa (of the sulfonamide) that gives the highest-affinity binder to CA on β. The “best” pKa for a ligand (with all other factors being equal) will be roughly the pH of the buffer (pKa = pH ± 1 for β = 0.1–0.9) (eq 20; Figure 19).
The affinity between CA (at least CA II) and ligand is dominated (~65%) by the ZnII–N bond with lesser contributions by the hydrogen-bond network (~10%) and hydrophobic contacts (~25%) of the ring (Figure 18). The ZnII–N bond and the hydrogen-bond network primarily manifest themselves in the enthalpy of binding, with the contacts of the ring with CA appearing in the entropy of binding. In principle, high-affinity ligands can be designed by increasing the strength of the hydrophobic contacts (by increasing the size and hydrophobicity of the aryl ring) between the aryl ring of the ligand and CA. This approach, however, might suffer from undesired destabilization of the ZnII–N bond or the hydrogen-bond network. A simpler approach has been the addition to the benzenesulfonamide scaffold of hydrophobic binding elements (either tails or secondary recognition elements) that interact with a surface of CA outside of its active site and that, thus, do not affect the binding of the sulfonamide head group or the phenyl ring.
Hydrophobic tails, which interact at a surface adjacent to the active site, lower the of ar ylsulfonamide ligands within a series of homologous compounds. Carefully controlled studies of para-substituted benzenesulfonamides with alkyl or fluoroalkyl tails have demonstrated that hydrophobic interactions are important in affinity. The use of a homologous series allows the clear separation of structural effects on affinity (e.g., here the values of pKa of the arylsulfonamides were constant within each series).
Bivalent sulfonamides containing hydrophobic secondary recognition elements (SREs), which are able to interact with the “hydrophobic wall” of CA, bind with higher affinities than sulfonamides without these secondary elements. The exact structure of the hydrophobic SRE is not crucial to enhancing affinity. Sulfonamides containing hydrophilic or charged SREs are not of particularly high affinity (as compared to sulfonamides lacking SREs); these results reinforce the inference from many other studies that the engineering of electrostatic or ionic interactions is more challenging than the engineering of hydrophobic contacts.4,30,397 Results from studies involving the coordination of metal-containing SREs to surface His residues of HCA, while a promising idea, have been inconclusive.181,596,601,602
Understanding enthalpy/entropy compensation with even relatively simple systems (e.g., sulfonamides with chains of oligoethylene glycol, oligoglycine, and oligosarcosine) is both very challenging and very instructive. We believe it will ultimately allow us to design high-affinity ligands by generating ligands with stabilizing enthalpic contacts but without the high entropic cost of binding that is typically associated with exothermic binders.
10.7.3. General Lessons in Rational Ligand Design
While the CA/arylsulfonamide system is simple (e.g., CA does not undergo gross conformational changes upon ligand binding, is a monomeric protein, and is not post-translation-ally modified with saccharides or phosphates), we still do not have a deep, predictive understanding of the binding of ligands to it (primarily because of our lack of understanding of entropy, central to such phenomena as the hydrophobic effect, enthalpy/entropy compensation, the structure of water, etc.). Our incomplete rationalization of this system suggests that there is still much work to be done on it– particularly in characterizing the thermodynamics of binding– to understand this system and to apply the lessons it has to teach to the design of ligands for other proteins.
A few general themes have emerged from the study of this system:
Measuring (or calculating from the observed affinity) the affinity of the species of the ligand and protein that actually interact is crucial in order to carry out meaningful studies of structure–activity relationships. Simply examining the observed affinities of a series of ligands will not allow the careful partitioning of affinity to different structural contributions (e.g., hydrophobic contacts of the aryl ring, ZnII–N bond, and hydrogen-bond network) of the ligand.
Multivalent ligands–ligands that bind at both the primary (active) site and a secondary site removed from, but adjacent to, the active site–may be easier to design than ligands that bind just at the active site (even if there are multiple interactions at that site). This general statement will be particularly true when the active site is sterically congested.
Exploiting hydrophobic contacts with proteins is one of the truly successful design principles for rational ligand design. These contacts have been successful at both the active site of the protein and at a secondary site removed from the active site.
Electrostatic interactions might be intrinsically weaker and/or more challenging to engineer than hydrophobic interactions, possibly because the steric demands on hydrophobic bonding are less severe than those on electrostatic interactions.
11. Kinetics and Mechanism of Protein-Inhibitor Binding in Solution
11.1. Kinetics of Interaction of Arylsulfonamides with CA
11.1.1. Overview
The kinetics of association and dissociation of arylsulfonamides to CA (CA II, Table 15) are well-fit by either a two-state (Scheme 2A) or a three-state (Scheme 2B) model. In the two-state model, the arylsulfonamide associates with the enzyme and coordinates to the ZnII cofactor in one step. In the three-state model, the arylsulfonamide first associates with the enzyme to form a hydrophobic, weakly bound, noncoordinated complex; the arylsulfonamide in this complex coordinates to the ZnII cofactor in a second step.
Table 15.
Kinetic Data for the Binding of Ligands to CA II
| Compound | Structure | CAa | kon× 10−5 (M−1 s−1) | koff (s−1) | Kdobs (μM)b | pKa | Techc | Ref. |
|---|---|---|---|---|---|---|---|---|
| Type: | ||||||||
| 1 | R = H | H | 8.8 | 0.18 | 0.20 | 10.1 | SFF | 389 |
| 2 | R = Cl | H | 5.1 | 0.062 | 0.12 | -- | SFF | 458 |
| 3 | R = NO2 | H | 7.4 | 0.048 | 0.065 | -- | SFF | 458 |
| 6 | R = CH3 | H | 11 | 0.092 | 0.084 | 10.2 | SFF | 389 |
| 7 | R = CH2 CH3 | H | 33 | 0.097 | 0.029 | 10.4 | SFF | 389 |
| 8 | R = (CH2)2CH3 | H | 50 | 0.085 | 0.017 | 10.3 | SFF | 389 |
| 9 | R = (CH2)3CH3 | H | 100 | 0.050 | 0.0050 | 10.4 | SFF | 389 |
| 10 | R = (CH2)4CH3 | H | 250 | 0.034 | 0.0014 | -- | SFF | 389 |
| 28 | R = CH2NHCO(CH2)4CO-NHC[CH2O(CH2)3SCH2COOH]3 | B | 0.15 | 0.0001d | 0.0067 | -- | ACE | 392 |
| 29 | R = CO2H | H | 2.7 | 0.073 | 0.27 | -- | SFF | 458 |
| 29 | B | 0.48 | 0.037 | 0.77 | -- | SPRe | 412 | |
| 29 | B | -- | -- | 0.73 | -- | ITC | 412 | |
| 30 | R = CO2CH3 | H | 45 | 0.047 | 0.010 | 9.8 | SFF | 389 |
| 31 | R = CO2CH2CH3 | H | 110 | 0.034 | 0.0030 | 9.7 | SFF | 389 |
| 32 | R = CO2(CH2)2CH3 | H | 180 | 0.030 | 0.0017 | 9.8 | SFF | 389 |
| 33 | R = CO2(CH2)3CH3 | H | 330 | 0.025 | 0.00076 | 9.7 | SFF | 389 |
| 34 | R = CO2(CH2)4CH3 | H | 470 | 0.019 | 0.00040 | 10.1 | SFF | 389 |
| 35 | R = CO2(CH2)5CH3 | H | 590 | 0.024 | 0.00041 | -- | SFF | 389 |
| 37 | R = CONHCH3 | H | 5.9 | 0.049 | 0.083 | 10.3 | SFF | 389 |
| 38 | R = CONHCH2CH3 | H | 8.6 | 0.026 | 0.030 | 10.1 | SFF | 389 |
| 39 | R = CONH(CH2)2CH3 | H | 11 | 0.0094 | 0.0085 | 10.1 | SFF | 389 |
| 41 | R = CONH(CH2)3CH3 | H | 18 | 0.0057 | 0.0032 | 10.1 | SFF | 389 |
| 41 | R = CONH(CH2)4CH3 | H | 26 | 0.0045 | 0.0017 | 10.2 | SFF | 389 |
| 42 | R = CONH(CH2)5CH3 | H | 38 | 0.0050 | 0.0013 | -- | SFF | 389 |
| 43 | R = CONH(CH2)6CH3 | H | 43f | 0.0051 | 0.0012 | -- | SFF | 389 |
| 63 | R = CONHGlyOH | H | 3.6f | 0.120 | 0.33 | -- | Comp | 507 |
| 66 | R = CONH(Gly)4OH | H | 2.5f | 0.090 | 0.36 | -- | Comp | 507 |
| 223 | R = CONHNle-OHg | H | 22f | 0.011 | 0.0050 | -- | Comp | 507 |
| 224 | R = CONHCph-OHh | H | 16f | 0.022 | 0.014 | -- | Comp | 507 |
| 225 | R = CONH(Gly)3Nle-OHg | H | 4.2f | 0.093 | 0.22 | -- | Comp | 507 |
| 226 | R = CONH(Gly)3Cph-OHh | H | 8.5f | 0.084 | 0.099 | -- | Comp | 507 |
| Type: |  |
|||||||
| 114 | R = CO2CH3 | H | 8.7 | 0.61 | 0.70 | 9.8 | SFF | 389 |
| 115 | R = CO2CH2CH3 | H | 17 | 1.0 | 0.59 | 9.6 | SFF | 389 |
| 116 | R = CO2(CH2)2CH3 | H | 39 | 1.4 | 0.36 | 9.7 | SFF | 389 |
| 117 | R = CO2(CH2)3CH3 | H | 89 | 1.0 | 0.11 | 9.6 | SFF | 389 |
| 118 | R = CO2(CH2)4CH3 | H | 86 | 1.2 | 0.14 | 9.9 | SFF | 389 |
| Type: |  |
|||||||
| 119 | R = CO2CH3 | H | 0.13 | 0.49 | 38 | 9.3 | SFF | 389 |
| 120 | R = CO2CH2CH3 | H | 0.18 | 0.28 | 16 | 9.5 | SFF | 389 |
| 121 | R = CO2(CH2)2CH3 | H | 0.28 | 0.13 | 4.6 | 9.7 | SFF | 389 |
| 122 | R = CO2(CH2)3CH3 | H | 0.63 | 0.11 | 1.7 | 9.8 | SFF | 389 |
| 123 | R = CO2(CH2)4CH3 | H | 1.1 | 0.075 | 0.68 | 9.9 | SFF | 389 |
| 133 | 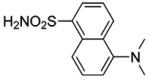 |
H | 2.4 | 0.39 | 1.6 | -- | SFF | 458 |
| 133 | B | 3.9 | 0.13 | 0.33 | -- | SPRe | 412 | |
| 133 | B | 3.8 | 0.16 | 0.42 | -- | SFF | 412 | |
| 133 | B | -- | -- | 0.36 | -- | ITC | 412 | |
| 135 | 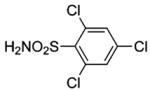 |
H | 6.6 | 0.14 | 0.21 | -- | SFF | 458 |
| 137 | 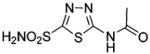 |
H | 48 | 0.068 | 0.014 | -- | SFF | 458 |
| 166 | 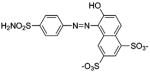 |
H | 5.8 | 0.075 | 0.13 | -- | SFF | 458 |
| 168 | H | 110 | 0.033 | 0.0030 | 9.3 | SFF | 458 | |
| 198 | CN− | Co | 3.0 × 10⁴ | 5.0 × 10³ | 1.7 | 9.3k | TJR | 291 |
| 200 | OCN− | Co | 1 × 10³ | 1.0 × 10⁴ | 100 | 3.9k | TJR | 291 |
| 201 | SCN− | Co | 2.0 × 10⁴ | 7.0 × 10³ | 3.5 | 0.9k | TJR | 291 |
| Type: | ||||||||
| 275 | R = (CH2)11SH | B | 0.35 | 0.0053 | 0.15 | -- | SPRi | 620 |
| 275 | B | 0.042 | 0.0053 | 1.3 | -- | SPRj | 620 | |
| 276 | R = CH3 | B | -- | -- | 0.05 | -- | Comp | 467 |
Variant of CA: H = HCA II; B = BCA II; Co = CoII variant of BCA II.
Calculated from kon and koff unless otherwise noted.
Technique: SFF = stopped-flow fluorescence; TJR = temperature-jump relaxation; ACE = affinity capillary electrophoresis; SPR = surface plasmon resonance spectroscopy; Comp = fluorescence competition.
Calculated from kon and .
Surface plasmon resonance, with CA immobilized on a thin film of dextran.
Calculated from koff and .
Nle = norleucine.
Cph = p-chlorophenylalanine.
Ligand is immobilized on a SAM at a fractional thiol coverage of 0.005 (a coverage that should allow a binding of CA equal to 15% of a total monolayer).
Ligand is immobilized on a SAM at a fractional thiol coverage of 0.02 (a coverage that should allow a binding of CA equal to 35% of a total monolayer).
pKa of the conjugate acid.
Scheme 2.
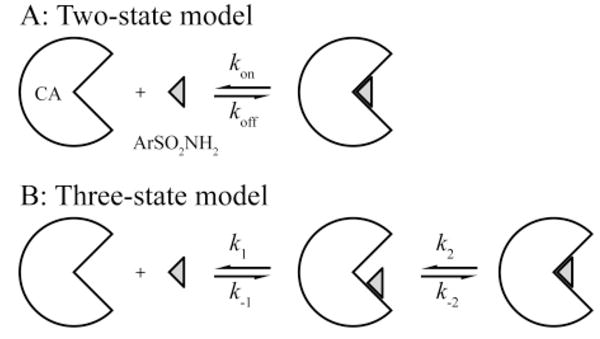
Two-State (A) and Three-State (B) Models for the Association of Arylsulfonamides with CA
In the remainder of section 11.1, we discuss the observed rate constants for association (kon) and dissociation (koff) using a two-state model. For this model, of course, . In section 11.2, we discuss the possible mechanisms for complexation of arylsulfonamides with CA that are consistent with the two- and three-state models. No deviation from pseudo-first-order kinetics has been observed for the association of arylsulfonamides with CA, so we can neither prove nor disprove that either a two- or three-state model is correct for describing the mechanism for complexation. Instead, we discuss the alternative mechanisms in light of the experimental results given in Section 11.1.
11.1.2. Influence of the Head Group and the Ring on the Kinetics of Binding
Taylor et al. demonstrated that, for a number of structurally unrelated arylsulfonamides, kon had a 10-fold larger influence on than did koff (Figure 25).458 The largest value of kon that they observed was ~107 M−1 s−1 (Table 15), which is 2 orders of magnitude lower than the limit imposed by diffusion (~2 × 10⁹ M−1 s−1) for the collision of a small molecule (similar to benzenesulfonamide) with the surface of a protein.610 Alberty and Hammes showed that restricting the solid angle of approach for the collision of a small molecule with the surface of a protein would reduce the diffusion-controlled rate from this upper limit.610 The conical cleft of CA restricts the solid angle of approach of the ligand (see section 4.6); thus, 2 × 10⁹ M−1 s−1 is an upper limit for the value of kon. The rate of diffusion-controlled reactions should decrease slightly with increasing molecular weight of the substrate: the diffusion coefficient (D) is inversely proportional to the square root of the molecular weight (M): D ≈ M−1/2. The experimental data are not compatible with a simple, diffusion-controlled reaction: many large arylsulfonamides associate with CA with values of kon greater than those for small ones; for example, kon for 168 with HCA II is ~100 times larger than that for benzenesulfonamide (1) (Figure 26; see also section 11.2.3.2). Taylor et al. noted that kon has a larger influence on Kd than does koff, whereas koff has a larger influence on Kd than does kon for most metal–ligand associations.458 The fact that kon is more important than koff suggests a complicated reaction profile for the association of arylsulfonamides with the enzyme. We discuss these results and their impact on the mechanism in section 11.2.
Figure 25.

Variation of kon (A) and koff (B) with the (equilibrium) dissociation constant, , for several classes of arylsulfonamides. Structures for the different series are listed in Table 10 as follows: m-ester alkyl (114–118), o-ester alkyl (119–123), p-ester alkyl (30–35), p-amide alkyl (37–43), p-alkyl (7–10), p-peptides (63, 66, 223–226), and miscellaneous sulfonamides (1–3, 29, 133, 135, 137, 166, 168), and data listed in Table 15.
Figure 26.

Variation of kon with the molecular weight of several classes of arylsulfonamides. Structures for the different series are listed in Table 10 as follows: p-alkyl (1 and 6–10), p-ester alkyl (29–35), m-ester alkyl (114–118), o-ester alkyl (119–123), p-amide alkyl (37–43), and miscellaneous sulfonamides (2, 3, 29, 133, 135, 137, and 168), and data listed in Table 15. The slope of the dashed line represents the dependence of kon on molecular weight that would be expected for a diffusion-controlled reaction, kon ≈ (molecular weight)−1/2. The line is drawn to pass through the value of kon for benzenesulfonamide (1).
Inorganic anions (e.g., CN−, OCN−, and SCN−) have values of kon near the diffusion limit for binding to CoII–BCA II (Table 15). Using literature values for the diffusion coefficients in water (1.5 × 10⁻⁵ cm2 s−1 for CN− and 2.15 × 10⁻⁵ cm2 s−1 for SCN−)611 and a solid angle of 2π (i.e., a hemisphere),610 the diffusion-limited value of kon is about 3 × 10⁹ M−1 s−1 for CN− and 4 × 10⁹ M−1 s−1 for SCN−. Prabhananda et al. have reported values of kon of about 3 × 10⁹ M−1 s−1 for CN− and 2 × 10⁹ M−1 s−1 for SCN− (Table 15).291 CN−, SCN−, NCO−, and HCO3− do not displace the metal-bound water of CA II; rather, kinetic291 and X-ray186,188 studies have demonstrated that the metal cofactor (CoII or ZnII) in 1:1 complexes of these anions with CA II has an expanded coordination sphere–the coordination expands to 5 (for CN− with CoII–BCA II and SCN− with HCA II) or 6 (for HCO3− with CoII–HCA II). The X-ray structures of HCA II with CN− and NCO− show that the water remains tetrahedrally coordinated to ZnII and that the anion binds in the hydrophobic pocket of the enzyme (see section 4.6).294 Prabhananda et al. have reported a 2:1 complex between CN− and CoII–BCA II.291 The complex forms by the association of BCA II–CoII–CN with a second CN−, which does displace the metal-bound water. The rate constant for this association is 5 × 10⁵ M−1 s−1, which is similar to the value of kon for sulfonamides. These similar values for kon suggest that the value of kon for sulfonamides may depend on the rate at which the sulfonamide can displace the metal-bound water.
11.1.3. Which Are the Reactive Species of CA and Sulfonamide?
Taylor et al. further demonstrated that kon (like ; see section 10.3.2) is, in general, pH-dependent and gives a bell-shaped curve with pH bounded by two values of pKa, while koff is pH-independent over the range of pH 5–11 (Figure 27).302 For the reasons presented in section 10.3.2 (Scheme 1; section 10.3.3) to rationalize the pH-dependence of , only the schemes represented by eqs 17 and 18 are compatible with this experimental pH-dependence of kon.
Figure 27.
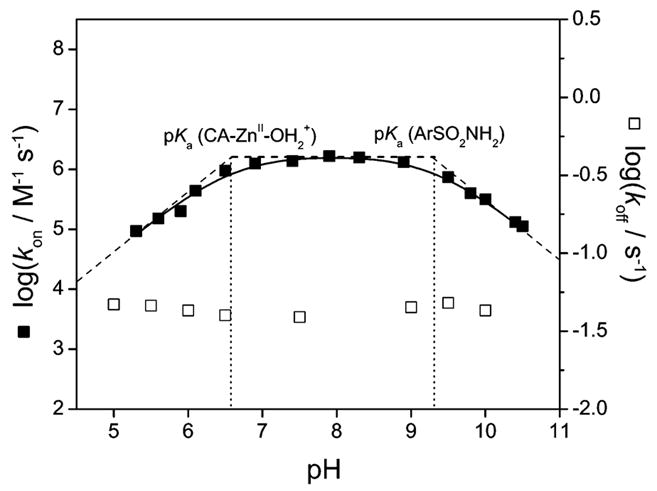
pH-dependence of the logarithms of rate constants for association (kon) and for dissociation (koff) of p-nitrobenzenesulfonamide (3) with human carbonic anhydrase II (HCA II). The open squares are experimental data for koff and are pH-independent over the range examined. The black squares are experimental data for kon, and the solid line is a simulation using eq 28 or 29 (see text) with a pKa of 6.6 for CA–ZnII–OH2+ and a pKa of 9.3 for the arylsulfonamide. The dashed lines are tangents to the simulation at three regimes (slopes of 1, 0, and −1), and the dotted vertical lines show the values of pKa. Data taken from Taylor et al.302
| (17) |
| (18) |
We discuss the two equations in the context of the experimental data in section 11.2.
11.1.4. Influence of the Tail on the Kinetics of Binding
King and Burgen examined the rate constants for association and dissociation of a homologous series of arylsulfonamides substituted at the ortho-, meta-, or para-positions with alkyl chains connected directly as esters or amides to the phenyl ring.389 For all of these series, was again primarily influenced by kon, rather than by koff (Table 15). The lower affinities of the meta- (114–118) and ortho-substituted (119–123) ester series than of the p-substituted (30–35) ester series was primarily due to their lower values of kon. For the p-substituted amide series (37–43), koff played a larger role on than in the other series; the investigators attributed this effect to the hydrogen bond between the carboxamide NH of the sulfonamide ligand and the residues of the active site of HCA II (such an interaction is not available for the p-substituted ester (30–35) or p-substituted alkyl series (1 and 6–10)).389 Boriack et al. and Cappalonga et al. observed by X-ray crystallography that there is actually a bridging water molecule between this carboxamide NH in compounds 70, 83, 84, and probably also 51 and 277, and the carbonyl oxygen of the backbone of Pro201 on HCA II.185,202
A two-state model, based on diffusion-limited encounter and hydrophobic contacts between the tail of the arylsulfonamide and CA, predicts that koff would decrease with the length of the chain. Such a model also predicts that kon would decrease slightly with (or, at the least, be independent of) the length of the chain. Interestingly, King and Burgen noted that kon increased with the length of the chain for all of the series (for the p-substituted alkyl series, the logarithm of kon increased linearly with the length of the chain) with only a small variation in koff with chain length.389 Taylor et al. noticed the same trend for kon and koff for a series of structurally unrelated compounds.458 The association reaction (described by kon) of ligands with CA is, thus, not mass-transport limited for any but the fastest reactions (e.g., CN− discussed in section 11.1.2).
11.1.5. Conclusions
The rate constant for association (kon) of arylsulfonamides with CA (HCA I and II, at least) has a larger effect on the equilibrium affinity ( ) than does the rate constant for dissociation (koff). This result contrasts with most metal–ligand complexations, in which the influence of koff on is larger than that of kon. A two-state, diffusion-limited encounter model for association is incompatible with the observation that many large ligands (e.g., arylsulfonamides with long alkyl tails) have larger values of kon than do small ligands (e.g., arylsulfonamides with short alkyl tails) (Figure 26 and section 11.2.3.2). A two-state model that is not diffusion-limited is still compatible with the data (see section 11.2). Values of kon are sensitive to pH (while values of koff are not, over the range pH 5–11); the pH-dependence of kon is compatible with only two of the four possible two-state models for association: (i) the arylsulfonamide anion interacts with CA–ZnII–OH2+ (eq 18) or (ii) the neutral arylsulfonamide interacts with CA–ZnII–OH (eq 17). Deciding between these two possibilities requires additional experimental data. In the next section, we describe a three-state model and compare it to the two-state model discussed in this section.
11.2. Mechanism of the Binding of Arylsulfonamides to CA
11.2.1. Overview
In this section, we discuss the experimental results presented in section 11.1 in light of two general mechanisms for association of arylsulfonamides with CA: a two-state model (Scheme 2A) and a three-state model containing an intermediate (Scheme 2B). There are two key questions that we seek to answer: (i) Which are the reactive species of CA and sulfonamide (eq 17 or 18)? (ii) Is there an intermediate in the association (Scheme 2B)? Scheme 3 shows two possible three-state models: Scheme 3A comprises a neutral set of reactive species (consistent with eq 17), and Scheme 3B comprises a charged set of reactive species that correspond to eq 18. The superscripts, N and C, of the microscopic rate constants in Scheme 3 denote the neutral and charged pathways.
Scheme 3.

Three-State Models for the Association of Neutral (A) and Charged (B) Arylsulfonamides with CA
11.2.2. Two-State Model for Binding (Assuming No Intermediate)
A two-state model for association (Scheme 2A) requires that the arylsulfonamide interacts directly with CA to form the final complex in a process that proceeds without a kinetically significant intermediate. The arylsulfonamide and CA must be in their reactive forms–either both are neutral or both are charged–for binding to occur. As mentioned in section 11.1.3, only the two-state models shown in eqs 17 and 18 are compatible with the pH-dependence of kon (Figure 27). The observed rate constants can be used to calculate the rate constants for the reactions shown in eqs 17 and 18 by using eqs 28 and 29, respectively,
| (28) |
| (29) |
where θArSO2NH− is the fraction of arylsulfonamide that is deprotonated and θCA–ZnII–OH2+ is the fraction of the ZnII-coordinated water that is protonated (see eqs 20a and 20b in section 10.3.3).
Taylor et al. calculated a value of konArSO2NH− for p-salicylazobenzenesulfonamide (168) of ~1010 M−1 s−1 with HCA II.302 Since this value is greater than that for the diffusion-limited encounter (~2 × 10⁹ M−1 s−1) of two neutral molecules in solution (see section 11.1.2), they concluded that the mechanism of eq 18 was not compatible with the data. They also showed that kon for p-nitrobenzene-sulfonamide (3) did not depend on ionic strength over the range of 0–1 M. From these results, they inferred that the reactive forms of the enzyme and/or arylsulfonamide were not charged, again arguing against the mechanism of eq 18. (An alternative explanation is that electrostatic effects are not important in determining kon.) From this evidence, Taylor et al. concluded that the mechanism followed was that of eq 17.
Olander et al. have argued that eq 18 could still be a mechanistic possibility.612,613 Because the reactive forms of the arylsulfonamide and enzyme in eq 18 are both charged, Coulombic attraction might increase the rate of diffusion-limited encounter, and the value of konArSO2NH− for 168 could be within this higher limit.610 Taylor et al. demonstrated that the value of kon was insensitive to ionic strength for 3, which has no ionizable group other than the sulfonamide.302 Olander et al. point out that the sulfonamide that violated the rate for neutral diffusion-limited encounter (168), however, contained a carboxylate group as well as the sulfonamide group.612 It is possible that the small charge on 3 (–1 using eq 18, 0 using eq 17) could explain its lack of dependence of kon on ionic strength. Compound 168, which has a greater charge than 3 (–2 using eq 18, –1 using eq 17), might exhibit a dependence of kon on ionic strength; data for 168 have not been reported in the literature.
HCA II has only a small charge at neutral pH (Table 2, section 4.1);149,150 this fact argues against the mechanistic hypothesis of Olander et al. Theoretically, the possibility remains that some arylsulfonamides follow the mechanism in eq 17, while others follow the mechanism in eq 18. While a two-state model that follows either eq 17 or eq 18 may be possible, we believe that a three-state model better explains the data than any two-state model. We discuss the three-state model in the following section.
11.2.3. Three-State Model with an Intermediate (Pre-equilibrium)
11.2.3.1. Overview of the Model
Scheme 3 shows two possibilities for a three-state model (Scheme 2B) that differ only in the protonation states of the active forms of the arylsulfonamide and CA (eqs 17 and 18). We refer to Scheme 3A as the neutral pathway and Scheme 3B as the charged pathway. Other pathways are conceivable because the components of parts A and B of Scheme 3 are in equilibrium (with equilibrium constants denoted by Ka(CA–ZnII–OH2+), Ka(ArSO2NH2), and Keq(E·L)), but we will only consider the charged and neutral three-state possibilities here.
Using the steady-state approximation for the intermediate (E·L in Scheme 3), King and Burgen derived eq 30 for the observed rate constant for association (kon).389 This derivation assumes that association goes to completion and is irreversible. This equation is written to be applicable for the mechanisms of either the charged or neutral pathway, so superscripts (N or C) for the microscopic rate constants are omitted. When most of the intermediates formed are nonproductive–that is, the intermediate falls apart more rapidly to reactants than it proceeds to products (a pre-equilibrium model)–eq 30 simplifies to eq 31 because k−1 ≫ k2 (K is the pre-equilibrium constant between the intermediate and the reactants and has units of M−1).
| (30) |
| (31) |
Treating the observed rate constant for dissociation (koff) in a similar manner affords eq 32 (here, assuming that the dissociation goes to completion and is irreversible).389 Assuming that k−1 ≫ k2 simplifies eq 32 to eq 33.
| (32) |
| (33) |
Under the assumptions of the pre-equilibrium model, eqs 31 and 33 suggest that the observed rate constant for association (kon) depends on the stability of the intermediate (relative to the reactants)–that is, on K–and the rate constant to form the final product from the intermediate (k2), and that the rate constant for dissociation (koff) depends only on the rate constant to form the intermediate from the final product (k−2) (and not explicitly on the stability of the intermediate). Figure 28 illustrates these results graphically.
Figure 28.
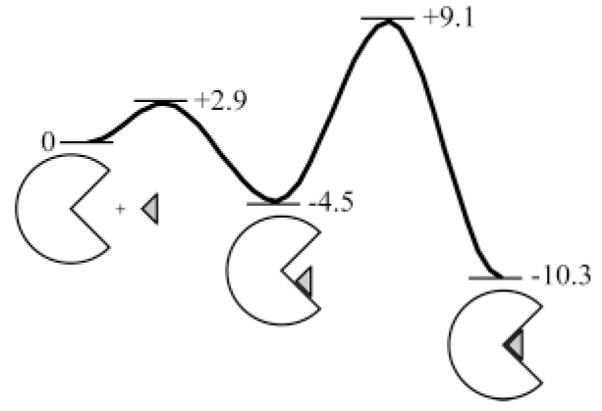
Possible free-energy diagram for the association of an arylsulfonamide with carbonic anhydrase. The values of energy shown for the different states are in kcal mol−1 and have been taken from experimental values for the association of p-nitrobenzene-sulfonamide (3) with HCA II. Data taken from King and Burgen.389
King and Burgen have argued that the first step in the mechanism–the association of arylsulfonamide and CA (specifically, HCA II) to form the intermediate–is pH-independent (see section 11.2.3.2) but that the second step– the isomerization to form the final complex where the arylsulfonamide anion directly coordinates the ZnII cofactor– is pH-dependent.389
11.2.3.2. Experimental Support for an Intermediate
The observation that kon has a stronger influence on than does koff provides support for the three-state model (Scheme 3). A two-state model would anticipate a greater influence of koff than of kon on (see section 11.1.2). The observation that, in general, para-substituted benzenesulfonamides with longer alkyl chains have larger values of kon than do those with shorter alkyl chains also provides support for the three-state model. A two-state model that depends on the diffusion-limited encounter of arylsulfonamide and CA would predict that kon should slightly decrease with (or at least be independent of) the length of the alkyl chain (Figure 26). Furthermore, the values of koff are mostly independent of the length of the alkyl chain of para-substituted benzenesulfonamides (Table 15). A two-state model, in which hydrophobic contacts between the tail and CA are important, would anticipate that values of koff would decrease with increasing length of the alkyl chain (see section 11.1.4).
King and Burgen demonstrated that apo-HCA II, which lacks the essential ZnII cofactor but has the same tertiary structure as holo-HCA II (HCA II with the ZnII cofactor) (see sections 5 and 15.2.2), associated with p-substituted benzenesulfonamides with reasonable affinity: the affinities of arylsulfonamides for apo-HCA II ( ) were a factor of ~3 × 10⁴-fold lower than those for holo-HCA II ( ), regardless of chain length.389 The logarithm of decreased (affinity increased) linearly with the logarithm of the partition coefficients of the arylsulfonamide between octanol and water. The constant ratio of to and the correlation between and the partition coefficient of the arylsulfonamide suggest that hydrophobicity influences affinity and that this contribution is independent of the presence of the ZnII cofactor. The observation that apo-HCA II associates with reasonable affinity (~mM) to arylsulfonamides supports a three-state model, as the arylsulfonamide/apo-HCA II complex could resemble the intermediate.
The investigators also reported that N-(p-nitrophenylsulfonyl)acetamide (AcNHSO2C6H4NO2, NBSAc, the acetylated version of p-nitrobenzenesulfonamide (3)) associated with holo-HCA II with an affinity ~104-fold lower than did 3 (NBSAc competes with arylsulfonamides for binding to holo-HCA II but does not coordinate the metal cofactor of HCA II).389 Further, King and Burgen demonstrated that the affinities of arylsulfonamides for apo-HCA II, and of NBSAc for holo-HCA II, were independent of pH over the range of 6–10 (unlike the case of 3; Figure 14B and section 10.3.2). These results demonstrate that hydrophobic contacts between the arylsulfonamide and apo- and holo-HCA II are important to affinity, that the contribution of these contacts to affinity was the same for apo-HCA II and for holo-HCA II, and that these contacts were insensitive to pH. These observations provide support for the conjecture that the first step in the three-state model is pH-independent. Since the overall process for the association of sulfonamides with CA (at least for HCA I and II,302 and likely for BCA II due to its high homology with HCA II; see Figures 3 and 4) is pH-dependent (Figure 27), the second step must be pH-dependent.
Banerjee et al. have observed evidence for an intermediate in the association of dansylamide (DNSA, 133) with HCA I.614 All traces from stopped-flow fluorescence for the interaction of DNSA with HCA I and HCA II were well-fit by monoexponential rate equations. For HCA I, but not for HCA II, the pseudo-first-order rate constants varied in a hyperbolic manner with the concentration of DNSA.614 Equation 34a gives kobs for a three-state model in which both association and dissociation of DNSA with CA are reversible.615
| (34a) |
The hyperbolic dependence of kobs on the concentration of DNSA is consistent with eq 34b, which follows from eq 34a when k1[DNSA] + k−1 ≫ k2–that is, the first step (formation of the encounter complex) is fast relative to the second step (formation of the final complex with direct ZnII–N coordination).
| (34b) |
The investigators did not observe evidence for an intermediate in the association of DNSA with HCA II; the pseudo-first-order rate constants increased linearly with the concentration of DNSA up to 80 μM. This result is consistent with a simple two-state model and two different three-state models. A three-state model with a rate-limiting second step (k1[DNSA] + k−1 ≫ k2) should follow eq 34b, but at low concentrations of DNSA (when [DNSA] ≪ k−1/k1 in eq 34b), the hyperbolic dependence on [DNSA] will appear to be linear (kobs = k1k2[DNSA]/k−1 + k−2).30 Banerjee et al. argued that a three-state model in which the first step is slow and the second step is fast (k1[DNSA] ≪ k2, and k−1 ≪ k2) would follow eq 34c and also anticipate a linear dependence of kobs on [DNSA].614
| (34c) |
Figure 26 illustrates that kon increases with increasing molecular weight. King and Burgen suggested that a larger alkyl group permits a ligand to form an intermediate complex with a wider range of angular variation, which in turn increases the probability of the sulfonamide entering the coordination sphere of the metal.389 Schlosshauer and Baker investigated the theoretical influence of orientational constraints on the rate constant for the association of two spherical species (“molecules”), each of which has an asymmetric, reactive patch on its surface.616 They showed that the rate constant for association between two molecules depends on the angular constraint, Φ0, with which the molecules must interact in order for association to occur; greater steric specificity corresponds to a smaller value for Φ0. Within a given series of arylsulfonamides, the molecular weight of the arylsulfonamides is proportional to the hydrophobic surface area (Figure 26). Given a three-state model, an increase in the hydrophobic surface area of the ligand should correspond to a larger value for Φ0: more surface area can interact (in more orientations) with the hydrophobic wall of CA to form the intermediate. A two-state model, however, predicts that an increase in the hydrophobic surface area of the ligand should decrease Φ0: a larger ligand must align more perfectly when binding to the active site of CA (to avoid having the hydrophobic tail sterically block the sulfonamide head group from interacting with the ZnII cofactor) than a smaller ligand. Schlosshauer and Baker showed that the theoretical rate constant for association, kon, increases with Φ0.616 According to a three-state model, kon should increase with the molecular weight (hydrophobic surface area) of a ligand, whereas a two-state model predicts that kon should decrease with increasing molecular weight of the ligand. The data for the binding of arylsulfonamides with HCA II (Figure 26) are consistent with the three-state model.
Four observations support the presence of an intermediate in the mechanism of the binding of arylsulfonamides to CA: (i) kon has a stronger influence on than does koff. (ii) kon increases with the length of the alkyl chain of para-substituted benzenesulfonamides. (iii) Arylsulfonamides associate with apo-HCA II with reasonable affinity. (iv) The pseudo-first-order rate constant deviates from a linear dependence on the concentration of dansylamide (for HCA I). The reported experimental data, however, cannot distinguish between parts A and B of Scheme 3 (that is, we do not know which are the reactive forms in the intermediate that combine to form the final complex), because the limit imposed by diffusion (see section 11.2.2) can no longer serve as a differentiating criterion: proton-transfer could take place in the active site of the protein concomitant with ZnII–N bond formation. Furthermore, we do not know which step is rate-limiting in the formation of the final CA–sulfonamide complex.
11.2.3.3. Must the Mechanism Involve an Intermediate?
No deviation from pseudo-first-order kinetics for the association of arylsulfonamides with HCA II has been observed. Such a deviation would be expected for the mechanisms proposed in Scheme 3 when the concentration of the intermediate is not negligible relative to those of reactant and final product (e.g., a high enough concentration of arylsulfonamide would make k1[arylsulfonamide] ≫ k−1, k2); a non-negligible concentration of intermediate would result in a deviation from the steady-state approximation used for derivation of eqs 30–33 and a need to fit with a biexponential model. King and Burgen argued that the concentration of intermediate is negligible and its lifetime is too short (the intermediate–with free energy ΔG∘ = −4.5 kcal mol−1 from Figure 28–decays with a rate of 2.5 × 10³ s−1) to detect by stopped-flow methods because of the moderate concentrations of enzyme and arylsulfonamide used for stopped-flow fluorescence. They demonstrated that, even with significant buildup of intermediate (~24% of total enzyme), kinetic constants obtained by using the steady-state approximation (eqs 30–32) would differ from full solutions (using a computer simulation that accounted for this amount of intermediate) by <20%.389
The affinity of apo-HCA II for arylsulfonamides does not necessarily prove that there is a hydrophobically bound intermediate in the mechanism. In a two-state model, there could be hydrophobic interactions between CA and arylsulfonamide in the transition state (section 11.2.2). Such a transition state would have two distinct sets of interactions occurring (ArSO2NH− binding to the ZnII cofactor and the aryl ring binding to a hydrophobic pocket).
The observation that the pseudo-first-order rate constants deviated from linearity for the association of DNSA with HCA I does not prove that other arylsulfonamides bind to CA in a three-state process. DNSA (133) is atypical of most arylsulfonamides: whereas most arylsulfonamides are more potent inhibitors for CA II than for CA I (see section 9.2.4),2,531 DNSA binds more tightly to HCA I than to HCA II.614 The crystal structure of HCA II complexed with DNSA reveals that this sulfonamide binds in a different orientation than do other arylsulfonamides (e.g., benzenesulfonamide, 1) because of its bulky aryl ring.203,614 Thus, the mechanism for the binding of DNSA to CA is probably different from the mechanism for the binding of most arylsulfonamides to CA. Finally, evidence that supports a three-state mechanism for the association of DNSA with HCA I does not necessarily imply the existence of a three-state mechanism for HCA II, although we believe this mechanism is the most common (or only) one.
We are, thus, in agreement with Banerjee, Olander, and King and Burgen, and believe that the three-state model involving an intermediate (Scheme 2B) is the most likely mechanism for the association of arylsulfonamides with CA.389,612,614 A two-state model (no intermediate; Scheme 2A), however, cannot be ruled out rigorously.
11.2.4. Conclusions
A three-state model, which involves an intermediate on the pathway of the binding of sulfonamides to CA, is probable but not required. The second step of the three-state model–the formation of the final complex from the intermediate–could involve the interaction of neutral (Scheme 3A) or charged (Scheme 3B) arylsulfonamide and CA. The rate-limiting steps for both association and dissociation likely involve the transition state for this step (with the possible exception of the binding of DNSA to HCA II). Given this pre-equilibrium model, if association goes to completion and is irreversible, then the rate constant for association depends on the stability of the intermediate, but that for dissociation does not.
We conclude (with the caveats characteristic of mechanistic work) that the mechanism of binding of arylsulfonamides to CA probably involves a hydrophobically bound intermediate and is not simply a two-state model. For sulfonamide–CA binding, kon makes a larger impact on than does koff. Being able to design ligands with high values for kon will allow us to design rationally ligands that bind tightly to CA (low ).
Although CA is a relatively simple enzyme, its mechanism of association with arylsulfonamides is still astonishingly difficult to model. The mechanism of binding of ligands to proteins can be difficult to establish given the challenges of measuring transient, weakly populated intermediate states. To the extent that it remains difficult to understand fully the mechanisms of relatively “simple” enzymes like CA, it will remain even more difficult to understand the mechanisms of more “complex” enzymes with perhaps more complex mechanisms. Perhaps surprisingly, the “mechanisms” of noncovalent processes remain less easily studied than those of covalent ones–processes that form and break bonds. Covalent processes can be relatively well-defined by kinetics and products (in favorable instances); there are, however, substantially fewer windows into noncovalent processes.
12. Protein–Ligand Interactions on Surfaces
12.1. Overview
Understanding molecular recognition at the interface between an aqueous solution and the surface of a solid is important for understanding the kinetics and thermodynamics of biochemical processes occurring at surfaces (e.g., signal transduction, viral adhesion, and the immune response). It is also important in interpreting results from such bioanalytical techniques as surface plasmon resonance (SPR; section 8.4.3) and quartz crystal microbalance (QCM). We only discuss SPR because it is the primary technique for studying protein–ligand binding at surfaces.617–619 CA has been a model protein for studying these interactions using SPR because its binding to ligands in solution is well-characterized, it has a well-defined binding site, and arylsulfonamides can be easily derivatized for immobilization on surfaces. We discuss differences in the thermodynamics of CA–sulfonamide binding in section 12.2 and in the kinetics of binding in section 12.3.
12.2. Comparison of Thermodynamic Values for Binding Measured at Surfaces and in Solution
Equilibrium dissociation constants ( ) for protein– ligand complexes measured by SPR are most commonly determined by using the relationship and the values of the individual rate constants, but they can also be determined by measuring the change in refractive index at the surface as a function of the concentration of the free analyte, either protein or ligand (see section 8.4.3). Values of determined by SPR for the binding of ligands to CA, where one of the components is immobilized on a surface, are generally similar in magnitude to those measured by calorimetric and spectroscopic techniques when both components are in solution (Table 15).412,465,467,483,620,621
Day et al. measured the binding of DNSA (133) and 29 to BCA II in solution using isothermal titration calorimetry (ITC) and stopped-flow fluorescence (SFF) and to BCA II immobilized on a dextran-coated surface using SPR (Table 15).412 The values of from SPR were the same as those measured by the solution-phase methods (differences of <10%) for both of the ligands. Mrksich et al.467 and Lahiri et al.620 examined the binding of BCA (isozymes I and II) to a SAM displaying 275 in a background of tri(ethylene glycol) thiols, chemical groups that reduce the nonspecific binding of proteins (see Figure 10 and section 8.4.3). They observed that binding in solution (using the control ligand 276, which is structurally similar to 275) was slightly tighter ( lower by ~3-fold; Table 15) than at the surface of the SAM.467,620 Mrksich et al. attributed this effect to either steric interactions between free BCA and surface-bound BCA (lateral steric effects; see Figure 10C and section 12.3.2)620 or to entropic repulsion between free BCA and the tri-(ethylene glycol) tails of the SAM.467 Lateral steric effects would not be expected to affect the results of Day et al. because ligand bound to surface-immobilized enzyme should not sterically interfere with the binding of free ligand.
12.3. Comparison of Kinetic Values for Binding Measured at Surfaces and in Solution
The situation with rate constants–kon and koff–is more complicated than with because the individual rate constants can differ significantly when measured at surfaces and in solution, while values of (=koff/kon) are often quite similar at surfaces and in solution (section 12.2). These differences may arise from several factors, including the following: (i) mass transport of analyte to the surface, (ii) rebinding of dissociated analyte molecules, (iii) lateral steric effects, (iv) nonspecific binding of molecules to the surface (using a mixed SAM that presents some oligo(ethylene glycol) groups can usually eliminate this problem), and (v) artifacts due to immobilization, which are not well-understood. We discuss the first three factors in more detail in the following sections.
12.3.1. Influence of Mass Transport and Rebinding on Kinetics of Binding
Immobilization of one binding partner on a surface reduces the translational and rotational freedom of that molecule and requires the other binding partner to diffuse through the interfacial fluid boundary layer–and possibly into a polymer (e.g., dextran)–to reach the surface (Figure 10B; section 8.4.3). If the rate of diffusion is not significantly greater than the rate of formation of the intermolecular complex, the effects of mass transport contribute to the observed rates of association and dissociation. Values of are, however, not affected because the influence of mass transport on kon and koff is identical. 465,620,621
The effects of mass transport can be reduced or accounted for by several methods: (i) increasing the rate of flow of the analyte and, thus, reducing the thickness of the film of stationary fluid adjacent to the surface; (ii) reducing the molecular size, and thereby increasing the diffusion constant and the rate of diffusion, of the analyte; (iii) building a kinetic scheme that includes a mass-transport step; or (iv) using a surface that presents the target molecules oriented directly into solution (e.g., at the surface of a SAM or on a thin, highly cross-linked layer of dextran) rather than inside of a gel (e.g., a thick layer of dextran with a low density of cross-links).
The above strategies may allow the extraction of values for kon and koff from SPR that agree closely with values measured in solution. For example, Day et al. measured the kinetics of binding of 133 to BCA II in solution using stopped-flow fluorescence (SFF) and to BCA II immobilized on a surface using SPR (Table 15).412 Because of the fast rate constant of association of 133 with BCA II, they added a mass-transport step621 to their reaction model. The estimated values of kon and koff from SPR were similar (difference of <30%) to those measured by SFF; this good agreement is likely due to (i) the reduction of the effects of mass transport by using a high flow rate (100 μL min−1) and by immobilizing the protein to the surface (the ligand has a higher diffusion coefficient than the protein) and (ii) the inclusion of a mass-transport term in the kinetic scheme.
12.3.2. Lateral Steric Effects
Lahiri et al. observed that decreasing the fractional thiol coverage of arylsulfonamide 275 (relative to a “background” tri(ethylene glycol) thiol; Figure 10) on a SAM from 0.02 to 0.005 (and, thus, decreasing the maximum amount of BCA II that could bind on the surface from 35% of a total monolayer to 15%) increased the value of kon by a factor of 8, while the value of koff remained constant (Table 15).620 To explain the data, they invoked the concept of lateral steric effects622–627–an unfavorable steric repulsion between BCA II that is bound at the surface and BCA II that is free in solution (Figure 10C; section 8.4.3). Decreasing the fractional coverage of arylsulfonamide ligands on the surface should reduce the possibility of these unfavorable interactions between bound BCA II molecules and increase the observed value of kon to its solution-phase value. Unfortunately, there are no solution-phase data in the literature for the kinetics of binding of 275, or the structurally similar ligand 276, to BCA II to which to compare their results.
12.4. Conclusions
SPR is a useful technique for determining what factors influence the kinetics and thermodynamics of binding that occurs at surfaces. In general, thermodynamic values ( ) obtained by SPR agree with those obtained by solution-phase measurements. Values for the rate constants, however, can differ between the two techniques. In order to obtain values for kon and koff from SPR that agree with those from solution, it is necessary to reduce the influences of mass transport and lateral steric effects. Both of these goals can be achieved by (i) using a low density of ligands on the surface, (ii) immobilizing the protein on the surface (rather than immobilizing the ligand), (iii) increasing the flow rate of the analyte, (iv) using a surface that exposes the target molecules directly into solution (e.g., at the surface of a SAM) rather than inside of a gel (e.g., a thick layer of dextran with a low density of cross-links), and (v) including a mass-transport step into the kinetic scheme, when necessary.
13. Protein–Ligand Interactions in the Gas Phase
13.1. Overview
Mass spectrometry (MS) has revolutionized the study of proteins in the gas phase.431–442,628–630 The system of CA and arylsulfonamides has been the subject of MS studies for three reasons: (i) CA has a tractable molecular weight; (ii) complexes between CA and arylsulfonamides are well-characterized structurally and thermodynamically (see sections 4 and 10); and (iii) CA is a particularly stable protein (see section 15). Section 8.3.7 describes the MS techniques used to study the binding of ligands to CA. This section discusses the experimental data from these studies. There are two main types of experiments that use MS, each of which has a different goal: (i) to determine the relative abundances of protein–ligand complexes (or ions released by dissociation of these complexes) in the gas phase, with the goal of estimating the relative affinities of the ligands for the protein in solution (section 13.2), and (ii) to determine the stabilities of protein–ligand complexes in the gas phase, with the goal of understanding the role of solvation in protein–ligand binding (section 13.3).
13.2. Using Mass Spectrometry to Estimate Solution-Phase Affinities
Using MS to estimate the relative affinities of ligands for CA in solution requires that the relative abundances of the different protein–ligand complexes in the gas phase reflect those of the different complexes in the starting solution pool. Two factors are necessary to ensure that the relative abundances in the gas phase and in solution are equal: (i) ionization and vaporization procedures must generate intact noncovalent CA–ligand complexes in the gas phase and (ii) ionization efficiencies of complexes of different ligands with CA must be similar.
Cheng et al. examined the complexes of BCA II with p-substituted benzenesulfonamides with alkyl (16–21 and 38–40), fluoroalkyl (22–27 and 45–47), and dipeptidyl (ligands of structure p-H2NSO2C6H4CONH–AA–NHCH2-CH2CO2H where AA is an amino acid) tails (Table 10). 443 The investigators equilibrated BCA II with the libraries of ligands and used ESI-FTICR-MS to generate and isolate ions of the BCA II–ligand complexes. The relative ion intensities of the different BCA II–ligand complexes in the mass spectra were related to the relative abundances of the different BCA II–ligand complexes in the gas phase and suggested the relative abundances of these complexes in solution, assuming that the ionization efficiencies of the different complexes were similar. Resolving the different protein–ligand complexes in the mass spectra was challenging when the ligands had similar masses. To address this issue, the investigators isolated and completely dissociated the desired protein–ligand complexes (corresponding to the unresolved peak) using collisional-induced dissociation (CID) with nitrogen gas molecules.443 The released ligands (in their −1 charge state) could be distinguished by their exact masses (Δ m ≥ 0.025 Da), and the relative ion intensities of the ligands allowed an estimate of the relative abundances of the different protein–ligand complexes in solution. The investigators observed a good correlation between the relative ion intensities of both the CID-released ligands and the protein–ligand complexes and values of measured in solution for the different ligands (Table 10).
Gao et al. expanded this ligand screening effort to compounds of the form p-H2NSO2C6H4CONH–AA1–AA2NHCH2CH2CO2H, where AA1 and AA2 were either L-amino acids (library of 289 ligands) or D-amino acids (library of 256 ligands).444 Incubating BCA II with the two libraries and analyzing the BCA II–ligand complexes using ESI-FTICR-MS, they observed that the relative ion intensities of the CID-released ligands increased with increasing hydrophobicity of the ligands; this observation is in agreement with the results of a number of solution-phase studies (see section 10.4). They examined the solution-phase affinities of seven of the ligands (with a range in of ~ 30-fold); these values of correlated closely with the relative ion intensities from the MS studies.
The results of Cheng et al. and Gao et al. suggest that ESI-FTICR-MS can be used to determine the relative abundances of different ligands complexed with CA (at least with BCA II) in solution and to estimate the relative solution-phase affinities of the ligands. Dissociating CA–ligand complexes with CID and analyzing the relative abundances of the released ligands allows the estimation of relative affinities of ligands with similar masses (Δ m ≥ 0.025 Da) in a high-throughput manner.
13.3. Using Mass Spectrometry to Understand the Stability of Protein–Ligand Complexes in the Gas Phase
The thermodynamics of stability of a protein–ligand complex in aqueous solution and in the gas phase (where there is no bulk water) must be fundamentally different, since, by definition, there is no hydrophobic effect in the gas phase and the energetics of electrostatic interactions are different between the two phases. Because of the absence of bulk water, a comparison of complex stabilities in solution and in the gas phase should reveal the role of water in these interactions; this approach has been used to understand the role of solvation in many organic reactions.631–633
Whitesides, Smith, and co-workers used sustained off-resonance irradiation (SORI) coupled to ESI-FTICR-MS to study the stability of complexes of HCA II, BCA II, and apo-BCA II (BCA II lacking the ZnII cofactor; see section 5) with different ligands in the gas phase.445,446 Gas-phase complex stability was estimated by the intensity of radiation (E50) required to dissociate half of the CA II–ligand complex ions to unbound CA II ions; E50 increases with increasing stability of the complex.
Wu et al. reported values of E50 for complexes of BCA II with eight p-substituted benzenesulfonamides with short peptide tails.445 They did not observe a clear correlation between E50 and the hydrophobicity of the amino acid closest to the phenyl ring of the ligand, while they did observe such a correlation for the thermodynamic ( ) and kinetic stability (koff) of the BCA II–ligand complexes in solution.445 Instead, they observed a linear correlation between E50 and the polar surface area of the ligands. Their results suggest that the stability of BCA II–ligand complexes in the gas phase is dominated by electrostatic interactions.445
Gao et al. studied the binding of p-H2NSO2C6H4CONH-Gly-Phe-CO2H to BCA II and apo-BCA II.446 While the ligand did bind to apo-BCA II (when apo-BCA II was treated with an excess of the ligand), the value of E50 for this complex was much lower (by 0.4 ± 0.1 V) than that for the BCA II–ligand complex. This result suggests that the ZnII cofactor is bound to BCA II in the gas phase and contributes to the gas-phase stability of BCA II–ligand complexes. Gao et al. also examined the gas-phase stabilities of complexes of HCA II with o-nitrobenzenesulfonamide (o-NBS) and with p-nitrobenzenesulfonamide (3); they observed that the HCA II–3 complex was significantly more stable (ΔE50 = 0.8 ± 0.1 V) than the HCA II–o-NBS complex.446 This observation is in agreement with the results of solution-phase studies of these ligands389 and with the general principle that o-substituted benzenesulfonamides have lower affinities for HCA II than their p-substituted analogues (a fact that has been rationalized by invoking steric repulsion between the ortho-position on the phenyl ring and the active site of HCA II; see section 10.4.2). Their results suggest that the steric environment in the binding pocket of HCA II is, at least to some extent, retained in the gas phase.
13.4. Conclusions
Mass spectrometry seems effective for screening CA–ligand interactions (and determining relative affinities) when care is taken to ensure that the relative abundances of different CA–ligand complex ions in the gas phase reflect those of the complexes in the starting solution pool.443,444 Thus, MS could be useful in estimating, or at least rank ordering, the relative solution-phase affinities (values of ) of ligands for proteins in general in a high-throughput manner.431,432
While the structure of CA seems to be, at least, partially retained in the gas phase, the important thermodynamic forces for the stability of CA–ligand complexes seem to be very different in the gas phase than in solution. In gas-phase stability, electrostatic interactions (e.g., hydrogen bonding, van der Waals forces, etc.) between CA and ligand appear to be dominant, while in solution, the hydrophobic effect can make a very large contribution to stability; this result is consistent with reports for other protein–ligand systems.433,434,628,629 Thus, the results from the system of CA and arylsulfonamides serve to underscore the need for caution when attempting to extrapolate from stabilities in the gas phase to those in solution.
IV. Using CA as a Model Protein for Biophysical Studies
Our current understanding of the noncovalent interactions that determine the structure and properties of proteins is far from complete. We are able to list these interactions– electrostatic, hydrophobic, van der Waals, and hydrogen bonding–under labels that are perhaps artificially separated, but we are unable to assign qualitatively and quantitatively the importance of these interactions in protein folding, stability, aggregation, and ligand binding (see section 10). The following two sections describe the use of CA as a model protein in biophysical studies aimed at probing noncovalent interactions in proteins. Section 14 summarizes a series of studies, conducted mainly on CA, that examine the role of charge and electrostatic interactions in proteins using capillary electrophoresis (CE) and protein charge ladders– chemically modified derivatives of a protein. Section 15 reviews the body of work on folding of CA, its stability to various denaturants, and aggregation.
CA is a particularly suitable model for biophysical studies because its structure is well-defined and easily probed. It is particularly (and exceptionally) stable. Its folding pathway explicitly possesses features that are believed to be general features of protein folding–hydrophobic collapse and a molten-globule intermediate. The absence of intramolecular disulfide bonds in the native protein allows the study of aggregation without additional complications from intermolecular disulfide formation. A multitude of ligand binding and catalytic assays can serve as probes for the correctly folded active site (see section 8). The following sections describe in greater detail the features of CA that make it an attractive candidate for biophysical studies. They also present the results that are peculiar to CA.
14. Protein Charge Ladders as a Tool to Probe Electrostatic Interactions in Proteins
One of the general characteristics of a protein is the presence of multiple charged groups on its surface, in its active site, and in its interior. Our current understanding of the interactions between these groups and their effect on the stability and functionality of a protein is incomplete.397 Since the charge of a molecule is directly related to its electrophoretic mobility–a property easily measured by capillary electrophoresis (CE)395–CE is an excellent tool for probing the effects arising from electrostatic charges on a protein.
Whitesides and co-workers developed the idea of “protein charge ladders” to probe the effects and interactions of charged residues on the surface of a protein.397 In conjunction with CE and affinity capillary electrophoresis (ACE, see section 8.4.2), charge ladders are able to provide quantitative information on these electrostatic effects. Protein charge ladders and ACE were developed using CA as the model protein. A recent review on protein charge ladders summarizes the work done on this subject in detail,397 while the section below provides a brief overview of the studies conducted with CA.
14.1. Protein Charge Ladders
A protein charge ladder is a collection of derivatives of a protein that vary in the number of charged groups on their surface but share similar values of hydrodynamic drag.634 A charge ladder is most commonly formed by acetylating the ε-NH2 groups of Lys residues (which exist as ε-NH3+ at physiological pH), thereby removing approximately one positive charge with each acetylation (Figure 29A). (The N-terminal α-NH2 group may also be modified, but the N-terminus of native, blood CA is acetylated post-translationally in vivo.) It is also possible to construct a charge ladder by modifying other charged groups (e.g., Glu, Asp, Arg) on a protein.397,635
Figure 29.

(A) Diagram summarizing the formation of a protein charge ladder. A protein contains multiple ionizable residues (only Lys, Asp or Glu, and His shown here), the charge state of which depends on the value of pH of the solution and the pKa of the residue. Acetic anhydride reacts with the α-NH3+ groups of lysine residue. The resulting mixture contains protein derivatives with different numbers and positions of acetylated lysine residues. (B) CE electropherogram showing the separation of the rungs of the charge ladder of BCA II, plotted on mobility (μ) scale. The peak labeled NM corresponds to the electrically neutral molecule (p-methoxybenzylalcohol) used to monitor electroosmotic flow. Native BCA II (CA(NH3+)18) and the last rung of the ladder (CA-(NHCOCH3)18) are also labeled on the plot. The separation was done in tris-Gly, pH 8.4 buffer in a capillary measuring 47 cm in total length and 40 cm to the detector. (C) Plot of mobility (μ) of each rung versus the number of modified residues. Two x-axes are shown with calibration of ΔZ = −1 and ΔZ = −0.93. Linear regression line through the first six points provides the charge on the native protein at the intersection with the abscissa. The charge Zo of the native BCA II is estimated to be −3.4 if ΔZ = −1 and −3.2 if ΔZ = −0.93. Modified with permission from ref 640. Copyright 2003 American Chemical Society.
CE separates the members of a charge ladder into distinct peaks, or rungs, based on charge (Figure 29B) provided that the electrophoretic mobilities of the rungs are sufficiently different. The combination of protein charge ladders and CE provides a set of internally consistent data useful for quantifying certain electrostatic properties of proteins. These properties include (i) net charge of proteins,634 (ii) electrostatic contribution to binding of ligands to proteins,396 (iii) electrostatic contribution to protein folding,636 (iv) effects of charge on ion binding,637 and (v) effects of charge in ultrafiltration systems.638 In addition, protein charge ladders assist in understanding the characteristics of the networks of charges present in macromolecules as well as related phenomena (e.g., charge compensation).639,640
CA II (bovine or human) has been a model system in the development and evaluation of the properties of protein charge ladders because (i) it is negatively charged in standard electrophoresis buffers (e.g., tris-Gly, pH 8.4) and does not substantially adsorb to the walls of a fused silica capillary; (ii) it is stable (Tm = 65 °C); (iii) a change of a unit of charge on the enzyme produces a change in the value of electrophoretic mobility that is sufficient to be easily resolved by CE; and (iv) its binding pocket is not significantly altered upon acetylation of Lys residues, thus allowing studies of the effects of charge on ligand binding. Below we review some of the interesting results–both CA-specific and general proof-of-principle–obtained using CA as the model protein for studies using protein charge ladders.
14.2. Determination of Net Charge (Zo), Change in Charge (ΔZ) Upon Acetylation, and Hydrodynamic Radius of a Protein
The net charge of a protein is a fundamental physical parameter whose significance for structure or function (especially in vivo) is not well-understood.641–643 Estimating the value of net charge of a protein from standard values of pKa of ionizable residues does not give accurate numbers; the values of pKa depend strongly on the specific location of the residue, the net charge of the protein, and the medium for “standard” values to be useful.397 Experimentally, the charge of a protein has been difficult to determine.397,644
A simple experiment that consists of generating a protein charge ladder and analyzing it by CE provides a good estimate of the value of charge of the native protein under the conditions of the experiment.635,645,646 When the mobility of each rung is plotted against the change in charge (nΔZ) due to acetylation (where n is the number of acetylated groups and ΔZ is the change in charge of a Lys residue on acetylation), a linear relationship is observed for the first five or six rungs. The intercept of the linear regression line through those points with the abscissa gives an estimate of the value of charge (Zo) of the native protein (Figure 29C).
In order to get an absolute value of Zo, it is, however, necessary to know the value of ΔZ. At pH 8.4, the Lys ε-NH3+ residues (pKa = 10.2) are fully (>99%) protonated. Upon acetylation, one positive charge is formally removed from the amino group (–NH3+ → –NHCOCH3). The situation is, however, complicated by the fact that a protein contains a network of charges that “communicate” with each other electrostatically; this network is capable of responding to a change in charge of one of its groups with subtle changes in the charge state of other groups (especially HisH+) in a way that partially compensates for this change, a process called “charge regulation”.637,640 As a result, the value of |ΔZ| upon acetylation is <1. Compensation of charge may occur by at least four mechanisms: (i) changes in the local proton concentration near the surface of a protein (i.e., the effective local value of pH decreases in response to removal of a positive charge), (ii) perturbation of ionization constants of other residues (i.e., the pKa value of a neighboring ionizable residue increases in response to removal of a positive charge for a Lys group), (iii) altered affinity toward buffer ions that would differentially screen the increasing charge, or (iv) changes in the conformation of the protein that alter the values of pKa of charged groups. The first two of these mechanisms are mathematically equivalent and can be represented by adapting the model of Linderstrøm-Lang for cooperative proton binding647 to the current system.637 Gitlin et al.640 estimated ΔZ = 0.93 ± 0.02 for BCA II in tris-Gly buffer (25 mM tris, 192 mM Gly), pH 8.4 at 25 °C; the value is in close agreement to that estimated by Menon and Zydney.637 In general, the value of ΔZ is determined by the protein and its three-dimensional structure and by its environment. A related, but more detailed, study on charge regulation conducted on lysozyme648–a protein that is better suited for this study than CA because its ionization constants are better characterized experimentally than those of CA649– has confirmed that |ΔZ| is ~0.9 when the buffer pH is 8.4. With the approximation of ΔZ = −0.93 upon acetylation, the charge (Zo) for BCA II is −3.2 in tris-Gly buffer, pH 8.4.640 (Some of the early work on charge ladders used the value of ΔZ = −1 in estimating charge and other parameters.)
The plot of mobility versus the number of modified residues can also be fit to the model of Henry for the electrophoretic mobility for colloids650 in order to determine the hydrodynamic radius of a protein.645 The values of hydrodynamic radius, determined by this method, are 2.6 nm for BCA II and 2.7 nm for HCA II. The investigators used the value of ΔZ = −1 in this analysis; the analysis, however, remains fundamentally the same if a different value of ΔZ is used. Being able to predict hydrodynamic properties of proteins may prove important in the design of new techniques for the separation of proteins.
14.3. Probing Long-Range Electrostatic Contributions to the Binding of Charged Sulfonamides Using Charge Ladders and ACE
ACE of a protein charge ladder can determine simultaneously the affinities of the protein derivatives comprising each rung of the ladder for a common ligand.396 Plotting the free energies of binding of a protein to a ligand as a function of the charge Zn (where Zn = Zo + nΔZ) of each rung of the ladder allows the study the effects of charge of the protein on binding and the estimation of electrostatics to the free energy of binding. Experiments conducted using the charge ladder of BCA II and three types of ligands–positively charged, neutral, and negatively charged (Figure 30)– demonstrated this technique.396 The affinity of the rungs of the charge ladder toward an electrically neutral ligand was essentially insensitive to the charge of the BCA II derivative. In the case of charged ligands, however, the free energy of binding (ΔG∘b) varied linearly with the charge of the protein derivative: ΔG∘b decreased (became more favorable) with increasing negative charge on BCA II (ΔΔ G∘b/ΔZ = +0.08 kcal mol−1) for a positively charged ligand, and ΔG∘b increased (became less favorable) with increasing negative charge on BCA II for a negatively charged ligand (ΔΔG∘b/ΔZ = −0.14 kcal mol−1), with ΔZ = −0.93.651 The observation of invariable affinity of the rungs of the charge ladder for a neutral sulfonamide and additional studies by CD652 implied that the active-site structure of BCA II was not disrupted by acetylation of the Lys residues. The dependence of the free energy of binding of charged sulfonamides on the net charge of BCA II thus demonstrates that long-range electrostatic interactions, arising from charged residues outside of the active site, can influence the affinity of ligands for proteins. Although the values of ΔΔG∘b/ΔZ are small (≪ kT ≈ 0.6 kcal mol−1), they can be detected and accurately measured because of the large number of derivatives studied simultaneously. Similar trends hold for the affinities of charged and neutral sulfonamides for HCA II charge ladders as well.653
Figure 30.
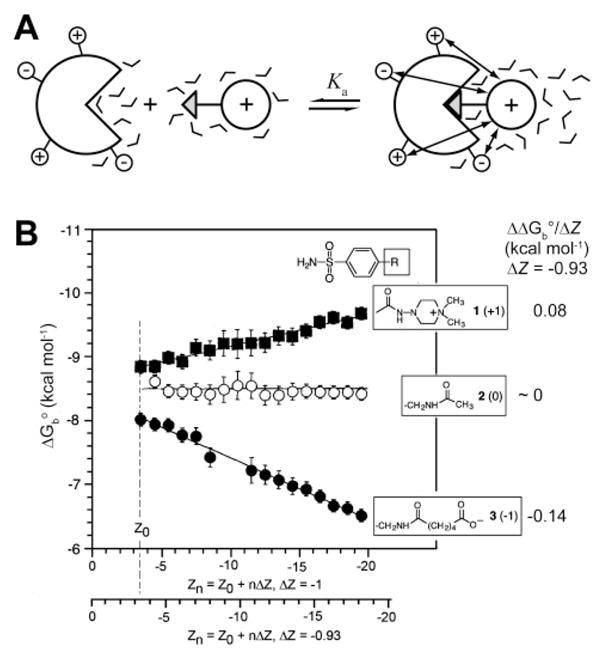
(A) Diagram illustrating the long-ranged electrostatic interactions of charged ligand with charges on the surface of the protein upon binding. (B) Dependence of the free energy of binding of negative, neutral, and positive ligands on the charge of a rung of a charge ladder of BCA II. Electrostatic contribution to the free energy of ligand binding is found to be 0 for a neutral ligand, 0.08 kcal mol−1 per unit charge for a positively charged ligand, and −0.14 kcal mol−1 for a negatively charged ligand with ΔZ = −0.93. Modified with permission from ref 396. Copyright 1996 American Association for the Advancement of Science; www.sciencemag.org.
Caravella et al. performed continuum electrostatic calculations to examine the contributions of individual Lys residues to the binding of sulfonamide ligands and to test whether the simulations can reproduce the results from the experiments with charge ladders.653 The simulations showed that many patterns of acetylations are compatible with the average (since each rung is a collection of regioisomers) affinities measured for each rung. The work also showed that the electrostatic free energy of binding of sulfonamides to CA (at least HCA II) consists of two contributions of similar magnitude. The first contribution is the direct Coulombic interaction between the charged or polar groups of the protein and the charged or polar groups in the binding pocket (either sulfonamide or hydroxide ion). The second contribution arises from the change in the shape of the regions of low and high dielectric constants that occurs when the ligand binds and water is displaced from the binding site. Most continuum electrostatic calculations account only for the direct Coulombic interaction; variable shape of the dielectric cavity can, however, also be energetically significant.653
14.4. Charge Ladders in the Gas Phase: Mass Spectrometry
An interesting but difficult-to-interpret complement to the work on CA charge ladders in solution is the study of charge ladders of CA in the gas phase.654 The origin of the distribution of charge states of proteins studied by ESI-MS is largely unknown and is the subject of two limiting hypotheses based on a correlation between (i) the net charge of the native protein in solution and the most abundant charge states formed on ionization655 or (ii) the number of basic residues (e.g., Lys, His, Arg) in the protein and the state with the largest net charge produced by ESI.656 Protein charge ladders formed in solution and separated by CE provide an excellent system with which to test these two hypotheses, because the number of unmodified Lys residues, and thus the net charge of species making up the rungs, change systematically, while the conformations of the proteins in solution apparently remain the same. Charge ladders of BCA II, along with those of hen eggwhite lysozyme and bovine pancreatic trypsin inhibitor, were used to test these hypotheses.654 The results indicated that neither the total charge nor the number of available amino groups correlated well with the distribution of ions generated by ESI. Instead, the results suggest a correlation between the molecular surface area of the native protein and the highest charge states produced– that is, greater molecular surface areas resulted in higher charge states. Thus, the distribution of charge states probably depends on structural factors such as the distances between the charged groups on the surface of a protein and the magnitude of the Coulombic interactions of these charged groups in the gas phase.654 Understanding the structure of proteins in the gas phase is an effort that is still early in its development (see section 13.3). Progress in it will, we believe, require tools such as the charge ladder of CA.
14.5. Protein Hydrophobic Ladders and Interactions with Sodium Dodecyl Sulfate
Protein hydrophobic ladders (Figure 31A) are generated by acylating Lys residues using hydrophobic acyl groups (e.g., benzoyl and hexanoyl).657 Hydrophobic charge ladders allow the hydrophobicity of the surface of the protein to be changed systematically. Each rung of the ladder contains the derivatives of the protein with the same number of modified charges and the same number of hydrophobic groups added to its surface. The charge ladder in these experiments is a device for counting: the rung indicates the number of hydrophobic groups added, rather than (primarily) the change in charge. The additional hydrophobicity, added by the modifications, can be quantified by the change in hydrophobicity parameter, log P.586,657,658 These ladders can be used to separate the effects of hydrophobicity and charge on denaturation and folding, transport, precipitation, and two-phase partitioning of proteins.
Figure 31.
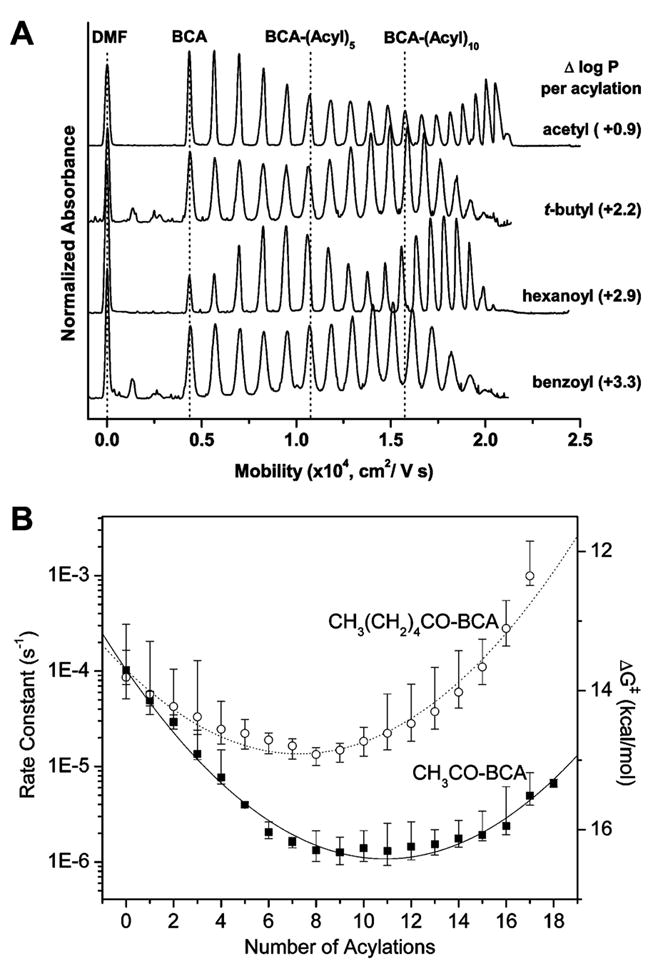
(A) Electropherograms of hydrophobic charge ladders of BCA II. The figure shows the increase in hydrophobicity parameter (log P) for reactions from –NH3+ to respective –NH–Acyl group. The dashed vertical lines mark the number of modifications and indicate that the mobilities of the early rungs of all ladders are indistinguishable, but the mobilities of the late rungs vary between the ladders, possibly due to the effects of increasing drag. Dimethylformamide (DMF) is used as an electrically neutral molecule to monitor the electroosmotic flow. (B) Rate constants and activation energies, calculated from transition-state theory, for denaturation of acetyl (CH3CO–BCA, (■)) and hexanoyl (CH3(CH2)4CO–BCA, (○)) ladders of BCA II. The lines show the fit of the model, qualitatively described in the text. Adapted with permission from ref 657. Copyright 2006 The Biophysical Society.
In a recent study, Gudiksen et al. used two ladders of BCA II–acetyl and hexanoyl–to study the effects of charge and hydrophobicity on the kinetics of denaturation of proteins with the surfactant sodium dodecyl sulfate (SDS).657 By comparing the rates of denaturation of the rungs within each charge ladder and between the two charge ladders, the investigators could separate the effects of net charge and hydrophobicity on the interaction of BCA II with SDS. The investigators measured the rates of denaturation by monitoring the decreasing peak areas of each rung by CE (the SDS-denatured protein peak did not overlap with any rungs of the ladder). Figure 31B shows that the variation of the logarithm of the rate constants for denaturation (proportional to the activation energy for denaturation, ΔG‡) vs the number of acylations resulted in a U-shaped plot. Interestingly, the native BCA II was not the most stable protein in these series of derivatives. In both ladders, the intermediate rungs were the most kinetically stable to SDS. The rungs of the hexanoyl ladder denatured faster than the corresponding rungs of the acetyl ladder by factors of ~101–103. The investigators developed a model that allowed them to quantify the electrostatic and hydrophobic components of the difference in activation energy, ΔΔG‡, between the nth rung and the native protein. The model accounted for four competing interactions that influence the stability of a rung to denaturation with SDS: (i) intramolecular electrostatic interaction, destabilizing with each acylation as the net negative charge on the protein increased; (ii) intermolecular electrostatic interaction, stabilizing with each acylation as the repulsion between the negatively charged protein and negatively charged SDS increased; (iii) intramolecular hydrophobic interaction, destabilizing with each acylation, as the hydrophobic surface area that is exposed to solvent increased; and (iv) intermolecular hydrophobic interaction, destabilizing with each acylation, as the interaction between the additional hydrophobic groups on the protein and the hydrophobic tail of SDS increased. The model indicated that, for the acetyl ladder, the electrostatic contributions to ΔΔG‡ were much larger than the hydrophobic contributions, while for the latter rungs of the hexanoyl ladder, the hydrophobic and electrostatic components were similar in magnitude. The study was one of the few to separate the effects of charge and hydrophobicity in interactions of proteins and surfactants. BCA II was an excellent model for this study because (i) both acetyl and hexanoyl ladders could be generated in full and resolved by CE, (ii) all acylated derivatives remained stable at room temperature in the absence of the denaturant, and (iii) the rates of denaturation were sufficiently slow that they could be measured by CE.
14.6. Perfunctionalized Proteins
The charge-modified derivatives of proteins clearly exhibit different behavior than the unmodified proteins in terms of stability to denaturants and affinity for ligands. To be able to explore further the effects of surface and charge modifications, a procedure for the perfunctionalization of proteins is necessary. The ability to make just a single derivative of a protein, instead of a multitude of derivatives in a charge ladder, would allow the use of analytical methods other than CE to study the properties of these derivatives.
Yang et al. reported conditions to perfunctionalize the amino groups of three proteins (ubiquitin, lysozyme, and BCA II) with five different modifying agents (acetate, triethylene glycol carboxylate, benzoate, glutarate, and fluoropropionate).659 Denaturing the protein prior to the reaction reduced the amount of reagent required for per-functionalization, presumably because denaturation rendered all amino groups accessible to the reagents. It is, however, possible to perfunctionalize proteins in a folded state, if the groups of interest are solvent-accessible.
Whitesides and co-workers explored the effects of surface charges on the properties of BCA II by comparing it to its peracetylated derivative.652,660 Peracetylated BCA II is a highly charged derivative of BCA II and is more negatively charged than native BCA II by ~16 units of charge (peracetylated BCA II has a net charge of approximately –19 based on Debye–Hückel calculation).652 Interestingly, per-acetylated BCA II is stable at room temperature, can bind inhibitors, and possesses similar esterase activity to native BCA II.652 It is, however, less stable to urea, guanidinium chloride, and heat than BCA II, but more kinetically stable to SDS,660 emphasizing the importance of electrostatic interactions in the stability of proteins. Gudiksen et al. utilized peracetylated BCA II in a study of the effects of surface charge on the ability of BCA II to fold into an active conformation; these results are discussed in section 15.3.4.652
14.7. Conclusions
CA II (bovine or human) has been the workhorse in the development of protein charge ladders. The absence of interactions of CA II with the capillary walls made the CE-based analysis of charge ladders of BCA II and HCA II particularly straightforward. The availability of multiple ligands (charged and uncharged) allowed for studies on the effects of net charge on the binding of ligands. These studies have raised, but not yet entirely settled, a number of issues in the understanding of electrostatic interactions in proteins. One observation is the presence of cooperative behavior in the ionization of residues upon acetylation.640,648 Another is the ability to modulate the binding affinities of charged ligands by long-range electrostatic interactions, rather than by local modifications in the binding site.396,653 In addition, protein charge ladders provide a method to determine the net charge and hydrodynamic radius of proteins in one experiment;645 these properties may prove to be useful in predicting conditions a priori for the separation of proteins.
15. CA as a Model Protein for Studying the Denaturation and Renaturation of Proteins
15.1. Overview
Detailed studies of denaturation and folding of CA (HCA I, HCA II, and BCA II) have helped to understand its folding pathway, the relation between its structure and stability, and the general subject of protein folding (Figure 32). CA exhibits features typical of the folding of many proteins:661–673
Figure 32.

(A) Schematic of the pathway for the refolding of HCA II that has been denatured with GuHCl. (B) Three-dimensional representations of each intermediate in the refolding pathway outlined in (A). Unfolded sections of the enzyme are depicted as transparent ribbon structures superimposed on the already folded (colored) ribbon structures. The colors for each folded intermediate correspond to the colors used in part (C). (C) A two-dimensional representation of HCA I. The ten β-strands comprising the central β-sheet structure are numbered from left to right. Trp residues are displayed as diamonds. Darkly colored residues have been probed directly (see text) either by solvent accessibility, fluorescence quenching, or NMR. Lightly colored residues have not been probed directly, but their properties are inferred from neighboring residues. Red-colored residues retain structure at 8 M GuHCl. The brown residues are the His residues that chelate the ZnII cofactor. The blue residues have structure in the molten-globule intermediate but are denatured at concentrations of GuHCl greater than 1.5 M. The green residues are required to have their native conformation before enzymatic activity is observed but are denatured in the molten-globule intermediate. The N-terminus is colored magenta; it folds after enzymatic activity is regained in the folding pathway. Adapted with permission from ref 693. Copyright 2003 American Chemical Society.
Denatured CA has residual structure, even at high concentrations of denaturants, that may template and direct the folding process.672,674–679
CA forms a stable molten-globule intermediate in the folding pathway.665,678
Proline isomerization is the rate-limiting step in the folding of CA.667,680–684
After denaturation with urea, guanidinium hydrochloride (GuHCl), heat, or SDS, CA renatures spontaneously after removal of the denaturant. The primary sequence thus contains all of the information needed for folding, and chaperones or post-translational modifications are not required for correct folding.673,685
CA interacts with chaperonins and, thus, provides a model system for studying the differences between assisted and unassisted folding.686–691
BCA II has no cysteines and cannot form disulfide bonds. Disulfide bonds can complicate the analysis of protein folding and contribute to aggregation.692
CA has three uncommon structural characteristics that are relevant to folding:
A 10-stranded β-sheet spans the entire width of the protein (Figure 32C 693). The details of folding pathways and intermediates for proteins composed predominantly of β-sheets have surfaced only in the last two decades, and CA (HCA II) has played a central role in these studies.661
CA has a very unusual C-terminal knot–that is, if CA were to be held at both ends and the ends were pulled, a knot would appear close to the C-terminus (Figure 2).152,694 Protein knots of this sort are known to occur in only four other proteins.695,696
CA has a strongly bound zinc ion, and the zinc-binding site could, in principle, nucleate or template folding.
Early work on denaturing different isoforms of CA demonstrated that HCA I is more stable than HCA II and that unfolding for all three isoforms (HCA I, HCA II, and BCA II) proceeds via intermediates in solutions of guani-dinium chloride (GuHCl). In 1982, Henkens et al. identified and characterized a stable, partially folded intermediate,678 later identified as an inactive molten globule with native-like compactness, but with fluctuating tertiary structure.665 Multiple kinetic intermediates have been identified in the folding pathway of CA from GuHCl, with time scales of formation ranging from 2 ms to ~10 min. CA has since become a “classic protein”–that is, a model–for studies of denaturation by various denaturants and of folding of these denatured states. At this time, many of the intricate details of its denaturation by and folding pathway from guanidine chloride (GuHCl) and urea have been carefully elucidated,662 while the details of unfolding and folding in the presence of other common denaturants (e.g., pH, heat, and sodium dodecyl sulfate) remain less clear. We first summarize the work on denaturation and folding of CA from GuHCl (Figure 32 parts A and B), then review the behavior of CA in other denaturants, and conclude with lessons on protein aggregation and its prevention, learned from the work with CA.
15.2. Pathway for Refolding of CA after Denaturation by Guanidine
15.2.1. Seeds for Protein Folding
The Levinthal paradox states that, if a protein randomly searches all possible conformations, it would not be able to fold properly within the age of the universe.697,698 To reduce the number of structures searched by the protein, Levinthal reasoned that one or more nucleation sites must exist that direct the folding and limit the number of structures sampled. Anfinsen, in his Nobel Prize acceptance speech, stated, “it seems reasonable to suggest that portions of a protein chain that can serve as nucleation sites for folding will be those that can flicker in and out of the conformation that they occupy in the final protein.”699
The nucleation sites, now often called “seeds”, to which Anfinsen referred, may initiate folding by exchanging between random coil and ordered states. Seeds have been identified experimentally in many proteins.664,679,700 Not surprisingly, seeds typically comprise hydrophobic amino acids and retain their clustered state in the native protein. Seeds can stabilize long-range interactions that restrict the conformational space accessible to the protein, essentially decreasing the entropy of the unfolded state.679 Experiments with CA support the theory of seeds in protein folding and validate CA as a model for studying the influence of perturbations in the nucleation site on folding (Figure 32 parts A and B).
To confirm the presence of a seed in the denatured state of HCA II, Henkens and Oleksiak mutated Trp97 to Arg and denatured this mutant in 6.2 M GuHCl. They observed that the NMR resonances of five different His residues (presumably His94, 96, 107, 119, and 122) of the Trp97Arg mutant were shifted from those of denatured wild-type HCA II protein.677 The fact that a single mutation affects the conformation of multiple amino acid residues in an unfolded protein implies that residual structure is present in this region of the chain–the central β-strands.
In order to explore the structural features of denatured and intermediate states in folding, Carlsson et al. used site-directed mutagenesis to introduce labels into HCA II.701 They made a Cys206Ser mutant of HCA II to remove the only native thiol group and introduced Cys residues into the hydrophobic core of HCA II by additional mutagenesis. By attaching spectroscopic probes (spin-labels or fluorescent labels) to these engineered Cys residues, or by measuring their chemical reactivity, Carlsson and co-workers studied solvent accessibility and local structure. Their work showed that many of the central β-strands (specifically β-strands 3 and 4) in the HCA II structure remained folded as the concentration of GuHCl was increased even up to the solubility limit of GuHCl (~6 M).672,676
The earliest event in the folding of CA involves the contraction of the hydrophobic core, β-strands 3–5 (Figure 32); this step can be followed by tryptophan (Trp) fluorescence. Trp fluorescence provides another sensitive probe of tertiary structure (section 8.3.1).702 CA has six highly conserved Trp residues, and HCA II and BCA II have one additional Trp residue (Table 2). When HCA II that has been denatured with 6 M GuHCl is renatured by rapid dilution, its Trp fluorescence (believed to originate primarily from Trp97 in β-strand 4) increases rapidly in a burst lasting <2 ms and then plateaus at the fluorescence of the native protein.702 Jonasson et al. believe that a hydrophobic collapse of the nonpolar residues surrounding Trp97, as the protein refolds, caused the observed increase in fluorescence. The rapid increase in fluorescence to a plateau does not require formation of a rigid hydrophobic structure but rather requires exclusion of water from near the center β-strands.675 The excluded water is a common feature of folding intermediates, especially of the molten globule.670 We discuss the details of the molten-globule intermediate in section 15.2.3.
These experiments suggest that the region of CA seeding the folding pathway is a cluster of hydrophobic amino acids located on the β-strands 3–5. This hydrophobic core of the protein adopts a native-like antiparallel β-sheet structure very rapidly and directs the rest of the folding pathway.
15.2.2. Metal Cofactor
An interesting question that can be addressed using CA is that of the role of metal cofactors in folding of proteins. The ZnII ion in CA is coordinated to three His residues in β-strands 3 and 4 in the hydrophobic core of the protein (Figure 32; see section 4.6). The ZnII ion influences the kinetics of folding after denaturation with GuHCl, although it does not affect the final conformational state of the folded protein.678,685,703 Yazgan and Henkens showed that folding is rapid (<10 min) in the presence of ZnII; in its absence, or if it is added after the hydrophobic core has formed in the refolding process, folding required approximately twice as long to complete.685 Renaturation through a long-lived intermediate (a molten globule; see section 15.2.3) occurred in both the presence and absence of ZnII.685 In addition to promoting folding to an intermediate state, the metal cofactor facilitates folding to the native enzyme.678,704
Cobalt can replace ZnII in the active site of CA without major structural changes or significant loss of activity (see section 5). CoII can be observed directly by absorption (at 550 nm) or indirectly by fluorescence (it quenches the fluorescence of Trp residues of CA)702 and, thus, can convey information on conformational changes occurring near the binding site of the metal ion during refolding (see section 8.3).
The absorption spectrum of the CoII ion shows when the protein coordinates it during refolding. At concentrations of GuHCl greater than 1.5 M, Carlsson and co-workers could not observe absorbance by CoII; this observation suggests that the compact metal-binding site is lost.704,705 Upon denaturing with GuHCl, the ZnII ion may either remain loosely coordinated to the unfolded enzyme–possibly by remaining chelated to His 93 and 95–or bind the unfolded polypeptide during the early stages of protein folding. Gudiksen et al. have shown that denaturation of BCA II with sodium dodecyl sulfate (SDS) and subsequent renaturation in ZnII-free buffer yields apo-BCA II.706 This result suggests that ZnII is not bound to the denatured protein with high affinity and is not necessary for successful renaturation.
It is, however, possible to induce refolding of the molten-globule form of the apoenzyme simply by adding ZnII. At 1.2 M GuHCl, Andersson et al. observed the apoenzyme in its molten-globule state, but upon addition of an equimolar (8.5 μM) amount of ZnSO4, the protein rapidly folded to its native state.704 Metal (ZnII or CoII) cofactor-induced refolding took place in three steps:
The metal ion bound to the molten globule. If ZnII was added during the early stages of refolding the denatured CoII–BCA II, most of the protein refolded into a CoII–BCA II form–that is, ZnII did not replace the CoII ion.
The protein region surrounding the metal ion compacted, as measured by Trp quenching or visible absorption by CoII. The absorption spectrum of the refolded protein was identical with that of the native protein; this observation demonstrates that CoII has been bound tetrahedrally (as it is in the native structure).707
A functioning active center formed, as measured by enzyme activity. Although the high-affinity metal-binding site formed within 10 s of initiating folding, the active enzyme formed with a half-time of 9 min.
When ZnII was used instead of CoII during refolding, Andersson et al. observed similar rate constants for folding for the ZnII-containing BCA II and the CoII-containing BCA II. Zinc does not, however, have an observable absorbance, nor does it quench tryptophan fluorescence. Therefore, the investigators could not measure binding of ZnII directly; they could measure only the rate at which the activity returned.704
The ZnII ion also affects the stability of the folded protein. The transition from the intermediate state to the unfolded state occurs at higher concentrations of GuHCl for the holoenzyme than for the apoenzyme; the holoenzyme is, thus, substantially more thermodynamically stable to denaturation than the apoenzyme.704 A curve of circular dichroism (CD; see section 8.3.6) ellipticity versus concentration of GuHCl can be analyzed to determine the concentration at which half of the enzyme is denatured (Cm). For the holoenzyme, Cm is ~1.7 M GuHCl; for the apoenzyme, Cm is ~1.0 M GuHCl.704 The relative stability of the enzyme toward unfolding has been reported by Henkens et al. to be as follows: ZnII–BCA > CoII–BCA > apoenzyme.678 This stability is apparent in both stages of unfolding–unfolding from the native state to the intermediate and from the intermediate to the fully denatured state.
Sulfonamide ligands, bound to the metal cofactor in the active site of the enzyme, can further stabilize the enzyme against denaturation.708 Almstedt et al. noticed an increase in the Cm for the unfolding of HCA II from its native state to the intermediate state in the presence of 10 μM acetazolamide (KI = 7.5 nM); unfolding appeared to become a two-state process with a combined Cm of 1.42 M GuHCl for the unfolding from the native to the unfolded state (without acetazolamide, Cm = 1.05 M GuHCl for the unfolding from the native state to the intermediate and ~1.6 M GuHCl for the unfolding from the intermediate to the fully denatured state).
15.2.3. Molten Globule
Molten globules are common intermediate states in the protein folding process, both as stable equilibrium intermediates and as transient kinetic intermediates during the refolding process.709,671 Ohgushi and Wada coined the term “molten globule” in 1983.709 “Molten” refers to structural fluctuations, particularly by side chains; “globule” denotes the native-like structural compactness. The molten-globule state is characterized by four key features: (i) little or no tertiary structure, (ii) significant secondary structure, (iii) significantly more hydrophobic surface exposed to water than for the native state, and (iv) compactness (i.e., size) closer to the native state than to the unfolded state.710 We discuss only aspects of the molten-globule intermediates relevant to the use of CA as a model protein for studies of folding. The importance of the molten globule in protein folding has been examined extensively elsewhere.710(and references therein),711–715
BCA II forms a molten globule during refolding both in equilibrium denaturation678 and transiently during refolding (Figure 32 parts A and B).665 Henkens et al. and Dolgikh et al. observed a stable intermediate with all of the characteristics of a molten globule between concentrations of GuHCl of 1 and 2 M.665,678 Jagannadham and Balasubramanian identified a similar intermediate in refolding experiments with both HCA I and HCA II.716 All four of the characteristics of a molten globule were observed in the refolding of CA.
15.2.3.1. Lack of Tertiary Structure
The simplest measure of tertiary structure–enzyme activity–shows that the molten globule has no activity and, therefore, does not have native structure at the active site.665 Further evidence of the lack of tertiary structure comes from studies of absorbance and fluorescence of Trp residues. The lack of absorbance at 292 nm for HCA II found by Mårtensson et al., and by Yazgan and Henkens, demonstrates that Trp residues are buried in the molten-globule structure.676,685 Henkens et al. found that the fluorescence depolarization for BCA was low in both the native and molten-globule states, a result that suggests that the Trp residues were relatively immobilized in both states.678 Furthermore, the emission wavelength of the molten-globule state was red-shifted (by 3 nm) as compared to the native state; this result reveals that Trp residues in the molten-globule state experience a less hydrophobic environment than in the native protein. Taken together, these results suggest that the environment surrounding Trp in the molten globule is compact (similar to the native state), but that the tertiary structure of the native state has not yet formed.
15.2.3.2. Significant Secondary Structure
CD is a commonly used technique for monitoring changes in the secondary and tertiary structures of proteins.717 CD spectra of proteins are divided into two regions: the far-UV (190–250 nm) and the near-UV (250–300 nm). The far-UV region measures secondary structure; the near-UV region measures tertiary structure.718 If a protein retains secondary structure without a well-defined, three-dimensional structure (as expected for a molten globule), the CD in the near-UV will be nearly zero, while the CD in the far-UV will have some features of the native protein.429,719
The molten globule of HCA II has virtually no CD absorbance in the near-UV region.676 The absence of a near-UV CD spectrum suggests that, in the molten-globule state, the aromatic residues are in symmetric environments and, thus, do not contribute to the far-UV CD spectra. A standard analysis of secondary structure, therefore, can be used to study the molten-globule intermediate without complications arising from Trp residues. Borén et al. and Mårtensson et al. observed that the negative ellipticity measured in the far-UV was larger for the intermediate than for the native state of BCA II and HCA II, respectively; they interpreted this increase as being due to loss of interference from aromatic side chains in the symmetric environment of a molten globule.676,720 The large negative ellipticity indicates the presence of extensive β-structure in the molten globule. When the concentration of GuHCl increased, CA II denatured further, and the negative ellipticity decreased.676,720
Jonasson et al. used site-directed mutagenesis to remove systematically Trp residues from the Cys206Ser mutant of HCA II in order to identify their individual contributions to fluorescence.675 They denatured the protein and observed refolding by monitoring the fluorescence of the Trp residues. They observed the return to native-like fluorescence intensity of Trp123, 192, 209 and 245 in two kinetic phases, with t1/2 = 2 and 13 s.675 All of these residues are on the edges of the hydrophobic core formed by β-sheets (5, 7, 8, and 9; Figure 32C) that penetrate the center of the enzyme, and the similar folding rates for these residues suggest the same rate-limiting step. This observation also implies that the native-like structure around these Trp residues occurs prior to the onset of enzymatic activity.
Although the spectral properties of Trp demonstrate that the fluorescence intensity and depolarization of the molten globule are native-like, the fluorescence wavelength and CD spectrum of the molten globule do not match those of the native protein. These results suggest that, in the molten-globule state, CA is compact and the Trp residues are immobilized but that the exact environment–the hydrophobicity in particular (as measured by fluorescence)–is different in the native and molten-globule states.
Freskgård et al. used site-directed mutagenesis of HCA II (in procedures similar to those described in section 15.2.1) to measure the solvent accessibility of Ser56 and Ile256, which are located in the outer β-strands (strands 1 and 10; Figure 32C).694 These residues have native-like structure in the molten-globule state at concentrations of GuHCl of 1–2 M, but they become fully exposed at higher concentrations of denaturant. Carlsson et al. found that Cys206 becomes inaccessible to labeling reagents within 0.1 s of renaturation; this finding indicates that β-strands 6 and 7 adopt a compact structure very early in the folding pathway.701
15.2.3.3. Exposure of Hydrophobic Surface Area
ANS (1-anilinonaphthalene-8-sulfonate) binds tightly to hydrophobic cavities and surfaces but weakly to individual hydrophobic residues in a denatured polypeptide chain.721
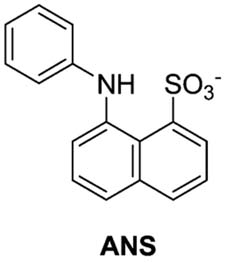
Fluorescence of ANS is a sensitive measure of the presence of hydrophobic surfaces and cavities (the quantum yield is 0.004 in water and increases to ~0.8 when bound to hydrophobic surfaces722). ANS binds strongly to BCA II in the molten-globule state with a fluorescence intensity that is much greater and more blue-shifted than when it is bound to the native or denatured protein.671,723 By measuring both the intensity of electron spin resonance (ESR) signals of spin labels and the transfer of energy from Trp residues to a dansyl label, Semisotnov et al. established that the rate of increase of ANS fluorescence was similar to the rate of molecular compaction.724 Their result indicates that hydrophobic patches are formed concomitantly with an increase in compactness upon renaturation.
15.2.3.4. Compactness of the Molten Globule
Hammarström et al. examined the compactness of the molten globule by studying pyrene excimer fluorescence.674 If two pyrenyl groups are separated by only a few angstroms, they can form a collective electronic excited-state dimer (an excimer) upon excitation.725 Hammarström et al. labeled positions 67 and 206 (in β-strands 3 and 7) of HCA II with pyrene groups. These residues are located on the edges of the β-sheet structure that spans the center of the enzyme (Figure 32). The intensity of excimer fluorescence increased with increasing concentration of GuHCl (from 0 to 0.17 M), because of the increased mobility of pyrene moieties on denaturation. The fluorescence reached a plateau between 1.7 and 3 M GuHCl and decreased above 3 M GuHCl; this observation suggests that, at concentrations of GuHCl below 3 M, the enzyme remained compact.
NMR also can be used to measure the compactness of proteins. Kutyshenko and co-workers introduced a rigidity parameter (G) as a measure of residual structure and compactness of a denatured or partially denatured protein.726,727 G is defined as the ratio between the intensities of the spin diffusion spectrum and the normal 1H NMR spectrum in a given spectral region of a protein. The values of G for HCA II indicate that the compactness of the molten globule (G = 0.53) is extremely close to that of the native state (G = 0.55) and significantly more compact than the denatured state (G < 0.1).
One of the more controversial aspects of the current understanding of the molten-globule state, and thus of the pathway for folding of proteins, is the extent to which water molecules are excluded from the hydrophobic core of the protein.728 Size-exclusion fast performance liquid chromatography (FPLC) has been used to measure the size of the molten-globule state and thereby to estimate the volume of associated water molecules. Uversky found that BCA II, at a concentration of 1 μg mL−1, had a diameter of 5.0 nm in its native state, 5.2 nm in the molten-globule state, and 10 nm in the completely unfolded state (in 6 M GuHCl).729 The sizes measured for the native and unfolded states match those measured by dynamic light scattering.673 The similarity in sizes of the native and molten-globule states of BCA II suggests that the penetration of water into the molten globule is minimal.
Relaxation dispersion measurements of 17O by NMR are commonly used to monitor directly the buried water molecules (internal hydration states) and water molecules transiently associated with the surface (external hydration states) of proteins and their molten-globule states. Using HCA II as a model, Denisov et al. found that the native and molten-globule states had only small differences (within experimental error) in the number of both tightly and weakly bound water molecules.730 Their results suggest that, for HCA II, there is very little change in hydration between the native and molten-globule states.
This work appears to conflict with earlier data from Gast and co-workers and Kataoka and co-workers obtained by light scattering and calorimetry;731–734 they observed a 30% increase in the volume and a change in heat capacity735,736 when α-lactalbumin and apomyoglobin were denatured. It is still unclear which proteins have hydration states that are more representative of proteins as a class and what conclusions (if any) can be drawn about universal aspects of hydration in molten globules. It is also possible that the molten globule is a distribution of states and that the different experimental techniques measure the average distribution of conformations in different ways.728 For example, the measurements of hydrodynamic radius may weight the larger states more heavily, while the NMR relaxation data may weight the compact states with more tightly bound water molecules more heavily.
Molten-globule intermediates have been identified along the pathways of folding for dozens of proteins.671,710 Many of these proteins belong to different structural types (α, α + β, α/β) and have rates of refolding that differ by >1 order of magnitude; these results suggest that the molten globule is a common intermediate in protein folding.671 The main difference between the native and molten-globule states is the disruption of the tightly packed hydrophobic interactions of side-chain residues that bind the structural units together.670
15.2.4. C-terminal Folding, the C-terminal Knot, and Refolding of the Active Site
15.2.4.1. C-terminal Folding
The C-terminal domain of CA forms a knotted structure (Figure 2).695,696 Beta-strand 9 crosses over strand 10 such that, if the polypeptide chain were pulled at each end, a knot would remain in the protein. Using solvent accessibility studies like those described in section 15.2.1, Freskgård et al. probed the kinetics of active site refolding around Ile256, located close to the C-terminus in β-strand 9 (Figure 32C).694 They denatured the protein with 5 M GuHCl and renatured it by dilution into tris-SO4 buffer. They observed that Ile256 settled into the hydrophobic core of the protein with a half-time of 75 s. Since this time is much longer than the time it takes to form the molten globule, they concluded that not all of the β-structure was formed in the molten-globule intermediate. Many have attributed the long half-time of folding to slow isomerization about Pro residues;681–684,737 Ile256 is located close to Pro30 and, thus, should be affected directly by its dynamics. Since enzymatic activity is regained ~8 min after initiation of refolding (by dilution), additional folding from the molten-globule intermediate must occur to regain activity. β-Strand 9, which contains Ile256, presumably cannot adopt its final conformation before β-strand 10 reaches a native-like state. If β-strand 9 adopted its native structure early in the folding process, β-strand 10 would need to thread itself through a small tunnel in order to reach its native conformation (Figure 32 parts A and B).694
Carlsson et al. digested HCA I with carboxypeptidase to investigate the effects of C-terminal residues on the activity and stability of the enzyme.738 HCA I retained ~90% of its activity when up to three C-terminal residues were digested by carboxypeptidase; its stability to denaturation by GuHCl was, however, significantly reduced. The concentration of GuHCl at which the protein sample retained half of its activity (Cm) decreased from ~1.5 M for the native protein to ~0.6 M for the HCA I lacking three C-terminal residues. These observations indicate that the C-terminal sequence involved in the knot topology contains information that is vital for the stability, but not the activity, of the protein.
15.2.4.2. Recovery of Enzymatic Activity
The kinetics of the refolding of BCA II have also been studied using Neoprontosil, a ligand whose wavelength of maximum absorbance shifts from 545 to 485 nm when bound to the enzyme.668 Ko et al. found that Neoprontosil increased the midpoint of denaturation (Cm) of BCA II from 1.5 to 2.2 M GuHCl and so appeared to stabilize BCA II toward denaturation. When BCA II was renatured after denaturation with GuHCl, Neoprontosil bound to BCA II (Kd < 10 μM) in the molten-globule state. As BCA II renatured further, a conformational change of the protein perturbed the visible absorption and CD spectrum of Neoprontosil; this change was concomitant with the return of enzymatic activity (as measured by the hydrolysis of p-nitrophenyl acetate).
Using measurements of protein absorbance and tryptophan fluorescence, Semisotnov et al. found that BCA II achieved its native, functional structure in two kinetic phases, with t1/2 = 2 min and 10 min.739 In the shorter kinetic phase, the hydrophobic clusters desolvated, and a native-like hydrophobic core formed. Henkens et al. determined that this native-like hydrophobic core did not have enzymatic activity.678
15.2.4.3. Isomerization of Pro Residues
Isomerization of Pro residues has been proposed as the rate-limiting step in the majority of slow-refolding reactions of proteins, including those of CA;681–684,737 this characteristic makes CA a good model system for studying the kinetics of slow-folding proteins. Two of the Pro residues in CA II (Pro30 and Pro202) are in the cis conformation in the native state.186 (BCA II has one more trans-Pro residue than does HCA II.)739 The native conformations of Pro peptide bonds should persist when CA is rapidly denatured because the rate of cis–trans isomerization in Pro residues (t1/2 ≈ 30 s−1) is slow compared to the rate of denaturation of CA.740 In double-jump experiments, the protein is denatured rapidly with GuHCl and then renatured by dilution to low concentrations of GuHCl with variable delay times. If cis–trans isomerization is rate-determining, the protein should refold much faster when renatured soon after denaturing (with a short delay time)–that is, before the Pro bonds have time to randomize their orientation–than with a long delay time (relative to the isomerization time of Pro bonds) before initiation of refolding. CA shows this dependence on delay time. With no delay between denaturing and renaturing, Semisotnov et al. observed the half-time for BCA II reactivation to be only 3 s.739 Prolonged incubation (~1 h) of the protein in the unfolded state, however, increased the half-time of reactivation to 10 min.741 Double-jump experiments demonstrate that both slow stages in refolding– corresponding to C-terminal and active-site refolding–are Pro-dependent processes.739
Proline isomerase (PPIase) catalyzes the cis–trans isomerization of Pro residues in proteins and, thus, should increase the rate of refolding of CA if cis–trans isomerization is rate-limiting. Consistent with this hypothesis, Fransson et al. observed that incorporating PPIase in the refolding reaction mixture of GuHCl-denatured HCA II decreased the half-time of folding from 9 to 4 min and removed the effect of time delay in refolding.667 Further, the addition of Cyclosporin A, a specific inhibitor of PPIase,742 completely abolished the observed PPIase-mediated acceleration of folding. If PPIase acted efficiently on all peptidyl-Pro bonds, the expected half-time of refolding would decrease to 1 min. Because the effect was smaller than expected, Fransson et al. speculated that PPIase could only act on Pro residues that were exposed during the refolding process.
Fransson et al. further proposed that each of the two cis-Pro residues in CA was responsible for one of the two slow stages of refolding: Pro30 for C-terminal folding and Pro202 for forming the native conformation of the active site.667 To test this idea, they made two HCA II mutants that would not allow the presence of cis conformations–Pro30Asn and Pro202Asn. The Pro30 mutant was unstable–that is, it did not fold to a stable conformation that could be studied–but the Pro202Asn mutant was stable. The Pro202Asn mutant refolded with a half-time of 9 min, which is the same (within error) as the half-time for refolding of wild-type HCA II. Addition of PPIase to this mutant decreased the rate of refolding to a half-time of 4 min. These results suggest that the cis-peptidyl-Pro202 bond does not limit the refolding rate and that another Pro residue must be responsible. Pro181 and Pro 30 are the least accessible of the invariant Pro residues,54,184,186 and they are, therefore, most likely to direct the slowest step in refolding.
Kern et al. studied folding of HCA II after a short (10 s) incubation in 5 M GuHCl and observed that only a fraction (~55%) of the protein refolded rapidly, while the rest refolded with kinetics similar to those observed for HCA II that had undergone prolonged denaturation.743 Since the denaturation interval of 10 s was not long enough to allow prolines to isomerize to non-native state, the investigators suggested that isomerization occurs during renaturation, allowing for the formation of the molten-globule state with correct and incorrect conformation of Pro. Addition of PPIase to the refolding solution decreased the fraction of protein that folded with rapid kinetics. These observations are consistent with the role of PPIase as a catalyst that isomerizes Pro residues (both to and from their conformations in the native protein) in the folding process.680
15.2.5. N-terminal Folding
The final stage of folding of CA involves the N-terminus (Figure 32 parts A and B).744 Because two Trp residues are located at the N-terminus (Trp5 and Trp16; Figure 32C), intrinsic fluorescence can be used as a probe of N-terminal structure. Aronsson et al. observed that removal of the five N-terminal residues from HCA II destabilized the native state by 4–5 kcal mol−1 relative to the intermediate state. Deleting an additional 23 residues, which constitute nearly one-tenth of the protein and an entire hydrophobic cluster, from the N-terminus (Figure 32C, purple residues) caused no further destabilization. In addition, the molten-globule intermediate was not measurably destabilized relative to the unfolded state; this result suggests that there are no net stabilizing tertiary interactions between the N-terminus and the rest of the molecule in the intermediate state. Removing residues 1–24 had no effect on the kinetics of reactivation activity of HCA II (as measured by esterase activity or DNSA binding) but did affect the kinetics of fluorescence increase. Trp fluorescence of denatured HCA II increased with time in a biphasic manner with half-times of 4 and 17 min (this fluorescence intensity was due to Trp5 and Trp16), while that for the HCA II mutant lacking 17 residues at the N-terminus had reached a plateau within 30 s (the non-N-terminal Trp were in their folded states);744 the difference suggests that the N-terminus folds in the last steps of folding and only after an enzymatically active native-like structure forms in the rest of the protein.
15.3. Denaturing CA with Other Denaturants
15.3.1. Urea
Bushmarina et al. did not observe a molten-globule intermediate during the unfolding of BCA II by urea, unlike experiments carried out in GuHCl (see section 15.2.3).663 Between 0 and ~5.5 M urea, the protein remains in its native state. A further increase in the concentration of denaturant (from 5.5 to 6.5 M) caused the protein to unfold completely, as detected by a decrease in fluorescence anisotropy. The investigators used binding of ANS to BCA II to measure the formation of the molten-globule state during denaturation and did not observe binding of ANS to BCA II at concentrations of urea between 0 and 8 M.
In agreement with Bushmarina et al., Borén et al. found that denaturation of HCA II with urea was an apparent two-state unfolding, with no intermediate in the pathway of denaturation (as monitored by tryptophan fluorescence).745 The midpoint of denaturation occurred at 4.4 M urea. The red-shift in the tryptophan fluorescence matched that of the protein denatured in GuHCl and demonstrated that the unfolded state of HCA II in urea was similar to that in GuHCl. They did find, in contrast to the results of Bush-marina et al. on BCA II, that a small amount of ANS bound to HCA II at 4.5 M urea. The binding of ANS suggests that some HCA II has the conformation of a molten globule at 4.5 M urea.
Borén et al. hypothesized that the difference in denaturation between urea and GuHCl was due to the ionic character of GuHCl. In the presence of 1.5 M NaCl, the denaturation of HCA II showed two transitions and a stable intermediate (from 3.0 to 6.4 M urea).745 The absorbance signal due to the binding of ANS to this intermediate in the denaturation of HCA II with urea is similar to that due to the binding of ANS to the molten-globule intermediate formed in the denaturation of HCA II with GuHCl. The investigators proposed that the high ionic strength of solutions of NaCl helps to weaken ionic interactions in the native state of HCA II and to destabilize the protein to denaturation with urea. This need to disrupt stabilizing ionic interactions in the enzyme is, we presume, the basis for the difference in denaturation between urea and GuHCl.
15.3.2. Acid
15.3.2.1. Overview
Unfolding in acidic conditions is often claimed to occur because the folded protein has groups buried in neutral form that can be protonated at low pH. The protonation in acid may also cause unfavorable electrostatic interactions between all the positively charged groups or break hydrogen bonds and thus induce denaturation of the protein. The basic groups believed to be important in denaturation in acid are often histidine residues (pKa ≈ 6.5).746
Acid denaturation often results in denatured states that are less unfolded than those obtained with GuHCl; these states often possess large amounts of residual structure, especially in the presence of salt.747,748 Addition of GuHCl to the acid-denatured proteins can further denature them.749 Incomplete denaturation may be due to electrostatic repulsion that fails to overcome hydrophobic forces, salt bridges, and other favorable interactions. For this reason, CA denatured by acid seems to be quite sensitive to the concentrations of salts and buffers.750
15.3.2.2. Denaturation of CA with Acid has Two Transitions
When the pH of a BCA II solution is decreased from 8 to 2, BCA II denatures in two distinct transitions, the first occurring between pH 4.3 and 3.8 and the second occurring between pH 3.5 and 2.8. In the first transition, there is a decrease in the bands in the CD spectrum of BCA II that correspond to aromatic residues (297, 286, and 270 nm).751 The decrease in these bands suggests an increased mobility of the individual aromatic residues and, presumably, an increase in protein size, as solvent molecules penetrate to the core of the protein. The CD band corresponding to α-helical structure, however, increases upon lowering the pH from 4.3 to 3.8. According to Beychock et al., HCA (isozymes I and II) below pH 4 has an α-helical content of 20%.719,752 This value for α-helical content is much higher than that of the protein at pH 7 (but the exact value is difficult to obtain because the CD spectrum of CA at pH 7 is complicated by the large number of aromatic residues that give a CD signal in the far UV).
15.3.2.3. First Transition
During the first transition in the acid denaturation, the intrinsic viscosity (η) of solutions of BCA II increases slightly (from 3.0 to 4.1 cm3/g).751 This increase suggests an increased size of the denatured protein relative to the native protein. Nilsson and Lindskog demonstrated that, near pH 4, the expansion of BCA II occurs simultaneously with the protonation of seven buried His residues.753 Because the ZnII cofactor is coordinated by three His residues, it is not surprising there is no measurable enzymatic activity at pH 3.7.
The presence of the ZnII ion does not change the pathway for protein denaturation in acid, as measured by CD and UV absorbance spectroscopy, presumably because the ZnII cofactor is removed early in the denaturation pathway (when the His residues are protonated).703 ZnII cofactor also has only a minor influence on the stability of the protein toward denaturation with acid: the pH of the midpoint of the denaturation is 4.1 for holo-BCA II and 4.5 for apo-BCA II.
15.3.2.4. Second Transition
In the second transition (pH 3.5 to 2.8), Wong and Hamlin observed a significant increase in the intrinsic viscosity (η) of the solution of BCA II; this increase suggests significant protein denaturation.751 Measurements of viscosity clearly indicate that, unlike the enzyme denatured in GuHCl or urea (η = 29.6 cm3/g),673 the acid-denatured enzyme at pH 2 (η = 8.4 cm3/g) is not a random coil (expected value of η = 29 cm3/g). The value of intrinsic viscosity implies only a partial unfolding of the protein, to a different state than the nearly random coil that is formed in urea or GuHCl.
In the second transition, Flanagan and Hesketh found the rate constant for denaturation of HCA I to be second order with respect to hydrogen ion concentration; this result indicates that at least two groups are protonated.754 The rate of unfolding strongly depended on the ionic strength: increasing the ionic strength by an order of magnitude caused the rate of unfolding to increase by approximately the same amount. Because the observed kinetics so strongly depends on the ionic strength, it is reasonable to conclude that unfolding involves the breaking of ionic bonds. The stability of HCA I (and HCA II) also depended on the ionic strength of the buffer; increasing the ionic strength from 0.05 to 0.15 increased the midpoint of denaturation by 0.5 units of pH.755,756 An increase in ionic strength shields electrostatic charges and destabilizes ionic bonds; it is likely that the denaturation of CA by acid involves the disruption of specific electrostatic interactions.
Bushmarina et al. monitored the anisotropy of fluorescence as a measure of the mobility of Trp residues in acid-denatured BCA II.663 The rotational relaxation time, defined as the time it takes for the polarization anisotropy to decay to zero, reflects both the size of the molecule (larger molecules rotate more slowly than smaller molecules) and the motion of the fluorophores relative to the protein. Bushmarina et al. measured rotational relaxation times of 34 ns for native BCA II and 70 ns for the pH 3.6 intermediate; the relaxation time for a rigid sphere with a radius of 4 nm is 46 ns. The relaxation time of native BCA II is only slightly less than that of a sphere. The increased relaxation time of Trp residues in the pH 3.6 intermediate–nearly twice as long as for a sphere–suggests that the protein aggregates, and possibly dimerizes, at this pH.
In the second transition, the molecule of BCA II unfolds to expose buried aromatic residues.751 The absorption spectrum of BCA II continues to red-shift as the pH is lowered from 3.5 to 2.8, with the midpoint of the second transition at a pH of 3. Wong and Hamlin also reported a decrease in the intensity of the CD signal at 222 nm over this range of pH. The authors attributed this decrease to a loss of α-helical structure, but because of the difficulty in assigning this band,719 the loss may also reflect other structural changes.
15.3.2.5. Precipitation after Denaturation with Acid
When BCA II was allowed to renature by increasing the pH, Wong and Hamlin found that the protein precipitated at pH 4.2 and remained insoluble at pH 8.751 Only ~25% of the enzymatic activity could be recovered when the protein was kept at pH 2.2 for 30 min and then returned to pH 7. Measurements of UV-absorption of BCA II at 290 nm during the back-titration of the enzyme from pH 2.0 to 3.7 did not match those measured as the protein was denatured. Evidence suggests that CA aggregates and precipitates upon raising the pH after denaturation in acid.663,751,755,756 McCoy and Wong recovered ~85% of the enzymatic activity of BCA II after denaturation with acid if they added 6 M GuHCl to the protein at low pH and subsequently renaturated by dialysis against buffer at pH 7 with no denaturant.757 It is clear that, because more of the protein aggregates than refolds, denaturing CA with acid is an irreversible process.
15.3.3. Heat
Relatively small changes in temperature can cause large changes in the conformation of a protein and lead to denaturation or intermolecular aggregation. These processes are usually highly cooperative; the temperature at which the protein undergoes major structural changes is its melting temperature.746
McCoy and Wong showed that BCA II precipitated out of water or tris buffer (0.09 M, pH 7.5) at 65 °C and remained as a precipitate, even upon further heating to 95 °C.757 Precipitation, which is probably due to the aggregation of the enzyme as hydrophobic patches are exposed, makes spectroscopic investigation under thermal denaturing conditions impossible. Therefore, studies of thermal denaturation require a technique that is effectively independent of the state of aggregation of the protein.
Bull and Breese developed a method that measures only changes in pH in an unbuffered solution of a protein as a function of temperature (Δ pH/ΔT) and is not affected by aggregation.758 The values of pKa for the side chains of amino acids in a native protein are often different from those of the free amino acids. On denaturation, amino acids become exposed to solvent, and the values of pKa of these residues change to values closer to those for the free amino acids. This change in values of pKa causes a net uptake or release of protons that can cause a measurable change of pH in an unbuffered solution. A plot of Δ pH versus ΔT typically has a sharp maximum at the melting temperature.
McCoy and Wong investigated the unfolding of BCA II from 25 to 85 °C.757 They observed that the pH of the solution slightly decreased from 25 to 55 °C. Near 60 °C, the pH increased abruptly, with a midpoint (and, therefore, a melting temperature, Tm) of 64.3 °C.757 The agreement between the melting temperature and the temperature at which BCA II precipitated suggests that precipitation is indeed due to the temperature-induced unfolding.
Almstedt et al. measured the value of Tm for HCA II by enzymatic activity (CO2 hydration), Trp fluorescence, near-UV CD spectroscopy, and 1D-NMR.708 The melting temperature of HCA II was similar to that of BCA II (Tm of HCA II = 55–61 °C). Interestingly, whereas HCA II denatures in GuHCl from its native to its unfolded state by way of an intermediate (a molten globule), thermal denaturation of HCA II stops at this molten-globule state.676,708
Lavecchia and Zugaro found the temperature at which the catalytic activity of BCA was lost to be very similar to the measured melting temperature.759 Changes in catalytic activity may reflect changes in the local structure of the active site, where a small change in conformation near the active site can cause complete loss of catalytic activity. The similarity in critical temperatures determined from studies of the loss of catalytic activity and of melting suggests that the loss of activity is a consequence of conformational changes that affect the entire protein, rather than just the residues near the active site.
15.3.4. Sodium Dodecyl Sulfate (SDS)
Denaturation of proteins by surfactants is a complex subject in which the mechanism of unfolding and the structure of the final protein–surfactant complex are unknown. Interactions of CA with detergents have not been studied extensively, although in recent studies, Whitesides and co-workers652,657,706,760,761 used BCA II as a model protein to clarify the effects of electrostatic interactions in denaturation and renaturation of BCA II in SDS.
Some of the existing studies on denaturation and renaturation of CA by SDS are not consistent. In particular, McCoy and Wong757 and Whitesides and co-workers,652,706,760 reported significant differences in the yield of BCA II after refolding. Furthermore, because the two research groups used different techniques, it is unclear if the two studies are in agreement in other findings (e.g., Whitesides and co-workers did not observe the two different conformations observed by McCoy and Wong). Other studies of CA with surfactants or small hydrophobic molecules have focused on the effects of these molecules on the aggregation of CA and are reviewed in section 15.4.
Early studies of proteins denatured with SDS suggested that two distinct conformations exist in solutions containing low (0.025%) and high (0.1%) (w/v) concentrations of SDS (referred to as the low- and high-binding states, respectively),762,763 and that both are enzymatically inactive.757 CD studies indicated that both the high- and low-binding states have conformations that are different from either the native enzyme or the denatured state with GuHCl. The far-UV CD spectra of both the high- and low-binding states have a strong band with two minima at about 222 and 208 nm; this shape is typical for proteins with a large amount of α-helical structure764,765 and suggests that the SDS·BCA complex is stable and has more secondary structure than the state formed after denaturing with urea or GuHCl.
In the low-binding state (0.025% SDS), residual native-like character is still observed by near-UV CD spectroscopy.757 The near-UV CD spectrum of the high-binding state (0.1% SDS) is very similar to that of the acid-denatured state of BCA II. Both the high- and low-binding states have considerable (~30%) α-helical character, although the high Trp content in CA may affect this calculation.719
Measurements of intrinsic viscosity show relatively low viscosity for solutions of the low-binding state (η = 8.1 cm3 g−1), and high viscosity for the high-binding state (η = 18.1 cm3 g−1).757 These measurements suggest that the highbinding state is more similar to a random coil (η = 29 cm3 g−1) than to the native enzyme (η = 3.7 cm3 g−1), but that the high-binding state is not fully unfolded. The low-binding state appears to retain some of the compact features of the folded enzyme.
Gudiksen et al. investigated the role of the ZnII cofactor in the renaturation of BCA II that had been denatured with SDS.706 BCA II was treated with a high concentration of SDS (10 mM) and subsequently dialyzed in SDS-free buffer to renature the protein. Native and denatured forms of BCA II were characterized by capillary electrophoresis, which could resolve both states. By refolding BCA II in the presence of EDTA (to chelate any free ZnII), they demonstrated that the ZnII cofactor was not required for refolding into a native-like conformation. When 10 μM ZnSO4 was added, the refolded enzyme regained full sulfonamide-binding activity. They also demonstrated that the ZnII cofactor does not remain bound to the denatured protein. The presence of the ZnII cofactor did, however, increase both the total amount of refolded protein by ~2-fold and the rate of refolding by ~8-fold. These results are consistent with those of Yazgan and Henkens (section 15.2.2), which demonstrated that the presence of ZnII increased the rate of refolding after denaturation with GuHCl.685 The rate of refolding in the absence of ZnII after denaturation, however, was approximately one-half as fast for protein that had been denatured with SDS as for protein that had been denatured with GuHCl.
Whitesides and co-workers also investigated the role of surface charges in the refolding of BCA II denatured with SDS.652,657 All 18 Lys groups on BCA II were acetylated to give peracetylated protein (BCA II–Ac18; see section 14).659 BCA II–Ac18 was denatured with SDS and then dialyzed in the presence of ZnII to refold the protein. On dialysis, BCA II–Ac18 refolded to its starting, active conformation; refolding was evaluated by measuring its affinity to DNSA, CD spectrum, and the rate of enzymatic hydrolysis of p-nitro-phenyl acetate. Interestingly, BCA II and BCA II–Ac18 refolded with similar rates (within a factor of 2) and yield from the SDS-denatured state. This study demonstrates that modifying the charge on the surface of BCA II does not the affect the ability of the protein to refold. This work suggests that large changes in the charge on the surface of a protein– at least for BCA II–do not preclude its folding into the native structure and that folding is driven by hydrophobic collapse rather than by the exclusion of charges from the interior of the protein.
Gitlin et al. investigated the role of surface charges in determining the relative stability of BCA II to BCA II–Ac18 and found that BCA II–Ac18 was more stable to denaturation with SDS than native BCA II.760 They were unable to determine if the difference was simply kinetic or represented a difference in thermodynamic stability between the two proteins due to aggregation of BCA II in intermediate concentrations of SDS (that prevented the measurement of rates of folding and unfolding).
15.4. Recovery of Enzymatic Activity after Refolding
15.4.1. CA as a Model for Studying Aggregation
Preventing protein aggregation is a major problem in biotechnology, medicine, and proteomics. The deposition of protein aggregates is also associated with a number of human diseases, including Huntington’s, Alzheimer’s, and Parkinson’s diseases.766–774 Proteins in their molten-globule form are considered to be particularly prone to aggregation,775 and crossed β-sheets (intermolecular β-sheets that are perpendicular to the fiber axis) are a common structural feature of such aggregates.776,777 The presence of a molten-globule intermediate, and the large number of β-strands, make CA an excellent model system for studying the aggregation of proteins. Protein aggregation was once regarded as a nonspecific process, but recent studies suggest that aggregation may be due to specific interactions between partially folded intermediates.641,776,778–780
Intermolecular aggregation of CA is the main barrier to obtaining catalytically active, refolded protein after denaturation or after some types of purification. When BCA II is renatured by increasing the pH from ~3 to 7, by cooling the protein to room temperature, or by removing detergent by dialysis, the majority of protein does not reform an active state in contrast to the high recovery for the renaturation of CA that had been denatured with GuHCl or urea, where activity could be regained nearly quantitatively (see sections 15.2 and 15.3.1). McCoy and Wong found that the refolding yield of acid-denatured or thermally denatured BCA II approached 99% when the denatured protein was treated with 6 M GuHCl and then dialyzed to remove the denaturant.757 McCoy and Wong renatured BCA II that had been denatured with 0.025% (w/v, 0.88 mM) SDS by dialysis and observed that <2% of the activity was regained (as assayed by esterase hydrolysis).757 Gudiksen et al. demonstrated that BCA II could be renatured from 10 mM SDS by dialysis against tris-Gly buffer (25 mM tris, 192 mM glycine), pH 8.4 in ~80% yield.706 The apparent discrepancy between the results of Gudiksen et al. and McCoy and Wong could be due to a difference in the experimental conditions used for renaturation: Gudiksen et al. used a lower concentration of protein than did McCoy and Wong, as well as a buffer of lower ionic strength, of different pH, and with additional ZnII added. The difference in yield of refolded protein is possibly due to an increase in aggregation of the denatured protein under the conditions of McCoy and Wong relative to those of Gudiksen et al.
Cleland and Wang proposed that aggregation of CA (at least, that of BCA II) occurs primarily between molten-globule states and that denaturation with high concentrations of GuHCl breaks apart these aggregates and allows them to fold properly.781 Experiments that measure the amount of properly refolded protein as a function of concentration of GuHCl support this hypothesis (Figure 33). A sample of BCA II denatured in 5 M GuHCl was renatured by diluting to a lower concentration of GuHCl. This study showed that, after dilution to a relatively low GuHCl concentration (0–1 M), a folding intermediate–presumably a molten globule– with a diameter slightly larger than that of the native BCA II formed within the dead time of the spectrometer.781 At those concentrations of GuHCl, this molten globule aggregated either to micron-sized particles or remained as smaller aggregates (dimers and trimers), depending on the concentration of the protein (Figure 33). This study showed that high concentrations of GuHCl may keep hydrophobic clusters that are exposed to solution from aggregating.
Figure 33.
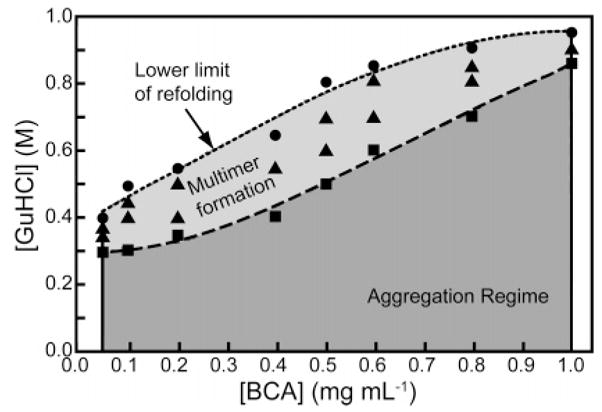
Regimes of refolding and aggregation of BCA II. Each datum represents rapid dilution of BCA II in 5 M GuHCl to a given final protein and GuHCl concentration. Conditions in the aggregation regime result in the immediate formation of micron-sized particulates. The upper boundary of the aggregation regime is defined by (■). Conditions in the multimer regime (▲) yielded measurable dimeric and trimeric species by CD before aggregation. The lower limit of refolding (●) is the regime where multimers form but do not proceed to form micron-sized particles. Adapted with permission from ref 781. Copyright 1990 American Chemical Society.
Studies of refolding of BCA II by Wetlaufer and Xie782 found that, in contrast to the results of Cleland and Wang,781 the particle size and turbidity of the solution decreased over time after the solution of GuHCl–denatured BCA II was diluted below 1 M; this decrease in turbidity indicated that aggregates were dissociating and presumably refolding. In addition, Wetlaufer and Xie showed that ~60% of the original protein could be recovered in an active form within 150 min, even at protein concentrations as high as 4 mg mL−1. They attributed the difference between the two studies to the presence of EDTA in the experiments of Cleland and Wang; the protein studied by them was, therefore, not holo-BCA II but rather a mixture of holo- and apo-BCA II. Gudiksen et al. have demonstrated that the recovery of protein was lower for apo-BCA II (35%) than for holo-BCA II (80%) when the protein was renatured after denaturation with SDS.706
Carlsson and co-workers examined the dependence of aggregation on the concentration of GuHCl used for denaturation.783,784 HCA II was treated for 24 h in concentrations of GuHCl ranging from 0.75 to 5 M. Refolding was induced by dilution of the denatured protein to 0.2 M GuHCl in 0.1 M tris buffer, pH 7.5, with a final protein concentration of 0.85 μM. Under these conditions, the native protein is the thermodynamically stable product. A plot of the percentage of active protein recovered versus the concentration of GuHCl used in the denaturation forms a troughlike curve (Figure 34). Yields of reactivation mirror the two stages of unfolding (Figure 34 inset): (i) native protein to molten-globule intermediate and (ii) molten-globule intermediate to denatured chain. The width of the trough depends on the concentration of protein and indicates that aggregation is the cause of the low recoveries of active enzyme upon refold-ing.783,784 This observation suggests that the amount of protein active after refolding is lowest when starting from the molten globule.
Figure 34.
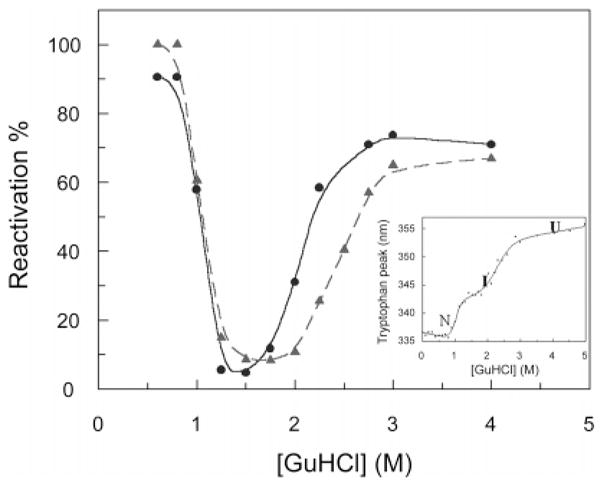
Yields of HCA II on refolding after denaturation with GuHCl. Reactivation of the enzyme was performed after incubation of protein for 24 h in the concentrations of GuHCl indicated on the x-axis. Refolding was induced by dilution of denatured enzyme to 0.3 M GuHCl in 0.1 M tris-H2SO4, pH 7.5, and a final protein concentration of 0.85 μM. The enzyme activity was recorded after 2 h of refolding. The concentration of HCA II in the denaturation solution was 11 μM (●) and 22 μM (▲). The reactivation yields form a troughlike shape, implying that the amount of protein that can be reactivated decreases in parallel with the increase in concentration of molten globule. Inset: The curve showing unfolding of HCA II as measured by tryptophan fluorescence. The excitation wavelength was 295 nm, and the emission was recorded in the interval 310–450 nm using 5 nm slits for both excitation and emission light. The native protein (N) is observed from 0 to 1 M GuHCl, the molten-globule intermediate (I) is observed from ~1.5 to 2.5 M GuHCl, and the unfolded protein (U) is observed above 3 M GuHCl. Reproduced with permission from ref 783. Copyright 1999 American Society for Biochemistry and Molecular Biology.
Hammarström et al. used pyrene labels on Cys mutants of HCA II to probe the structure of the aggregated state after denaturation in GuHCl.783 Their method is very similar to that described in section 15.2.3; the major difference was that they used mutants labeled with only one pyrene. Consequently, only aggregated proteins showed excimer formation. They mapped the residues that were directly in contact in the aggregates using 20 different mutants. Only mutants with pyrenes in positions 97, 118, 123, 142, 150, and 206 showed excimer formation. These results demonstrate that the interactions of the aggregated species are highly specific and involve β-strands 4–7. They did not observe excimers in the unfolded or native states of HCA II, thus indicating that the native and denatured states do not form aggregates.
15.4.2. Preventing Aggregation
Because CA is a good model for studying the aggregation of proteins, it is also an excellent system for studying general methods of preventing aggregation of proteins. Karlsson et al. suppressed the aggregation of HCA II by stabilizing the native structure with an engineered disulfide bond.785 The Ala23Cys/Leu203Cys double mutant had an apparent two-state unfolding pathway, with no evidence of a molten-globule intermediate. This double mutant had a higher yield of refolded protein (95%) than did wild-type HCA II (75%), probably due to its reduced tendency to aggregate. In addition, the plot of the percentage of active protein recovered versus the concentration of GuHCl used in the denaturation–a plot similar in content to Figure 34–was relatively flat and did not display the pronounced minimum displayed by wild-type HCA II. These results demonstrate that stabilization of the native state of CA helps to avoid the aggregation trap (that is, the molten globule) in the folding landscape and allows CA to refold in high yield.
Wetlaufer and Xie used a variety of surfactants as passivating agents to suppress aggregation after denaturation by GuHCl.782 The surfactant CHAPS, at concentrations above its critical micelle concentration (cmc), increased the yield of active, refolded protein from 37% to 81%; pentanol, hexanol, and cyclohexanol also increased the amount of active protein formed on refolding to >70%. The alcohols increased the recovery of BCA II when used at low concentrations (e.g., 1 hexanol molecule per 2–3 molecules of BCA II). These additives suppressed the initial formation of aggregates but were unable to dissolve preformed aggregates. Other additives, such as polyethylene glycol (PEG)786 and ANS,787 also prevented aggregation, presumably by associating weakly with hydrophobic patches of the intermediate in folding.787
Cleland and Randolph claimed that PEG inhibits aggregation by binding to the molten-globule intermediate based on experiments using a PEG-immobilized hydrophobic interaction column (HIC).788 The amount of BCA II bound to the column as a function of the concentration of GuHCl revealed a maximum at 2 M GuHCl. The peak in the binding curve suggests that only the molten globule, and not native or denatured BCA II, binds to PEG.
Cleland et al. found that the maximum enhancement (a factor of 3) in the yield of refolded protein (as measured by enzymatic activity) occurred at a molar ratio ([PEG]/[BCA]) between 2 and 3.423 The best concentration of PEG for preventing aggregation of BCA II after denaturation with GuHCl depended on its molecular weight, but only PEG with a molecular weight between 1000 and 8000 effectively inhibited aggregation. Although PEG did not increase the rate of refolding, it prevented self-association and irreversible aggregation of BCA II (presumably by binding to the molten globule).
The role of additives other than PEG in preventing aggregation is much less clear, and it is currently impossible to predict whether a given additive will effectively reduce aggregation. Sharma and Sharma showed that cyclodextrins can prevent aggregation of BCA II;789 the cyclodextrins presumably have reversible, noncovalent interactions with some hydrophobic regions of the protein (aromatic side chains are plausible candidate sites) and thereby prevent intermolecular interactions. Karuppiah and Sharma showed that cyclodextrin increased the yield of active BCA II after denaturation with GuHCl by nearly a factor of 3.790 The interactions of cyclodextrins with BCA II depended on the size of the cyclodextrins and on the substituents attached to the macrocycle.789 They found that, in general, the best aids for folding were neutral or cationic cyclodextrins with small cavities.
The “detergent-stripping method”, which is another method of preventing the aggregation of proteins, uses a detergent and a cyclodextrin in sequence.791,792 When BCA II was denatured by heat or GuHCl in the presence of detergent (e.g., SDS, cetyltrimethylammonium bromide (CTAB), or sodium tetradecyl sulfate (STS)), the detergent formed a complex with the denatured protein and prevented aggregation. These detergents prevented aggregation well below their values of cmc; this observation demonstrates that the protein was not simply dissolved in micelles but rather that it formed a detergent–protein complex. BCA II was unable to refold from the detergent-complexed state, but cyclodextrin could induce folding by stripping the detergent away from the protein. In this experiment, >80% of the protein could be recovered in an active form at protein concentrations of 0.03 mg/mL. A more water-soluble and less expensive, linear decameric dextrin could be used in place of cyclodextrin to remove detergent from HCA I.793
15.4.3. Chaperonin-Assisted Folding of CA
15.4.3.1. Overview
In living cells, a class of proteins known as “chaperonins” decreases the rate of aggregation of some unfolded proteins by encapsulating the protein while it folds;794,795 this process is believed to prevent the contact of hydrophobic patches on different proteins.796 Chaperonins may also catalyze the rate of folding for some proteins.797–799 The best studied of the chaperonins is the GroEL/ES complex from E. coli.800
15.4.3.2. Interaction of GroEL and GroEL/ES with CA
To determine if GroEL/ES interacted with HCA II in an unfolded or misfolded state, Persson et al. denatured HCA II with 5 M GuHCl and renatured the protein by dilution to 0.2 M GuHCl both in the presence and in the absence of GroEL/ES.688 The presence of GroEL/ES during refolding of HCA II after denaturation with GuHCl increased the yield of active enzyme from ~70% to 100%. The time-course for reactivation was lengthened slightly (t1/2 = 15 min) when only GroEL was present, as compared to the time-course in the absence of chaperone (t1/2 = 9 min).688 If ATP was added in addition to the GroEL/ES complex when the protein was diluted to initiate refolding, the rate of folding matched that of unassisted folding, and the yield of folded protein was quantitative. Although HCA II interacted weakly with GroEL at room temperature, at elevated temperature, and at low concentrations of GuHCl, the amount of HCA II bound to GroEL increased significantly, presumably because GroEL bound only to the molten-globule intermediate.689
Landry and Gierasch proposed that the recognition motif for GroEL is a helical segment located at or near the N-terminus of the substrate.801 Because CA contains two helical segments at the N-terminus (Figure 32), it is an ideal system for studying this hypothesis. Persson et al. found, however, that GroEL/ES was equally efficient at folding native HCA II and truncated mutants that were missing the helical segments.688 In the absence of chaperonin, truncated mutants of HCA II were no more likely to aggregate than was the native enzyme. They used EPR spectroscopy to study Cys mutants of HCA II with spin-labels attached to selected residues.691 Spin-labels linked to interior portions of HCA II (residues 97, 123, and 206) were found to be immobile in the absence of GroEL. Upon binding to GroEL, however, isotopic line features appeared that indicated increased mobility. Increased mobility is of particular interest because this core of the protein (β-strands 2–6) does not denature at high concentrations of GuHCl and, thus, is identified as the site of specific interaction in studies of aggregation. These spin-labels are, however, more hindered than the peripheral spin-labels; this finding suggests that the hydrophobic core still exists but is loosened inside the GroEL cavity. Spin-labels linked to peripheral positions of HCA II, located on residues 16, 56, 176, and 245, showed substantial mobility in the absence of GroEL, but these labels were immobilized to varying degrees during interaction with the chaperone. Immobilization suggests that the periphery of the protein was constrained upon binding GroEL. These studies provide further evidence that, in addition to their ability to sequester proteins and prevent their aggregation, chaperone proteins loosen tightly folded hydrophobic regions that may be misfolded and aid in their refolding.
Using fluorescence resonance energy transfer (FRET), Hammarström et al. provided further evidence that the hydrophobic core of HCA II loosens upon interaction with GroEL.687 The investigators used the energy transfer from Trp residues to a Cys-bound fluorescent label (AEDANS) as a measure of the compactness of the protein. They showed that the volume of the molten globule was ~2.2-fold larger than the volume of the native enzyme. When bound to GroEL, the volume of HCA II increased further (~3–4-fold larger than the native enzyme); these measurements suggest that the molecule of HCA II is stretched inside the cavity of GroEL.
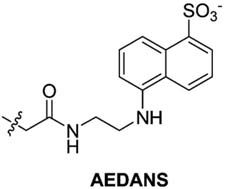
Hammarström et al. labeled two mutants of HCA II, Lys118Cys and Ile146Cys, with AEDANS in order to introduce a fluorescent probe in the central core of HCA II.687 They observed that the fluorescence emission spectrum was red-shifted in the presence of GroEL. This shift indicated that a more hydrophilic environment around these residues resulted from interaction with GroEL than in the isolated molten-globule state. The shift was quite large for this probe (10–15 nm) and suggested that GroEL extensively restructured the hydrophobic core.
The investigators also observed that GroEL underwent a large conformational change when bound to HCA II.686 At 50 °C, they observed that the fluorescence anisotropy of fluorescein-labeled GroEL increased in the presence of HCA II; this result suggests that a conformational change of GroEL accompanies its binding to HCA II. They also determined that the buried Cys residues of GroEL became accessible to solvent in the presence of HCA II, as measured by their rate of carboxymethylation. They suggested that the opening of the chaperonin caused the protein to be stretched and pulled apart.
15.4.3.3. Model for GroEL/GroES-Mediated Folding
Despite a detailed understanding of the enzymology of the GroEL/GroES system, the underlying principles of chaperone-mediated protein folding remain a subject of debate.796,802–804 Several mechanisms have been proposed. The Anfinsen cage model states that GroEL and GroES provide a passive box in which folding can proceed unimpaired by intermolecular interactions; in essence, the GroEL/GroES complex behaves as a box of infinite dilution.805–807 The iterative annealing model asserts that GroEL binds to partially folded, but not yet aggregated, proteins and actively unfolds these intermediates. Upon release into solution, the protein is then allowed another chance to fold properly.808,809 The dynamic Anfinsen cage (DAC) model is somewhat of a compromise and suggests a dynamic interaction between GroEL and protein that leads to partial unfolding.804 The hydrophobic walls of GroEL bind to exposed hydrophobic surfaces of the mis-folded or partially folded protein substrates. The binding of ATP to GroEL causes large conformational changes that “pull” on the hydrophobic surfaces of the protein substrate.810 Csermely has suggested that chaperones work by loosening a core, hydrophobic portion of the protein, but not by unfolding the polypeptide chain.811 Loosening by this mechanism would allow water molecules to enter the hydrophobic core of the protein and cause a multidirectional expansion. The percolation of water into the core is a key step in chaperone activity.
Experiments investigating the interaction between HCA II and GroEL provide evidence for the chaperone percolation model, although the mechanism may differ for other proteins.796 The observed hydrophobic core of HCA II loosens, and an increase in hydrophilicity around these central residues strongly suggests the presence of water molecules in the hydrophobic core.687 The predicted, multidirectional expansion is observed by the 3–4-fold increase in the size of HCA II when GroEL binds and by the increase in size and flexibility of the GroEL molecule itself. With respect to these types of studies, CA is an ideal protein for testing specific predictions. In the presence or absence of GroEL, CA (at least HCA II) can fold; the ability to compare assisted and unassisted folding simplifies the analysis of changes in the folding pathway induced by the interactions with GroEL.
15.5. Conclusions from Studies on the Folding and Unfolding of CA
These studies demonstrate that CA is an excellent model for extracting general principles of protein folding. Its advantages are its availability, the ease with which it can be overexpressed in bacteria, the concomitant ability to make site-directed mutations, and the many aspects of its folding pathway that are prototypical in the folding of proteins. In addition to CA-specific information, studies of CA have led to a number of conclusions about protein folding:
Proteins are not always random coils at high concentrations of denaturants. There may be residual structure in denatured states that act to seed the folding process.
Molten globules can be stable intermediates, and investigation of the properties of these intermediates (i.e., the degree of hydration in the hydrophobic core) helps to understand the steps in protein folding.
Proline isomerization can be the rate-limiting step in protein folding; the conformation of the chain may change both the rate at which the Pro bonds isomerize and the accessibility of protein residues to solvent and to proline isomerase.
The pathways of unfolding, folding, and yield of correctly folded protein are dependent on the denaturant.
Various classes of additives–small hydrophobic molecules, surfactants, cyclodextrins, and PEG polymers– can prevent the aggregation of proteins during refolding.
Because CA folds in both the presence and absence of chaperones, the effects of chaperone proteins on protein folding can be deduced more easily with CA than with proteins in which folding is not possible in the absence of chaperones.
The pathway by which CA folds from GuHCl has been described carefully and specifically (Figure 32 parts A and B). The folding proceeds through five intermediates, with the isomerization of Pro residues being the rate-limiting step. Knowing the details of the interactions that cause CA to fold makes it an exceptionally useful model in understanding many of the more complicated aspects of protein folding. Specifically, CA has provided invaluable insight into controversial aspects of protein folding such as the hydration of the molten-globule state, the details of the process by which proteins aggregate, and the mechanism of the interaction of misfolded and unfolded proteins with GroEL.
V. Why is CA a Good Model?
16. Conclusions
In this section, we briefly summarize why CA is an attractive model protein for a variety of biochemical and biophysical studies and compare and contrast it with other model proteins. We also examine the key conclusions from the individual sections of this review in the context of what makes CA a model protein for biophysical studies. More detailed conclusions can be found at the end of the individual sections.
16.1. What Are the Strengths and Weaknesses of CA as a Model Protein?
CA is one of the best proteins now available for studies requiring a model enzyme or a receptor for a small molecule ligand. The advantages and disadvantages of using CA, rather than other particularly well-defined proteins, as a model for drug design and biophysics are best addressed by considering the criteria listed in Table 16. There are eleven main advantages of using CA (specifically HCA I, HCA II, and BCA II) as a model enzyme/receptor:
Table 16.
Well-Defined Proteins Often Used as Model Enzymes or Small-Molecule Receptors
| Protein | EC | Source | M (kDa) | Subunits | Costa | Disulfide content | Cofactors | % α-helix | % β-strand | PDB (X-ray) | pI | Charge ladders? |
|---|---|---|---|---|---|---|---|---|---|---|---|---|
| insulin | bovine | 5.7 | 2 | $ | 3 | 37.3 | 0 | 1APH | 5.3 | yes | ||
| protein G | recombinant | 6.1 | 1 | $$$$ | 0 | 25.0 | 42.8 | 1PGA | 4.8 | N/D | ||
| ubiquitin | human, bovine | 8.6 | 1 | $$ | 0 | 15.8 | 30.3 | 1TBE | 6.56 | yes | ||
| cytochrome C | equine heart | 11.6 | 1 | $ | 0 | heme | 40.0 | 0 | 1WEJ | 10.0 | yes | |
| ribonuclease A | 3.1.27.5 | bovine pancreas | 13.6 | 1 | $$ | 4 | 17.7 | 31.4 | 1XPS | 9.8 | yes | |
| α-lactalbumin | bovine milk | 14.1 | 1 | $ | 4 | CaII, ZnII | 30.8 | 8.1 | 1F6S | 4.8 | yes | |
| lysozyme | 3.2.1.17 | egg white | 14.2 | 1 | $ | 4 | 30.2 | 6.2 | 193L | 10.9 | yes | |
| calmodulin | bovine brain | 16.6 | 1 | $$$ | 0 | CaII | 50.0 | 2.7 | 1CM4 | 4.0 | yes | |
| myoglobin | equine heart | 16.9 | 1 | $ | 0 | heme | 73.8 | 0 | 1WLA | 6.8 | yes | |
| HIV protease | 3.4.23.16 | HIV | 21.4 | 2 | $$$$ | 0 | 4.0 | 46.4 | 1A30 | N/D | ||
| trypsin | 3.4.21.4 | porcine pancreas | 23.4 | 1 | $ | 6 | 7.1 | 30.0 | 1AVW | N/D | ||
| triosephosphate isomerase | 5.3.1.1 | yeast | 26.6 | 1 | $$$ | 0 | NAD | 38.0 | 16.1 | 1YPI | N/D | |
| carbonic anhydrase | 4.2.1.1 | bovine | 29.3 | 1 | $ | 0 | ZnII | 7.6 | 25.7 | 1G6V | 5.9 | yes |
| carbonic anhydrase | 4.2.1.1 | human | 29.3 | 1 | $$$ | 0 | ZnII | 9.2 | 27.4 | 1A42 | 7.6 | yes |
| peroxidase | 1.11.1.7 | horseradish | 33.7 | 1 | $$ | 4 | heme | 44.7 | 1.9 | 1ATJ | 7.2 | yes |
| superoxide dismutase | 1.15.1.1 | human | 32.5 | 2 | $$$$ | 2 | ZnII, CuII | 1HL5 | 5.0 | yes | ||
| albumin | human serum | 66.4 | 1 | $ | 17 | 68.7 | 0 | 1AO6 | 5.67 | N/D | ||
| alcohol dehydrogenase | 1.1.1.1 | equine liver | 79.5 | 2 | $ | 0 | ZnII | 23.9 | 22.1 | 1HLD | 6.8 | N/D |
| alkaline phosphatase | 3.1.3.1 | bacteria | 94.0 | 2 | $$ | 4 | ZnII | 28.3 | 17.7 | 1ALK | 6.0 | no |
| IgG | mouse | 145 | 4 | $$$ | 17 | 4.2 | 44.7 | 1IGT | N/D | |||
| catalase | 1.11.1.6 | bovine | 230 | 4 | $$ | 0 | heme, NADP | 28.0 | 14.4 | 4BLC | N/D | |
| β-galactosidase | 3.2.1.23 | bacteria | 465 | 4 | $$ | 0 | 10.5 | 35.3 | 1HN1 | 5.0 | no |
Cost structure: “$” is below $0.50 per mg protein; “$$” is between $0.50 and $10 per mg; “$$$” is between $10 and $30 per mg; “$$$$” is above $30 per mg protein.
It is monomeric, single-chain, stable, and intermediate in molecular weight.
It is commercially available and inexpensive.
It can be easily mutated and purified in high yield from E. coli.
It contains no disulfide bonds.
Its structure has been well-defined biophysically.
It catalyzes a simple reaction in vivo–the hydration of carbon dioxide to bicarbonate.
It has a number of straightforward assays to examine the binding of ligands.
Its structure does not change drastically when it binds ligands.
Its ligands are easy to synthesize (and, thus, it is easy to test different physical-organic models for protein–ligand binding).
It has many metallovariants, many of which adopt similar tertiary structures as the wild-type enzyme.
It readily forms charge ladders, and its analysis– both as native enzyme and in charge ladders–by CE is straightforward.
These advantages make CA particularly well-suited for biophysical studies that seek to understand (i) the binding of ligands to proteins (e.g., screening efforts, rational approaches to ligand design, and mechanistic hypotheses), (ii) how binding at the surface of a solid and in the gas phase compare to that in solution, (iii) the role of electrostatics in protein stability and protein–ligand binding, and (iv) the pathways of folding and unfolding of proteins. We discuss each of these studies in turn below.
Although the list of positive criteria is long, CA has three primary disadvantages in its use as a model protein:
It contains a nonrepresentative binding site comprising a deep conical cleft, ~15 Å deep, with the binding of ligands occurring at the bottom of this cleft. It is, therefore, difficult to compare the binding of ligands and reactants to CA directly to similar studies of other enzymes with shallower binding pockets.
It has an essential ZnII cofactor. Much of the energy of binding of ligands to CA originates from the interaction of ligands with this cofactor. The presence of the ZnII cofactor also complicates computational approaches to ligand discovery.
It is composed primarily of β-sheets. Thus, its folding and unfolding pathways are unlikely to be representative of proteins with more α-helical content. Proteins with extensive β-sheet structure also tend to be prone to aggregation, which may compete with folding.
We believe that the advantages of CA far outweigh these disadvantages and make CA an excellent protein for biophysical studies.
16.2. What Are the Advantages of Using CA to Understand the Thermodynamics and Kinetics of Binding of Ligands to Proteins?
The ligands with the highest affinity for CA are the arylsulfonamides: the SO2NH group of this class of molecules resembles the transition state for the physiological reaction catalyzed by CA (the interconversion of carbon dioxide and bicarbonate). This observation, thus, underscores the general principle that high-affinity ligands for enzymes are often transition-state analogs. The essential feature that has enabled the system of CA and arylsulfonamides to be used as a model for understanding protein–ligand binding is the fact that the different structural interactions between CA and arylsulfonamide can, to a first-order approximation, be examined independently. Rigorous studies based on such an independent assessment of structural interactions have demonstrated that the pKa of the arylsulfonamide, the hydrophobicity of the aryl ring, and the hydrophobic surface area of the ligand are important factors governing affinity. These studies have also revealed that multivalency is an effective design principle to generate high-affinity ligands by appending secondary components to a low-affinity ligand (at least in the case of hydrophobic secondary components). Moreover, such studies have suggested that ionic or electrostatic interactions between ligand and protein are much more challenging to engineer than are hydrophobic contacts. Finally, these studies have revealed that the phenomenon of enthalpy/entropy compensation is ubiquitous in protein–ligand binding and needs to be understood to be able to design high-affinity ligands for proteins.
The most likely model for the association of CA and arylsulfonamides involves three states: unbound CA and ligand, a hydrophobically bound intermediate, and a fully associated CA–ligand complex. This system thus reveals that the model of association of even a “simple” protein and ligand can be surprisingly complicated and suggests that simple two-state models for association could be very rare.
16.3. What Are the Advantages of Using CA to Compare Binding in Solution to That at Solid Surfaces or in the Gas Phase?
Oligoethylene glycol groups on the surfaces of solids prevent the nonspecific binding of CA to these surfaces, and thus, the thermodynamics and kinetics of binding of CA and arylsulfonamides can be studied rigorously at these surfaces. Values of the rate constants of association and dissociation (kon and koff) measured at the surfaces of solids are similar to those measured in solution when care is taken to reduce the influences of mass transport and lateral steric effects. The system of CA/arylsulfonamides, thus, suggests that protein–ligand binding at solid surfaces is not intrinsically different from that in solution and can, in principle, be used in high-throughput assays to find high-affinity ligands for proteins.
The tertiary structure of CA is at least partially retained in the gas phase. This stability allows the comparison of binding in the gas phase and in solution. Binding in the gas phase is driven primarily by electrostatic contacts, whereas binding in solution can be dominated by the “hydrophobic effect.” Thus, it may not be possible to infer stability in solution from measurements made in the gas phase.
16.4. What Are the Advantages of Using CA to Understand the Role of Electrostatics in Protein Stability and Protein–Ligand Binding?
CA does not adsorb to the walls of a glass capillary (used in CE) and can be modified with acylating agents that change the surface charge of the protein (and generate charged derivatives called charge ladders) in a controlled manner. These facts have allowed CA to be used as a model protein in biophysical studies of the importance of electrostatics in protein stability. These studies revealed that the ionization of residues upon acetylation involves cooperative behavior. They also demonstrated that the positive charges on all of the Lys groups of CA can be removed without significantly changing either the conformation of CA at 25 °C or its ability to bind sulfonamides. The affinities of charged ligands, however, can be influenced by long-range electrostatic interactions (rather than by local modifications in the binding site). Electrostatic interactions can also influence the kinetics of denaturation of proteins by sodium dodecyl sulfate: removal of several positive charges from CA by acylation resulted in rates of denaturation that were slower by factors of ~102 than the native enzyme.
16.5. What Are the Advantages of Using CA to Understand How Proteins Fold and Unfold?
In addition to the advantages described in section 16.1, there are three reasons for using CA as a model in studying the denaturation of proteins:
Its folding pathway has many aspects that are prototypical in the folding of proteins.
It can fold with or without chaperonins (and, thus, allows the assessment of the influence of chaperonins on folding).
Its tendency to aggregate allows the investigation of the structural features responsible for aggregation and of additives that block aggregation.
Studies of CA suggest that folding for some proteins is initiated by hydrophobic interactions between “seed” residues, proceeds through a molten-globule intermediate, and is limited in rate by isomerization of proline residues. The ZnII cofactor of CA is not necessary for its folding into its native structure. Aggregation of misfolded proteins of CA involves specific residues and can be corrected by chaperone proteins or minimized by the addition of surfactants and other small molecules. Surface charge also has little influence on the ability of CA, denatured in SDS, to refold into its native state, but does influence its stability to SDS and other denaturants. In these studies, CA provides a model for proteins that fold and unfold through a molten-globule intermediate and for proteins that comprise mostly β-sheets and are prone to aggregate during refolding.
16.6. Coda
Three-quarters of a century after its discovery in 1932 by Meldrum and Roughton,812 CA remains a protein of active research interest for medical, biophysical, and physical-organic studies. In the short section that follows, we briefly summarize articles that appeared in the interval between the time we initially submitted the review (December 2006) and the time of submission of the completed version of the review (December 2007). This section only provides references with a brief indication of content and does not place this work in the context of the individual sections.
Recent medical studies have investigated the expression of CA,813,814 the role of CA in membrane transport processes,815,816 and its role in a variety of diseases,817 such as retinitis pigmentosa,818 diabetes mellitus type II,819 atopic dermatitis,820 brain cancer,821 and colorectal cancer.822
Many recent biophysical studies have investigated the inhibition3,28,128,182,225,227,232,234–238,376,593,823–850 and activation226,851–853 of CA. The majority of these studies aimed to design isozyme-specific inhibitors and activators. Several others have developed QSARs for inhibitors854–865 and activators866 of various isozymes of CA. The interaction of CA with surfaces has also been investigated for delivering inhibitors to CA via nanoparticles867 and for disrupting the self-assembly of ion channels.868
The latest research on the structure and function of CA has focused on analyzing the proton shuttle,54,266–268,869–873 the binding of zinc to CA,874 and the pKa of the zinc-bound water.305 In addition, several groups have further examined the denaturation, aggregation, and folding of CA.875–878
Our hope is that this review will be useful to investigators who are looking for a way to navigate this still very dynamic field.
Acknowledgments
We thank Dr. Valentine I. Vullev for initial contributions to this review. Dr. John J. Baldwin (Vitae Pharmaceuticals) also commented helpfully on an early version of the review. Research using CA in our group has been supported by the NIH (GM51559 and GM30367). V.M.K. and I.G. acknowledge support from NDSEG and NSF predoctoral fellowships, respectively. A.R.U. and D.B.W. acknowledge support from the NIH for postdoctoral fellowships (AI057076 and GM067445, respectively).
Biographies
 Vijay M. Krishnamurthy received a B.S. in Chemistry from the University of North Carolina at Chapel Hill in 1999. His undergraduate thesis, completed under the direction of Professor Royce W. Murray, examined the polymeric precursor to monolayer-protected gold clusters. He received a Ph.D. from Harvard University in 2006. His Ph.D. thesis, completed under the direction of Professor George M. Whitesides, explored the thermodynamic principles of rational ligand design and multivalency.
 George K. Kaufman received his B.A. in Classics, B.S. in Chemical Physics, and M.S. in Chemistry in 2002 from Brown University under Prof. Matthew B. Zimmt. He is currently a Ph.D. student under George M. Whitesides at Harvard University. His research interests include magnetic and electrostatic self-assembly, electret materials, protein aggregation and multivalency, and molecular electronics using self-assembled monolayers.
 Adam R. Urbach was born in Houston, Texas, and obtained his B.S. in Chemistry from the University of Texas at Austin and his Ph.D. with Peter Dervan from Caltech in 2002. Following an NIH postdoctoral fellowship under George M. Whitesides, he joined the Chemistry Department at Trinity University, where he is currently an Assistant Professor. His research interests are in the area of biomolecular recognition.
 Irina Gitlin received a B.S. in Chemical Engineering from the University of Illinois at Urbana-Champaign in 2000. She has recently completed her Ph.D. in Chemistry with G. M. Whitesides. Her research in the area of protein chemistry explores the role of electrostatic interactions in protein stability, binding of ligands, and susceptibility to denaturation by surfactants. She has also worked in the area of microfluidics.
 Katherine L. Gudiksen received her B.S. degree in Chemistry and Physics and her B.A. degree in Mathematics from Hope College, Holland, MI. She received her Ph.D. from Harvard University in 2006 working with Prof. G. M. Whitesides. She is currently a co-founder and Director of Technology at Nidaan, Inc., a start-up company focusing on biomarker discovery and cancer diagnostics. Her research interests include tools for proteomics and the role of hydrophobicity and electrostatics in protein folding.
 Douglas B. Weibel received his B.S. degree in Chemistry in 1996 from the University of Utah (with Prof. C. Dale Poulter) and his Ph.D. in Chemistry in 2002 from Cornell University (with Prof. Jerrold Meinwald). From 1996–1997, he was a Fulbright Fellow with Prof. Yoshinori Yamamoto at Tohoku University. From 2002–2006, he was a postdoctoral fellow with George M. Whitesides at Harvard University. He is currently an Assistant Professor of Biochemistry at the University of Wisconsin— Madison. His research interests include biochemistry, biophysics, chemical biology, materials science and engineering, and microbiology.
 George M. Whitesides received his A.B. degree from Harvard University in 1960 and his Ph.D. degree from the California Institute of Technology in 1964. A Mallinckrodt Professor of Chemistry from 1982 to 2004, he is now a Woodford L. and Ann A. Flowers University Professor. Prior to joining the Harvard faculty in 1992, he was a member of the chemistry faculty of the Massachusetts Institute of Technology. His research interests include physical and organic chemistry, materials science, biophysics, complexity, surface science, microfluidics, self-assembly, micro- and nanotechnology, and cell-surface biochemistry.
References
- 1.Stams T, Christianson DW. In: The Carbonic Anhydrases: New Horizons. Chegwidden WR, Carter ND, Edwards YH, editors. Vol. 90 Birkhäuser Verlag: Basel, Switzerland; 2000. [Google Scholar]
- 2.Supuran CT, Scozzafava A, Casini A. Med Res Rev. 2003;23:146. doi: 10.1002/med.10025. [DOI] [PubMed] [Google Scholar]
- 3.Nishimori I, Minakuchi T, Kohsaki T, Onishi S, Takeuchi H, Vullo D, Scozzafava A, Supuran CT. Bioorg Med Chem Lett. 2007;17:3585. doi: 10.1016/j.bmcl.2007.04.063. [DOI] [PubMed] [Google Scholar]
- 4.Dill KA, Bromberg S. Molecular Driving Forces: Statistical Thermodynamics in Chemistry & Biology. Garland Science; New York: 2003. [Google Scholar]
- 5.Whitesides GM, Krishnamurthy VM. Q Rev Biophys. 2005;38:385. doi: 10.1017/S0033583506004240. [DOI] [PMC free article] [PubMed] [Google Scholar]
- 6.Deutsch HF. Int J Biochem. 1987;19:101. doi: 10.1016/0020-711x(87)90320-x. [DOI] [PubMed] [Google Scholar]
- 7.Henry RP. Ann Rev Physiol. 1996;58:523. doi: 10.1146/annurev.ph.58.030196.002515. [DOI] [PubMed] [Google Scholar]
- 8.Henry RP, Swenson ER. Resp Physiol. 2000;121:1. doi: 10.1016/s0034-5687(00)00110-9. [DOI] [PubMed] [Google Scholar]
- 9.Gupta SP. Prog Drug Res. 2003;60:171. doi: 10.1007/978-3-0348-8012-1_6. [DOI] [PubMed] [Google Scholar]
- 10.Chegwidden WR, Dogdson SJ, Spencer IM. In: The Carbonic Anhydrases: New Horizons. Chegwidden WR, Carter ND, Edwards YH, editors. Vol. 90 Birkhäuser Verlag; Basel, Switzerland: 2000. [Google Scholar]
- 11.Dodgson SJ, Tashian RE, Gros G, Carter ND. The Carbonic Anhydrases: Cellular Physiology and Molecular Genetics. Plenum Press; New York: 1991. [Google Scholar]
- 12.Tashian RE, Hewitt-Emmett D. Ann N Y Acad Sci. 1984;429:640. doi: 10.1111/j.1749-6632.1984.tb12331.x. [DOI] [PubMed] [Google Scholar]
- 13.Wistrand PJ. In: The Carbonic Anhydrases: New Horizons. Chegwidden WR, Carter ND, Edwards YH, editors. Vol. 90 Birkhäuser Verlag; Basel, Switzerland: 2000. [Google Scholar]
- 14.Lindskog S, Silverman DN. In: The Carbonic Anhydrases: New Horizons. Chegwidden WR, Carter ND, Edwards YH, editors. Vol. 90 Birkhäuser Verlag; Basel, Switzerland: 2000. [Google Scholar]
- 15.Supuran CT, Scozzafava A, Conway J, editors. Carbonic Anhydrase: Its Inhibitors and Activators. Vol. 1 CRC Press; Boca Raton, FL: 2004. [Google Scholar]
- 16.Snider MG, Temple BS, Wolfenden R. J Phys Org Chem. 2004;17:586. [Google Scholar]
- 17.Khalifah RG. J Biol Chem. 1971;246:2561. [PubMed] [Google Scholar]
- 18.Jewell DA, Tu C, Paranawithana SR, Tanhauser SM, LoGrasso PV, Laipis PJ, Silverman DN. Biochemistry. 1991;30:1484. doi: 10.1021/bi00220a006. [DOI] [PubMed] [Google Scholar]
- 19.Ren X, Jonsson BH, Millqvist E, Lindskog S. Biochim Biophys Acta. 1988;953:79. doi: 10.1016/0167-4838(88)90011-8. [DOI] [PubMed] [Google Scholar]
- 20.Baird TT, Jr, Waheed A, Okuyama T, Sly WS, Fierke CA. Biochemistry. 1997;36:2669. doi: 10.1021/bi962663s. [DOI] [PubMed] [Google Scholar]
- 21.Hurt JD, Tu C, Laipis PJ, Silverman DN. J Biol Chem. 1997;272:13512. doi: 10.1074/jbc.272.21.13512. [DOI] [PubMed] [Google Scholar]
- 22.Heck RW, Tanhauser SM, Manda R, Tu C, Laipis PJ, Silverman DN. J Biol Chem. 1994;269:24742. [PubMed] [Google Scholar]
- 23.Feldstein JB, Silverman DN. J Biol Chem. 1984;259:5447. [PubMed] [Google Scholar]
- 24.Earnhardt JN, Qian M, Tu C, Lakkis MM, Bergenhem NCH, Laipis PJ, Tashian RE, Silverman DN. Biochemistry. 1998;37:10837. doi: 10.1021/bi980046t. [DOI] [PubMed] [Google Scholar]
- 25.Chegwidden WR, Carter ND. In: The Carbonic Anhydrases: New Horizons. Chegwidden WR, Carter ND, Edwards YH, editors. Vol. 90 Birkhäuser Verlag; Basel, Switzerland: 2000. [Google Scholar]
- 26.Lehtonen J, Shen B, Vihinen M, Casini A, Scozzafava A, Supuran CT, Parkkila A-K, Saarnio J, Kivelä AJ, Waheed A, Sly WS, Parkkila S. J Biol Chem. 2004;279:2719. doi: 10.1074/jbc.M308984200. [DOI] [PubMed] [Google Scholar]
- 27.Nishimori I, Vullo D, Innocenti A, Scozzafava A, Mastrolorenzo A, Supuran CT. J Med Chem. 2005;48:7860. doi: 10.1021/jm050483n. [DOI] [PubMed] [Google Scholar]
- 28.Nishimori I, Minakuchi T, Onishi S, Vullo D, Scozzafava A, Supuran CT. J Med Chem. 2007;50:381. doi: 10.1021/jm0612057. [DOI] [PubMed] [Google Scholar]
- 29.Nishimori I, Vullo D, Innocenti A, Scozzafava A, Mastrolorenzo A, Supuran CT. Bioorg Med Chem Lett. 2005;15:3828. doi: 10.1016/j.bmcl.2005.06.055. [DOI] [PubMed] [Google Scholar]
- 30.Fersht A. Structure and Mechanism in Protein Science. 3. W. H. Freeman; New York: 1999. [Google Scholar]
- 31.Rosenberry TL. Adv Enzymol Relat Areas Mol Biol. 1975;43:103. doi: 10.1002/9780470122884.ch3. [DOI] [PubMed] [Google Scholar]
- 32.Rosenberry TL, Bernhard SA. Biochemistry. 1972;11:4308. doi: 10.1021/bi00773a018. [DOI] [PubMed] [Google Scholar]
- 33.Rosenberry TL, Bernhard SA. Biochemistry. 1971;10:4114. doi: 10.1021/bi00798a016. [DOI] [PubMed] [Google Scholar]
- 34.Switala J, Loewen PC. Arch Biochem Biophys. 2002;401:145. doi: 10.1016/S0003-9861(02)00049-8. [DOI] [PubMed] [Google Scholar]
- 35.Ogura Y. Arch Biochem Biophys. 1955;57:288. doi: 10.1016/0003-9861(55)90291-5. [DOI] [PubMed] [Google Scholar]
- 36.Leveque VJ-P, Stroupe ME, Lepock JR, Cabelli DE, Trainer JA, Nick HS, Silverman DN. Biochemistry. 2000;39:7131. doi: 10.1021/bi9929958. [DOI] [PubMed] [Google Scholar]
- 37.Pocker Y, Meany JE. Biochemistry. 1967;6:239. doi: 10.1021/bi00853a037. [DOI] [PubMed] [Google Scholar]
- 38.Pocker Y, Dickerson DG. Biochemistry. 1968;7:1995. doi: 10.1021/bi00845a050. [DOI] [PubMed] [Google Scholar]
- 39.Sheridan RP, Deakyne CA, Allen LC. Adv Exp Med Biol. 1980;132:705. doi: 10.1007/978-1-4757-1419-7_73. [DOI] [PubMed] [Google Scholar]
- 40.Pocker Y, Sarkanen S. Adv Enzymol Mol Biol. 1978;47:149. doi: 10.1002/9780470122921.ch3. [DOI] [PubMed] [Google Scholar]
- 41.Kaiser E, Lo K-W. J Am Chem Soc. 1969;91:4912. [Google Scholar]
- 42.Chenevert R, Rhlid RB, Letourneau M, Gagnon R, D’Astous L. Tetrahedron: Asymmetry. 1993;4:1137. [Google Scholar]
- 43.Henkart P, Guidotti G, Edsall JT. J Biol Chem. 1968;243:2447. [PubMed] [Google Scholar]
- 44.Whitney PL, Fölsch G, Nyman PO, Malmström BG. J Biol Chem. 1967;242:4206. [PubMed] [Google Scholar]
- 45.Briganti F, Mangani S, Scozzafava A, Vernaglione G, Supuran CT. J Biol Inorg Chem. 1999;4:528. doi: 10.1007/s007750050375. [DOI] [PubMed] [Google Scholar]
- 46.Krebs JF, Fierke CA. J Biol Chem. 1993;268:948. [PubMed] [Google Scholar]
- 47.Liang JY, Lipscomb WN. Proc Natl Acad Sci USA. 1990;87:3675. doi: 10.1073/pnas.87.10.3675. [DOI] [PMC free article] [PubMed] [Google Scholar]
- 48.Silverman DN, Lindskog S. Acc Chem Res. 1988;21:30. [Google Scholar]
- 49.Krebs JF, Rana F, Dluhy RA, Fierke CA. Biochemistry. 1993;32:4496. doi: 10.1021/bi00068a004. [DOI] [PubMed] [Google Scholar]
- 50.An H, Tu C, Ren K, Laipis PJ, Silverman DN. Biochim Biophys Acta. 2002;1599:21. doi: 10.1016/s0167-4838(02)00374-6. [DOI] [PubMed] [Google Scholar]
- 51.Ren X, Tu C, Laipis PJ, Silverman DN. Biochemistry. 1995;34:8492. doi: 10.1021/bi00026a033. [DOI] [PubMed] [Google Scholar]
- 52.Steiner H, Jonsson BH, Lindskog S. Eur J Biochem. 1975;59:253. doi: 10.1111/j.1432-1033.1975.tb02449.x. [DOI] [PubMed] [Google Scholar]
- 53.Tu C, Silverman DN, Forsman C, Jonsson BH, Lindskog S. Biochemistry. 1989;28:7913. doi: 10.1021/bi00445a054. [DOI] [PubMed] [Google Scholar]
- 54.Fisher SZ, Maupin CM, Budayova-Spano M, Govindasamy L, Tu C, Agbandje-McKenna M, Silverman DN, Voth GA, McKenna R. Biochemistry. 2007;46:2930. doi: 10.1021/bi062066y. [DOI] [PubMed] [Google Scholar]
- 55.Nair SK, Ludwig PA, Christianson DW. J Am Chem Soc. 1994;116:3659. [Google Scholar]
- 56.Loferer MK, Tautermann CS, Loeffler HH, Liedi KR. J Am Chem Soc. 2003;125:8921. doi: 10.1021/ja035072f. [DOI] [PubMed] [Google Scholar]
- 57.Liang J-Y, Lipscomb WN. J Am Chem Soc. 1986;108:5051. doi: 10.1021/ja00263a052. [DOI] [PubMed] [Google Scholar]
- 58.Liang J-Y, Lipscomb WN. Biochemistry. 1987;26:5293. doi: 10.1021/bi00391a012. [DOI] [PubMed] [Google Scholar]
- 59.Tautermann CS, Loferer MK, Voegele AF, Liedi KR. J Phys Chem B. 2003;107:12013. [Google Scholar]
- 60.Rossi KA, Merz KM, Smith GM, Baldwin JJ. J Med Chem. 1995;38:2061. doi: 10.1021/jm00012a005. [DOI] [PubMed] [Google Scholar]
- 61.Smedarchina Z, Siebrand W, Fernandez-Ramos A, Cui Q. J Am Chem Soc. 2003;125:243. doi: 10.1021/ja0210594. [DOI] [PubMed] [Google Scholar]
- 62.Cui Q, Karplus M. J Phys Chem B. 2003;107:1071. [Google Scholar]
- 63.Mauksch M, Brauer M, Weston J, Anders E. ChemBioChem. 2001;2:190. doi: 10.1002/1439-7633(20010302)2:3<190::AID-CBIC190>3.0.CO;2-7. [DOI] [PubMed] [Google Scholar]
- 64.Merz KM, Jr, Hoffman JM, Dewar MJS. J Am Chem Soc. 1989;111:5636. [Google Scholar]
- 65.Maren TH. Ann Rev Physiol. 1988;50:695. doi: 10.1146/annurev.ph.50.030188.003403. [DOI] [PubMed] [Google Scholar]
- 66.Sanyal G, Maren TH. J Biol Chem. 1981;256:608. [PubMed] [Google Scholar]
- 67.Swenson ER. In: The Carbonic Anhydrases: New Horizons. Chegwidden WR, Carter ND, Edwards YH, editors. Vol. 90 Birkhäuser Verlag; Basel, Switzerland: 2000. [Google Scholar]
- 68.Stabenau EK, Heming T. Comp Biochem Physiol, Part A: Mol Integr Physiol. 2003;136A:271. doi: 10.1016/s1095-6433(03)00177-6. [DOI] [PubMed] [Google Scholar]
- 69.Shah GN, Ulmasov B, Waheed A, Becker T, Makani S, Svichar N, Chesler M, Sly WS. Proc Natl Acad Sci USA. 2005;102:16771. doi: 10.1073/pnas.0508449102. [DOI] [PMC free article] [PubMed] [Google Scholar]
- 70.Maren TH. In: The Carbonic Anhydrases: New Horizons. Chegwidden WR, Carter ND, Edwards YH, editors. Vol. 90 Birkhäuser Verlag; Basel, Swtizerland: 2000. [Google Scholar]
- 71.Mincione F, Menabuoni L, Supuran CT. In: Carbonic Anhydrase: Its Inhibitors and Activators. Supuran CT, Scozzafava A, Conway J, editors. CRC Press; Boca Raton, FL: 2004. [Google Scholar]
- 72.Gay CV, Weber JA. Crit Rev Eukaryotic Gene Expression. 2000;10:213. doi: 10.1615/critreveukargeneexpr.v10.i3-4.10. [DOI] [PubMed] [Google Scholar]
- 73.Hentunen TA, Harkonen PL, Vaananen HK. In: The Carbonic Anhydrases: New Horizons. Chegwidden WR, Carter ND, Edwards YH, editors. Vol. 90 Birkhäuser Verlag; Basel, Switzerland: 2000. [Google Scholar]
- 74.Sun M-K, Alkon DL. Trends Pharm Sci. 2002;23:83. doi: 10.1016/s0165-6147(02)01899-0. [DOI] [PubMed] [Google Scholar]
- 75.Cammer WB, Brion LP. In: The Carbonic Anhydrases: New Horizons. Chegwidden WR, Carter ND, Edwards YH, editors. Vol. 90 Birkhäuser Verlag; Basel, Switzerland: 2000. [Google Scholar]
- 76.Bryant BP. In: The Carbonic Anhydrases: New Horizons. Chegwidden WR, Carter ND, Edwards YH, editors. Vol. 90 Birkhäuser Verlag; Basel, Switzerland: 2000. [Google Scholar]
- 77.Parkkila S. In: The Carbonic Anhydrases: New Horizons. Chegwidden WR, Carter ND, Edwards YH, editors. Vol. 90 Birkhäuser Verlag; Basel, Switzerland: 2000. [Google Scholar]
- 78.Parkkila S, Parkkila A-K, Lehtola J, Reinila A, Sodervik H-J, Rannisto M, Rajaniemi H. Dig Dis Sci. 1997;42:1013. doi: 10.1023/a:1018889120034. [DOI] [PubMed] [Google Scholar]
- 79.Kivela AJ, Kivela J, Saarnio J, Parkkila S. World J Gastroenterol. 2005;11:155. doi: 10.3748/wjg.v11.i2.155. [DOI] [PMC free article] [PubMed] [Google Scholar]
- 80.Parkkila S, Parkkila A-K, Kivelae J. In: Carbonic Anhydrase: Its Inhibitors and Activators. Supuran CT, Scozzafava A, Conway J, editors. CRC Press; Boca Raton, FL: 2004. [Google Scholar]
- 81.Swenson ER. In: The Carbonic Anhydrases: Cellular Physiology and Molecular Genetics. Carter ND, Dodgson SJ, Gros G, Tashian RE, editors. Plenum Press; New York: 1991. [Google Scholar]
- 82.Geers C, Gros G. Physiol Rev. 2000;80:681. doi: 10.1152/physrev.2000.80.2.681. [DOI] [PubMed] [Google Scholar]
- 83.Wetzel P, Gros G. In: The Carbonic Anhydrases: New Horizons. Chegwidden WR, Carter ND, Edwards YH, editors. Vol. 90 Birkhäuser Verlag; Basel, Switzerland: 2000. [Google Scholar]
- 84.Berg JT, Ramanathan S, Gabrielli MG, Swenson ER. J Histochem Cytochem. 2004;52:1101. doi: 10.1369/jhc.4A6266.2004. [DOI] [PubMed] [Google Scholar]
- 85.Breton S, Hammar K, Smith PJS, Brown D. Am J Physiol. 1998;275:C1134. doi: 10.1152/ajpcell.1998.275.4.C1134. [DOI] [PubMed] [Google Scholar]
- 86.Raisanen SR, Lehenkari P, Tasanen M, Rahkila P, Harkonen PL, Vaananen HK. FASEB J. 1999;13:513. doi: 10.1096/fasebj.13.3.513. [DOI] [PubMed] [Google Scholar]
- 87.Cabiscol E, Levine RL. Proc Natl Acad Sci USA. 1996;93:4170. doi: 10.1073/pnas.93.9.4170. [DOI] [PMC free article] [PubMed] [Google Scholar]
- 88.Švastová E, Hulíková A, Rafajová M, Zat’ovičová M, Gibadulinová A, Casini A, Cecchi A, Scozzafava A, Supuran CT, Pastorek J, Pastoreková S. FEBS Lett. 2004;577:439. doi: 10.1016/j.febslet.2004.10.043. [DOI] [PubMed] [Google Scholar]
- 89.Cammer W. In: The Carbonic Anhydrases: Cellular Physiology and Molecular Genetics. Carter ND, Dodgson SJ, Gros G, Tashian RE, editors. Plenum Press; New York: 1991. [Google Scholar]
- 90.Wistrand PJ, Schenholm M, Lönnerholm G. Invest Ophthalmol Vision Sci. 1986;27:419. [PubMed] [Google Scholar]
- 91.Alward WLM. N Engl J Med. 1998;339:1298. doi: 10.1056/NEJM199810293391808. [DOI] [PubMed] [Google Scholar]
- 92.Kaur IP, Aggarwal D. In: Trends in Glaucoma Research. Reece SM, editor. Nova Science Publishers; Hauppaugh, NY: 2005. [Google Scholar]
- 93.Stefansson E, Pedersen DB, Jensen PK, la Cour M, Kiilgaard JF, Bang K, Eysteinsson T. Prog Retinal Eye Res. 2005;24:307. doi: 10.1016/j.preteyeres.2004.09.001. [DOI] [PubMed] [Google Scholar]
- 94.Moldow B, Sander B, Larsen M, Engler C, Li B, Rosenberg T, Lund-Andersen H. Graefes Arch Clin Exp Ophthalmol. 1998;236:881. doi: 10.1007/s004170050175. [DOI] [PubMed] [Google Scholar]
- 95.Wolfensberger TJ. Doc Ophthalmol. 1999;97:387. doi: 10.1023/a:1002143802926. [DOI] [PubMed] [Google Scholar]
- 96.Maren TH, Conroy CW, Wynns GC, Godman DR. J Pharmacol Exp Ther. 1997;280:98. [PubMed] [Google Scholar]
- 97.Sun MK, Alkon DL. J Pharmacol Exp Ther. 2001;297:961. [PubMed] [Google Scholar]
- 98.Staley KJ, Soldo BL, Proctor WR. Science. 1995;269:977. doi: 10.1126/science.7638623. [DOI] [PubMed] [Google Scholar]
- 99.Sills GJ, Leach JP, Kilpatrick WS, Fraser CM, Thompson GG, Brodie MJ. Epilepsia. 2000;41:S30. doi: 10.1111/j.1528-1157.2000.tb06046.x. [DOI] [PubMed] [Google Scholar]
- 100.Shinnar S, Gammon K, Bergman EW, Jr, Epstein M, Freeman JM. J Pediatr. 1985;107:31. doi: 10.1016/s0022-3476(85)80609-0. [DOI] [PubMed] [Google Scholar]
- 101.Cowan F, Whitelaw A. Acta Paediatr Scand. 1991;80:22. doi: 10.1111/j.1651-2227.1991.tb11724.x. [DOI] [PubMed] [Google Scholar]
- 102.Tawil R, McDermott MP, Brown R, Jr, Shapiro BC, Ptacek LJ, McManis PG, Dalakas MC, Spector SA, Mendell JR, Hahn AF, Griggs RC. Ann Neurol. 2000;47:46. [PubMed] [Google Scholar]
- 103.Puscas I, Coltau M, Baican M, Pasca R, Domuta G. Res Commun Mol Pathol Pharmacol. 1999;105:213. [PubMed] [Google Scholar]
- 104.Puscas I, Gilau L, Coltau M, Pasca R, Domuta G, Baican M, Hecht A. Clin Pharmacol Ther. 2000;68:443. doi: 10.1067/mcp.2000.110559. [DOI] [PubMed] [Google Scholar]
- 105.Schwartz WB, Relman AS, Leaf A. Ann Intern Med. 1955;42:79. doi: 10.7326/0003-4819-42-1-79. [DOI] [PubMed] [Google Scholar]
- 106.Barbarino F, Toganel E, Brilinschi C. Carbonic Anhydrase Modulation Physiol Pathol Processes Org [Pap Symp] 1994:492. [Google Scholar]
- 107.Puscas I, Coltau M, Chis F, Bologa O. Carbonic Anhydrase Modulation Physiol Pathol Processes Org [Pap Symp] 1994:519. [Google Scholar]
- 108.Puscas I, Coltau M, Maghiar A, Domuta G. Exp Toxicol Pathol. 2000;52:431. [PubMed] [Google Scholar]
- 109.Rousselle AV, Heymann D. Bone. 2002;30:533. doi: 10.1016/s8756-3282(02)00672-5. [DOI] [PubMed] [Google Scholar]
- 110.Lomri A, Baron R. Proc Natl Acad Sci USA. 1992;89:4688. doi: 10.1073/pnas.89.10.4688. [DOI] [PMC free article] [PubMed] [Google Scholar]
- 111.Borthwick KJ, Kandemir N, Topaloglu R, Kornak U, Bakkaloglu A, Yordam N, Ozen S, Mocan H, Shah GN, Sly WS, Karet FE. J Med Genet. 2003;40:115. doi: 10.1136/jmg.40.2.115. [DOI] [PMC free article] [PubMed] [Google Scholar]
- 112.Kenny AD. SAAS Bull Biochem Biotech. 1991;4:6. [Google Scholar]
- 113.Dodgson SJ, Forster RE., II Arch Biochem Biophys. 1986;251:198. doi: 10.1016/0003-9861(86)90066-4. [DOI] [PubMed] [Google Scholar]
- 114.Dodgson SJ, Cherian K. Am J Physiol Endocrinol Metab. 1989;257:E791. doi: 10.1152/ajpendo.1989.257.6.E791. [DOI] [PubMed] [Google Scholar]
- 115.Dodgson SJ, Forster RE., II J Appl Physiol. 1986;60:646. doi: 10.1152/jappl.1986.60.2.646. [DOI] [PubMed] [Google Scholar]
- 116.Lynch C, Fox H, Hazen SA, Stanley BA, Dodgson S, LaNoue KF. Biochem J. 1995;310:197. doi: 10.1042/bj3100197. [DOI] [PMC free article] [PubMed] [Google Scholar]
- 117.Forwand SA, Landowne M, Follansbee JN, Hansen JE. N Engl J Med. 1968;279:839. doi: 10.1056/NEJM196810172791601. [DOI] [PubMed] [Google Scholar]
- 118.Wright AD, Bradwell AR, Fletcher RF. Aviat, Space Environ Med. 1983;54:619. [PubMed] [Google Scholar]
- 119.Wagenaar M, Je Vos P, Heijdra YF, Teppema LJ, Folgering HTM. Eur Respir J. 2002;20:1130. doi: 10.1183/09031936.02.00016402. [DOI] [PubMed] [Google Scholar]
- 120.Wagenaar M, Vos P, Heijdra Y, Teppema L, Folgering H. Chest. 2003;123:1450. doi: 10.1378/chest.123.5.1450. [DOI] [PubMed] [Google Scholar]
- 121.Mastrolorenzo A, Scozzafava A, Supuran CT. J Enzyme Inhib. 2000;15:517. doi: 10.3109/14756360009040707. [DOI] [PubMed] [Google Scholar]
- 122.Puccetti L, Fasolis G, Cecchi A, Winum JY, Gamberi A, Montero JL, Scozzafava A, Supuran CT. Bioorg Med Chem Lett. 2005;15:2359. doi: 10.1016/j.bmcl.2005.02.087. [DOI] [PubMed] [Google Scholar]
- 123.Supuran CT. Expert Opin Invest Drugs. 2003;12:283. doi: 10.1517/13543784.12.2.283. [DOI] [PubMed] [Google Scholar]
- 124.Özensoy Ö, Puccetti L, Fasolis G, Arslan O, Scozzafava A, Supuran CT. Bioorg Med Chem Lett. 2005;15:4862. doi: 10.1016/j.bmcl.2005.08.048. [DOI] [PubMed] [Google Scholar]
- 125.Pastorekova S, Pastorek J. In: Carbonic Anhydrase: Its Inhibitors and Activators. Supuran CT, Scozzafava A, Conway J, editors. CRC Press; Boca Raton, FL: 2004. [Google Scholar]
- 126.Pastorekova S, Vullo D, Casini A, Scozzafava A, Pastorek J, Nishimori I, Supuran CT. J Enzyme Inhib Med Chem. 2005;20:211. doi: 10.1080/14756360400028101. [DOI] [PubMed] [Google Scholar]
- 127.Owa T, Yoshino H, Okauchi T, Yoshimatsu K, Ozawa Y, Sugi NH, Nagasu T, Koyanagi N, Kitoh K. J Med Chem. 1999;42:3789. doi: 10.1021/jm9902638. [DOI] [PubMed] [Google Scholar]
- 128.Leese MP, Leblond B, Smith A, Newman SP, Di Fiore A, De Simone G, Supuran CT, Purohit A, Reed MJ, Potter BVL. J Med Chem. 2006;49:7683. doi: 10.1021/jm060705x. [DOI] [PubMed] [Google Scholar]
- 129.Beasley NJ, Wykoff CC, Watson PH, Leek R, Turley H, Gatter K, Pastorek J, Cox GJ, Ratcliffe P, Harris AL. Cancer Res. 2001;61:5262. [PubMed] [Google Scholar]
- 130.Robertson N, Potter C, Harris AL. Cancer Res. 2004;64:6160. doi: 10.1158/0008-5472.CAN-03-2224. [DOI] [PubMed] [Google Scholar]
- 131.Span PN, Bussink J, Manders P, Beex LV, Sweep CG. Br J Cancer. 2003;89:271. doi: 10.1038/sj.bjc.6601122. [DOI] [PMC free article] [PubMed] [Google Scholar]
- 132.Griffiths EA, Pritchard SA, Welch IM, Price PM, West CM. Eur J Cancer. 2005;41:2792. doi: 10.1016/j.ejca.2005.09.008. [DOI] [PubMed] [Google Scholar]
- 133.Kim J-Y, Shin H-J, Kim T-H, Cho K-H, Shin K-H, Kim B-K, Roh J-W, Lee S, Park S-Y, Hwang Y-J, Han I-O. J Cancer Res Clin Oncol. 2006;132:302. doi: 10.1007/s00432-005-0068-2. [DOI] [PMC free article] [PubMed] [Google Scholar]
- 134.Proescholdt MA, Mayer C, Kubitza M, Schubert T, Liao S-Y, Stanbridge EJ, Ivanov S, Oldfield EH, Brawanski A, Merrill MJ. Neuro-Oncology. 2005;7:465. doi: 10.1215/S1152851705000025. [DOI] [PMC free article] [PubMed] [Google Scholar]
- 135.Said J. Biomarkers. 2005;10:S83. doi: 10.1080/13547500500215050. [DOI] [PubMed] [Google Scholar]
- 136.Parkkila S, Rajaniemi H, Parkkila A-K, Kivelä J, Waheed A, Pastoreková S, Pastorek J, Sly WS. Proc Natl Acad Sci USA. 2000;97:2220. doi: 10.1073/pnas.040554897. [DOI] [PMC free article] [PubMed] [Google Scholar]
- 137.Ozawa Y, Sugi NH, Nagasu T, Owa T, Watanabe T, Koyanagi N, Yoshino H, Kitoh K, Yoshimatsu K. Eur J Cancer. 2001;37:2275. doi: 10.1016/s0959-8049(01)00275-1. [DOI] [PubMed] [Google Scholar]
- 138.Yokoi A, Kuromitsu J, Kawai T, Nagasu T, Sugi NH, Yoshimatsu K, Yoshino H, Owa T. Mol Cancer Ther. 2002;1:275. [PubMed] [Google Scholar]
- 139.Hewett-Emmett D, Tashian RE. Mol Phylogenet Evol. 1996;5:50. doi: 10.1006/mpev.1996.0006. [DOI] [PubMed] [Google Scholar]
- 140.Hewett-Emmett D. In: The Carbonic Anhydrases: New Horizons. Chegwidden WR, Carter ND, Edwards YH, editors. Vol. 90 Birkhäuser Verlag; Basel, Switzerland: 2000. [Google Scholar]
- 141.Lane TW, Morel FMM. Plant Physiol. 2000;123:345. doi: 10.1104/pp.123.1.345. [DOI] [PMC free article] [PubMed] [Google Scholar]
- 142.Tripp BC, Smith K, Ferry JG. J Biol Chem. 2001;276:48615. doi: 10.1074/jbc.R100045200. [DOI] [PubMed] [Google Scholar]
- 143.So AK-C, Espie GS, Williams EB, Shively JM, Heinhorst S, Cannon GC. J Bacteriol. 2004;186:623. doi: 10.1128/JB.186.3.623-630.2004. [DOI] [PMC free article] [PubMed] [Google Scholar]
- 144.Sawaya MR, Cannon GC, Heinhorst S, Tanaka S, Williams EB, Yeates TO, Kerfeld CA. J Biol Chem. 2006;281:7546. doi: 10.1074/jbc.M510464200. [DOI] [PubMed] [Google Scholar]
- 145.Parkkila S. In: The Carbonic Anhydrases: New Horizons. Chegwidden WR, Carter ND, Edwards YH, editors. Vol. 90 Birkhäuser Verlag; Basel, Switzerland: 2000. [Google Scholar]
- 146.Hilvo M, Tolvanen M, Clark A, Shen B, Shah GN, Waheed A, Ralmi P, Hanninen M, Hamalainen JM, Vihinen M, Sly WS, Parkkila S. Biochem J. 2005;392:83. doi: 10.1042/BJ20051102. [DOI] [PMC free article] [PubMed] [Google Scholar]
- 147.Saito R, Sato T, Ikai A, Tanaka N. Acta Crystallogr, Sect D. 2004;D60:792. doi: 10.1107/S0907444904003166. [DOI] [PubMed] [Google Scholar]
- 148.Nyman PO, Lindskog S. Biochim Biophys Acta. 1964;85:141. doi: 10.1016/0926-6569(64)90310-4. [DOI] [PubMed] [Google Scholar]
- 149.Funakoshi S, Deutsch HF. J Biol Chem. 1969;244:3438. [PubMed] [Google Scholar]
- 150.Jonsson M, Pettersson E. Acta Chem Scand. 1968;22:712. doi: 10.3891/acta.chem.scand.22-0712. [DOI] [PubMed] [Google Scholar]
- 151.Murakami H, Marelich GP, Grubb JH, Kyle JW, Sly WS. Genomics. 1987;1:159. doi: 10.1016/0888-7543(87)90008-5. [DOI] [PubMed] [Google Scholar]
- 152.Alam MT, Yamada T, Carlsson U, Ikai A. FEBS Lett. 2002;519:35. doi: 10.1016/s0014-5793(02)02693-5. [DOI] [PubMed] [Google Scholar]
- 153.Nair SK, Calderone TL, Christianson DW, Fierke CA. J Biol Chem. 1991;266:17320. [PubMed] [Google Scholar]
- 154.Osborne WRA, Tashian RE. Anal Biochem. 1975;64:297. doi: 10.1016/0003-2697(75)90434-0. [DOI] [PubMed] [Google Scholar]
- 155.Khalifah RG, Strader DJ, Bryant SH, Gibson SM. Biochemistry. 1977;16:2241. doi: 10.1021/bi00629a031. [DOI] [PubMed] [Google Scholar]
- 156.Krebs JF, Ippolito JA, Christianson DW, Fierke CA. J Biol Chem. 1993;268:27458. [PubMed] [Google Scholar]
- 157.Pocker Y, Stone JT. Biochemistry. 1968;7:2936. doi: 10.1021/bi00848a034. [DOI] [PubMed] [Google Scholar]
- 158.Alexander RS, Nair SK, Christianson DW. Biochemistry. 1991;30:11064. doi: 10.1021/bi00110a008. [DOI] [PubMed] [Google Scholar]
- 159.Tilander B, Strandberg B, Fridborg K. J Mol Biol. 1965;12:740. doi: 10.1016/s0022-2836(65)80324-2. [DOI] [PubMed] [Google Scholar]
- 160.Bernstein FC, Koetzle TF, Williams GJ, Meyer EF, Jr, Brice MD, Rodgers JR, Kennard O, Shimanouchi T, Tasumi M. J Mol Biol. 1977;112:535. doi: 10.1016/s0022-2836(77)80200-3. [DOI] [PubMed] [Google Scholar]
- 161.Eriksson AE, Liljas A. Proteins: Struct, Funct, Genet. 1993;16:29. doi: 10.1002/prot.340160104. [DOI] [PubMed] [Google Scholar]
- 162.Stams T, Chen Y, Boriack-Sjodin PA, Hurt JD, Liao J, May JA, Dean T, Laipis P, Silverman DN, Christianson DW. Protein Sci. 1998;7:556. doi: 10.1002/pro.5560070303. [DOI] [PMC free article] [PubMed] [Google Scholar]
- 163.Boriack-Sjodin PA, Heck RW, Laipis PJ, Silverman DN, Christianson DW. Proc Natl Acad Sci USA. 1995;92:10949. doi: 10.1073/pnas.92.24.10949. [DOI] [PMC free article] [PubMed] [Google Scholar]
- 164.Jude KM, Wright SK, Tu C, Silverman DN, Viola RE, Christianson DW. Biochemistry. 2002;41:2485. doi: 10.1021/bi015808q. [DOI] [PubMed] [Google Scholar]
- 165.Heck RW, Boriack-Sjodin PA, Qian M, Tu C, Christianson DW, Laipis PJ, Silverman DN. Biochemistry. 1996;35:11605. doi: 10.1021/bi9608018. [DOI] [PubMed] [Google Scholar]
- 166.Whittington DA, Grubb JH, Waheed A, Shah GN, Sly WS, Christianson DW. J Biol Chem. 2004;279:7223. doi: 10.1074/jbc.M310809200. [DOI] [PubMed] [Google Scholar]
- 167.Mallis RJ, Poland BW, Chatterjee TK, Fisher RA, Darmawan S, Honzatko RB, Thomas JA. FEBS Lett. 2000;482:237. doi: 10.1016/s0014-5793(00)02022-6. [DOI] [PubMed] [Google Scholar]
- 168.Huang S, Xue Y, Sauer-Eriksson E, Chirica L, Lindskog S, Jonsson BH. J Mol Biol. 1998;283:301. doi: 10.1006/jmbi.1998.2077. [DOI] [PubMed] [Google Scholar]
- 169.Premkumar L, Greenblatt HM, Bageshwar UK, Savchenko T, Gokhman I, Sussman JL, Zamir A. Proc Natl Acad Sci USA. 2005;102:7493. doi: 10.1073/pnas.0502829102. [DOI] [PMC free article] [PubMed] [Google Scholar]
- 170.Mitsuhashi S, Mizushima T, Yamashita E, Yamamoto M, Kumasaka T, Moriyama H, Ueki T, Miyachi S, Tsukihara T. J Biol Chem. 2000;275:5521. doi: 10.1074/jbc.275.8.5521. [DOI] [PubMed] [Google Scholar]
- 171.Kimber MS, Pai EF. EMBO J. 2000;19:1407. doi: 10.1093/emboj/19.7.1407. [DOI] [PMC free article] [PubMed] [Google Scholar]
- 172.Cronk JD, Endrizzi JA, Cronk MR, O’Neill JW, Zhang KYJ. Protein Sci. 2001;10:911. doi: 10.1110/ps.46301. [DOI] [PMC free article] [PubMed] [Google Scholar]
- 173.Cronk JD, Rowlett RS, Zhang KY, Tu C, Endrizzi JA, Lee J, Gareiss PC, Preiss JR. Biochemistry. 2006;45:4351. doi: 10.1021/bi052272q. [DOI] [PubMed] [Google Scholar]
- 174.Suarez Covarrubias A, Bergfors T, Jones TA, Hoegbom M. J Biol Chem. 2006;281:4993. doi: 10.1074/jbc.M510756200. [DOI] [PubMed] [Google Scholar]
- 175.Suarez Covarrubias A, Larsson Anna M, Hogbom M, Lindberg J, Bergfors T, Bjorkelid C, Mowbray Sherry L, Unge T, Jones TA. J Biol Chem. 2005;280:18782. doi: 10.1074/jbc.M414348200. [DOI] [PubMed] [Google Scholar]
- 176.Strop P, Smith KS, Iverson TM, Ferry JG, Rees DC. J Biol Chem. 2001;276:10299. doi: 10.1074/jbc.M009182200. [DOI] [PubMed] [Google Scholar]
- 177.Kisker C, Schindelin H, Alber BE, Ferry JG, Rees DC. EMBO J. 1996;15:2323. [PMC free article] [PubMed] [Google Scholar]
- 178.Iverson TM, Alber BE, Kisker C, Ferry JG, Rees DC. Biochemistry. 2000;39:9222. doi: 10.1021/bi000204s. [DOI] [PubMed] [Google Scholar]
- 179.Håkansson K, Briand C, Zaitsev V, Xue Y, Liljas A. Acta Crystallogr, Sect D. 1994;D50:101. doi: 10.1107/S0907444993009667. [DOI] [PubMed] [Google Scholar]
- 180.Kim C-Y, Chang JS, Doyon JB, Baird TT, Jr, Fierke CA, Jain A, Christianson DW. J Am Chem Soc. 2000;122:12125. [Google Scholar]
- 181.Jude KM, Banerjee AL, Haldar MK, Manokaran S, Roy B, Mallik S, Srivastava DK, Christianson DW. J Am Chem Soc. 2006;128:3011. doi: 10.1021/ja057257n. [DOI] [PMC free article] [PubMed] [Google Scholar]
- 182.Krishnamurthy VM, Bohall BR, Kim C-Y, Moustakas DT, Christianson DW, Whitesides GM. Chem Asian J. 2007;2:94. doi: 10.1002/asia.200600360. [DOI] [PMC free article] [PubMed] [Google Scholar]
- 183.Fisher Z, Hernandez Prada JA, Yu C, Duda D, Yashioka C, An H, Govindasamy L, Silverman DN, McKenna R. Biochemistry. 2005;44:1097. doi: 10.1021/bi0480279. [DOI] [PubMed] [Google Scholar]
- 184.Håkansson K, Carlsson M, Svensson LA, Liljas A. J Mol Biol. 1992;227:1192. doi: 10.1016/0022-2836(92)90531-n. [DOI] [PubMed] [Google Scholar]
- 185.Boriack PA, Christianson DW, Kingery-Wood J, Whitesides GM. J Med Chem. 1995;38:2286. doi: 10.1021/jm00013a004. [DOI] [PubMed] [Google Scholar]
- 186.Eriksson AE, Kylsten PM, Jones TA, Liljas A. Proteins: Struct, Funct, Genet. 1988;4:283. doi: 10.1002/prot.340040407. [DOI] [PubMed] [Google Scholar]
- 187.Håkansson K, Wehnert A, Liljas A. Acta Crystallogr, Sect D. 1994;D50:93. doi: 10.1107/S0907444993008790. [DOI] [PubMed] [Google Scholar]
- 188.Håkansson K, Wehnert A. J Mol Biol. 1992;228:1212. doi: 10.1016/0022-2836(92)90327-g. [DOI] [PubMed] [Google Scholar]
- 189.Grzybowski BA, Ishchenko AV, Kim C-Y, Topalov G, Chapman R, Christianson DW, Whitesides GM, Shakhnovich EI. Proc Natl Acad Sci USA. 2002;99:1270. doi: 10.1073/pnas.032673399. [DOI] [PMC free article] [PubMed] [Google Scholar]
- 190.Temperini C, Scozzafava A, Puccetti L, Supuran CT. Bioorg Med Chem Lett. 2005;15:5136. doi: 10.1016/j.bmcl.2005.08.069. [DOI] [PubMed] [Google Scholar]
- 191.Temperini C, Scozzafava A, Supuran CT. Bioorg Med Chem Lett. 2006;16:5152. doi: 10.1016/j.bmcl.2006.07.021. [DOI] [PubMed] [Google Scholar]
- 192.Temperini C, Scozzafava A, Vullo D, Supuran CT. Chem– Eur J. 2006;12:7057. doi: 10.1002/chem.200600159. [DOI] [PubMed] [Google Scholar]
- 193.Temperini C, Scozzafava A, Vullo D, Supuran CT. J Med Chem. 2006;49:3019. doi: 10.1021/jm0603320. [DOI] [PubMed] [Google Scholar]
- 194.Briganti F, Mangani S, Orioli P, Scozzafava A, Vernaglione G, Supuran CT. Biochemistry. 1997;36:10384. doi: 10.1021/bi970760v. [DOI] [PubMed] [Google Scholar]
- 195.Jonsson BM, Håkansson K, Liljas A. FEBS Lett. 1993;322:186. doi: 10.1016/0014-5793(93)81565-h. [DOI] [PubMed] [Google Scholar]
- 196.Kumar V, Kannan KK, Sathyamurthi P. Acta Crystallogr, Sect D. 1994;D50:731. doi: 10.1107/S0907444994001873. [DOI] [PubMed] [Google Scholar]
- 197.Mangani S, Håkansson K. Eur J Biochem. 1992;210:867. doi: 10.1111/j.1432-1033.1992.tb17490.x. [DOI] [PubMed] [Google Scholar]
- 198.Kumar V, Kannan KK. J Mol Biol. 1994;241:226. doi: 10.1006/jmbi.1994.1491. [DOI] [PubMed] [Google Scholar]
- 199.Boriack-Sjodin PA, Zeitlin S, Chen H-H, Crenshaw L, Gross S, Dantarayana A, Delgado P, May JA, Dean T, Christianson DW. Protein Sci. 1998;7:2483. doi: 10.1002/pro.5560071201. [DOI] [PMC free article] [PubMed] [Google Scholar]
- 200.Scolnick LR, Clements AM, Liao J, Crenshaw L, Hellberg M, May J, Dean TR, Christianson DW. J Am Chem Soc. 1997;119:850. [Google Scholar]
- 201.Håkansson K, Liljas A. FEBS Lett. 1994;350:319. doi: 10.1016/0014-5793(94)00798-5. [DOI] [PubMed] [Google Scholar]
- 202.Cappalonga Bunn AM, Alexander RS, Christianson DW. J Am Chem Soc. 1994;116:5063. [Google Scholar]
- 203.Nair SK, Elbaum D, Christianson DW. J Biol Chem. 1996;271:1003. doi: 10.1074/jbc.271.2.1003. [DOI] [PubMed] [Google Scholar]
- 204.Weber A, Casini A, Heine A, Kuhn D, Supuran CT, Scozzafava A, Klebe G. J Med Chem. 2004;47:550. doi: 10.1021/jm030912m. [DOI] [PubMed] [Google Scholar]
- 205.Di Fiore A, Pedone C, D’Ambrosio K, Scozzafava A, De Simone G, Supuran CT. Bioorg Med Chem Lett. 2006;16:437. doi: 10.1016/j.bmcl.2005.09.040. [DOI] [PubMed] [Google Scholar]
- 206.Alterio V, Vitale RM, Monti SM, Pedone C, Scozzafava A, Cecchi A, De Simone G, Supuran CT. J Am Chem Soc. 2006;128:8329. doi: 10.1021/ja061574s. [DOI] [PubMed] [Google Scholar]
- 207.Menchise V, De Simone G, Alterio V, Di Fiore A, Pedone C, Scozzafava A, Supuran CT. J Med Chem. 2005;48:5721. doi: 10.1021/jm050333c. [DOI] [PubMed] [Google Scholar]
- 208.Elbaum D, Nair SK, Patchan MW, Thompson RB, Christianson DW. J Am Chem Soc. 1996;118:8381. [Google Scholar]
- 209.De Simone G, Vitale RM, Di Fiore A, Pedone C, Scozzafava A, Montero J-L, Winum J-Y, Supuran CT. J Med Chem. 2006;49:5544. doi: 10.1021/jm060531j. [DOI] [PubMed] [Google Scholar]
- 210.Whittington DA, Waheed A, Ulmasov B, Shah GN, Grubb JH, Sly WS, Christianson DW. Proc Natl Acad Sci USA. 2001;98:9545. doi: 10.1073/pnas.161301298. [DOI] [PMC free article] [PubMed] [Google Scholar]
- 211.Chakravarty S, Kannan KK. J Mol Biol. 1994;243:298. doi: 10.1006/jmbi.1994.1655. [DOI] [PubMed] [Google Scholar]
- 212.Menchise V, De Simone G, Di Fiore A, Scozzafava A, Supuran CT. Bioorg Med Chem Lett. 2006;16:6204. doi: 10.1016/j.bmcl.2006.09.022. [DOI] [PubMed] [Google Scholar]
- 213.Fisher SZ, Govindasamy L, Boyle N, Agbandje-McKenna M, Silverman David N, Blackburn GM, McKenna R. Acta Crystallogr, Sect F. 2006;F62:618. doi: 10.1107/S1744309106020446. [DOI] [PMC free article] [PubMed] [Google Scholar]
- 214.Smith GM, Alexander RS, Christianson DW, McKeever BM, Ponticello GS, Springer JP, Randall WC, Baldwin JJ, Habecker CN. Protein Sci. 1994;3:118. doi: 10.1002/pro.5560030115. [DOI] [PMC free article] [PubMed] [Google Scholar]
- 215.Kim C-Y, Whittington DA, Chang JS, Liao J, May JA, Christianson DW. J Med Chem. 2002;45:888. doi: 10.1021/jm010163d. [DOI] [PubMed] [Google Scholar]
- 216.Recacha R, Costanzo MJ, Maryanoff BE, Chattopadhyay D. Biochem J. 2002;361:437. doi: 10.1042/0264-6021:3610437. [DOI] [PMC free article] [PubMed] [Google Scholar]
- 217.Lloyd MD, Pederick RL, Natesh R, Woo LWL, Purohit A, Reed MJ, Acharya KR, Potter BVL. Biochem J. 2005;385:715. doi: 10.1042/BJ20041037. [DOI] [PMC free article] [PubMed] [Google Scholar]
- 218.Lloyd MD, Thiyagarajan N, Ho YT, Woo LWL, Sutcliffe OB, Purohit A, Reed MJ, Acharya KR, Potter BVL. Biochemistry. 2005;44:6858. doi: 10.1021/bi047692e. [DOI] [PubMed] [Google Scholar]
- 219.Grüneberg S, Stubbs MT, Klebe G. J Med Chem. 2002;45:3588. doi: 10.1021/jm011112j. [DOI] [PubMed] [Google Scholar]
- 220.Temperini C, Innocenti A, Scozzafava A, Supuran CT. Bioorg Med Chem Lett. 2006;16:4316. doi: 10.1016/j.bmcl.2006.05.068. [DOI] [PubMed] [Google Scholar]
- 221.Guerri A, Briganti F, Scozzafava A, Supuran CT, Mangani S. Biochemistry. 2000;39:12391. doi: 10.1021/bi000937c. [DOI] [PubMed] [Google Scholar]
- 222.Mangani S, Liljas A. J Mol Biol. 1993;232:9. doi: 10.1006/jmbi.1993.1365. [DOI] [PubMed] [Google Scholar]
- 223.Kannan KK. Biomol Struct, Conform, Funct, Evol, Proc Int Symp. 1981;1:165. [Google Scholar]
- 224.Stams T, Nair SK, Okuyama T, Waheed A, Sly WS, Christianson DW. Proc Natl Acad Sci USA. 1996;93:13589. doi: 10.1073/pnas.93.24.13589. [DOI] [PMC free article] [PubMed] [Google Scholar]
- 225.Temperini C, Innocenti A, Guerri A, Scozzafava A, Rusconi S, Supuran CT. Bioorg Med Chem Lett. 2007;17:2210. doi: 10.1016/j.bmcl.2007.01.113. [DOI] [PubMed] [Google Scholar]
- 226.Temperini C, Innocenti A, Scozzafava A, Mastrolorenzo A, Supuran CT. Bioorg Med Chem Lett. 2007;17:628. doi: 10.1016/j.bmcl.2006.11.027. [DOI] [PubMed] [Google Scholar]
- 227.Temperini C, Winum J-Y, Montero J-L, Scozzafava A, Supuran CT. Bioorg Med Chem Lett. 2007;17:2795. doi: 10.1016/j.bmcl.2007.02.068. [DOI] [PubMed] [Google Scholar]
- 228.Abbate F, Supuran CT, Scozzafava A, Orioli P, Stubbs MT, Klebe G. J Med Chem. 2002;45:3583. doi: 10.1021/jm011131t. [DOI] [PubMed] [Google Scholar]
- 229.Abbate J, Casini A, Owa T, Scozzafava A, Supuran CT. Bioorg Med Chem Lett. 2004;14:217. doi: 10.1016/j.bmcl.2003.09.062. [DOI] [PubMed] [Google Scholar]
- 230.Abbate J, Winum J-Y, Potter BVL, Casini A, Montero J-L, Scozzafava A, Supuran CT. Bioorg Med Chem Lett. 2004;14:231. doi: 10.1016/j.bmcl.2003.09.064. [DOI] [PubMed] [Google Scholar]
- 231.De Simone G, Di Fiore A, Menchise V, Pedone C, Antel J, Casini A, Scozzafava A, Wurl M, Supuran CT. Bioorg Med Chem Lett. 2005;15:2315. doi: 10.1016/j.bmcl.2005.03.032. [DOI] [PubMed] [Google Scholar]
- 232.Winum J-Y, Temperini C, Cheikh KE, Innocenti A, Vullo D, Ciattini S, Montero J-L, Scozzafava A, Supuran CT. J Med Chem. 2006;49:7024. doi: 10.1021/jm060807n. [DOI] [PubMed] [Google Scholar]
- 233.Casini A, Antel J, Abbate F, Scozzafava A, David S, Waldeck H, Schafer S, Supuran CT. Bioorg Med Chem Lett. 2003;13:841. doi: 10.1016/s0960-894x(03)00029-5. [DOI] [PubMed] [Google Scholar]
- 234.Srivastava DK, Jude KM, Banerjee AL, Haldar M, Manokaran S, Kooren J, Mallik S, Christianson DW. J Am Chem Soc. 2007;129:5528. doi: 10.1021/ja068359w. [DOI] [PMC free article] [PubMed] [Google Scholar]
- 235.Di Fiore A, Scozzafava A, Winum J-Y, Montero J-L, Pedone C, Supuran CT, De Simone G. Bioorg Med Chem Lett. 2007;17:1726. doi: 10.1016/j.bmcl.2006.12.099. [DOI] [PubMed] [Google Scholar]
- 236.Alterio V, De Simone G, Monti SM, Scozzafava A, Supuran CT. Bioorg Med Chem Lett. 2007;17:4201. doi: 10.1016/j.bmcl.2007.05.045. [DOI] [PubMed] [Google Scholar]
- 237.Köhler K, Hillebrecht A, Wischeler JS, Innocenti A, Heine A, Supuran CT, Klebe G. Angew Chem, Int Ed. 2007;46:7697. doi: 10.1002/anie.200701189. [DOI] [PubMed] [Google Scholar]
- 238.Temperini C, Innocenti A, Mastrolorenzo A, Scozzafava A, Supuran CT. Bioorg Med Chem Lett. 2007;17:4866. doi: 10.1016/j.bmcl.2007.06.044. [DOI] [PubMed] [Google Scholar]
- 239.Kannan KK, Ramanadham M, Jones TA. Ann N Y Acad Sci. 1984;429:49. doi: 10.1111/j.1749-6632.1984.tb12314.x. [DOI] [PubMed] [Google Scholar]
- 240.Eriksson AE, Jones TA, Liljas A. Proteins: Struct, Funct, Genet. 1988;4:274. doi: 10.1002/prot.340040406. [DOI] [PubMed] [Google Scholar]
- 241.Budayova-Spano M, Fisher SZ, Dauvergne MT, Agbandje-McKenna M, Silverman DN, Myles DAA, McKenna R. Acta Crystallogr, Sect F. 2006;F62:6. doi: 10.1107/S1744309105038248. [DOI] [PMC free article] [PubMed] [Google Scholar]
- 242.Duda DM, Tu C, Fisher SZ, An H, Yoshioka C, Govindasamy L, Laipis PJ, Agbandje-McKenna M, Silverman DN, McKenna R. Biochemistry. 2005;44:10046. doi: 10.1021/bi050610h. [DOI] [PubMed] [Google Scholar]
- 243.Ippolito JA, Baird TT, Jr, McGee SA, Christianson DW, Fierke CA. Proc Natl Acad Sci USA. 1995;92:5017. doi: 10.1073/pnas.92.11.5017. [DOI] [PMC free article] [PubMed] [Google Scholar]
- 244.Ippolito JA, Christianson DW. Biochemistry. 1993;32:9901. doi: 10.1021/bi00089a005. [DOI] [PubMed] [Google Scholar]
- 245.Ippolito JA, Christianson DW. Biochemistry. 1994;33:15241. [PubMed] [Google Scholar]
- 246.Kiefer LL, Ippolito JA, Fierke CA, Christianson DW. J Am Chem Soc. 1993;115:12581. [Google Scholar]
- 247.Xue Y, Liljas A, Jonsson BH, Lindskog S. Proteins: Struct, Funct, Genet. 1993;17:93. doi: 10.1002/prot.340170112. [DOI] [PubMed] [Google Scholar]
- 248.Lesburg CA, Christianson DW. J Am Chem Soc. 1995;117:6838. [Google Scholar]
- 249.Kim C-Y, Chandra PP, Jain A, Christianson DW. J Am Chem Soc. 2001;123:9620. doi: 10.1021/ja011034p. [DOI] [PubMed] [Google Scholar]
- 250.Alexander RS, Kiefer LL, Fierke CA, Christianson DW. Biochemistry. 1993;32:1510. doi: 10.1021/bi00057a015. [DOI] [PubMed] [Google Scholar]
- 251.Cox JD, Hunt JA, Compher KM, Fierke CA, Christianson DW. Biochemistry. 2000;39:13687. doi: 10.1021/bi001649j. [DOI] [PubMed] [Google Scholar]
- 252.Huang C-c, Lesburg CA, Kiefer LL, Fierke CA, Christianson DW. Biochemistry. 1996;35:3439. doi: 10.1021/bi9526692. [DOI] [PubMed] [Google Scholar]
- 253.Nair SK, Christianson DW. Biochemistry. 1993;32:4506. doi: 10.1021/bi00068a005. [DOI] [PubMed] [Google Scholar]
- 254.Nair SK, Krebs JF, Christianson DW, Fierke CA. Biochemistry. 1995;34:3981. doi: 10.1021/bi00012a016. [DOI] [PubMed] [Google Scholar]
- 255.Tweedy NB, Nair SK, Paterno SA, Fierke CA, Christianson DW. Biochemistry. 1993;32:10944. doi: 10.1021/bi00092a003. [DOI] [PubMed] [Google Scholar]
- 256.Xue Y, Vidgren J, Svensson LA, Liljas A, Jonsson BH, Lindskog S. Proteins: Struct, Funct, Genet. 1993;15:80. doi: 10.1002/prot.340150110. [DOI] [PubMed] [Google Scholar]
- 257.Krebs JF, Fierke CA, Alexander RS, Christianson DW. Biochemistry. 1991;30:9153. doi: 10.1021/bi00102a005. [DOI] [PubMed] [Google Scholar]
- 258.Huang S, Sjoblom B, Sauer-Eriksson AE, Jonsson B-H. Biochemistry. 2002;41:7628. doi: 10.1021/bi020053o. [DOI] [PubMed] [Google Scholar]
- 259.Lesburg CA, Huang C-c, Christianson DW, Fierke CA. Biochemistry. 1997;36:15780. doi: 10.1021/bi971296x. [DOI] [PubMed] [Google Scholar]
- 260.Duda D, Tu C, Qian M, Laipis P, Agbandje-McKenna M, Silverman DN, McKenna R. Biochemistry. 2001;40:1741. doi: 10.1021/bi002295z. [DOI] [PubMed] [Google Scholar]
- 261.Duda DM, Govindasamy L, Agbandje-McKenna M, Tu CK, Silverman DN, McKenna R. Acta Crystallogr, Sect D. 2003;D59:93. doi: 10.1107/s0907444902019455. [DOI] [PubMed] [Google Scholar]
- 262.Tu C, Qian M, An H, Wadhwa Nina R, Duda D, Yoshioka C, Pathak Y, McKenna R, Laipis Philip J, Silverman David N. J Biol Chem. 2002;277:38870. doi: 10.1074/jbc.M205791200. [DOI] [PubMed] [Google Scholar]
- 263.Bhatt D, Tu C, Fisher SZ, Prada JAH, McKenna R, Silverman DN. Proteins: Struct, Funct, Bioinf. 2005;61:239. doi: 10.1002/prot.20615. [DOI] [PubMed] [Google Scholar]
- 264.Scolnick LR, Christianson DW. Biochemistry. 1996;35:16429. doi: 10.1021/bi9617872. [DOI] [PubMed] [Google Scholar]
- 265.Ferraroni M, Tilli S, Briganti F, Chegwidden WR, Supuran Claudiu T, Wiebauer Karin E, Tashian Richard E, Scozzafava A. Biochemistry. 2002;41:6237. doi: 10.1021/bi0120446. [DOI] [PubMed] [Google Scholar]
- 266.Fisher SZ, Tu C, Bhatt D, Govindasamy L, Agbandje-McKenna M, McKenna R, Silverman DN. Biochemistry. 2007;46:3803. doi: 10.1021/bi602620k. [DOI] [PubMed] [Google Scholar]
- 267.Bhatt D, Fisher SZ, Tu C, McKenna R, Silverman DN. Biophys J. 2007;92:562. doi: 10.1529/biophysj.106.093203. [DOI] [PMC free article] [PubMed] [Google Scholar]
- 268.Elder I, Fisher Z, Laipis PJ, Tu C, McKenna R, Silverman DN. Proteins: Struct, Funct, Bioinf. 2007;68:337. doi: 10.1002/prot.21403. [DOI] [PubMed] [Google Scholar]
- 269.Kiefer LL, Paternao SA, Fierke CA. J Am Chem Soc. 1995;117:6831. [Google Scholar]
- 270.Culf AS, Gerig JT, Williams PG. J Biomol NMR. 1997;10:293. doi: 10.1023/a:1018358101811. [DOI] [PubMed] [Google Scholar]
- 271.Gerig JT, Moses JM. J Chem Soc, Chem Commun. 1987:482. [Google Scholar]
- 272.Jarvet J, Olivson A, Mets U, Pooga M, Aguraiuja R, Lippmaa E. Eur J Biochem. 1989;186:287. doi: 10.1111/j.1432-1033.1989.tb15207.x. [DOI] [PubMed] [Google Scholar]
- 273.Veenstra DL, Gerig JT. Magn Reson Chem. 1998;36:S169. [Google Scholar]
- 274.Dugad LB, Cooley CR, Gerig JT. Biochemistry. 1989;28:3955. doi: 10.1021/bi00435a049. [DOI] [PubMed] [Google Scholar]
- 275.Dugad LB, Gerig JT. Biochemistry. 1988;27:4310. doi: 10.1021/bi00412a018. [DOI] [PubMed] [Google Scholar]
- 276.Kanamori K, Roberts JD. Biochemistry. 1983;22:2658. doi: 10.1021/bi00280a011. [DOI] [PubMed] [Google Scholar]
- 277.Blackburn GM, Mann BE, Taylor BF, Worrall AF. Eur J Biochem. 1985;153:553. doi: 10.1111/j.1432-1033.1985.tb09336.x. [DOI] [PubMed] [Google Scholar]
- 278.Luy B. Angew Chem, Int Ed. 2007;46:4214. doi: 10.1002/anie.200701093. [DOI] [PubMed] [Google Scholar]
- 279.Sprangers R, Kay LE. Nature. 2007;445:618. doi: 10.1038/nature05512. [DOI] [PubMed] [Google Scholar]
- 280.Venters RA, Farmer BT, II, Fierke CA, Spicer LD. J Mol Biol. 1996;264:1101. doi: 10.1006/jmbi.1996.0699. [DOI] [PubMed] [Google Scholar]
- 281.Sethson I, Edlund U, Holak TA, Ross A, Jonsson B-H. J Biomol NMR. 1996;8:417. doi: 10.1007/BF00228144. [DOI] [PubMed] [Google Scholar]
- 282.Guex N, Peitsch MC. Electrophoresis. 1997;18:2714. doi: 10.1002/elps.1150181505. [DOI] [PubMed] [Google Scholar]
- 283.Lindahl M, Vidgren J, Eriksson E, Habash J, Harrop S, Helliwell J, Liljas A, Lindeskog M, Walker N. In: Carbonic Anhydrase: From Biochemistry and Genetics to Physiology and Clinical Medicine. Botrè F, Gros G, Storey BT, editors. VCH; New York: 1991. [Google Scholar]
- 284.Jain A, Whitesides GM, Alexander RS, Christianson DW. J Med Chem. 1994;37:2100. doi: 10.1021/jm00039a023. [DOI] [PubMed] [Google Scholar]
- 285.Nair SK, Christianson DW. J Am Chem Soc. 1991;113:9455. [Google Scholar]
- 286.Kannan KK, Liljas A, Waara I, Bergsten PC, Lovgren S, Strandberg B, Bengtsson U, Carlbom U, Fridborg K, Jarup L, Petef M. Cold Spring Harbor Symp Quant Biol. 1971;36:221. doi: 10.1101/sqb.1972.036.01.030. [DOI] [PubMed] [Google Scholar]
- 287.Liljas A, Kannan KK, Bergsten PC, Waara I, Fridborg K, Strandberg B, Carlbom U, Jarup L, Lovgren S, Petef M. Nature New Biol. 1972;235:131. doi: 10.1038/newbio235131a0. [DOI] [PubMed] [Google Scholar]
- 288.Lindahl M, Liljas A, Habash J, Harrop S, Helliwell JR. Acta Crystallogr, Sect B. 1992;B48:281. [Google Scholar]
- 289.Christianson DW, Fierke CA. Acc Chem Res. 1996;29:331. [Google Scholar]
- 290.Lindskog S. In: Zinc Enzymes. Bertini I, Luchinat C, Maret W, Zeppezauer M, editors. Birkhäuser; Boston, MA: 1986. [Google Scholar]
- 291.Prabhananda BS, Rittger E, Grell E. Biophys Chem. 1987;26:217. doi: 10.1016/0301-4622(87)80024-8. [DOI] [PubMed] [Google Scholar]
- 292.Stein PJ, Merrill SP, Henkens RW. J Am Chem Soc. 1977;99:3194. doi: 10.1021/ja00451a070. [DOI] [PubMed] [Google Scholar]
- 293.Williams TJ, Henkens RW. Biochemistry. 1985;24:2459. doi: 10.1021/bi00331a010. [DOI] [PubMed] [Google Scholar]
- 294.Lindahl M, Svensson LA, Liljas A. Proteins: Struct, Funct, Genet. 1993;15:177. doi: 10.1002/prot.340150207. [DOI] [PubMed] [Google Scholar]
- 295.Vallee BL, Auld DS. Acc Chem Res. 1993;26:543. [Google Scholar]
- 296.Kernohan JC. Biochim Biophys Acta. 1964;81:346. [Google Scholar]
- 297.Coleman JE. J Biol Chem. 1967;242:5212. [PubMed] [Google Scholar]
- 298.Lipton AS, Heck RW, Ellis PD. J Am Chem Soc. 2004;126:4735. doi: 10.1021/ja0305609. [DOI] [PubMed] [Google Scholar]
- 299.Kernohan JC. Biochim Biophys Acta. 1965;96:304. [PubMed] [Google Scholar]
- 300.Lindskog S. J Biol Chem. 1963;238:945. [PubMed] [Google Scholar]
- 301.Lindskog S. Biochemistry. 1966;5:2641. doi: 10.1021/bi00872a023. [DOI] [PubMed] [Google Scholar]
- 302.Taylor PW, King RW, Burgen ASV. Biochemistry. 1970;9:3894. doi: 10.1021/bi00822a007. [DOI] [PubMed] [Google Scholar]
- 303.Liang Z, Xue Y, Behravan G, Jonsson B-H, Lindskog S. Eur J Biochem. 1993;211:821. doi: 10.1111/j.1432-1033.1993.tb17614.x. [DOI] [PubMed] [Google Scholar]
- 304.Kiefer LL, Fierke CA. Biochemistry. 1994;33:15233. doi: 10.1021/bi00255a003. [DOI] [PubMed] [Google Scholar]
- 305.Riccardi D, Cui Q. J Phys Chem A. 2007;111:5703. doi: 10.1021/jp070699w. [DOI] [PubMed] [Google Scholar]
- 306.Rogers JI, Mukherjee J, Khalifah RG. Biochemistry. 1987;26:5672. doi: 10.1021/bi00392a014. [DOI] [PubMed] [Google Scholar]
- 307.Lindskog S, Thorslund A. Eur J Biochem. 1968;3:453. doi: 10.1111/j.1432-1033.1967.tb19552.x. [DOI] [PubMed] [Google Scholar]
- 308.Deerfield DW, II, Carter CW, Jr, Pedersen LG. Int J Quantum Chem. 2001;83:150. [Google Scholar]
- 309.Hunt JB, Rhee M-J, Storm CB. Anal Biochem. 1977;79:614. doi: 10.1016/0003-2697(77)90444-4. [DOI] [PubMed] [Google Scholar]
- 310.Lindskog S, Malmström BG. J Biol Chem. 1962;237:1129. [PubMed] [Google Scholar]
- 311.Hunt JA, Ahmed M, Fierke CA. Biochemistry. 1999;38:9054. doi: 10.1021/bi9900166. [DOI] [PubMed] [Google Scholar]
- 312.Armstrong JM, Myers DV, Verpoorte JA, Edsall JT. J Biol Chem. 1966;241:5137. [PubMed] [Google Scholar]
- 313.Hunt JB, Neece SH, Schachman HK, Ginsburg A. J Biol Chem. 1984;259:14793. [PubMed] [Google Scholar]
- 314.Lindskog S, Nyman PO. Biochim Biophys Acta. 1964;85:462. doi: 10.1016/0926-6569(64)90310-4. [DOI] [PubMed] [Google Scholar]
- 315.Demille GR, Larlee K, Livesey DL, Mailer K. Chem Phys Lett. 1979;64:534. [Google Scholar]
- 316.Haydock C. Los Alamos National Laboratory, Preprint Archive, Physics. 2003:1. arXiv:physics/0302097. [Google Scholar]
- 317.McCall KA, Fierke CA. Anal Biochem. 2000;284:307. doi: 10.1006/abio.2000.4706. [DOI] [PubMed] [Google Scholar]
- 318.Led JJ, Neesgaard E. Biochemistry. 1987;26:183. doi: 10.1021/bi00375a026. [DOI] [PubMed] [Google Scholar]
- 319.Kannan KK, Fridborg K, Bergstén PC, Liljas A, Lövgren S, Petef M, Strandberg B, Waara I, Adler L, Falkbring SO, Göthe PO, Nyman PO. J Mol Biol. 1972;63:601. doi: 10.1016/0022-2836(72)90452-4. [DOI] [PubMed] [Google Scholar]
- 320.Yachandra V, Powers L, Spiro TG. J Am Chem Soc. 1983;105:6596. [Google Scholar]
- 321.Hunt JA, Fierke CA. J Biol Chem. 1997;272:20364. doi: 10.1074/jbc.272.33.20364. [DOI] [PubMed] [Google Scholar]
- 322.McCall KA, Fierke CA. Biochemistry. 2004;43:3979. doi: 10.1021/bi0498914. [DOI] [PubMed] [Google Scholar]
- 323.Fierke CA, Thompson RB. Biometals. 2001;14:205. doi: 10.1023/a:1012980628412. [DOI] [PubMed] [Google Scholar]
- 324.Thompson RB, Maliwal BP, Fierke CA. Anal Biochem. 1999;267:185. doi: 10.1006/abio.1998.2991. [DOI] [PubMed] [Google Scholar]
- 325.Thompson RB, Zeng H-H, Maliwal BP, Fierke CA. Proc SPIE-Int Soc Opt Eng. 2001;4252:12. [Google Scholar]
- 326.Hunt JA, Lesburg CA, Christianson DW, Thompson RB, Fierke CA. In: The Carbonic Anhydrases: New Horizons. Chegwidden WR, Carter ND, Edwards YH, editors. Vol. 90 Birkhäuser Verlag; Basel, Switzerland: 2000. [Google Scholar]
- 327.Zeng HH, Thompson RB, Maliwal BP, Fones GR, Moffett JW, Fierke CA. Anal Chem. 2003;75:6807. doi: 10.1021/ac0345401. [DOI] [PubMed] [Google Scholar]
- 328.Frederickson CJ, Giblin LJ, Krezel A, McAdoo DJ, Muelle RN, Zeng Y, Balaji RV, Masalha R, Thompson RB, Fierke CA, Sarvey JM, de Valdenebro M, Prough DS, Zornow MH. Exp Neurol. 2006;198:285. doi: 10.1016/j.expneurol.2005.08.030. [DOI] [PubMed] [Google Scholar]
- 329.Thompson RB, Peterson D, Mahoney W, Cramer M, Maliwal BP, Suh SW, Frederickson C, Fierke C, Herman P. J Neurosci Methods. 2002;118:63. doi: 10.1016/s0165-0270(02)00144-9. [DOI] [PubMed] [Google Scholar]
- 330.Thompson RB, Whetsell WO, Jr, Maliwal BP, Fierke CA, Frederickson CJ. J Neurosci Methods. 2000;96:35. doi: 10.1016/s0165-0270(99)00183-1. [DOI] [PubMed] [Google Scholar]
- 331.Kimura E, Shiota T, Koike T, Shiro M, Kodama M. J Am Chem Soc. 1990;112:5805. [Google Scholar]
- 332.Kiefer LL, Krebs JF, Paterno SA, Fierke CA. Biochemistry. 1993;32:9896. doi: 10.1021/bi00089a004. [DOI] [PubMed] [Google Scholar]
- 333.Parkin G. Adv Inorg Chem. 1995:42. [Google Scholar]
- 334.Vahrenkamp H. Acc Chem Res. 1999;32:589. [Google Scholar]
- 335.Kimura E. Acc Chem Res. 2001;34:171. doi: 10.1021/ar000001w. [DOI] [PubMed] [Google Scholar]
- 336.Parkin G. Chem Rev. 2004;104:699. doi: 10.1021/cr0206263. [DOI] [PubMed] [Google Scholar]
- 337.Alsfasser R, Powell AK, Vahrenkamp H. Angew Chem, Int Ed Engl. 1990;29:898. [Google Scholar]
- 338.Alsfasser R, Ruf M, Trofimenko S, Vahrenkamp H. Chem Ber. 1993;126:703. [Google Scholar]
- 339.Alsfasser R, Trofimenko S, Looney A, Parkin G, Vahrenkamp H. Inorg Chem. 1991;30:4098. [Google Scholar]
- 340.Looney A, Parkin G, Alsfasser R, Ruf M, Vahrenkamp H. Angew Chem, Int Ed Engl. 1992;31:92. [Google Scholar]
- 341.Looney A, Saleh A, Zhang Y, Parkin G. Inorg Chem. 1994;33:1158. [Google Scholar]
- 342.Rombach M, Maurer C, Weis K, Keller E, Vahrenkamp H. Chem– Eur J. 1999;5:1013. [Google Scholar]
- 343.The value of pKa was determined potentiometrically in water/methanol/dichloromethane using suitable electrodes and referencing procedures.
- 344.Ruf M, Vahrenkamp H. Chem Ber. 1996;129:1025. [Google Scholar]
- 345.Ruf M, Weis K, Vahrenkamp H. J Chem Soc, Chem Commun. 1994:135. [Google Scholar]
- 346.Looney A, Han R, McNeill K, Parkin G. J Am Chem Soc. 1993;115:4690. [Google Scholar]
- 347.Bergquist C, Fillebeen T, Morlok MM, Parkin G. J Am Chem Soc. 2003;125:6189. doi: 10.1021/ja034711j. [DOI] [PubMed] [Google Scholar]
- 348.Bergquist C, Parkin G. J Am Chem Soc. 1999;121:6322. [Google Scholar]
- 349.Sprigings TG, Hall CD. J Chem Soc, Perkin Trans 2. 2001:2063. [Google Scholar]
- 350.Koike T, Kimura E, Nakamura I, Hashimoto Y, Shiro M. J Am Chem Soc. 1992;114:7338. [Google Scholar]
- 351.Zhang XP, Vaneldik R, Koike T, Kimura E. Inorg Chem. 1993;32:5749. [Google Scholar]
- 352.Wade WS, Koh JS, Han N, Hoekstra DM, Lerner RA. J Am Chem Soc. 1993;115:4449. [Google Scholar]
- 353.Roberts VA, Iverson BL, Iverson SA, Benkovic SJ, Lerner RA, Getzoff ED, Tainer JA. Proc Natl Acad Sci USA. 1990;87:6654. doi: 10.1073/pnas.87.17.6654. [DOI] [PMC free article] [PubMed] [Google Scholar]
- 354.Iverson BL, Iverson SA, Roberts VA, Getzoff ED, Tainer JA, Benkovic SJ, Lerner RA. Science. 1990;249:659. doi: 10.1126/science.2116666. [DOI] [PubMed] [Google Scholar]
- 355.Mueller HN, Skerra A. Biochemistry. 1994;33:14126. doi: 10.1021/bi00251a023. [DOI] [PubMed] [Google Scholar]
- 356.Verpoorte JA, Mehta S, Edsall JT. J Biol Chem. 1967;242:4221. [PubMed] [Google Scholar]
- 357.Henry RP. In: The Carbonic Anhydrases: Cellular Physiology and Molecular Genetics. Carter ND, Dodgson SJ, Gros G, Tashian RE, editors. Plenum Press; New York: 1991. [Google Scholar]
- 358.Klocke RA. J Appl Physiol. 1976;40:707. doi: 10.1152/jappl.1976.40.5.707. [DOI] [PubMed] [Google Scholar]
- 359.Sirs JA. Trans Faraday Soc. 1958;54:207. [Google Scholar]
- 360.Rossi-Bernardi L, Berger RL. J Biol Chem. 1968;243:1297. [PubMed] [Google Scholar]
- 361.Silverman DN. Methods Enzymol. 1982;87:732. doi: 10.1016/s0076-6879(82)87037-7. [DOI] [PubMed] [Google Scholar]
- 362.Karler R, Woodbury DM. Anal Biochem. 1963;6:381. doi: 10.1016/0003-2697(63)90091-5. [DOI] [PubMed] [Google Scholar]
- 363.Forster RE, Constantine HP, Craw MR, Rotman HH, Klocke RA, Thyrum D. J Biol Chem. 1968;243:3317. [PubMed] [Google Scholar]
- 364.Gibbons BH, Edsall JT. J Biol Chem. 1964;239:2539. [PubMed] [Google Scholar]
- 365.Kernohan JC, Roughton FJW. J Physiol. 1968;197:345. doi: 10.1113/jphysiol.1968.sp008563. [DOI] [PMC free article] [PubMed] [Google Scholar]
- 366.Kernohan JC. Biochem J. 1970;120:26P. doi: 10.1042/bj1200026p. [DOI] [PMC free article] [PubMed] [Google Scholar]
- 367.Finazzi Agrò A, Morpurgo L, Mondovi B. Biophys Chem. 1974;2:151. doi: 10.1016/0301-4622(74)80035-9. [DOI] [PubMed] [Google Scholar]
- 368.Chen RF, Kernohan JC. J Biol Chem. 1967;242:5813. [PubMed] [Google Scholar]
- 369.Mårtensson L-G, Jonasson P, Freskgård P-O, Svensson M, Carlsson U, Jonsson B-H. Biochemisty. 1995;34:1011. doi: 10.1021/bi00003a036. [DOI] [PubMed] [Google Scholar]
- 370.Galley WC, Strambini GB. Nature. 1976;261:521. doi: 10.1038/261521a0. [DOI] [PubMed] [Google Scholar]
- 371.Galley WC, Stryer L. Proc Natl Acad Sci USA. 1968;60:108. doi: 10.1073/pnas.60.1.108. [DOI] [PMC free article] [PubMed] [Google Scholar]
- 372.Bazin M, Aubailly M, Santus R. Chem Phys Lett. 1972;13:310. [Google Scholar]
- 373.Parkkila A-K, Parkkila S, Serlo W, Reunanen M, Vierjoki T, Rajaniemi H. Clin Chim Acta. 1994;230:81. doi: 10.1016/0009-8981(94)90091-4. [DOI] [PubMed] [Google Scholar]
- 374.Vuori J, Rasi S, Takala T, Vaananen K. Clin Chem. 1991;37:2087. [PubMed] [Google Scholar]
- 375.Viappiani C. Biophys Chem. 1994;50:293. [Google Scholar]
- 376.Banerjee J, Haldar MK, Manokaran S, Mallik S, Srivastava DK. Chem Commun. 2007:2723. doi: 10.1039/b701421j. [DOI] [PubMed] [Google Scholar]
- 377.Jain A, Huang SG, Whitesides GM. J Am Chem Soc. 1994;116:5057. [Google Scholar]
- 378.Ponticello GS, Freedman MB, Habecker CN, Lyle PA, Schwam H, Varga SL, Christy ME, Randall WC, Baldwin JJ. J Med Chem. 1987;30:591. doi: 10.1021/jm00387a002. [DOI] [PubMed] [Google Scholar]
- 379.Thompson RB, Maliwal BP. Anal Chem. 1998;70:1749. doi: 10.1021/ac971199+. [DOI] [PubMed] [Google Scholar]
- 380.Enander K, Dolphin GT, Andersson LK, Liedberg B, Lundström I, Baltzer L. J Org Chem. 2002;67:3120. doi: 10.1021/jo010954n. [DOI] [PubMed] [Google Scholar]
- 381.Enander K, Dolphin GT, Baltzer L. J Am Chem Soc. 2004;126:4464. doi: 10.1021/ja038799c. [DOI] [PubMed] [Google Scholar]
- 382.Bozym RA, Thompson RB, Stoddard AK, Fierke CA. ACS Chem Biol. 2006;1:103. doi: 10.1021/cb500043a. [DOI] [PubMed] [Google Scholar]
- 383.Lespagnol A, Osteux R, Bar D. Bull Soc Chim Biol. 1961;43:789. [PubMed] [Google Scholar]
- 384.Nguyen R, Huc I. Angew Chem, Int Ed. 2001;40:1774. [PubMed] [Google Scholar]
- 385.Kaim JT, Brodsky WA. Am J Physiol. 1959;197:1097. doi: 10.1152/ajplegacy.1959.197.5.1097. [DOI] [PubMed] [Google Scholar]
- 386.Philpot FJ, Philpot JSL. Biochem J. 1936;30:2191. doi: 10.1042/bj0302191. [DOI] [PMC free article] [PubMed] [Google Scholar]
- 387.Brinkman R. J Physiol. 1933;80:170. doi: 10.1113/jphysiol.1933.sp003079. [DOI] [PMC free article] [PubMed] [Google Scholar]
- 388.Wilson JM, Tanko Q, Wendland MM, Meany JE, Nedved JF, Pocker Y. Physiol Chem Phys Med NMR. 1998;30:149. [PubMed] [Google Scholar]
- 389.King RW, Burgen ASV. Proc R Soc London, B. 1976;193:107. doi: 10.1098/rspb.1976.0034. [DOI] [PubMed] [Google Scholar]
- 390.King RW, Burgen ASV. Biochim Biophys Acta. 1970;207:278. doi: 10.1016/0005-2795(70)90020-6. [DOI] [PubMed] [Google Scholar]
- 391.Chu YH, Avila LZ, Biebuyck HA, Whitesides GM. J Med Chem. 1992;35:2915. doi: 10.1021/jm00093a027. [DOI] [PubMed] [Google Scholar]
- 392.Avila LZ, Chu Y-H, Blossey EC, Whitesides GM. J Med Chem. 1993;36:126. doi: 10.1021/jm00053a016. [DOI] [PubMed] [Google Scholar]
- 393.Gomez FA, Avila LZ, Chu Y-H, Whitesides GM. Anal Chem. 1994;66:1785. doi: 10.1021/ac00083a003. [DOI] [PubMed] [Google Scholar]
- 394.Chu Y-H, Avila LZ, Gao J, Whitesides GM. Acc Chem Res. 1995;28:461. [Google Scholar]
- 395.Grossman PD. Capillary Electrophoresis: Theory and Practice. Academic Press, Inc; San Diego, CA: 1992. [Google Scholar]
- 396.Gao J, Mammen M, Whitesides GM. Science. 1996;272:535. doi: 10.1126/science.272.5261.535. [DOI] [PubMed] [Google Scholar]
- 397.Gitlin I, Carbeck JD, Whitesides GM. Angew Chem, Int Ed. 2006;45:3022. doi: 10.1002/anie.200502530. [DOI] [PubMed] [Google Scholar]
- 398.Colton IJ, Carbeck JD, Rao J, Whitesides GM. Electrophoresis. 1998;19:367. doi: 10.1002/elps.1150190303. [DOI] [PubMed] [Google Scholar]
- 399.Chu Y-H, Chen JK, Whitesides GM. Anal Chem. 1993;65:1314. doi: 10.1021/ac00058a004. [DOI] [PubMed] [Google Scholar]
- 400.Biltonen RL, Langerman N. Methods Enzymol. 1979;61:287. doi: 10.1016/0076-6879(79)61016-9. [DOI] [PubMed] [Google Scholar]
- 401.Sturtevant JM. Methods Enzymol. 1972;26:227. doi: 10.1016/s0076-6879(72)26013-x. [DOI] [PubMed] [Google Scholar]
- 402.Talhout R, Villa A, Mark AE, Engberts JBFN. J Am Chem Soc. 2003;125:10570. doi: 10.1021/ja034676g. [DOI] [PubMed] [Google Scholar]
- 403.Williams DH, Stephens E, O’Brien DP, Zhou M. Angew Chem, Int Ed. 2004;43:6596. doi: 10.1002/anie.200300644. [DOI] [PubMed] [Google Scholar]
- 404.Henkens RW, Watt GD, Sturtevant JM. Biochemistry. 1969;8:1874. doi: 10.1021/bi00833a015. [DOI] [PubMed] [Google Scholar]
- 405.Binford JS, Lindskog S, Wadsö I. Biochim Biophys Acta. 1974;341:345. doi: 10.1016/0005-2744(74)90227-7. [DOI] [PubMed] [Google Scholar]
- 406.Jelesarov I, Bosshard HR. J Mol Recognit. 1999;12:3. doi: 10.1002/(SICI)1099-1352(199901/02)12:1<3::AID-JMR441>3.0.CO;2-6. [DOI] [PubMed] [Google Scholar]
- 407.Bhakuni V. Arch Biochem Biophys. 1998;357:274. doi: 10.1006/abbi.1998.0794. [DOI] [PubMed] [Google Scholar]
- 408.Wiseman T, Williston S, Brandts JF, Lin L-N. Anal Biochem. 1989;179:131. doi: 10.1016/0003-2697(89)90213-3. [DOI] [PubMed] [Google Scholar]
- 409.Khalifah RG, Zhang F, Parr JS, Rowe ES. Biochemistry. 1993;32:3058. doi: 10.1021/bi00063a017. [DOI] [PubMed] [Google Scholar]
- 410.Pierce MM, Raman CS, Nall BT. Methods. 1999;19:213. doi: 10.1006/meth.1999.0852. [DOI] [PubMed] [Google Scholar]
- 411.DiTusa CA, Christensen T, McCall KA, Fierke CA, Toone EJ. Biochemistry. 2001;40:5338. doi: 10.1021/bi001731e. [DOI] [PubMed] [Google Scholar]
- 412.Day YSN, Baird CL, Rich RL, Myszka DG. Protein Sci. 2002;11:1017. doi: 10.1110/ps.4330102. [DOI] [PMC free article] [PubMed] [Google Scholar]
- 413.Franchi M, Vullo D, Gallori E, Antel J, Wurl M, Scozzafava A, Supuran CT. Bioorg Med Chem Lett. 2003;13:2857. doi: 10.1016/s0960-894x(03)00581-x. [DOI] [PubMed] [Google Scholar]
- 414.Melkko S, Scheuermann J, Dumelin CE, Neri D. Nature Biotechnol. 2004;22:568. doi: 10.1038/nbt961. [DOI] [PubMed] [Google Scholar]
- 415.Krishnamurthy VM, Bohall BR, Semetey V, Whitesides GM. J Am Chem Soc. 2006;128:5802. doi: 10.1021/ja060070r. [DOI] [PMC free article] [PubMed] [Google Scholar]
- 416.Krishnamurthy VM, Estroff LA, Whitesides GM. In: Fragment-based Approaches in Drug Discovery. Erlanson D, Jahnke W, editors. Vol. 34 Wiley-VCH; Weinheim, Germany: 2006. [Google Scholar]
- 417.Matulis D, Todd M. In: Biocalorimetry 2: Applications of Calorimetry in the Biological Sciences. 2. Ladbury JE, Doyle ML, editors. John Wiley & Sons; New York: 2004. [Google Scholar]
- 418.Jain A, Marzluff EM, Jacobsen JR, Whitesides GM, Grabowski JJ. J Chem Soc, Chem Commun. 1989:1557. [Google Scholar]
- 419.Carey PR, King RW. Biochemistry. 1979;18:2834. doi: 10.1021/bi00580a024. [DOI] [PubMed] [Google Scholar]
- 420.Moratal JM, Martinez-Ferrer MJ, Jimenez HR, Donaire A, Castells J, Salgado J. J Inorg Biochem. 1992;45:231. doi: 10.1016/0162-0134(92)84012-c. [DOI] [PubMed] [Google Scholar]
- 421.Moratal JM, Martinez-Ferrer MJ, Donaire A, Castells J, Salgado J, Jimenez HR. J Chem Soc, Dalton Trans. 1991:3393. [Google Scholar]
- 422.Anelli PL, Bertini I, Fragai M, Lattuada L, Luchinat C, Parigi G. Eur J Inorg Chem. 2000;2000:625. [Google Scholar]
- 423.Cleland JL, Hedgepeth C, Wang DIC. J Biol Chem. 1992;267:13327. [PubMed] [Google Scholar]
- 424.Hower JF, Henkens RW, Chesnut DB. J Am Chem Soc. 1971;93:6665. doi: 10.1021/ja00753a055. [DOI] [PubMed] [Google Scholar]
- 425.Taylor JS, Mushak P, Coleman JE. Proc Natl Acad Sci USA. 1970;67:1410. doi: 10.1073/pnas.67.3.1410. [DOI] [PMC free article] [PubMed] [Google Scholar]
- 426.Bayley P, Anson M. Biochem Biophys Res Commun. 1975;62:717. doi: 10.1016/0006-291x(75)90458-1. [DOI] [PubMed] [Google Scholar]
- 427.Gianazza E, Sirtori CR, Castiglioni S, Eberini I, Chrambach A, Rondanini A, Vecchio G. Electrophoresis. 2000;21:1435. doi: 10.1002/(SICI)1522-2683(20000501)21:8<1435::AID-ELPS1435>3.0.CO;2-E. [DOI] [PubMed] [Google Scholar]
- 428.Berova N, Nakanishi K, Woody RW. Circular Dichroism. 2. Wiley-VCH; New York: 2000. [Google Scholar]
- 429.Freskgård P-O, Mårtensson L-G, Jonasson P, Jonsson B-H, Carlsson U. Biochemistry. 1994;33:14281. doi: 10.1021/bi00251a041. [DOI] [PubMed] [Google Scholar]
- 430.Coleman JE. J Am Chem Soc. 1967;89:6757. doi: 10.1021/ja01001a064. [DOI] [PubMed] [Google Scholar]
- 431.Hofstadler SA, Sannes-Lowery KA. Nat Rev Drug Discovery. 2006;5:585. doi: 10.1038/nrd2083. [DOI] [PubMed] [Google Scholar]
- 432.Deng GJ, Sanyal G. J Pharm Biomed Anal. 2006;40:528. doi: 10.1016/j.jpba.2005.08.038. [DOI] [PubMed] [Google Scholar]
- 433.Nesatyy VJ. Int J Mass Spectrom. 2002;221:147. [Google Scholar]
- 434.Daniel JM, Friess SD, Rajagopalan S, Wendt S, Zenobi R. Int J Mass Spectrom. 2002;216:1. [Google Scholar]
- 435.Purcell AW, Gorman JJ. Mol Cell Proteomics. 2004;3:193. doi: 10.1074/mcp.R300013-MCP200. [DOI] [PubMed] [Google Scholar]
- 436.Naylor S, Kumar R. Adv Protein Chem. 2003;65:217. doi: 10.1016/s0065-3233(03)01021-0. [DOI] [PubMed] [Google Scholar]
- 437.Sickmann A, Mreyen M, Meyer HE. Adv Biochem Eng Biotechnol. 2003;83:141. doi: 10.1007/3-540-36459-5_6. [DOI] [PubMed] [Google Scholar]
- 438.Loo JA. Adv Protein Chem. 2003;65:25. doi: 10.1016/s0065-3233(03)01015-5. [DOI] [PubMed] [Google Scholar]
- 439.Karas M. GIT Lab J, Eur. 2003;7:259. [Google Scholar]
- 440.Aebersold R, Mann M. Nature. 2003;422:198. doi: 10.1038/nature01511. [DOI] [PubMed] [Google Scholar]
- 441.Trauger SA, Webb W, Siuzdak G. Spectroscopy. 2002;16:15. [Google Scholar]
- 442.Mann M, Hendrickson RC, Pandey A. Annu Rev Biochem. 2001;70:437. doi: 10.1146/annurev.biochem.70.1.437. [DOI] [PubMed] [Google Scholar]
- 443.Cheng X, Chen R, Bruce JE, Schwartz BL, Anderson GA, Hofstadler SA, Gale DC, Smith RD, Gao J, Sigal GB, Mammen M, Whitesides GM. J Am Chem Soc. 1995;117:8859. [Google Scholar]
- 444.Gao J, Cheng X, Chen R, Sigal GB, Bruce JE, Schwartz BL, Hofstadler SA, Anderson GA, Smith RD, Whitesides GM. J Med Chem. 1996;39:1949. doi: 10.1021/jm960013g. [DOI] [PubMed] [Google Scholar]
- 445.Wu Q, Gao J, Joseph-McCarthy D, Sigal GB, Bruce JE, Whitesides GM, Smith RD. J Am Chem Soc. 1997;119:1157. [Google Scholar]
- 446.Gao J, Wu Q, Carbeck J, Lei QP, Smith RD, Whitesides GM. Biophys J. 1999;76:3253. doi: 10.1016/s0006-3495(99)77477-1. [DOI] [PMC free article] [PubMed] [Google Scholar]
- 447.Kiese M. Biochem Z. 1941;307:400. [Google Scholar]
- 448.Roughton FJW, Booth VH. Biochem J. 1946;40:319. doi: 10.1042/bj0400319. [DOI] [PMC free article] [PubMed] [Google Scholar]
- 449.Roughton FJW, Booth VH. Biochem J. 1946;40:309. doi: 10.1042/bj0400309. [DOI] [PMC free article] [PubMed] [Google Scholar]
- 450.Davis RP. J Am Chem Soc. 1959;81:5674. [Google Scholar]
- 451.Davis RP. J Am Chem Soc. 1958;80:5209. [Google Scholar]
- 452.DeVoe H, Kistiakowsky GB. J Am Chem Soc. 1961;83:274. [Google Scholar]
- 453.Kernohan JC, Forrest WW, Roughton WFJ. Biochim Biophys Acta. 1963;67:31. doi: 10.1016/0006-3002(63)91794-3. [DOI] [PubMed] [Google Scholar]
- 454.Kernohan JC. Biochim Biophys Acta. 1966;118:405. doi: 10.1016/s0926-6593(66)80049-8. [DOI] [PubMed] [Google Scholar]
- 455.Pocker Y, Stone JT. J Am Chem Soc. 1965;87:5497. doi: 10.1021/ja00951a049. [DOI] [PubMed] [Google Scholar]
- 456.Pocker Y, Stone JT. Biochemistry. 1968;7:3021. doi: 10.1021/bi00849a001. [DOI] [PubMed] [Google Scholar]
- 457.Pocker Y, Storm DR. Biochemistry. 1968;7:1202. doi: 10.1021/bi00843a042. [DOI] [PubMed] [Google Scholar]
- 458.Taylor PW, King RW, Burgen ASV. Biochemistry. 1970;9:2638. doi: 10.1021/bi00815a012. [DOI] [PubMed] [Google Scholar]
- 459.Kretschmann E, Raether H. Z Naturforsch, A: Astrophys Phys Phys Chem. 1968;23:2135. [Google Scholar]
- 460.Ramsden JJ. J Mol Recognit. 1997;10:109. doi: 10.1002/(SICI)1099-1352(199705/06)10:3<109::AID-JMR361>3.0.CO;2-D. [DOI] [PubMed] [Google Scholar]
- 461.Fagerstarn LG, Frostell-Karlsson A, Karlsson R, Persson B, Ronnberg I. J Chromatogr. 1992;597:397. doi: 10.1016/0021-9673(92)80137-j. [DOI] [PubMed] [Google Scholar]
- 462.Chaiken I, Rose S, Karlsson R. Anal Biochem. 1991;201:197. doi: 10.1016/0003-2697(92)90329-6. [DOI] [PubMed] [Google Scholar]
- 463.Stenberg E, Persson B, Roos H, Urbaniczky C. J Colloid Interface Sci. 1991;143:513. [Google Scholar]
- 464.McDonnell JM. Curr Opin Chem Biol. 2001;5:572. doi: 10.1016/s1367-5931(00)00251-9. [DOI] [PubMed] [Google Scholar]
- 465.Myszka DG. Curr Opin Biotechnol. 1997;8:50. doi: 10.1016/s0958-1669(97)80157-7. [DOI] [PubMed] [Google Scholar]
- 466.Rich RL, Myszka DG. J Mol Recognit. 2003;16:351. doi: 10.1002/jmr.649. [DOI] [PubMed] [Google Scholar]
- 467.Mrksich M, Grunwell JR, Whitesides GM. J Am Chem Soc. 1995;117:12009. [Google Scholar]
- 468.Mrksich M, Sigal GB, Whitesides GM. Langmuir. 1995;11:4383. [Google Scholar]
- 469.Sigal GB, Bamdad C, Barberis A, Strominger J, Whitesides GM. Anal Chem. 1996;68:490. doi: 10.1021/ac9504023. [DOI] [PubMed] [Google Scholar]
- 470.Bishop AR, Nuzzo RG. Curr Opin Colloid Interface Sci. 1996;1:127. [Google Scholar]
- 471.Xia YN, Rogers JA, Paul KE, Whitesides GM. Chem Rev. 1999;99:1823. doi: 10.1021/cr980002q. [DOI] [PubMed] [Google Scholar]
- 472.Love JC, Wolfe DB, Haasch R, Chabinyc ML, Paul KE, Whitesides GM, Nuzzo RG. J Am Chem Soc. 2003;125:2597. doi: 10.1021/ja028692+. [DOI] [PubMed] [Google Scholar]
- 473.Jiang X, Bruzewicz DA, Thant MM, Whitesides GM. Anal Chem. 2004;76:6116. doi: 10.1021/ac049152t. [DOI] [PubMed] [Google Scholar]
- 474.Lahiri J, Isaacs L, Tien J, Whitesides GM. Anal Chem. 1999;71:777. doi: 10.1021/ac980959t. [DOI] [PubMed] [Google Scholar]
- 475.Bain CD, Troughton EB, Tao Y-T, Evall J, Whitesides GM, Nuzzo RG. J Am Chem Soc. 1989;111:321. [Google Scholar]
- 476.Laibinis PE, Bain CD, Nuzzo RG, Whitesides GM. J Phys Chem. 1995;99:7663. [Google Scholar]
- 477.Xia YN, Whitesides GM. Angew Chem, Int Ed Engl. 1998;37:551. doi: 10.1002/(SICI)1521-3773(19980316)37:5<550::AID-ANIE550>3.0.CO;2-G. [DOI] [PubMed] [Google Scholar]
- 478.Yan L, Marzolin C, Terfort A, Whitesides GM. Langmuir. 1997;13:6704. [Google Scholar]
- 479.Lahiri J, Ostuni E, Whitesides GM. Langmuir. 1999;15:2055. [Google Scholar]
- 480.Whitesides GM, Ostuni E, Takayama S, Jiang XY, Ingber DE. Annu Rev Biomed Eng. 2001;3:335. doi: 10.1146/annurev.bioeng.3.1.335. [DOI] [PubMed] [Google Scholar]
- 481.Mrksich M, Whitesides GM. Annu Rev Biophys Biomol Struct. 1996;25:55. doi: 10.1146/annurev.bb.25.060196.000415. [DOI] [PubMed] [Google Scholar]
- 482.Chapman RG, Ostuni E, Takayama S, Holmlin RE, Yan L, Whitesides GM. J Am Chem Soc. 2000;122:8303. [Google Scholar]
- 483.Chapman RG, Ostuni E, Yan L, Whitesides GM. Langmuir. 2000;16:6927. [Google Scholar]
- 484.Ostuni E, Chapman RG, Liang MN, Meluleni G, Peir G, Ingber DE, Whitesides GM. Langmuir. 2001;17:6336. [Google Scholar]
- 485.Ostuni E, Chapman RG, Holmlin RE, Takayama S, Whitesides GM. Langmuir. 2001;17:5605. doi: 10.1021/la0015258. [DOI] [PubMed] [Google Scholar]
- 486.Qian XP, Metallo SJ, Choi IS, Wu HK, Liang MN, Whitesides GM. Anal Chem. 2002;74:1805. doi: 10.1021/ac011042o. [DOI] [PubMed] [Google Scholar]
- 487.Mullett WM, Lai EPC, Yeung JM. Methods. 2000;22:77. doi: 10.1006/meth.2000.1039. [DOI] [PubMed] [Google Scholar]
- 488.Houseman BT, Mrksich M. Host-Guest Chemistry −/− Mimetic Approaches to Study Carbohydrate Recognition. 218/2001 Springer-Verlag; Berlin: 2002. [Google Scholar]
- 489.Cooper MA. Anal Bioanal Chem. 2003;377:834. doi: 10.1007/s00216-003-2111-y. [DOI] [PubMed] [Google Scholar]
- 490.Shumaker-Parry JS, Campbell CT. Anal Chem. 2004;76:907. doi: 10.1021/ac034962a. [DOI] [PubMed] [Google Scholar]
- 491.Marx KA. Biomacromolecules. 2003;4:1099. doi: 10.1021/bm020116i. [DOI] [PubMed] [Google Scholar]
- 492.Kato M, Mrksich M. J Am Chem Soc. 2004;126:6504. doi: 10.1021/ja039058e. [DOI] [PubMed] [Google Scholar]
- 493.Ostuni E, Grzybowski BA, Mrksich M, Roberts CS, Whitesides GM. Langmuir. 2003;19:1861. [Google Scholar]
- 494.Scozzafava A, Supuran CT. J Med Chem. 2002;45:284. doi: 10.1021/jm010958k. [DOI] [PubMed] [Google Scholar]
- 495.Bajaj S, Sambi SS, Madan AK. QSAR Comb Sci. 2004;23:431. [Google Scholar]
- 496.Ilies M, Banciu MD, Ilies MA, Scozzafava A, Caproiu MT, Supuran CT. J Med Chem. 2002;45:504. doi: 10.1021/jm011031n. [DOI] [PubMed] [Google Scholar]
- 497.Ilies M, Scozzafava A, Supuran CT. In: Carbonic Anhydrase: Its Inhibitors and Activators. Supuran CT, Scozzafava A, Conway J, editors. Vol. 1 CRC Press; Boca Raton, FL: 2004. [Google Scholar]
- 498.Supuran CT, Vullo D, Manole G, Casini A, Scozzafava A. Curr Med Chem: Cardiovasc Hematol Agents. 2004;2:49. [PubMed] [Google Scholar]
- 499.Supuran CT, Scozzafava A. Expert Opin Ther Patents. 2002;12:217. [Google Scholar]
- 500.Maren TH. Annu Rev Pharmacol Toxicol. 1976;16:309. doi: 10.1146/annurev.pa.16.040176.001521. [DOI] [PubMed] [Google Scholar]
- 501.Mansoor UF, Zhang X-R, Blackburn GM. In: The Carbonic Anhydrases: New Horizons. Chegwidden WR, Carter ND, Edwards YH, editors. Vol. 90 Birkhäuser Verlag; Basel, Switzerland: 2000. [Google Scholar]
- 502.Scozzafava A, Mastrolorenzo A, Supuran CT. Expert Opin Ther Patents. 2006;16:1627. doi: 10.1517/13543776.16.1.27. [DOI] [PubMed] [Google Scholar]
- 503.Kakeya N, Aoki M, Kamada A, Yata N. Chem Pharm Bull. 1969;17:1010. doi: 10.1248/cpb.17.1010. [DOI] [PubMed] [Google Scholar]
- 504.Lo YS, Nolan JC, Maren TH, Welstead WJ, Gripshover DF, Shamblee DA. J Med Chem. 1992;35:4790. doi: 10.1021/jm00104a003. [DOI] [PubMed] [Google Scholar]
- 505.Scholz TH, Sondey JM, Randall WC, Schwam H, Thompson WJ, Mallorga PJ, Sugrue MF, Graham SL. J Med Chem. 1993;36:2134. doi: 10.1021/jm00067a012. [DOI] [PubMed] [Google Scholar]
- 506.Burbaum JJ, Ohlmeyer MH, Reader JC, Henderson I, Dillard LW, Li G, Randle TL, Sigal NH, Chelsky D, Baldwin JJ. Proc Natl Acad Sci USA. 1995;92:6027. doi: 10.1073/pnas.92.13.6027. [DOI] [PMC free article] [PubMed] [Google Scholar]
- 507.Sigal GB, Whitesides GM. Bioorg Med Chem Lett. 1996;6:559. [Google Scholar]
- 508.Gao J, Qiao S, Whitesides GM. J Med Chem. 1995;38:2292. doi: 10.1021/jm00013a005. [DOI] [PubMed] [Google Scholar]
- 509.Hunt CA, Mallorga PJ, Michelson SR, Schwam H, Sondey JM, Smith RL, Sugrue MF, Shepard KL. J Med Chem. 1994;37:240. doi: 10.1021/jm00028a006. [DOI] [PubMed] [Google Scholar]
- 510.Winum J-Y, Casini A, Mincione F, Starnotti M, Montero J-L, Scozzafava A, Supuran CT. Bioorg Med Chem Lett. 2004;14:225. doi: 10.1016/j.bmcl.2003.09.063. [DOI] [PubMed] [Google Scholar]
- 511.Casini A, Scozzafava A, Mincione F, Menabuoni L, Starnotti M, Supuran CT. Bioorg Med Chem Lett. 2003;13:2867. doi: 10.1016/s0960-894x(03)00580-8. [DOI] [PubMed] [Google Scholar]
- 512.Graham SL, Hoffman JM, Gautheron P, Michelson SR, Scholz TH, Schwam H, Shepard KL, Smith AM, Smith RL, Sondey JM. J Med Chem. 1990;33:749. doi: 10.1021/jm00164a045. [DOI] [PubMed] [Google Scholar]
- 513.Prugh JD, Hartman GD, Mallorga PJ, McKeever BM, Michelson SR, Murcko MA, Schwam H, Smith RL, Sondey JM, Springer JP. J Med Chem. 1991;34:1805. doi: 10.1021/jm00110a008. [DOI] [PubMed] [Google Scholar]
- 514.Baldwin JJ, Ponticello GS, Anderson PS, Christy ME, Murcko MA, Randall WC, Schwam H, Sugrue MF, Gautheron P, et al. J Med Chem. 1989;32:2510. doi: 10.1021/jm00132a003. [DOI] [PubMed] [Google Scholar]
- 515.Doyon JB, Hansen EAM, Kim CY, Chang JS, Christianson DW, Madder RD, Voet JG, Baird TA, Fierke CA, Jain A. Org Lett. 2000;2:2557. doi: 10.1021/ol006193c. [DOI] [PubMed] [Google Scholar]
- 516.Doyon JB, Hansen EAM, Kim C-Y, Chang JS, Christianson DW, Madder RD, Voet JG, Baird TA, Fierke CA, Jain A. Org Lett. 2000;2:1189. doi: 10.1021/ol005608r. [DOI] [PubMed] [Google Scholar]
- 517.Hartman GD, Halczenko W, Smith RL, Sugrue MF, Mallorga PJ, Michelson SR, Randall WC, Schwam H, Sondey JM. J Med Chem. 1992;35:3822. doi: 10.1021/jm00099a010. [DOI] [PubMed] [Google Scholar]
- 518.Hartman GD, Halczenko W, Prugh JD, Smith RL, Sugrue MF, Mallorga P, Michelson SR, Randall WC, Schwam H, Sondey JM. J Med Chem. 1992;35:3027. doi: 10.1021/jm00094a016. [DOI] [PubMed] [Google Scholar]
- 519.Briganti F, Pierattelli A, Scozzafava A, Supuran CT. Eur J Med Chem. 1996;31:1001. [Google Scholar]
- 520.Fenesan I, Popescu R, Scozzafava A, Crucin V, Mateiciuc E, Bauer R, Ilies MA, Supuran CT. J Enzyme Inhib. 2000;15:297. doi: 10.3109/14756360009040690. [DOI] [PubMed] [Google Scholar]
- 521.Maren TH. Mol Pharmacol. 1992;41:419. [PubMed] [Google Scholar]
- 522.Mincione F, Menabuoni L, Briganti F, Mincione G, Scozzafava A, Supuran CT. J Enzyme Inhib. 1998;13:267. doi: 10.3109/14756369809021475. [DOI] [PubMed] [Google Scholar]
- 523.Winum J-Y, Vullo D, Casini A, Montero J-L, Scozzafava A, Supuran CT. J Med Chem. 2003;46:2197. doi: 10.1021/jm021124k. [DOI] [PubMed] [Google Scholar]
- 524.Mann T, Keilin D. Nature. 1940;146:164. doi: 10.1042/bj0341163. [DOI] [PMC free article] [PubMed] [Google Scholar]
- 525.Maren TH. Invest Ophthalmol Vision Sci. 1974;13:479. [Google Scholar]
- 526.Scozzafava A, Banciu MD, Popescu A, Supuran CT. J Enzyme Inhib. 2000;15:443. doi: 10.3109/14756360009040700. [DOI] [PubMed] [Google Scholar]
- 527.Supuran CT, Scozzafava A. Curr Med Chem: Immunol Endocrinol Metab Agents. 2001;1:61. [Google Scholar]
- 528.Maren TH, Conroy CW. J Biol Chem. 1993;268:26233. [PubMed] [Google Scholar]
- 529.Jayaweera GDSA, MacNeil SA, Trager SF, Blackburn GM. Bioorg Med Chem Lett. 1991;1:407. [Google Scholar]
- 530.Antonaroli S, Bianco A, Brufani M, Cellai L, Lo Baido G, Potier E, Bonomi L, Perfetti S, Fiaschi AI, Segre G. J Med Chem. 1992;35:2697. doi: 10.1021/jm00092a021. [DOI] [PubMed] [Google Scholar]
- 531.Maren TH, Wynns GC, Wistrand PJ. Mol Pharmacol. 1993;44:901. [PubMed] [Google Scholar]
- 532.Tinker JP, Coulson R, Weiner IM. J Pharmacol Exp Ther. 1981;218:600. [PubMed] [Google Scholar]
- 533.Lucci MS, Tinker JP, Weiner IM, DuBose TD., Jr Am J Physiol. 1983;245:F443. doi: 10.1152/ajprenal.1983.245.4.F443. [DOI] [PubMed] [Google Scholar]
- 534.Vullo D, Innocenti A, Nishimori I, Pastorek J, Scozzafava A, Pastoreková S, Supuran CT. Bioorg Med Chem Lett. 2005;15:963. doi: 10.1016/j.bmcl.2004.12.053. [DOI] [PubMed] [Google Scholar]
- 535.Supuran CT. Expert Opin Ther Patents. 2003;13:1545. [Google Scholar]
- 536.Wilkinson BL, Bornaghi LF, Houston TA, Innocenti A, Supuran CT, Poulsen S-A. J Med Chem. 2006;49:6539. doi: 10.1021/jm060967z. [DOI] [PubMed] [Google Scholar]
- 537.Shah GN, Hewett-Emmett D, Grubb JH, Migas MC, Fleming RE, Waheed A, Sly WS. Proc Natl Acad Sci USA. 2000;97:1677. doi: 10.1073/pnas.97.4.1677. [DOI] [PMC free article] [PubMed] [Google Scholar]
- 538.Montgomery JC, Venta PJ, Eddy RL, Fukushima Y-S, Shows TB, Tashian RE. Genomics. 1991;11:835. doi: 10.1016/0888-7543(91)90006-z. [DOI] [PubMed] [Google Scholar]
- 539.Opavský R, Pastoreková S, Zelník V, Gibadulinová A, Stanbridge EJ, Závada J, Kettmann R, Pastorek J. Genomics. 1996;33:480. doi: 10.1006/geno.1996.0223. [DOI] [PubMed] [Google Scholar]
- 540.Aldred P, Fu P, Barrett G, Penschow JD, Wright RD, Coghlan JP, Fernley RT. Biochemistry. 1991;30:569. doi: 10.1021/bi00216a035. [DOI] [PubMed] [Google Scholar]
- 541.Skaggs LA, Bergenhem NCH, Venta PJ, Tashian RE. Gene. 1993;126:291. doi: 10.1016/0378-1119(93)90385-g. [DOI] [PubMed] [Google Scholar]
- 542.Krebs HA, Sykes WO, Bartley WC. Biochem J. 1947;41:622. doi: 10.1042/bj0410622. [DOI] [PMC free article] [PubMed] [Google Scholar]
- 543.Innocenti A, Casini A, Alcaro MC, Papini AM, Scozzafava A, Supuran CT. J Med Chem. 2004;47:5224. doi: 10.1021/jm049692i. [DOI] [PubMed] [Google Scholar]
- 544.Huc I, Lehn J-M. Proc Natl Acad Sci USA. 1997;94:2106. doi: 10.1073/pnas.94.6.2106. [DOI] [PMC free article] [PubMed] [Google Scholar]
- 545.Kolb HC, Finn MG, Sharpless KB. Angew Chem, Int Ed. 2001;40:2004. doi: 10.1002/1521-3773(20010601)40:11<2004::AID-ANIE2004>3.0.CO;2-5. [DOI] [PubMed] [Google Scholar]
- 546.Mocharla VP, Colasson B, Lee LV, Roper S, Sharpless KB, Wong C-H, Kolb HC. Angew Chem, Int Ed. 2005;44:116. doi: 10.1002/anie.200461580. [DOI] [PubMed] [Google Scholar]
- 547.Doyon JB, Snyder TM, Liu DR. J Am Chem Soc. 2003;125:12372. doi: 10.1021/ja036065u. [DOI] [PubMed] [Google Scholar]
- 548.Anderson AC. Chem Biol. 2003;10:787. doi: 10.1016/j.chembiol.2003.09.002. [DOI] [PubMed] [Google Scholar]
- 549.Brooijmans N, Kuntz ID. Ann Rev Biophys Biomol Struct. 2003;32:335. doi: 10.1146/annurev.biophys.32.110601.142532. [DOI] [PubMed] [Google Scholar]
- 550.Joseph-McCarthy D. Pharmacol Ther. 1999;84:179. doi: 10.1016/s0163-7258(99)00031-5. [DOI] [PubMed] [Google Scholar]
- 551.Kitchen DB, Decornez H, Furr JR, Bajorath J. Nat Rev Drug Discovery. 2004;3:935. doi: 10.1038/nrd1549. [DOI] [PubMed] [Google Scholar]
- 552.Krumrine J, Raubacher F, Brooijmans N, Kuntz I. Methods Biochem Anal. 2003;44:443. [PubMed] [Google Scholar]
- 553.Taylor RD, Jewsbury PJ, Essex JW. J Comput-Aided Mol Des. 2002;16:151. doi: 10.1023/a:1020155510718. [DOI] [PubMed] [Google Scholar]
- 554.Ishchenko AV, Shakhnovich EI. J Med Chem. 2002;45:2770. doi: 10.1021/jm0105833. [DOI] [PubMed] [Google Scholar]
- 555.DeWitte RS, Shakhnovich EI. J Am Chem Soc. 1996;118:11733. [Google Scholar]
- 556.Grüneberg S, Wendt B, Klebe G. Angew Chem, Int Ed. 2001;40:389. doi: 10.1002/1521-3773(20010119)40:2<389::aid-anie389>3.0.co;2-#. [DOI] [PubMed] [Google Scholar]
- 557.Southall NT, Dill KA, Haymet ADJ. J Phys Chem B. 2002;106:521. [Google Scholar]
- 558.Chandler D. Nature. 2002;417:491. doi: 10.1038/417491a. [DOI] [PubMed] [Google Scholar]
- 559.Chandler D. Nature. 2005;437:640. doi: 10.1038/nature04162. [DOI] [PubMed] [Google Scholar]
- 560.Lazaridis T. Acc Chem Res. 2001;34:931. doi: 10.1021/ar010058y. [DOI] [PubMed] [Google Scholar]
- 561.Honig B, Nicholls A. Science. 1995;268:1144. doi: 10.1126/science.7761829. [DOI] [PubMed] [Google Scholar]
- 562.Beece D, Eisenstein L, Frauenfelder H, Good D, Marden MC, Reinisch L, Reynolds AH, Sorensen LB, Yue KT. Biochemistry. 1980;19:5147. doi: 10.1021/bi00564a001. [DOI] [PubMed] [Google Scholar]
- 563.Carlson HA. Curr Opin Chem Biol. 2002;6:447. doi: 10.1016/s1367-5931(02)00341-1. [DOI] [PubMed] [Google Scholar]
- 564.Vamvaca K, Vogeli B, Kast P, Pervushin K, Hilvert D. Proc Natl Acad Sci USA. 2004;101:12860. doi: 10.1073/pnas.0404109101. [DOI] [PMC free article] [PubMed] [Google Scholar]
- 565.Benkovic SJ, Hammes-Schiffer S. Science. 2003;301:1196. doi: 10.1126/science.1085515. [DOI] [PubMed] [Google Scholar]
- 566.Sturtevant JM. Proc Natl Acad Sci USA. 1977;74:2236. doi: 10.1073/pnas.74.6.2236. [DOI] [PMC free article] [PubMed] [Google Scholar]
- 567.Jencks WP. Proc Natl Acad Sci USA. 1981;78:4046. doi: 10.1073/pnas.78.7.4046. [DOI] [PMC free article] [PubMed] [Google Scholar]
- 568.Page MI, Jencks WP. Proc Natl Acad Sci USA. 1971;68:1678. doi: 10.1073/pnas.68.8.1678. [DOI] [PMC free article] [PubMed] [Google Scholar]
- 569.Gilli P, Gerretti V, Gilli G, Borea PA. J Phys Chem. 1994;98:1515. [Google Scholar]
- 570.Lundquist JJ, Toone EJ. Chem Rev. 2002;102:555. doi: 10.1021/cr000418f. [DOI] [PubMed] [Google Scholar]
- 571.Dunitz JD. Chem Biol. 1995;2:709. doi: 10.1016/1074-5521(95)90097-7. [DOI] [PubMed] [Google Scholar]
- 572.Searle MS, Westwell MS, Williams DH. J Chem Soc, Perkin Trans 2. 1995:141. [Google Scholar]
- 573.Ford DM. J Am Chem Soc. 2005;127:16167. doi: 10.1021/ja054519c. [DOI] [PubMed] [Google Scholar]
- 574.Cornish-Bowden A. J Biosci. 2002;27:121. doi: 10.1007/BF02703768. [DOI] [PubMed] [Google Scholar]
- 575.Houk KN, Leach AG, Kim SP, Zhang XY. Angew Chem, Int Ed. 2003;42:4872. doi: 10.1002/anie.200200565. [DOI] [PubMed] [Google Scholar]
- 576.Sharp K. Protein Sci. 2001;10:661. doi: 10.1110/ps.37801. [DOI] [PMC free article] [PubMed] [Google Scholar]
- 577.Weber G. J Phys Chem. 1995;99:1052. [Google Scholar]
- 578.Naghibi H, Tamura A, Sturtevant JM. Proc Natl Acad Sci USA. 1995;92:5597. doi: 10.1073/pnas.92.12.5597. [DOI] [PMC free article] [PubMed] [Google Scholar]
- 579.Liu Y, Sturtevant JM. Protein Sci. 1995;4:2559. doi: 10.1002/pro.5560041212. [DOI] [PMC free article] [PubMed] [Google Scholar]
- 580.Liu Y, Sturtevant JM. Biophys Chem. 1997;64:121. doi: 10.1016/s0301-4622(96)02229-6. [DOI] [PubMed] [Google Scholar]
- 581.Williams DH, Maguire AJ, Tsuzuki W, Westwell MS. Science. 1998;280:711. doi: 10.1126/science.280.5364.711. [DOI] [PubMed] [Google Scholar]
- 582.Calderone CT, Williams DH. J Am Chem Soc. 2001;123:6262. doi: 10.1021/ja003016y. [DOI] [PubMed] [Google Scholar]
- 583.Kumar K, King RW, Carey PR. Biochemistry. 1976;15:2195. doi: 10.1021/bi00655a026. [DOI] [PubMed] [Google Scholar]
- 584.Merz KM, Jr, Murcko MA, Kollman PA. J Am Chem Soc. 1991;113:4484. [Google Scholar]
- 585.Liljas A, Håkansson K, Jonsson BH, Xue YF. Eur J Biochem. 1994;219:1. doi: 10.1007/978-3-642-79502-2_1. [DOI] [PubMed] [Google Scholar]
- 586.Hansch C, McClarin J, Klein T, Langridge R. Mol Pharmacol. 1985;27:493. [PubMed] [Google Scholar]
- 587.Clare BW, Supuran CT. In: Carbonic Anhydrase: Its Inhibitors and Activators. Supuran CT, Scozzafava A, Conway J, editors. CRC Press; Boca Raton, FL: 2004. [Google Scholar]
- 588.Coleman JE. Annu Rev Pharmacol Toxicol. 1975;15:221. doi: 10.1146/annurev.pa.15.040175.001253. [DOI] [PubMed] [Google Scholar]
- 589.Maren TH, Rayburn CS, Liddell NE. Science. 1976;191:469. doi: 10.1126/science.813299. [DOI] [PubMed] [Google Scholar]
- 590.Tibell L, Forsman C, Simonsson I, Lindskog S. Biochim Biophys Acta. 1984;789:302. doi: 10.1016/0167-4838(84)90186-9. [DOI] [PubMed] [Google Scholar]
- 591.Vullo D, Franchi M, Gallori E, Pastorek J, Scozzafava A, Pastorekova S, Supuran CT. J Enzyme Inhib Med Chem. 2003;18:403. doi: 10.1080/1475636031000138732. [DOI] [PubMed] [Google Scholar]
- 592.Jencks WP. Catalysis in Chemistry and Enzymology. Dover Publications; Mineola, NY: 1987. [Google Scholar]
- 593.Krishnamurthy VM, Semetey V, Bracher PJ, Shen N, Whitesides GM. J Am Chem Soc. 2007;129:1312. doi: 10.1021/ja066780e. [DOI] [PMC free article] [PubMed] [Google Scholar]
- 594.Mammen M, Choi S-K, Whitesides GM. Angew Chem, Int Ed. 1998;37:2755. doi: 10.1002/(SICI)1521-3773(19981102)37:20<2754::AID-ANIE2754>3.0.CO;2-3. [DOI] [PubMed] [Google Scholar]
- 595.Choi S-K. Synthetic Multivalent Molecules: Concepts and Biomedical Applications. John Wiley & Sons, Inc; Hoboken, NY: 2004. [Google Scholar]
- 596.Roy BC, Banerjee AL, Swanson M, Jia XG, Haldar MK, Mallik S, Srivastava DK. J Am Chem Soc. 2004;126:13206. doi: 10.1021/ja047271k. [DOI] [PubMed] [Google Scholar]
- 597.Madder RD, Kim CY, Chandra PP, Doyon JB, Baird TA, Fierke CA, Christianson DW, Voet JG, Jain A. J Org Chem. 2002;67:582. doi: 10.1021/jo0159385. [DOI] [PubMed] [Google Scholar]
- 598.Doyon JB, Jain A. Org Lett. 1999;1:183. doi: 10.1021/ol9905250. [DOI] [PubMed] [Google Scholar]
- 599.Chin DN, Whitesides GM. J Am Chem Soc. 1995;117:6153. [Google Scholar]
- 600.Fridborg K, Kannan KK, Liljas A, Lundin J, Strandberg B, Strandberg R, Tilander B, Wiren G. J Mol Biol. 1967;25:505. doi: 10.1016/0022-2836(67)90202-1. [DOI] [PubMed] [Google Scholar]
- 601.Roy BC, Hegge R, Rosendahl T, Jia X, Lareau R, Mallik S, Srivastava DK. Chem Commun. 2003:2328. doi: 10.1039/b305179j. [DOI] [PubMed] [Google Scholar]
- 602.Banerjee AL, Swanson M, Roy BC, Jia X, Haldar MK, Mallik S, Srivastava DK. J Am Chem Soc. 2004;126:10875. doi: 10.1021/ja047557p. [DOI] [PubMed] [Google Scholar]
- 603.Miles EW. Methods Enzymol. 1977;47:431. doi: 10.1016/0076-6879(77)47043-5. [DOI] [PubMed] [Google Scholar]
- 604.Chen G, Heim A, Riether D, Yee D, Milgrom Y, Gawinowicz MA, Sames D. J Am Chem Soc. 2003;125:8130. doi: 10.1021/ja034287m. [DOI] [PubMed] [Google Scholar]
- 605.Takaoka Y, Tsutsumi H, Kasagi N, Nakata E, Hamachi I. J Am Chem Soc. 2006;128:3273. doi: 10.1021/ja057926x. [DOI] [PubMed] [Google Scholar]
- 606.Goldberg RN, Kishore N, Lennen RM. J Phys Chem Ref Data. 2002;31:231. [Google Scholar]
- 607.Pocker Y, Stone JT. Biochemistry. 1968;7:4139. doi: 10.1021/bi00851a050. [DOI] [PubMed] [Google Scholar]
- 608.Conroy CW, Maren TH. Mol Pharmacol. 1995;48:486. [PubMed] [Google Scholar]
- 609.Mammen M, Shakhnovich EI, Whitesides GM. J Org Chem. 1998;63:3168. [Google Scholar]
- 610.Alberty RA, Hammes GG. J Phys Chem. 1958;62:154. [Google Scholar]
- 611.Shimizu K, Osteryoung RA. Anal Chem. 1981;53:2350. [Google Scholar]
- 612.Olander J, Bosen SF, Kaiser ET. J Am Chem Soc. 1973;95:1616. doi: 10.1021/ja00786a042. [DOI] [PubMed] [Google Scholar]
- 613.Olander J, Bosen SF, Kaiser ET. J Am Chem Soc. 1973;95:4473. doi: 10.1021/ja00786a042. [DOI] [PubMed] [Google Scholar]
- 614.Banerjee AL, Tobwala S, Ganguly B, Mallik S, Srivastava DK. Biochemistry. 2005;44:3673. doi: 10.1021/bi0475018. [DOI] [PubMed] [Google Scholar]
- 615.Strickland S, Palmer G, Massey V. J Biol Chem. 1975;250:4048. [PubMed] [Google Scholar]
- 616.Schlosshauer M, Baker D. J Phys Chem B. 2002;106:12079. [Google Scholar]
- 617.Huber W, Mueller F. Curr Pharm Des. 2006;12:3999. doi: 10.2174/138161206778743600. [DOI] [PubMed] [Google Scholar]
- 618.Boozer C, Kim G, Cong SX, Guan HW, Londergan T. Curr Opin Biotechnol. 2006;17:400. doi: 10.1016/j.copbio.2006.06.012. [DOI] [PubMed] [Google Scholar]
- 619.Pattnaik P. Appl Biochem Biotechnol. 2005;126:79. doi: 10.1385/abab:126:2:079. [DOI] [PubMed] [Google Scholar]
- 620.Lahiri J, Isaacs L, Grzybowski B, Carbeck JD, Whitesides GM. Langmuir. 1999;15:7186. [Google Scholar]
- 621.Myszka DG, He X, Dembo M, Morton TA, Goldstein B. Biophys J. 1998;75:583. doi: 10.1016/S0006-3495(98)77549-6. [DOI] [PMC free article] [PubMed] [Google Scholar]
- 622.Su XL, Sun Y. AIChE J. 2006;52:2921. [Google Scholar]
- 623.Jones MN. Curr Opin Colloid Interface Sci. 1996;1:91. [Google Scholar]
- 624.Edwards PR, Gill A, Pollardknight DV, Hoare M, Buckle PE, Lowe PA, Leatherbarrow RJ. Anal Biochem. 1995;231:210. doi: 10.1006/abio.1995.1522. [DOI] [PubMed] [Google Scholar]
- 625.Spinke J, Liley M, Schmitt FJ, Guder HJ, Angermaier L, Knoll W. J Chem Phys. 1993;99:7012. [Google Scholar]
- 626.Tamm LK, Bartoldus I. Biochemistry. 1988;27:7453. [Google Scholar]
- 627.Berg OG. Makromol Chem Macromol Symp. 1988;17:161. [Google Scholar]
- 628.Nousiainen M, Derrick PJ, Lafitte D, Vainiotalo P. Biophys J. 2003;85:491. doi: 10.1016/S0006-3495(03)74494-4. [DOI] [PMC free article] [PubMed] [Google Scholar]
- 629.Isabel Catalina M, de Mol NJ, Fischer MJE, Heck AJR. Phys Chem Chem Phys. 2004;6:2572. [Google Scholar]
- 630.Aebersold R. J Am Soc Mass Spectrom. 2003;14:685. doi: 10.1016/S1044-0305(03)00289-7. [DOI] [PubMed] [Google Scholar]
- 631.Regan CK, Craig SL, Brauman JI. Science. 2002;295:2245. doi: 10.1126/science.1068849. [DOI] [PubMed] [Google Scholar]
- 632.Gronert S. Chem Rev. 2001;101:329. doi: 10.1021/cr9900836. [DOI] [PubMed] [Google Scholar]
- 633.Chabinyc ML, Craig SL, Regan CK, Brauman JI. Science. 1998;279:1882. doi: 10.1126/science.279.5358.1882. [DOI] [PubMed] [Google Scholar]
- 634.Colton IJ, Anderson JR, Gao J, Chapman RG, Isaacs L, Whitesides GM. J Am Chem Soc. 1997;119:12701. [Google Scholar]
- 635.Carbeck JD, Colton IJ, Anderson JR, Deutch JM, Whitesides GM. J Am Chem Soc. 1999;121:10671. [Google Scholar]
- 636.Negin RS, Carbeck JD. J Am Chem Soc. 2002;124:2911. doi: 10.1021/ja0169567. [DOI] [PubMed] [Google Scholar]
- 637.Menon MK, Zydney AL. Anal Chem. 2000;72:5714. doi: 10.1021/ac000752b. [DOI] [PubMed] [Google Scholar]
- 638.Menon MK, Zydney AL. J Membr Sci. 2001;181:179. [Google Scholar]
- 639.Allison SA, Carbeck JD, Chen C, Burkes F. J Phys Chem B. 2004;108:4516. [Google Scholar]
- 640.Gitlin I, Mayer M, Whitesides GM. J Phys Chem B. 2003;107:1466. [Google Scholar]
- 641.Chiti F, Stefani M, Taddei N, Ramponi G, Dobson CM. Nature. 2003;424:805. doi: 10.1038/nature01891. [DOI] [PubMed] [Google Scholar]
- 642.Shaw KL, Grimsley GR, Yakovlev GI, Makarov AA, Pace CN. Protein Sci. 2001;10:1206. doi: 10.1110/ps.440101. [DOI] [PMC free article] [PubMed] [Google Scholar]
- 643.Ilinskaya ON, Dreyer F, Mitkevich VA, Shaw KL, Pace CN, Makarov AA. Protein Sci. 2002;11:2522. doi: 10.1110/ps.0216702. [DOI] [PMC free article] [PubMed] [Google Scholar]
- 644.Winzor DJ. Anal Biochem. 2004;325:1. doi: 10.1016/j.ab.2003.09.035. [DOI] [PubMed] [Google Scholar]
- 645.Carbeck JD, Negin RS. J Am Chem Soc. 2001;123:1252. doi: 10.1021/ja005740m. [DOI] [PubMed] [Google Scholar]
- 646.Gao J, Whitesides GM. Anal Chem. 1997;69:575. doi: 10.1021/ac9608073. [DOI] [PubMed] [Google Scholar]
- 647.Linderstrøm-Lang KU. Compt Rend Trav Lab Carlsberg. 1924;15:1. [Google Scholar]
- 648.Sharma U, Negin RS, Carbeck JD. J Phys Chem B. 2003;107:4653. [Google Scholar]
- 649.Kuramitsu S, Hamaguchi K. J Biochem. 1980;87:1215. [PubMed] [Google Scholar]
- 650.Hunter RJ. Foundations of Colloid Science. Oxford University Press; New York: 1991. [Google Scholar]
- 651.Carbeck JD, Colton IJ, Gao J, Whitesides GM. Acc Chem Res. 1998;31:343. [Google Scholar]
- 652.Gudiksen KL, Gitlin I, Yang J, Urbach AR, Moustakas DT, Whitesides GM. J Am Chem Soc. 2005;127:4707. doi: 10.1021/ja043804d. [DOI] [PubMed] [Google Scholar]
- 653.Caravella JA, Carbeck JD, Duffy DC, Whitesides GM, Tidor B. J Am Chem Soc. 1999;121:4340. [Google Scholar]
- 654.Carbeck JD, Severs JC, Gao J, Wu Q, Smith RD, Whitesides GM. J Phys Chem B. 1998;102:10596. [Google Scholar]
- 655.Smith RD, Loo JA, Ogorzalek Loo RR, Busman M, Udseth HR. Mass Spectrom Rev. 1991;10:359. [Google Scholar]
- 656.Schnier PD, Gross DS, Williams ER. J Am Chem Soc. 1995;117:6747. [Google Scholar]
- 657.Gudiksen KL, Gitlin I, Moustakas DT, Whitesides GM. Biophys J. 2006;91:298. doi: 10.1529/biophysj.106.081547. [DOI] [PMC free article] [PubMed] [Google Scholar]
- 658.Pliska V, Schmidt M, Fauchere JL. J Chromatogr. 1981;216:79. [Google Scholar]
- 659.Yang J, Gitlin I, Krishnamurthy VM, Vazquez JA, Costello CE, Whitesides GM. J Am Chem Soc. 2003;125:12392. doi: 10.1021/ja035978l. [DOI] [PubMed] [Google Scholar]
- 660.Gitlin I, Gudiksen KL, Whitesides GM. ChemBioChem. 2006;7:1241. doi: 10.1002/cbic.200600191. [DOI] [PubMed] [Google Scholar]
- 661.Carlsson U, Jonsson B-H. Curr Opin Struct Biol. 1995;5:482. doi: 10.1016/0959-440x(95)80032-8. [DOI] [PubMed] [Google Scholar]
- 662.Carlsson U, Jonsson B-H. In: The Carbonic Anhydrases: New Horizons. Chegwidden WR, Carter ND, Edwards YH, editors. Vol. 90 Birkhäuser Verlag; Basel, Switzerland: 2000. [Google Scholar]
- 663.Bushmarina NA, Kuznetsova IM, Biktashev AG, Turoverov KK, Uversky VN. ChemBioChem. 2001;2:813. doi: 10.1002/1439-7633(20011105)2:11<813::AID-CBIC813>3.0.CO;2-W. [DOI] [PubMed] [Google Scholar]
- 664.Dill KA, Shortle D. Annu Rev Biochem. 1991;60:795. doi: 10.1146/annurev.bi.60.070191.004051. [DOI] [PubMed] [Google Scholar]
- 665.Dolgikh DA, Kolomiets AP, Bolotina IA, Ptitsyn OB. FEBS Lett. 1984;165:88. doi: 10.1016/0014-5793(84)80020-4. [DOI] [PubMed] [Google Scholar]
- 666.Edsall JT, Mehta S, Myers DV, Armstrong JM. Biochem Z. 1966;345:9. [Google Scholar]
- 667.Fransson C, Freskgård PO, Herbertsson H, Johansson Å, Jonasson P, Mårtensson L-G, Svensson M, Jonsson BH, Carlsson U. FEBS Lett. 1992;296:90. doi: 10.1016/0014-5793(92)80410-i. [DOI] [PubMed] [Google Scholar]
- 668.Ko BPN, Yazgan A, Yeagle PL, Lottich SC, Henkens RW. Biochemistry. 1977;16:1720. doi: 10.1021/bi00627a031. [DOI] [PubMed] [Google Scholar]
- 669.Montich GG. Biochim Biophys Acta. 2000;1468:115. doi: 10.1016/s0005-2736(00)00250-9. [DOI] [PubMed] [Google Scholar]
- 670.Ptitsyn OB. In: Protein Folding. Creighton TE, editor. 1992. [Google Scholar]
- 671.Ptitsyn OB, Pain RH, Semisotnov GV, Zerovnik E, Razgulyaev OI. FEBS Lett. 1990;262:20. doi: 10.1016/0014-5793(90)80143-7. [DOI] [PubMed] [Google Scholar]
- 672.Svensson M, Jonasson P, Freskgård P-O, Jonsson B-H, Lindgren M, Mårtensson L-G, Gentile M, Borén K, Carlsson U. Biochemistry. 1995;34:8606. doi: 10.1021/bi00027a010. [DOI] [PubMed] [Google Scholar]
- 673.Wong K-P, Tanford C. J Biol Chem. 1973;248:8518. [PubMed] [Google Scholar]
- 674.Hammarström P, Kalman B, Jonsson B-H, Carlsson U. FEBS Lett. 1997;420:63. doi: 10.1016/s0014-5793(97)01488-9. [DOI] [PubMed] [Google Scholar]
- 675.Jonasson P, Aronsson G, Carlsson U, Jonsson BH. Biochemistry. 1997;36:5142. doi: 10.1021/bi961882a. [DOI] [PubMed] [Google Scholar]
- 676.Mårtensson L-G, Jonsson BH, Freskgård PO, Kihlgren A, Svensson M, Carlsson U. Biochemistry. 1993;32:224. doi: 10.1021/bi00052a029. [DOI] [PubMed] [Google Scholar]
- 677.Henkens RW, Oleksiak TP. In: Carbonic Anhydrase: From Biochemistry and Genetics to Physiology and Clinical Medicine. Botré F, Gros G, Storey BT, editors. VCH; New York: 1991. [Google Scholar]
- 678.Henkens RW, Kitchell BB, Lottich SC, Stein PJ, Williams TJ. Biochemistry. 1982;21:5918. doi: 10.1021/bi00266a029. [DOI] [PubMed] [Google Scholar]
- 679.Hammarström P, Carlsson U. Biochem Biophys Res Commun. 2000;276:393. doi: 10.1006/bbrc.2000.3360. [DOI] [PubMed] [Google Scholar]
- 680.Freskgård PO, Bergenhem N, Jonsson B-H, Svensson M, Carlsson U. Science. 1992;258:466. doi: 10.1126/science.1357751. [DOI] [PubMed] [Google Scholar]
- 681.Levitt M. J Mol Biol. 1981;145:251. doi: 10.1016/0022-2836(81)90342-9. [DOI] [PubMed] [Google Scholar]
- 682.Baldwin RL. Annu Rev Biochem. 1975;44:453. doi: 10.1146/annurev.bi.44.070175.002321. [DOI] [PubMed] [Google Scholar]
- 683.Lin LN, Hasumi H, Brandts JF. Biochim Biophys Acta. 1988;956:256. doi: 10.1016/0167-4838(88)90142-2. [DOI] [PubMed] [Google Scholar]
- 684.Wetlaufer DB. Biopolymers. 1985;24:251. [Google Scholar]
- 685.Yazgan A, Henkens RW. Biochemistry. 1972;11:1314. doi: 10.1021/bi00757a031. [DOI] [PubMed] [Google Scholar]
- 686.Hammarström P, Persson M, Owenius R, Lindgren M, Carlsson U. J Biol Chem. 2000;275:22832. doi: 10.1074/jbc.M000649200. [DOI] [PubMed] [Google Scholar]
- 687.Hammarström P, Persson M, Carlsson U. J Biol Chem. 2001;276:21765. doi: 10.1074/jbc.M010858200. [DOI] [PubMed] [Google Scholar]
- 688.Persson M, Aronsson G, Bergenhem N, Freskgård P-O, Jonsson B-H, Surin BP, Spangfort MD, Carlsson U. Biochim Biophys Acta. 1995;1247:195. doi: 10.1016/0167-4838(94)00227-8. [DOI] [PubMed] [Google Scholar]
- 689.Persson M, Carlsson U, Bergenhem NCH. Biochim Biophys Acta. 1996;1298:191. doi: 10.1016/s0167-4838(96)00125-2. [DOI] [PubMed] [Google Scholar]
- 690.Persson M, Carlsson U, Bergenhem N. FEBS Lett. 1997;411:43. doi: 10.1016/s0014-5793(97)00663-7. [DOI] [PubMed] [Google Scholar]
- 691.Persson M, Hammarström P, Lindgren M, Jonsson B-H, Svensson M, Carlsson U. Biochemistry. 1999;38:432. doi: 10.1021/bi981442e. [DOI] [PubMed] [Google Scholar]
- 692.Yon JM. J Cell Mol Med. 2002;6:307. doi: 10.1111/j.1582-4934.2002.tb00511.x. [DOI] [PMC free article] [PubMed] [Google Scholar]
- 693.Kjellsson A, Sethson I, Jonsson B-H. Biochemistry. 2003;42:363. doi: 10.1021/bi026364g. [DOI] [PubMed] [Google Scholar]
- 694.Freskgård PO, Carlsson U, Mårtensson L-G, Jonsson BH. FEBS Lett. 1991;289:117. doi: 10.1016/0014-5793(91)80922-p. [DOI] [PubMed] [Google Scholar]
- 695.Takusagawa F, Kamitori S. J Am Chem Soc. 1996;118:8945. [Google Scholar]
- 696.Taylor WR. Nature. 2000;406:916. doi: 10.1038/35022623. [DOI] [PubMed] [Google Scholar]
- 697.Two dihedrals determine the three-dimensional structure of the main chain of a protein, if the amide bond is held planar. If only local interactions are considered, these dihedrals have few preferred values that correspond to the local minima of the torsion energy around each rotation bond. For four atoms along a rotation bond, three values of angles in gauche (±60°) and trans (180°) correspond to rather stable local minima of the torsion energy, and thus, only 6 conformations need to be examined per amino acid, so that at least 6N conformations exist for a protein with N amino acids. With CA, N = 259 and there are 6259 (≈10201) possible conformations. Considering an average rotation frequency around each bond of 1013 s−1 (see Wetlaufer, D. B. Proc. Natl. Acad. Sci. U.S.A. 1973, 70, 697 and Levinthal, C. J. Chim. Phys. Phys.-Chim. Biol. 1968, 65, 44), it would take this protein about 10188 s (≈10180) to sample all possible conformations; that is, a duration that is longer than the age of the universe (2 × 10¹⁰ years).
- 698.Levinthal C. J Chim Phys Phys-Chim Biol. 1968;65:44. [Google Scholar]
- 699.Anfinsen CB. Science. 1973;181:223. doi: 10.1126/science.181.4096.223. [DOI] [PubMed] [Google Scholar]
- 700.Baldwin RL. Trends Biochem Sci. 1986;11:6. [Google Scholar]
- 701.Carlsson U, Aasa R, Henderson LE, Jonsson BH, Lindskog S. Eur J Biochem. 1975;52:25. doi: 10.1111/j.1432-1033.1975.tb03969.x. [DOI] [PubMed] [Google Scholar]
- 702.Lakowicz JR. Principles of Fluorescence Spectroscopy. 2. Kluwer Academic/Plenum; New York: 1999. [Google Scholar]
- 703.Wong K-P, Hamlin LM. Arch Biochem Biophys. 1975;170:12. doi: 10.1016/0003-9861(75)90093-4. [DOI] [PubMed] [Google Scholar]
- 704.Andersson D, Hammarström P, Carlsson U. Biochemistry. 2001;40:2653. doi: 10.1021/bi000957e. [DOI] [PubMed] [Google Scholar]
- 705.Bergenhem N, Carlsson U. Biochim Biophys Acta. 1989;998:277. doi: 10.1016/0167-4838(89)90285-9. [DOI] [PubMed] [Google Scholar]
- 706.Gudiksen KL, Urbach AR, Gitlin I, Yang J, Vazquez JA, Costello CE, Whitesides GM. Anal Chem. 2004;76:7151. doi: 10.1021/ac0488560. [DOI] [PubMed] [Google Scholar]
- 707.Bergenhem and Carlsson (Bergenhem, N., Carlsson, U. Biochim. Biophys. Acta 1989, 998, 227) found that the rate of the increase in absorbance due to CoII depended on the concentration of CoII with a second-order rate constant of 140 M−1s−1
- 708.Almstedt K, Lundqvist M, Carlsson J, Karlsson M, Persson B, Jonsson B-H, Carlsson U, Hammarström P. J Mol Biol. 2004;342:619. doi: 10.1016/j.jmb.2004.07.024. [DOI] [PubMed] [Google Scholar]
- 709.Ohgushi M, Wada A. FEBS Lett. 1983;164:21. doi: 10.1016/0014-5793(83)80010-6. [DOI] [PubMed] [Google Scholar]
- 710.Fink AL. Methods Mol Biol. 1995;40:343. doi: 10.1385/0-89603-301-5:343. [DOI] [PubMed] [Google Scholar]
- 711.Khan RH, Khan F. Biochemistry (Moscow) 2002;67:520. doi: 10.1023/a:1015537909889. [DOI] [PubMed] [Google Scholar]
- 712.Kuwajima K, Arai M. Front Mol Biol. 2000;32:138. [Google Scholar]
- 713.Kuwajima K. Proc Indian Natl Sci Acad A: Phys Sci. 2002;68:333. [Google Scholar]
- 714.Dobson CM, Karplus M. Curr Opin Struct Biol. 1999;9:92. doi: 10.1016/s0959-440x(99)80012-8. [DOI] [PubMed] [Google Scholar]
- 715.Creighton TE. Trends Biochem Sci. 1997;22:6. doi: 10.1016/s0968-0004(96)20030-1. [DOI] [PubMed] [Google Scholar]
- 716.Jagannadham MV, Balasubramanian D. FEBS Lett. 1985;188:326. doi: 10.1016/0014-5793(85)80396-3. [DOI] [PubMed] [Google Scholar]
- 717.Sreerama N, Woody RW. In: Circular Dichroism: Principles and Applications. 2. Berova N, Nakanishi K, Woody RW, editors. John Wiley and Sons; New York: 2000. [Google Scholar]
- 718.In the far-UV, the chromophore is the peptide bond in a regular, folded environment. Alpha-helix, beta-sheet, and random-coil structures each give rise to a characteristic shape and magnitude of CD. In the near-UV, the chromophore is primarily the side chains of amino acids, specifically aromatic side chains and disulfides; the CD signals produced by these groups are sensitive to the overall tertiary structure of the protein.
- 719.The analysis of CA using CD is not straightforward. Carlsson and co-workers (Borén, K., Andersson, P., Larsson, M., Carlsson, U. Biochim. Biophys. Acta 1999, 1430, 111; Freskgård, P.-O., Mårtens-son, L.-G., Jonasson, P., Jonsson, B.-H., Carlsson, U. Biochemistry 1994, 33, 14281) found that the aromatic residues contribute extensively to the far-UV region of the CD spectrum of native CA, so that the determination of secondary structure using the far-UV region is difficult. Furthermore, the CD signature in the far-UV also varies among the different isoforms of CA, although they have similar crystal structures (section 4.4).
- 720.Borén K, Andersson P, Larsson M, Carlsson U. Biochim Biophys Acta. 1999;1430:111. doi: 10.1016/s0167-4838(98)00283-0. [DOI] [PubMed] [Google Scholar]
- 721.Stryer L. J Mol Biol. 1965;13:482. doi: 10.1016/s0022-2836(65)80111-5. [DOI] [PubMed] [Google Scholar]
- 722.Bismuto E, Gratton E, Lamb DC. Biophys J. 2001;81:3510. doi: 10.1016/S0006-3495(01)75982-6. [DOI] [PMC free article] [PubMed] [Google Scholar]
- 723.Semisotnov GV, Rodionova NA, Razgulyaev OI, Uversky VN, Gripas AF, Gilmanshin RI. Biopolymers. 1991;31:119. doi: 10.1002/bip.360310111. [DOI] [PubMed] [Google Scholar]
- 724.Semisotnov GV, Rodionova NA, Kutyshenko VP, Ebert B, Blanck J, Ptitsyn OB. FEBS Lett. 1987;224:9. doi: 10.1016/0014-5793(87)80412-x. [DOI] [PubMed] [Google Scholar]
- 725.Förster T. Angew Chem, Int Ed Engl. 1969;8:333. [Google Scholar]
- 726.Kutyshenko VP, Cortijo M. Protein Sci. 2000;9:1540. doi: 10.1110/ps.9.8.1540. [DOI] [PMC free article] [PubMed] [Google Scholar]
- 727.Kutyshenko VP. Mol Biol (Moscow) 2001;35:80. [PubMed] [Google Scholar]
- 728.Shortle D. Nature Struct Biol. 1999;6:203. doi: 10.1038/6640. [DOI] [PubMed] [Google Scholar]
- 729.Uversky VN. Biochemistry. 1993;32:13288. doi: 10.1021/bi00211a042. [DOI] [PubMed] [Google Scholar]
- 730.Denisov VP, Jonsson B-H, Halle B. Nature Struct Biol. 1999;6:253. doi: 10.1038/6692. [DOI] [PubMed] [Google Scholar]
- 731.Gast K, Zirwer D, Welfle H, Bychkova VE, Ptitsyn OB. Int J Biol Macromol. 1986;8:231. [Google Scholar]
- 732.Gast K, Damaschun H, Misselwitz R, Mueller-Frohne M, Zirwer D, Damaschun G. Eur Biophys J. 1994;23:297. doi: 10.1007/BF00213579. [DOI] [PubMed] [Google Scholar]
- 733.Kataoka M, Kuwajima K, Tokunaga F, Goto Y. Protein Sci. 1997;6:422. doi: 10.1002/pro.5560060219. [DOI] [PMC free article] [PubMed] [Google Scholar]
- 734.Kataoka M, Nishii I, Fujisawa T, Ueki T, Tokunaga F, Goto Y. J Mol Biol. 1995;249:215. doi: 10.1006/jmbi.1995.0290. [DOI] [PubMed] [Google Scholar]
- 735.Freire E. Annu Rev Biophys Biomol Struct. 1995;24:141. doi: 10.1146/annurev.bb.24.060195.001041. [DOI] [PubMed] [Google Scholar]
- 736.Fink AL. Annu Rev Biophys Biomol Struct. 1995;24:495. doi: 10.1146/annurev.bb.24.060195.002431. [DOI] [PubMed] [Google Scholar]
- 737.Brandts JF, Halvorson HR, Brennan M. Biochemistry. 1975;14:4953. doi: 10.1021/bi00693a026. [DOI] [PubMed] [Google Scholar]
- 738.Carlsson U, Henderson LE, Nyman PO, Samuelsson T. FEBS Lett. 1974;48:167. doi: 10.1016/0014-5793(74)80459-x. [DOI] [PubMed] [Google Scholar]
- 739.Semisotnov GV, Uverskii VN, Sokolovskii IV, Gutin AM, Razgulyaev OI, Rodionova NA. J Mol Biol. 1990;213:561. doi: 10.1016/S0022-2836(05)80215-3. [DOI] [PubMed] [Google Scholar]
- 740.Fischer G, Heins J, Barth A. Biochim Biophys Acta. 1983;742:452. doi: 10.1016/0167-4838(83)90261-3. [DOI] [PubMed] [Google Scholar]
- 741.For HCA II, the half-time of reactivation increases from 1 to 9 min as the time between denaturation and renaturation increases from 15 s to 1 h (see Fransson et al. FEBS Lett. 1992, 296, 90).
- 742.Takahashi N, Hayano T, Suzuki M. Nature. 1989;337:473. doi: 10.1038/337473a0. [DOI] [PubMed] [Google Scholar]
- 743.Kern G, Kern D, Schmid FX, Fischer G. J Biol Chem. 1995;270:740. doi: 10.1074/jbc.270.2.740. [DOI] [PubMed] [Google Scholar]
- 744.Aronsson G, Mårtensson L-G, Carlsson U, Jonsson BH. Biochemistry. 1995;34:2153. doi: 10.1021/bi00007a008. [DOI] [PubMed] [Google Scholar]
- 745.Borén K, Grankvist H, Hammarström P, Carlsson U. FEBS Lett. 2004;566:95. doi: 10.1016/j.febslet.2004.03.105. [DOI] [PubMed] [Google Scholar]
- 746.Creighton TE. Proteins: Structures and Molecular Properties. 2. W. H. Freeman and Company; New York: 1993. [Google Scholar]
- 747.Brandts JF. J Am Chem Soc. 1964;86:4291. [Google Scholar]
- 748.Brandts JF. J Am Chem Soc. 1964;86:4302. [Google Scholar]
- 749.Aune KC, Salahuddin A, Zarlengo MH, Tanford C. J Biol Chem. 1967;242:4486. [PubMed] [Google Scholar]
- 750.Fink AL, Calciano LJ, Goto Y, Kurotsu T, Palleros DR. Biochemistry. 1994;33:12504. doi: 10.1021/bi00207a018. [DOI] [PubMed] [Google Scholar]
- 751.Wong K-P, Hamlin LM. Biochemistry. 1974;13:2678. doi: 10.1021/bi00710a003. [DOI] [PubMed] [Google Scholar]
- 752.Beychok S, Armstrong JM, Lindblow C, Edsall JT. J Biol Chem. 1966;241:5150. [PubMed] [Google Scholar]
- 753.Nilsson A, Lindskog S. Eur J Biochem. 1967;2:309. doi: 10.1111/j.1432-1033.1967.tb00140.x. [DOI] [PubMed] [Google Scholar]
- 754.Flanagan MT, Hesketh TR. Eur J Biochem. 1974;44:251. doi: 10.1111/j.1432-1033.1974.tb03480.x. [DOI] [PubMed] [Google Scholar]
- 755.Riddiford LM. J Biol Chem. 1965;240:168. [PubMed] [Google Scholar]
- 756.Riddiford LM, Stellwagen RH, Mehta S, Edsall JT. J Biol Chem. 1965;240:3305. [PubMed] [Google Scholar]
- 757.McCoy LF, Jr, Wong K-P. Biochemistry. 1981;20:3062. doi: 10.1021/bi00514a012. [DOI] [PubMed] [Google Scholar]
- 758.Bull HB, Breese K. Arch Biochem Biophys. 1973;158:681. doi: 10.1016/0003-9861(73)90561-4. [DOI] [PubMed] [Google Scholar]
- 759.Lavecchia R, Zugaro M. FEBS Lett. 1991;292:162. doi: 10.1016/0014-5793(91)80858-z. [DOI] [PubMed] [Google Scholar]
- 760.Gitlin I, Gudiksen KL, Whitesides GM. J Phys Chem B. 2006;110:2372. doi: 10.1021/jp055699f. [DOI] [PubMed] [Google Scholar]
- 761.Gudiksen KL, Gitlin I, Whitesides GM. Proc Natl Acad Sci USA. 2006;103:7968. doi: 10.1073/pnas.0602816103. [DOI] [PMC free article] [PubMed] [Google Scholar]
- 762.Takagi T, Tsujii K, Shirahama K. J Biochem. 1975;77:939. doi: 10.1093/oxfordjournals.jbchem.a130818. [DOI] [PubMed] [Google Scholar]
- 763.Reynolds JA, Tanford C. J Biol Chem. 1970;245:5161. [PubMed] [Google Scholar]
- 764.Greenfield NJ, Fasman GD. Biochemistry. 1969;8:4108. doi: 10.1021/bi00838a031. [DOI] [PubMed] [Google Scholar]
- 765.Greenfield NJ, Davidson B, Fasman GD. Biochemistry. 1967;6:1630. doi: 10.1021/bi00858a009. [DOI] [PubMed] [Google Scholar]
- 766.Iwatsubo T. In: Frontiers of the Mechanisms of Memory and Dementia. Kato T, editor. Vol. 1200 Elsevier Science B. V.; Amsterdam, The Netherlands: 2000. [Google Scholar]
- 767.Wanker EE. Biol Chem. 2000;381:937. doi: 10.1515/BC.2000.114. [DOI] [PubMed] [Google Scholar]
- 768.Merlini G, Bellotti V, Andreola A, Palladini G, Obici L, Casarini S, Perfetti V. Clin Chem Lab Med. 2001;39:1065. doi: 10.1515/CCLM.2001.172. [DOI] [PubMed] [Google Scholar]
- 769.Hetz C, Soto C. Cell Mol Life Sci. 2003;60:133. doi: 10.1007/s000180300009. [DOI] [PMC free article] [PubMed] [Google Scholar]
- 770.Perlmutter DH. J Clin Invest. 2002;110:1219. doi: 10.1172/JCI16780. [DOI] [PMC free article] [PubMed] [Google Scholar]
- 771.Bates G. Lancet. 2003;361:1642. doi: 10.1016/S0140-6736(03)13304-1. [DOI] [PubMed] [Google Scholar]
- 772.Stolzing A, Grune T. NATO Sci Ser, Ser I: Life Behav Sci. 2003;344:170. [Google Scholar]
- 773.Soto C. FEBS Lett. 2001;498:204. doi: 10.1016/s0014-5793(01)02486-3. [DOI] [PubMed] [Google Scholar]
- 774.Dumery L, Bourdel F, Soussan Y, Fialkowsky A, Viale S, Nicolas P, Reboud-Ravaux M. Pathol Biol. 2001;49:72. doi: 10.1016/s0369-8114(00)00009-2. [DOI] [PubMed] [Google Scholar]
- 775.Ptitsyn OB. Adv Protein Chem. 1995;47:83. doi: 10.1016/s0065-3233(08)60546-x. [DOI] [PubMed] [Google Scholar]
- 776.Fink AL. Fold Des. 1998;3:R9. doi: 10.1016/S1359-0278(98)00002-9. [DOI] [PubMed] [Google Scholar]
- 777.Kundu B, Guptasarma P. Biochem Biophys Res Commun. 2002;293:572. doi: 10.1016/S0006-291X(02)00257-7. [DOI] [PubMed] [Google Scholar]
- 778.Oberg K, Chrunyk BA, Wetzel R, Fink AL. Biochemistry. 1994;33:2628. doi: 10.1021/bi00175a035. [DOI] [PubMed] [Google Scholar]
- 779.Aymard P, Nicolai T, Durand D, Clark A. Macromolecules. 1999;32:2542. [Google Scholar]
- 780.Bauer R, Carrotta R, Rischel C, Ogendal L. Biophys J. 2000;79:1030. doi: 10.1016/S0006-3495(00)76357-0. [DOI] [PMC free article] [PubMed] [Google Scholar]
- 781.Cleland JL, Wang DIC. Biochemistry. 1990;29:11072. doi: 10.1021/bi00502a009. [DOI] [PubMed] [Google Scholar]
- 782.Wetlaufer DB, Xie Y. Protein Sci. 1995;4:1535. doi: 10.1002/pro.5560040811. [DOI] [PMC free article] [PubMed] [Google Scholar]
- 783.Hammarström P, Persson M, Freskgård P-O, Mårtensson L-G, Andersson D, Jonsson B-H, Carlsson U. J Biol Chem. 1999;274:32897. doi: 10.1074/jbc.274.46.32897. [DOI] [PubMed] [Google Scholar]
- 784.Hammarström P, Owenius R, Mårtensson L-G, Carlsson U, Lindgren M. Biophys J. 2001;80:2867. doi: 10.1016/S0006-3495(01)76253-4. [DOI] [PMC free article] [PubMed] [Google Scholar]
- 785.Karlsson M, Mårtensson L-G, Olofsson P, Carlsson U. Biochemistry. 2004;43:6803. doi: 10.1021/bi049709z. [DOI] [PubMed] [Google Scholar]
- 786.Cleland JL, Wang DIC. Bio/Technology. 1990;8:1274. doi: 10.1038/nbt1290-1274. [DOI] [PubMed] [Google Scholar]
- 787.Kundu B, Guptasarma P. Proteins: Struct, Funct, Genet. 1999;37:321. doi: 10.1002/(sici)1097-0134(19991115)37:3<321::aid-prot1>3.0.co;2-l. [DOI] [PubMed] [Google Scholar]
- 788.Cleland JL, Randolph TW. J Biol Chem. 1992;267:3147. [PubMed] [Google Scholar]
- 789.Sharma L, Sharma A. Eur J Biochem. 2001;268:2456. doi: 10.1046/j.1432-1327.2001.02125.x. [DOI] [PubMed] [Google Scholar]
- 790.Karuppiah N, Sharma A. Biochem Biophys Res Commun. 1995;211:60. doi: 10.1006/bbrc.1995.1778. [DOI] [PubMed] [Google Scholar]
- 791.Rozema D, Gellman SH. J Biol Chem. 1996;271:3478. doi: 10.1074/jbc.271.7.3478. [DOI] [PubMed] [Google Scholar]
- 792.Rozema D, Gellman SH. J Am Chem Soc. 1995;117:2373. [Google Scholar]
- 793.Sundari CS, Raman B, Balasubramanian D. FEBS Lett. 1999;443:215. doi: 10.1016/s0014-5793(98)01720-7. [DOI] [PubMed] [Google Scholar]
- 794.Gething MJ, Sambrook J. Nature. 1992;355:33. doi: 10.1038/355033a0. [DOI] [PubMed] [Google Scholar]
- 795.Becker J, Craig EA. Eur J Biochem. 1994;219:11. doi: 10.1007/978-3-642-79502-2_2. [DOI] [PubMed] [Google Scholar]
- 796.Brinker A, Pfeifer G, Kerner MJ, Naylor DJ, Hartl FU, Hayer-Hartl M. Cell. 2001;107:223. doi: 10.1016/s0092-8674(01)00517-7. [DOI] [PubMed] [Google Scholar]
- 797.Zahn R, Perrett S, Fersht AR. J Mol Biol. 1996;261:43. doi: 10.1006/jmbi.1996.0440. [DOI] [PubMed] [Google Scholar]
- 798.Zahn R, Perrett S, Stenberg G, Fersht AR. Science. 1996;271:642. doi: 10.1126/science.271.5249.642. [DOI] [PubMed] [Google Scholar]
- 799.Zahn R, Spitzfaden C, Ottiger M, Wuethrich K, Plueckthun A. Nature. 1994;368:261. doi: 10.1038/368261a0. [DOI] [PubMed] [Google Scholar]
- 800.The crystal structure of GroEL (see Braig, et al. Nature, 1994, 371, 578) shows a large tetradecameric complex comprising two seven-membered rings stacked on top of each other (see Saibil, H., Wood, S. Curr. Opin. Struct. Biol. 1993, 3, 207). The apical domains of the subunits expose hydrophobic binding surfaces toward the center of the ring and engage in multiple contacts with a nonnative substrate protein (see Farr et al. Cell 1997, 89, 927 and Fenton et al. Nature 1994, 371, 614). A second crystal structure shows GroEL bound to its co-chaperonin GroES (see Xu, Z., Horwich, A. L., Sigler, P. B. Nature, 1997, 388, 741). GroES is a 10 kDa subunit that binds as a heptamer to one of the seven-membered rings of GroEL; this process caps the central cavity and sequesters the misfolded protein in this cavity (see Langer, T., Pfeifer, G., Martin, J., Baumeister, W., Hartl, F. U. EMBO J. 1992, 11, 4757).
- 801.Landry SJ, Gierasch LM. Trends Biochem Sci. 1991;16:159. doi: 10.1016/0968-0004(91)90060-9. [DOI] [PubMed] [Google Scholar]
- 802.Ellis RJ, Hartl FU. FASEB J. 1996;10:20. doi: 10.1096/fasebj.10.1.8566542. [DOI] [PubMed] [Google Scholar]
- 803.Coyle JE, Jaeger J, Gross M, Robinson CV, Radford SE. Folding Des. 1997;2:R93. doi: 10.1016/S1359-0278(97)00046-1. [DOI] [PubMed] [Google Scholar]
- 804.Betancourt MR, Thirumalai D. J Mol Biol. 1999;287:627. doi: 10.1006/jmbi.1999.2591. [DOI] [PubMed] [Google Scholar]
- 805.Agard DA. Science. 1993;260:1903. doi: 10.1126/science.8100365. [DOI] [PubMed] [Google Scholar]
- 806.Ellis RJ. Curr Biol. 1994;4:633. doi: 10.1016/s0960-9822(00)00140-8. [DOI] [PubMed] [Google Scholar]
- 807.Wang JD, Weissman JS. Nature Struct Biol. 1999;6:597. doi: 10.1038/10636. [DOI] [PubMed] [Google Scholar]
- 808.Todd MJ, Viitanen PV, Lorimer GH. Science. 1994;265:659. doi: 10.1126/science.7913555. [DOI] [PubMed] [Google Scholar]
- 809.Shtilerman M, Lorimer GH, Englander SW. Science. 1999;284:822. doi: 10.1126/science.284.5415.822. [DOI] [PMC free article] [PubMed] [Google Scholar]
- 810.Saibil HR, Ranson NA. Trends Biochem Sci. 2002;27:627. doi: 10.1016/s0968-0004(02)02211-9. [DOI] [PubMed] [Google Scholar]
- 811.Csermely P. Bioassays. 1999;21:959. doi: 10.1002/(SICI)1521-1878(199911)21:11<959::AID-BIES8>3.0.CO;2-1. [DOI] [PubMed] [Google Scholar]
- 812.Brinkman R, Margaria R, Meldrum NU, Roughton FJW. Proc Physiol Soc J Physiol. 1932;75:3P. [Google Scholar]
- 813.Liu CG, Xu KQ, Xu X, Huang JJ, Xiao JC, Zhang JP, Song HP. Clin Exp Pharmacol Physiol. 2007;34:998. doi: 10.1111/j.1440-1681.2007.04675.x. [DOI] [PubMed] [Google Scholar]
- 814.Takacova M, Barathova M, Hulikova A, Ohradanova A, Kopacek J, Parkkila S, Pastorek J, Pastorekova S, Zatovicova M. Int J Oncology. 2007;31:1103. [PubMed] [Google Scholar]
- 815.Morgan PE, Pastorekova S, Stuart-Tilley AK, Alper SL, Casey JR. Am J Physiol, Cell Physiol. 2007;293:C738. doi: 10.1152/ajpcell.00157.2007. [DOI] [PubMed] [Google Scholar]
- 816.Weise A, Becker HM, Deitmer JW. J Gen Physiol. 2007;130:203. doi: 10.1085/jgp.200709809. [DOI] [PMC free article] [PubMed] [Google Scholar]
- 817.Supuran CT. Nat Rev Drug Discovery. 2008;7:168. doi: 10.1038/nrd2467. [DOI] [PubMed] [Google Scholar]
- 818.Alvarez BV, Vithana EN, Yang Z, Koh AH, Yeung K, Yong V, Shandro HJ, Chen Y, Kolatkar P, Palasingam P, Zhang K, Aung T, Casey JR. Invest Ophthalmol Visual Sci. 2007;48:3459. doi: 10.1167/iovs.06-1515. [DOI] [PubMed] [Google Scholar]
- 819.Gambhir KK, Ornasir J, Headings V, Bonar A. Biochem Genet. 2007;45:431. doi: 10.1007/s10528-007-9086-x. [DOI] [PubMed] [Google Scholar]
- 820.Kamsteeg M, Zeeuwen P, de Jongh GJ, Rodijk-Olthuis D, Zeeuwen-Franssen MEJ, van Erp PEJ, Schalkwijk J. J Invest Dermatol. 2007;127:1786. doi: 10.1038/sj.jid.5700752. [DOI] [PubMed] [Google Scholar]
- 821.Haapasalo J, Nordfors K, Jarvela S, Bragge H, Rantala I, Parkkila AK, Haapasalo H, Parkkila S. Neuro-Oncology. 2007;9:308. doi: 10.1215/15228517-2007-001. [DOI] [PMC free article] [PubMed] [Google Scholar]
- 822.Niemela AM, Hynninen P, Mecklin JP, Kuopio T, Kokko A, Aaltonen L, Parkkila AK, Pastorekova S, Pastorek J, Waheed A, Sly WS, Orntoft TF, Kruhoffer M, Haapasalo H, Parkkila S, Kivella AJ. Cancer Epidemiol, Biomarkers Prev. 2007;16:1760. doi: 10.1158/1055-9965.EPI-07-0080. [DOI] [PubMed] [Google Scholar]
- 823.Abdel-Hamid MK, Abdel-Hafez AA, El-Koussi NA, Mahfouz NM, Innocenti A, Supuran CT. Bioorg Med Chem. 2007;15:6975. doi: 10.1016/j.bmc.2007.07.044. [DOI] [PubMed] [Google Scholar]
- 824.Colinas PA, Bravo RD, Vullo D, Scozzafava A, Supuran CT. Bioorg Med Chem Lett. 2007;17:5086. doi: 10.1016/j.bmcl.2007.07.023. [DOI] [PubMed] [Google Scholar]
- 825.De Simone G, Supuran CT. Curr Top Med Chem. 2007;7:879. doi: 10.2174/156802607780636762. [DOI] [PubMed] [Google Scholar]
- 826.Dogne JM, Thiry A, Pratico D, Masereel B, Supuran CT. Curr Top Med Chem. 2007;7:885. doi: 10.2174/156802607780636717. [DOI] [PubMed] [Google Scholar]
- 827.Dudutiene V, Baranauskiene L, Matulis D. Bioorg Med Chem Lett. 2007;17:3335. doi: 10.1016/j.bmcl.2007.03.100. [DOI] [PubMed] [Google Scholar]
- 828.Edwards P. Drug Discovery Today. 2007;12:497. [Google Scholar]
- 829.Hemmateenejad B, Miri R, Tabarzad M, Jafarpour M, Shamsipur M. Drugs Future. 2007;32:86. [Google Scholar]
- 830.Hilvo M, Supuran CT, Parkkila S. Curr Top Med Chem. 2007;7:893. doi: 10.2174/156802607780636672. [DOI] [PubMed] [Google Scholar]
- 831.Innocenti A, Vullo D, Pastorek J, Scozzafava A, Pastorekova S, Nishimori I, Supuran CT. Bioorg Med Chem Lett. 2007;17:1532. doi: 10.1016/j.bmcl.2006.12.113. [DOI] [PubMed] [Google Scholar]
- 832.Kumar V, Madan AK. J Math Chem. 2007;42:925. [Google Scholar]
- 833.Mincione F, Scozzafava A, Supuran CT. Curr Top Med Chem. 2007;7:849. doi: 10.2174/156802607780636735. [DOI] [PubMed] [Google Scholar]
- 834.Nishimori I, Innocenti A, Vullo D, Scozzafava A, Supuran CT. Bioorg Med Chem. 2007;15:6742. doi: 10.1016/j.bmc.2007.08.008. [DOI] [PubMed] [Google Scholar]
- 835.Nishimori I, Innocenti A, Vullo D, Scozzafava A, Supuran CT. Bioorg Med Chem Lett. 2007;17:1037. doi: 10.1016/j.bmcl.2006.11.028. [DOI] [PubMed] [Google Scholar]
- 836.Nuti E, Orlandini E, Nencetti S, Rossello A, Innocenti A, Scozzafava A, Supuran CT. Bioorg Med Chem. 2007;15:2298. doi: 10.1016/j.bmc.2007.01.023. [DOI] [PubMed] [Google Scholar]
- 837.Pastorekova S, Kopacek J, Pastorek J. Curr Top Med Chem. 2007;7:865. doi: 10.2174/156802607780636708. [DOI] [PubMed] [Google Scholar]
- 838.Riley KE, Cui GL, Merz KM. J Phys Chem B. 2007;111:5700. doi: 10.1021/jp067313m. [DOI] [PubMed] [Google Scholar]
- 839.Safarian S, Bagheri F, Moosavi-Movahedi AA, Amanlou M, Sheibani N. Protein J. 2007;26:371. doi: 10.1007/s10930-007-9073-4. [DOI] [PubMed] [Google Scholar]
- 840.Salmon AJ, Williams ML, Innocenti A, Vullo D, Supuran CT, Poulsen SA. Bioorg Med Chem Lett. 2007;17:5032. doi: 10.1016/j.bmcl.2007.07.024. [DOI] [PubMed] [Google Scholar]
- 841.Santos MA, Marques S, Vullo D, Innocenti A, Scozzafava A, Supuran CT. Bioorg Med Chem Lett. 2007;17:1538. doi: 10.1016/j.bmcl.2006.12.107. [DOI] [PubMed] [Google Scholar]
- 842.Smaine FZ, Winum JY, Montero JL, Regainia Z, Vullo D, Scozzafava A, Supuran CT. Bioorg Med Chem Lett. 2007;17:5096. doi: 10.1016/j.bmcl.2007.07.019. [DOI] [PubMed] [Google Scholar]
- 843.Supuran CT. Curr Top Med Chem. 2007;7:823. doi: 10.2174/156802607780636690. [DOI] [PubMed] [Google Scholar]
- 844.Thiry A, Dogne J, Supuran CT, Masereel B. Curr Top Med Chem. 2007;7:855. doi: 10.2174/156802607780636726. [DOI] [PubMed] [Google Scholar]
- 845.Thiry A, Masereel B, Dogne JM, Supuran CT, Wouters J, Michaux C. Chem Med Chem. 2007;2:1273. doi: 10.1002/cmdc.200700057. [DOI] [PubMed] [Google Scholar]
- 846.Vitale RM, Pedone C, Amodeo P, Antel J, Wurl M, Scozzafava A, Supuran CT, De Simone G. Bioorg Med Chem. 2007;15:4152. doi: 10.1016/j.bmc.2007.03.070. [DOI] [PubMed] [Google Scholar]
- 847.Wilkinson BL, Bornaghi LF, Houston TA, Innocenti A, Vullo D, Supuran CT, Poulsen SA. J Med Chem. 2007;50:1651. doi: 10.1021/jm061320h. [DOI] [PubMed] [Google Scholar]
- 848.Wilkinson BL, Bornaghi LF, Houston TA, Innocenti A, Vullo D, Supuran CT, Poulsen SA. Bioorg Med Chem Lett. 2007;17:987. doi: 10.1016/j.bmcl.2006.11.046. [DOI] [PubMed] [Google Scholar]
- 849.Winum JY, Scozzafava A, Montero JL, Supuran CT. Curr Top Med Chem. 2007;7:835. doi: 10.2174/156802607780636771. [DOI] [PubMed] [Google Scholar]
- 850.Winum JY, Thiry A, El Cheikh K, Dogne JM, Montero JL, Vullo D, Scozzafava A, Masereel B, Supuran CT. Bioorg Med Chem Lett. 2007;17:2685. doi: 10.1016/j.bmcl.2007.03.008. [DOI] [PubMed] [Google Scholar]
- 851.Nishimori I, Onishi S, Vullo D, Innocenti A, Scozzafava A, Supuran CT. Bioorg Med Chem. 2007;15:5351. doi: 10.1016/j.bmc.2007.03.004. [DOI] [PubMed] [Google Scholar]
- 852.Vullo D, Innocenti A, Nishimori I, Scozzafava A, Kaila K, Supuran CT. Bioorg Med Chem Lett. 2007;17:4107. doi: 10.1016/j.bmcl.2007.05.052. [DOI] [PubMed] [Google Scholar]
- 853.Vullo D, Nishimori I, Innocenti A, Scozzafava A, Supuran CT. Bioorg Med Chem Lett. 2007;17:1336. doi: 10.1016/j.bmcl.2006.11.075. [DOI] [PubMed] [Google Scholar]
- 854.Clare BW, Supuran CT. Expert Opin Drug Metab Toxicol. 2006;2:113. doi: 10.1517/17425255.2.1.113. [DOI] [PubMed] [Google Scholar]
- 855.Eroglu E, Turkmen H, Guler S, Palaz S, Oltulu O. Int J Mol Sci. 2007;8:145. [Google Scholar]
- 856.Huang HQ, Pan XL, Tan NH, Zeng GZ, Ji CJ. Eur J Med Chem. 2007;42:365. doi: 10.1016/j.ejmech.2006.09.022. [DOI] [PubMed] [Google Scholar]
- 857.Jalah-Heravi M, Kyani A. Eur J Med Chem. 2007;42:649. doi: 10.1016/j.ejmech.2006.12.020. [DOI] [PubMed] [Google Scholar]
- 858.Khadikar PV, Clare BW, Balaban AT, Supuran CT, Agarwal VK, Singh J, Joshi AK, Lakwani M. Rev Roum Chim. 2006;51:703. [Google Scholar]
- 859.Kumar S, Singh V, Tiwari M. Med Chem. 2007;3:379. doi: 10.2174/157340607781024447. [DOI] [PubMed] [Google Scholar]
- 860.Laszlo T. Rev Chim. 2007;58:191. [Google Scholar]
- 861.Singh S, Singh J, Ingle M, Mishra R, Khadikar PV. ARKIVOC. 2006;xvi:1. [Google Scholar]
- 862.Singh J, Lakhwani M, Khadikar PV, Balaban AT, Clare BW, Supuran CT. Rev Roum Chim. 2006;51:691. [Google Scholar]
- 863.Tarko L, Supuran CT. Bioorg Med Chem. 2007;15:5666. doi: 10.1016/j.bmc.2007.06.009. [DOI] [PubMed] [Google Scholar]
- 864.Tuccinardi T, Nuti E, Ortore G, Supuran CT, Rossello A, Martinelli A. J Chem Inf Model. 2007;47:515. doi: 10.1021/ci600469w. [DOI] [PubMed] [Google Scholar]
- 865.Henunateenejad B, Miri R, Jafarpour M, Tabarzad M, Shamsipur M. QSAR Comb Sci. 2007;26:1065. [Google Scholar]
- 866.Singh J, Shaik B, Singh S, Sikhima S, Agrawal VK, Khadikar PV, Supuran CT. Bioorg Med Chem. 2007;15:6501. doi: 10.1016/j.bmc.2007.07.004. [DOI] [PubMed] [Google Scholar]
- 867.Patil S, Reshetnikov S, Haldar MK, Seal S, Mallik S. J Phys Chem C. 2007;111:8437. [Google Scholar]
- 868.Mayer M, Semetey V, Gitlin I, Yang J, Whitesides GM. J Am Chem Soc. 2008;130:1453. doi: 10.1021/ja077555f. [DOI] [PMC free article] [PubMed] [Google Scholar]
- 869.Maupin CM, Voth GA. Biochemistry. 2007;46:2938. doi: 10.1021/bi062170f. [DOI] [PMC free article] [PubMed] [Google Scholar]
- 870.Miscione GP, Stenta M, Spinelli D, Anders E, Bottoni A. Theor Chem Acc. 2007;118:193. [Google Scholar]
- 871.Roy A, Taraphder S. J Phys Chem B. 2007;111:10563. doi: 10.1021/jp073499t. [DOI] [PubMed] [Google Scholar]
- 872.Shimahara H, Yoshida T, Shibata Y, Shimizu M, Kyogoku Y, Sakiyama F, Nakazawa T, Tate S, Ohki S, Kato T, Moriyama H, Kishida K, Tano Y, Ohkubo T, Kobayashi Y. J Biol Chem. 2007;282:9646. doi: 10.1074/jbc.M609679200. [DOI] [PubMed] [Google Scholar]
- 873.Silverman DN, McKenna R. Acc Chem Res. 2007;40:669. doi: 10.1021/ar7000588. [DOI] [PubMed] [Google Scholar]
- 874.Caprita R, Caprita A, Ilia G, Ciucanu I. Rev Chim. 2006;57:1112. [Google Scholar]
- 875.Hollowell HN, Younvanich SS, McNevin SL, Britt BM. J Biochem Mol Biol. 2007;40:205. doi: 10.5483/bmbrep.2007.40.2.205. [DOI] [PubMed] [Google Scholar]
- 876.Sarraf NS, Saboury AA, Nemati T, Karbassi F. Asian J Chem. 2007;19:531. [Google Scholar]
- 877.Yan M, Liu ZX, Lu DN, Liu Z. Biomacromolecules. 2007;8:560. doi: 10.1021/bm060746a. [DOI] [PubMed] [Google Scholar]
- 878.Yazdanparast R, Khodarahmi R. Int J Biol Macromol. 2007;40:319. doi: 10.1016/j.ijbiomac.2006.08.018. [DOI] [PubMed] [Google Scholar]