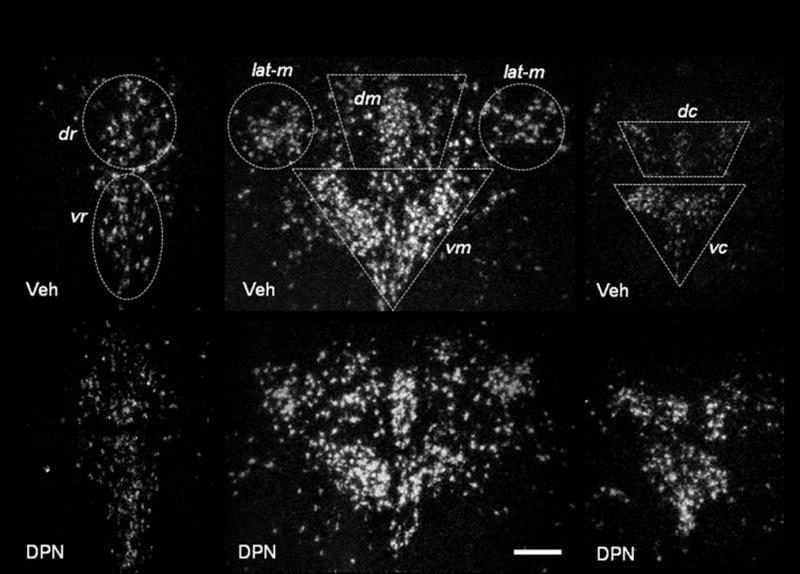
Figure 2.

Representative dark-field photomicrographs from experiment 1. Shown are cells expressing tph2 mRNA in the rostral (left side, bregma −7.3), mid- (middle, bregma −8.0) and caudal DRN (right side, bregma −8.7) of systemically vehicle- or DPN-treated OVX animals. Vehicle-treated animals (Veh) are shown in the top row of panels, DPN-treated rats (DPN) in the lower row of panels. dr = dorso-rostral, vr = ventro-rostral, dm = dorso-mid, vm = ventro-mid, lat-m = lateral mid, dc = dorso-caudal, vc = ventro-caudal. Scale bar: 40 μm.
