

Abstract
The tailless (tlx) gene is a forebrain-restricted transcription factor. Tlx mutant animals exhibit a reduction in the size of the cerebral hemispheres and associated structures (Monaghan et al., 1997). Superficial cortical layers are specifically reduced, whereas deep layers are relatively unaltered (Land and Monaghan, 2003). To determine whether the adult laminar phenotype has a developmental etiology and whether it is associated with a change in proliferation/differentiation decisions, we examined the cell cycle and neurogenesis in the embryonic cortex. We found that there is a temporal and regional requirement for the Tlx protein in progenitor cells (PCs). Neurons prematurely differentiate at all rostrocaudal levels up to mid-neurogenesis in mutant animals. Heterozygote animals have an intermediate phenotype indicating there is a threshold requirement for Tlx in early cortical neurogenesis. Our studies indicate that PCs in the ventricular zone are sensitive to loss of Tlx in caudal regions only; however, PCs in the subventricular zone are altered at all rostrocaudal levels in tlx-deficient animals. Furthermore, we found that the cell cycle is shorter from embryonic day 9.5 in tlx–/– embryos. At mid-neurogenesis, the PC population becomes depleted, and late PCs have a longer cell cycle in tlx-deficient animals. Consequently, later generated structures, such as upper cortical layers, the dentate gyrus, and the olfactory bulbs, are severely reduced. These studies indicate that tlx is an essential intrinsic regulator in the decision to proliferate or differentiate in the developing forebrain.
Keywords: cortex, lamination, mouse, tailless, transcription factor, limbic system, neurogenesis, BrdU
Introduction
The precise assembly of neuronal circuits requires that the correct numbers and types of cells are present at appropriate locations. In the mammalian cerebral cortex, neurons with similar connections and functional properties are grouped into six distinct layers and sequentially arise from discrete progenitor cell (PC) populations (Angevine and Sidman, 1961; Rakic, 1974, 1988; Bayer and Altman, 1991; McConnell, 1995; Tarabykin et al., 2001; Noctor et al., 2004). Two decisions govern PC behavior in the developing cerebral cortex: the decision to reenter or exit the cell cycle and, concomitantly, the decision to differentiate into a neuron with a defined laminar fate. How these complex processes are orchestrated during development is a central question in determining the construction and function of the cerebral cortex.
Previous studies have indicated that the laminar potential of PCs is specified through environmental interactions at the time of terminal mitotic division of the cell and that this potential changes over time: early PCs are multipotential, whereas later PCs show a greater restriction in their laminar potential (Luskin et al., 1988; Rakic, 1988; Walsh and Cepko, 1988; McConnell and Kaznowski, 1991; McConnell, 1995; Desai and McConnell, 2000). Cortical PCs in the ventricular zone (VZ) and subventricular zone (SVZ) produce neurons destined for the cortical plate (CP) over 11 cell cycles during a 6 d period (Takahashi et al., 1999). These studies have demonstrated that cell cycle length increases with time and that the proliferative behavior of cells within the VZ differs fundamentally from that of cells of the SVZ (Takahashi et al., 1993, 1994, 1995a,b, 1996; Caviness and Takahashi, 1995; Cai et al., 1997a,b; Miyama et al., 1997). The VZ is the source of most deep layer neurons. The SVZ, which is seeded by the VZ at approximately embryonic day 13.5 (E13.5), has been shown to be the source of at least some upper layer cortical neurons, in addition to glia (Tarabykin et al., 2001). These findings therefore demonstrated the importance of the cell cycle in restricting cell fate.
Several transcription factors and cell cycle regulators have been identified as intrinsic regulators of the decision to proliferate or differentiate (Ishibashi et al., 1994, 1995; Casarosa et al., 1999; Ohtsuka et al., 1999, 2001; Sun et al., 2001). Increasing or decreasing the levels of these proteins during development upsets the balance between PC and differentiated cell number and can lead to alterations in the surface area and thickness of specific laminas of the mature cortex (Caviness and Takahashi, 1995; Rakic, 1995a; Kornack and Rakic, 1998; Super and Uylings, 2001; Chenn and Walsh, 2002, 2003; Caviness et al., 2003). These studies present the tantalizing hypothesis that cell cycle length and output are tied to laminar specification.
We have previously shown that loss of the forebrain-restricted transcription factor tailless (tlx) leads to a reduction in the depth and surface area of the cerebral cortex and distinct behavioral abnormalities in adults (Monaghan et al., 1995, 1997; Roy et al., 2002). The most salient cortical phenotype in the adult is that superficial layers are selectively reduced (Land and Monaghan, 2003). Disruption of the tlx gene could lead to cell loss via regulation of cell proliferation, differentiation, or survival. Recent studies have suggested that tlx is required for proliferation and maintenance of multipotency in adult PCs (Shi et al., 2004). Here, we have directly tested the hypothesis that loss of superficial cortical layers in the adult is attributable to alterations in proliferation of a distinct population of cortical PCs in the embryo.
Materials and Methods
Animals
Wild-type and mutant animals were obtained from crossings of heterozygous mice (SVE129 × C57BL/6J) from the 10th generation backcross to C57BL/6J and were genotyped by PCR as described previously (Monaghan et al., 1997). For all experiments, wild-type and homozygous mutant embryos from the same litter were compared, and the data were pooled.
Bromodeoxyuridine incorporation studies
Nineteen pregnant dams received injections at E9.5, E12.5, E14.5, E16.5, or E18.5 with 50 μg/gm bromodeoxyuridine (BrdU; Sigma, St. Louis, MO) dissolved in sterile 0.9% NaCl and 0.007 m NaOH. Three to five litters at each indicated age were killed 15 min (E9.5), 1 hr (E12.5, E14.5), or 2 hr (E16.5, E18.5) after injection for short-term BrdU studies (Takahashi et al., 1995a,b). For long-term BrdU studies, three pregnant dams received injections of a single dose of BrdU on E13.5 and E14.5, and brains were collected at postnatal day 30 (P30). In addition, three pregnant dams per time point received injections of a single dose of BrdU at E14.5 and were killed after 15, 30, or 60 min (for interkinetic nuclear migration analysis) or 24 hr (for Q fraction) after injection. Embryos were infusion fixed (E9.5–E16.5) or perfused transcardially (E18.5 and P30) with 4% paraformaldehyde (pH 7.4; Sigma) and postfixed for 3 hr at 4°C. After isolation, embryos were stage matched to verify there were no differences in within-litter embryo age. The tissue was cryoprotected with increasing grades of sucrose (10–30%) and coronally sectioned at 30 μm on a cryostat.
Imunohistochemistry and in situ hybridization
Age-matched tlx–/– and tlx+/+ sections at the level of the rostral, intermediate, and caudal dorsolateral cortex were air dried and washed in 0.1% Triton in PBS. Sections were blocked in 10% heat-inactivated normal goat serum (Jackson ImmunoResearch, West Grove, PA) and 1% bovine serum albumin (Fisher Scientific, Pittsburgh, PA) in PBS. Before incubation with the anti-BrdU antibody [mouse-α-BrdU, 1:500 in blocking solution (Sigma); or rat-α-BrdU, 1:40 (ABCAM, Cambridge, MA)], the sections were postfixed in cold acetone, and BrdU was unmasked in 2N HCl for 40 min at 37°C and neutralized with 0.1 m sodium borate, pH 8.6. Adjacent sections were incubated with antibodies against Map2 (1:1000; Sigma), Tuj1 (1:1000; Sigma), calretinin (Cr; 1:500; Chemicon, Temecula, CA), phosphohistone H3 (1:200; United States Biochemicals, Cleveland, OH), RC2 (1:10; Developmental Hybridoma Bank, Iowa City, IA), Fas (1:2500; Transduction Laboratories, Lexington, KY), Fas-ligand (1:2500; Transduction Laboratories), or activated caspase 3 (1:250; Promega, Madison, WI). The tissue was then washed in PBS, incubated with the appropriate Cy3 and/or Cy2 secondary antibody (Jackson ImmunoResearch), and counterstained with 1,6-diamidino-2-phenylindole dihydrochloride (DAPI; Sigma) before mounting in fluormount (Southern Biotechnology Research, Birmingham, AL). For longterm BrdU studies, offspring were collected at P30 and processed as described previously (Monaghan et al., 1997). Terminal deoxynucleotidyl transferase-mediated biotinylated UTP nick end labeling (TUNEL) staining was performed per the manufacturer's (Boehringer Mannheim, Indianapolis, IN) instructions. In situ hybridizations and posthybridizations were performed as described previously (Wilkinson, 1995).
Analysis
Cell counts. Left and right hemispheres of three to five nonadjacent, 30-μm-thick sections per brain region (rostral, intermediate, and caudal) were photographed. Sections of the dorsal and lateral cortex were selected at three different rostrocaudal levels by an observer blind to genotype (n = 3 E9.5, n = 4 E12.5-E16.5, n = 5 E18.5). Rostral sections were defined by the rostral boundary of the lateral ganglionic eminence (LGE). Intermediate sections were identified by the presence of a clearly defined LGE and medial ganglionic eminence (MGE). Caudal sections were defined by the presence of the caudal ganglionic eminence. At E9.5, the total number of DAPI-, BrdU-, and Cr-labeled cells in the entire dorsal VZ and preplate (PP) were counted per hemisphere. From E12.5 to E18.5, a 150-μm-wide window encompassing the entire cerebral wall, from the pial to ventricular surfaces, was selected for analysis. Different subregions of the cerebral wall were identified based on cell morphology and cell density. The following subregions were examined: the VZ, PP (E9.5–E12.5), SVZ (E16.5–E18.5; at E14.5 the VZ and SVZ were considered together), intermediate zone (IZ; E14.5–E18.5), and CP (E14.5–E18.5). Both the total cell number and thickness of the VZ, SVZ, IZ, PP, and CP of the cerebral wall were compared between genotypes in the different regions, and ages were examined.
Sections were visualized on a Nikon (Melville, NY) fluorescent microscope and photographed at 40× magnification with a Photometrics (North Reading, MA) Cool Snap digital camera and IP Lab software (Biovision Technologies, Exton, PA). Photographs were imported into Photoshop 6.0 (Adobe Systems, San Jose, CA), and composites of each section were aligned. To discriminate individual regions within the cortical wall, composites were magnified 200×, and cell morphology was examined. The following criteria were used to identify specific layers according to Bayer and Altman (1991). The VZ was defined by the presence of compact parallel lines of elongated nuclei perpendicular to the ventricular surface. The SVZ was arbitrarily defined as the boundary parallel-oriented cells with elongated nuclei of the VZ and a compact cell layer of cells containing round nuclei (SVZ). In addition, for short-term BrdU experiments (15 min to 2 hr), the border between the VZ and SVZ was clearly defined by the presence of a band of BrdU-labeled cells in the S-zone of parallel-oriented cells of the VZ and scattered labeled round cells in the SVZ. Furthermore, adjacent sections were single or double labeled with antibodies to phosphohistone H3 and Tuj1. In this way, the number of differentiating cells in the PC compartment (VZ or SVZ) could be estimated, and the border between PCs and differentiated cells in the IZ could be distinguished clearly with the Tuj1 antibody. Phosphohistone H3 labeling was used to distinguish PCs in the two proliferative regions as immunopositive cell bodies lined the ventricular surface of the VZ, whereas phosphohistone-positive cells were randomly scattered throughout SVZ. The IZ contained fewer cells than proliferative regions and were generally tangentially oriented. The packing density of cell nuclei was significantly increased in the CP compared with the IZ, and the nuclei were organized in a palisade-like manner. Lines were drawn at the border of each cortical region. Images were examined under normal (RGB) as well as red- or blue-specific channels in Photoshop. BrdU-positive cells were labeled manually with a yellow dot in the red channel after identification of the corresponding DAPI-positive nucleus in the RGB channel. DAPI-positive/BrdU-negative nuclei were then marked manually with a pink dot in the blue channel at 200× magnification. Blood vessels were occasionally immunopositive but were identified by their morphology and excluded from the study. Dotted and labeled images were imported into a counting program (designed by Nicholas Roy, Massachusetts Institute of Technology, Cambridge, MA), and the number of yellow and pink dots was calculated per region. The data were then imported into Excel (XP; Microsoft, Seattle, WA). To perform the statistical analysis, sections were decoded, and genotypes were identified and pooled as described. Genotypes were compared with a one-way ANOVA in SPSS software (version 10.1; SPSS Inc., Chicago, IL).
Statistics for the labeling indices. For each mouse, the labeling index (LI) was calculated per region as the number of BrdU-positive cells/total cell number. The average LI was obtained within each of the six regions: the dorsal (D) and lateral (L) areas of the rostral (R), intermediate (I), and caudal (C) regions. Because these averages are binomial proportions, the arcsin square root transformation was performed for each of them to stabilize the variance and to refine the statistical analysis (Snedecor and Cochran, 1980). These six transformed averages were treated as correlated observations on each animal in the statistical data analysis. In the model used, the observations of the six regions were considered as exchangeably correlated and were treated as repeated measurements with a compound symmetric covariance structure (Littell et al., 1996). To model variation in both the age and position simultaneously, the multivariate analysis of covariance (MANCOVA) model was used and included genotype as main effect, R-I-C and D-L as within-subject effects, age as a continuous covariate, and all two-factor and three-factor interactions. Throughout type III, the sum of squares was used.
Because there was a very strong three-factor interaction between age, genotype, and position, reduced models were performed for each position (R, I, C). In the reduced models, the observations on the dorsal and lateral regions were treated as repeated measures with a compound symmetric covariance structure. To assess whether there is interaction between age and genotype within each position, the preliminary MANCOVA model was used and had genotype as main effect, D-L as a within-subject effect, age as a continuous covariate, and examined two-factor interactions. After removing the nonsignificant terms, the final models had genotype as the main effect, age as continuous covariate, and examined the two-factor interaction between age and genotype. Based on biological considerations, one-sided testing was used to test the effect of age and genotype. The one-sided p values between age and genotype effect are reported. For the regions with significant age and genotype effect, the two arcsin square root observations for the dorsal and lateral regions were averaged, and t tests performed. The repeated measure analyses were implemented in SAS PROC MIXED (Littell et al., 1996). All the tests conducted in our analyses were done at p = 0.05 levels.
Quitting fraction. To determine the number of cells leaving the cell cycle [quitting fraction (Q fraction)], animals received injections of BrdU and were killed after 24 hr. Rostral, intermediate, and caudal sections of the telencephalon from animals that received injections at E13.5 and caudal sections of animals that injections at E14.5 were stage matched and double labeled with antibodies against BrdU and Tuj1. A 150-μm-wide and 30-μm-thick section of tissue was analyzed (n = 3/genotype). The total cell number in each region was calculated. The proliferating fraction (P fraction) was calculated as the number of BrdU-positive and Tuj1-negative cells of the total labeled population. The Q fraction was determined as the number of BrdU and Tuj1 double-positive cells in the labeled population. Means, SEM, and SD were calculated and compared in InStat (GraphPad Software, San Diego, CA).
For animals that received injections at E16.5 and were analyzed at E17.5, matched sections were selected and double labeled with antibodies against BrdU and Tuj1. A 150-μm-wide and 30-μm-thick section of tissue was analyzed (n = 3/genotype). The total number of BrdU-positive/Tuj1-negative and BrdU-positive/Tuj1-positive cells that were located in the VZ/SVZ or in the IZ and CP was calculated and compared between wild-type and mutant animals. The proportion of means, SEMs, and SDs were calculated and compared in InStat.
Long-term BrdU studies. To determine which cortical layer was born on E13.5 (n = 3) or E14.5 (n = 2), the laminar location and distribution of BrdU-positive cells were compared in layers I–VI of the somatosensory, motor, retrosplenial agranular, and granular cortex in 30- to 40-d-old tlx+/+ and tlx–/– adult animals. Laminar position was determined by cell packing density using either Nissl-stained or DAPI-stained sections.
Results
PCs are reduced in the developing cerebral cortex of tlx-deficient animals
The tlx gene is expressed exclusively in decreasing rostral to caudal and dorsal to ventral gradients of expression in PC domains of the telencephalon (Monaghan et al., 1995; Stenman et al., 2003b). Disruption of tlx leads to a reduction in the surface area and a 20% reduction in the depth of the occipital, parietal, and frontal cerebral lobes in adults (Monaghan et al., 1997; Land and Monaghan, 2003). This is primarily attributable to depletion of superficial cortical laminas (Land and Monaghan, 2003). Recently, tlx has been shown to be required for proliferation and maintenance of multipotency in adult PCs (Shi et al., 2004). To determine whether these laminar-specific deficits result from a prenatalrequirement for the tlx gene, we examined the development of the cortex from E9.5 until E18.5 in wild-type and mutant animals.
Both the population of excitatory neurons, mainly derived from PCs of the dorsal telencephalon, and inhibitory interneurons, generated ventrally in the MGE, are reduced in adult animals lacking tlx. The deficits observed in upper cortical layers could be the consequence of loss of one or both of these cell types. Indeed, in the ventral telencephalon of tlx–/– animals, the LGE and MGE have a flattened appearance beginning at E12.5 until birth compared with control animals, suggesting that there are fewer proliferating cells (Fig. 1A–L; arrows). The dorsal telencephalon is visibly reduced in size from E14.5 (Fig. 1, compare F, H). To identify the cell types and cortical regions targeted by loss of the Tlx protein, we have focused our studies on the alterations in the dorsal telencephalon. To determine whether there is a regional requirement for tlx in the dorsal telencephalon, three different rostrocaudal levels and two different mediolateral regions [Fig. 1A, dorsal cortex (a) and lateral cortex (b)] were examined histologically. For each region, the distance from the pial surface to the ventricular surface was measured, and the number of cells per 150-μm-wide bin was quantified (n = 3–5 per genotype) from E9.5 until birth. In all sections examined, no differences in somal cell size were observed in tlx+/+ and tlx–/– embryos.
Figure 1.

Absence of tlx leads to a reduction in the size of the cerebral wall. DAPI-stained coronal sections of E12.5 (A–D), E14.5 (E–H), and E18.5 (I–L) in wild-type (A, B, E, F, I, J) and mutant (C, D, G, H, K, L) embryos are shown. Initially, the cerebral wall is similar in size between wild-type and mutant animals (A–D, M). However, from E14.5, the cerebral wall is reduced in size in mutant animals (E–H, M). The ganglionic eminences are flattened in appearance, and the VZ/SVZ thickness is decreased in tlx-deficient animals (C, G, K; arrows). A, Regions examined for BrdU incorporation include the dorsal and lateral telencephalon (a, b). M, Quantification of total cell number in the dorsal telencephalon from E9.5 until E18.5. The gray bars represent wild-type animals, and the black bars represent tlx–/– embryos. MZ, Marginal zone. Scalebars: A, C, E, G, I, K, 100 μm; B, D, F, H, J, L,25 μm. *p < 0.05; **p < 0.01; ***p < 0.0001.
In the dorsal telencephalon, the total number of cells in the cerebral wall is initially similar in wild-type and mutant littermates (from E9.5 to E12.5) (Fig. 1A–D,M; Table 1). However, at E14.5, rostral to caudal differences are observed in the total number of cells in the cerebral wall of tlx–/– animals compared with tlx+/+ littermates. Rostrally, no difference was found, but at intermediate and caudal levels, the number of cells in tlx–/– embryos was reduced by 15% (Table 1; Fig. 1E–H,M). From E16.5, the cell number is decreased at all rostrocaudal levels examined (Table 1, Fig. 1M). At the end of gestation (E18.5), the thickness of the entire dorsal telencephalic wall is decreased by 12–20% across all cortical areas (Table 1; Fig. 1I–L,M) in the absence of Tlx. These findings suggest that the 20% decrease observed in the depth of the adult tlx–/– cortex is not attributable to postnatal loss but is of developmental origin.
Table 1.
Total cell number in the dorsal telencephalon of tlx+/+ and tlx-/- embryos throughout neurogenesis
|
|
Total cells |
SEM |
|
||||
|---|---|---|---|---|---|---|---|
|
|
+/+ |
-/- |
+/+ |
-/- |
p value |
||
| E9.5 | |||||||
| R | 14.89 | 14.87 | 0.45 | 0.39 | 0.97934 | ||
| C | 13.74 | 14.52 | 0.79 | 0.47 | 0.52496 | ||
| E12.5 | |||||||
| R | 134.67 | 129.95 | 5.35 | 4.24 | 0.48874 | ||
| I | 135.45 | 126.25 | 4.01 | 3.99 | 0.12069 | ||
| C | 141.44 | 141.48 | 6.59 | 5.93 | 0.9963 | ||
| E14.5 | |||||||
| R | 436.90 | 409.45 | 30.06 | 24.61 | 0.49 | ||
| I | 380.71 | 331.31 | 16.09 | 12.23 | 0.017 | ||
| C | 389.64 | 349.77 | 10.69 | 11.56 | 0.014 | ||
| E16.5 | |||||||
| R | 718.46 | 598.79 | 30.01 | 25.25 | 0.00378 | ||
| I | 657.69 | 551.50 | 22.15 | 26.90 | 0.00479 | ||
| C | 682.70 | 541.77 | 27.85 | 25.23 | 0.00054 | ||
| E18.5 | |||||||
| R | 780.90 | 689.33 | 32.53 | 23.00 | 0.0236 | ||
| I | 692.61 | 588.19 | 24.94 | 15.17 | 0.00057 | ||
| C |
710.29 |
565.78 |
20.04 |
17.29 |
6.55 × 10⁻⁷
|
||
The mean and SEM number of cells in the VZ, SVZ, IZ, and CP is shown at the R, I, and C levels. The Student's t test p values are also shown.
Because expression of tlx is confined to PCs during these developmental stages, alterations in PC proliferation, differentiation, or death could underlie the observed cortical hypoplasia in mutant animals. We first examined cell death in wild-type versus mutant littermates. To determine whether apoptotic cell death contributes to cell loss in mutant animals, TUNEL labeling and immunohistochemical staining for activated caspase-3, Fas, and Fas-ligand was performed between E9.5 and E18.5. Enhanced apoptosis was observed in the corticostrial boundary (data not shown). This boundary is altered in tlx-deficient animals (Stenman et al., 2003a,b). However, no significant differences were detected in either mitotic or postmitotic regions (data not shown) in the dorsal or ventral telencephalon in wild-type versus mutant littermates.
To determine whether the partitioning of cells to mitotic or postmitotic compartments was similar between mutant and wild-type animals, we quantified the number of cells in different layers of the cerebral wall, including the PC populations in the VZ and SVZ, migrating cells in the IZ, and differentiating cells in the PP and CP (E9.5–E14.5) (Fig. 2A–H). Initially, there is no significant difference in the number of PCs between wild-type and mutant animals. From E12.5, we found significant regional differences in the response of PCs to loss of the Tlx protein. Rostrally, the number of PCs in wild-type and mutant animals is similar up to E16.5. At intermediate and caudal regions, the number of PCs is decreased to 80% of wild type at E14.5 (Fig. 2, Table 2) (n = 4). At E16.5, the number of PCs (combining cells in both the VZ and SVZ) in mutant animals is reduced at all levels to 72–78% of wild-type (rostral: tlx+/+, 320.58 ± 22.88; tlx–/–, 246 ± 11.87; p = 0.0058; intermediate: tlx+/+, 290.63 ± 16.67; tlx–/–, 210.56 ± 11.93; p = 0.0005; caudal: tlx+/+, 279.18 ± 21.15; tlx–/–, 217.41 ± 11.95; p = 0.0096; n = 4). By E18.5, PCs in rostral regions have recovered, however, intermediate and caudal regions show reductions of 75–83%, respectively (rostral: tlx+/+, 222.84 ± 11.55; tlx–/–, 194.73 ± 17.96; p = 0.199; intermediate: tlx+/+, 226.04 ± 18.64; tlx–/–, 168.96 ± 13.50; p = 0.0148; caudal: tlx+/+, 199.18 ± 10.59; tlx–/–, 167 ± 9.17; p = 0.0247; n = 5). These findings indicate that the decreased number of cells observed in tlx-deficient animals from E14.5 is attributable in part to a reduction in the number PCs in the VZ.
Figure 2.

Caudal PCs are more sensitive to loss of tlx. The total cell number in different regions of the cerebral wall from E9.5 to E18.5 is shown. A–N, Gray bars represent wild-type animals, and black bars represent tlx–/– embryos. The total number of cells in the VZ and PP in the telencephalon is shown at E9.5 (A, B; in the entire dorsal hemisphere/100) and E12.5 (C–E; in a 150-μm-wide segment). F–N, Total number of cells in the VZ, SVZ, IZ, and CP of a 150-μm-wide segment of the dorsal cerebral wall from E14.5 to E18.5. C–E, Increased number of postmitotic cells in the PP of tlx–/– embryos compared with wild type at E12.5. F–H, At E14.5, the number of cells in the VZ and IZ of tlx mutant animals is reduced caudally (H). The number of cells in the CP is increased caudally in mutant animals (H). I–K, Significant reductions in cell number were observed in the SVZ and IZ of E16.5 tlx–/– both rostrally and caudally, whereas the VZ is reduced caudally at E16.5 compared with tlx+/+ animals (K). At E18.5 (L–N), the SVZ and CP of tlx-deficient embryos were significantly reduced in cell number both rostrally (L) and caudally (N). *p < 0.05; **p < 0.01; ***p < 0.0001.
Table 2.
Regional differences in cell number in tlx-deficient compared with control littermates
|
|
Number of cells |
|
|
|
SEM |
|
|
|
|---|---|---|---|---|---|---|---|---|
|
|
VZ |
SVZ |
IZ |
CP |
VZ |
SVZ |
IZ |
CP |
| E9.5 | ||||||||
| R | ||||||||
| +/+ | 12.79 | 2.10 | 0.36 | 0.11 | ||||
| -/- | 12.59 | 2.28 | 0.30 | 0.18 | ||||
| p value | 0.68583 | 0.470629 | ||||||
| C | ||||||||
| +/+ | 12.14 | 1.60 | 0.76 | 0.08 | ||||
| -/- | 12.90 | 1.61 | 42.50 | 0.08 | ||||
| p value | 0.5181 | 0.920279 | ||||||
| E12.5 | ||||||||
| R | ||||||||
| +/+ | 118.83 | 15.83 | 5.23 | 1.38 | ||||
| -/- | 109.14 | 20.82 | 4.04 | 1.49 | ||||
| p value | 0.14403 | 0.02106 | ||||||
| I | ||||||||
| +/+ | 117.85 | 17.60 | 4.39 | 1.59 | ||||
| -/- | 105.07 | 21.18 | 3.55 | 1.51 | ||||
| p value | 0.02735 | 0.116861 | ||||||
| C | ||||||||
| +/+ | 127.44 | 14.00 | 6.15 | 1.57 | ||||
| -/- | 120.52 | 20.96 | 6.30 | 1.43 | ||||
| p value | 0.46115 | 0.002914 | ||||||
| E14.5 | ||||||||
| R | ||||||||
| +/+ | 192.08 | 172.50 | 72.39 | 8.38 | 19.32 | 8.46 | ||
| -/- | 173.93 | 163.50 | 72.02 | 8.41 | 20.83 | 6.23 | ||
| p value | 0.13146 | 0.75316 | 0.972512 | |||||
| I | ||||||||
| +/+ | 183.83 | 135.00 | 61.88 | 10.01 | 9.95 | 8.40 | ||
| -/- | 158.80 | 110.00 | 62.51 | 7.18 | 8.20 | 6.96 | ||
| p value | 0.04626 | 0.05644 | 0.954394 | |||||
| C | ||||||||
| +/+ | 194.51 | 140.13 | 55.00 | 6.69 | 7.97 | 5.57 | ||
| -/- | 149.80 | 117.33 | 82.63 | 6.99 | 8.43 | 5.97 | ||
| p value | <0.0001 | 0.05581 | 0.001303 | |||||
| E16.5 | ||||||||
| R | ||||||||
| +/+ | 151.08 | 169.50 | 164.79 | 233.08 | 10.03 | 16.28 | 11.74 | 10.38 |
| -/- | 142.42 | 103.58 | 118.25 | 234.54 | 7.58 | 8.00 | 7.80 | 14.67 |
| p value | 0.49408 | 0.0007 | 0.00186 | 0.935695 | ||||
| I | ||||||||
| +/+ | 138.38 | 152.25 | 154.56 | 212.50 | 7.50 | 14.38 | 12.63 | 8.30 |
| -/- | 121.06 | 89.50 | 123.13 | 217.81 | 9.14 | 6.85 | 8.42 | 14.16 |
| p value | 0.15358 | 0.00045 | 0.04699 | 0.748454 | ||||
| C | ||||||||
| +/+ | 137.15 | 159.95 | 146.00 | 239.60 | 6.23 | 14.69 | 7.19 | 13.88 |
| -/- | 109.32 | 108.09 | 112.73 | 211.64 | 4.29 | 10.11 | 10.86 | 16.70 |
| p value | 0.00058 | 0.00525 | 0.01652 | 0.210201 | ||||
| E18.5 | ||||||||
| R | ||||||||
| +/+ | 81.29 | 141.55 | 210.58 | 347.48 | 2.80 | 10.17 | 10.56 | 27.12 |
| -/- | 88.39 | 107.15 | 210.58 | 283.21 | 14.84 | 6.72 | 12.84 | 15.13 |
| p value | 0.64959 | 0.00585 | 0.99977 | 0.039546 | ||||
| I | ||||||||
| +/+ | 77.48 | 148.57 | 203.17 | 263.39 | 3.59 | 16.33 | 14.47 | 15.88 |
| -/- | 63.19 | 105.78 | 180.93 | 238.30 | 3.07 | 12.03 | 10.66 | 11.51 |
| p value | 0.00379 | 0.03679 | 0.21358 | 0.198266 | ||||
| C | ||||||||
| +/+ | 66.82 | 132.37 | 230.50 | 280.61 | 2.01 | 10.16 | 13.07 | 11.79 |
| -/- | 62.95 | 104.05 | 160.03 | 238.76 | 2.04 | 8.66 | 10.08 | 12.06 |
| p value |
0.1807 |
0.03772 |
<0.0001 |
0.015392 |
|
|
|
|
The mean and SEM number of cells in the VZ, SVZ, IZ, and CP is shown at the R, I, and C levels. The Student's t test p values are also shown.
A secondary proliferative population first arises from the VZ at E13.5 and proliferates in a region next to the VZ called the SVZ. Interestingly, when the VZ and SVZ were analyzed independently, the SVZ was found to be significantly reduced at all ages, and rostrocaudal levels were examined (Table 2; Figs. 2I–N, 3). These data indicate that the SVZ is seeded with a reduced number of cells or that these cells fail to expand in tlx-deficient animals. In contrast, VZ PCs are decreased in cell number in the intermediate and caudal regions; rostral regions are not significantly different in mutant animals. The decrease in the depth of the adult cortex at all rostrocaudal levels is therefore attributable in part to the decreased number of PCs in the SVZ.
Figure 3.

The SVZ is decreased in size in tlx-deficient animals. Sections through the dorsal cerebral wall at E16.5 (rostral neocortex) and E18.5 (caudal neocortex) in wild-type and mutant animals showing the reduction in size of the SVZ are presented. Bars show the upper and lower limit of the VZ and the SVZ.
Consistent with a decreased number of PCs from E12.5, the number of cells in the IZ was also affected by the loss of tlx. The number of cells was significantly reduced in caudal regions from E14.5 until E18.5 compared with wild-type littermates (Table 2, Fig. 2F–N). The IZ consists of a mixed population of cells in transit, tangentially migrating interneurons that have their origin in the ventral telencephalon and cells born in the dorsal telencephalon migrating radially and tangentially. The decrease observed in this region is most likely a consequence of loss of both cell types because both dorsal and ventral PCs are reduced in number. These findings suggest that a decrease in the number of PCs leads to a decrease in the number of migrating cells.
Quantification of the number of postmitotic cells in the PP and CP also indicated that there are regional and temporal differences in their response to loss of the Tlx protein. At E12.5, both the rostral and caudal regions show a significant increase in the number of postmitotic cells in tlx–/– animals than in tlx+/+ animals, with a trend toward significance at intermediate levels (Table 2, Fig. 2C–E). At E14.5, the CP is significantly increased in the intermediate and caudal regions only (Table 2; Fig. 2G,H). In contrast, at E16.5, the number of cells in the CP is similar between wild-type and mutant animals. By E18.5, the number of postmitotic cells in the CP is significantly decreased in rostral and caudal regions (Table 2; Fig. 2L,N). The reciprocal changes in the number of mitotic (VZ, SVZ) versus postmitotic (CP) cell number are summarized in Figure 4. These findings suggest that early in development the output of tlx-deficient PCs is increased, leading to the production of more differentiated cells. At later stages, the decreased number of PCs in both the VZ and SVZ yields a reduction in the number of differentiating cells and a smaller CP by E18.5. This conclusion leads to the prediction that late developing structures would be more profoundly affected than structures produced early in neurogenesis. Indeed, this is exactly what is observed; not only are upper cortical layers more severely reduced in size than deep cortical layers, but other late developing structures such as the dentate gyrus are also reduced in size and cell number in adults (Monaghan et al., 1997; Land and Monaghan, 2003; K. Roy and A. P. Monaghan, unpublished observations).
Figure 4.

Summary of the changes in cell number in PC and CP over time in mutant (gray) and wild-type (black) embryos at rostral (A), intermediate (B), and caudal (C) levels. The y-axis represents cell number; the x-axis represents embryonic age. The number of VZ PCs (solid lines) decreases throughout development. C, This decrease in most apparent in caudal regions in mutant animals. In contrast, the SVZ (long dashed lines) is seeded with a reduced number of cells at all rostrocaudal levels. The number of cells in the CP increases with time. In mutant animals, the CP is initially larger, but at the end of gestation, the CP is reduced in size compared with control littermates. *p < 0.01; **p < 0.001; ***p < 0.0001.
Neurons differentiate prematurely in Tlx–/– animals
The increase in the number of cells in the PP and CP from E12.5 to E14.5 is intriguing given the decrease in the size of the PC domains. This raises the possibility that neurons are differentiating prematurely. To ensure that the cells in the PP and CP were not misplaced PCs, the expression of the VZ PC markers Nestin, Pax-6, Sall1, Sall3, and the SVZ marker SVET (subventricular tag) (Ott et al., 1996, 2001; Chapouton et al., 1999; Tarabykin et al., 2001; Anderson et al., 2002) was compared by in situ hybridization throughout the dorsal telencephalon from E10.0 until E16.5. No differences in the regional expression of the VZ or SVZ PC markers were observed between wild-type and mutant animals, indicating that the VZ and SVZ are molecularly distinct and confined to the ventricular surface (data not shown).
To verify that cells in the PP and CP were differentiating into neurons, the expression of a number of specific neuronal markers was examined in the dorsal telencephalon from E9.5 until birth. These included Cr, as a marker of a subpopulation of Cajal-Retzius cells, and two panneural markers, Tuj1 and Map2. Tuj1 is one of the earliest neuronal markers and is expressed just after the decision to leave the cell cycle is made (Lee et al., 1990; Ferreira and Caceres, 1992). Map2 is a marker of terminal neuronal differentiation (Huber and Matus, 1984). At E9.5, tlx–/– animals have more Tuj1 and Map2-positive cells in the telencephalon in every mutant embryo examined compared with age- and stage-matched littermates (Fig. 5A–F)(n = 6 per genotype). A discontinuous single-cell layer of Tuj1-positive cells was observed in the dorsal and lateral telencephalon of control embryos at E9.5. In contrast, tlx–/– embryos had a continuous layer of positive cells (Fig. 5A–D; arrows). In addition, more Tuj1-positive cells were found near the lumenal surface of the VZ in mutants, suggesting that they were migrating toward the pial surface (Fig. 5C,D; arrowheads). Similar increases in neuronal number were observed with Map2 expression (Fig. 5E,F). Cr was also expressed prematurely at E9.5, indicating that Cajal-Retzius cells differentiate early. Only one or two Cr-positive cells were detected in the entire dorsal forebrain of all wild-type animals examined (Fig. 5G). No Cr-positive cells were seen laterally, and few were observed in the ventral telencephalon of tlx+/+ animals. In contrast, Cr-positive cells lined almost the entire marginal zone in mutant embryos both dorsally and ventrally (Fig. 5I, arrows). We quantified the total number of Cr-positive cells in the dorsal and ventral telencephalon at E9.5 in three independent experiments, and a significant increase in Cr-positive cell number was observed in tlx-deficient animals compared with littermates (Fig. 5J). Premature neurogenesis is also observed in heterozygous animals, but the number of neurons produced is intermediate to that produced in wild-type and mutant animals (Fig. 5H). This is a transient phenotype and is not observed after E11.5. These findings indicate that there is a threshold requirement for the Tlx protein during early phases of neurogenesis.
Figure 5.

Neurons are born prematurely in tlx mutant animals. A–T, Coronal sections through the dorsolateral telencephalon oftlx+/+ andtlx–/– embryos at E9.5(A–I), E10.5(K–N), E12.5(O–R,U,V), and E14.5 (S,T) stained with DAPI (blueorgray) and antibodies (red: A, B, U, V; black: C–T) to a panneural marker, Tuj1 (A–D, M, N); a specific neuronal marker, Cr (G–I, Q, R); a postmitotic neuronal marker, Map2 (E, F, K, L, O, P, S, T); and RC2, a radial glial marker (U, V). Tlx mutant animals have more Tuj1-positive (B, D), Map2-positive (F, L, P, T), and Cr-positive (I, R) cells in the telencephalon from E9.5 to E14.5 compared with wild-type embryos (A–S). J, The percentage of Cr cells in the PP was calculated in wild-type (gray) and mutant (black) animals in both the dorsal and ventral telencephalon. *p < 0.05; **p < 0.01; n = 3. RC2 staining (S, T) indicates that radial glia cells are normal. Scale bars: A, B, 100 μm; C–T, 25 μm.
At E10.5, a layer several cells thick of Cr-, Tuj1-, and Map2-positive cells lined the entire VZ in wild-type animals, whereas this layer was doubled in size in tlx-deficient embryos (Fig. 5K–N). As observed at E9.5, the number of cells expressing Tuj1 in the VZ was increased in mutant animals compared with wild-type littermates (Fig. 5M,N; arrows). Similar results were observed at E12.5 [Map2 (Fig. 5O,P); Cr (Fig. 5Q,R)], however by E14.5, only caudal regions of the telencephalon have an increased number of labeled neurons in tlx-deficient animals (Fig. 5S,T). By E18.5, Tuj1 and Map2 expression are reduced in the absence of tlx, whereas Cr expression in layer I is similar between wild-type and mutant littermates. These findings indicate that in mutant animals PCs have increased neuronal output until mid-neurogenesis.
To exclude the possibility that some of the defects we have observed are attributable to an abnormal radial glia scaffold, we examined the expression of RC2, a radial glia marker, in the dorsal telencephalon throughout development (E9.5–E18.5). RC2-reactive cells and fibers appear morphologically normal, suggesting that radial glia fibers are functioning normally in the absence of tlx (E12.5) (Fig. 5U,V).
Caudal PCs cycle faster in early neurogenesis in tlx-deficient animals
Altered proliferation, in addition to precocious neurogenesis, may contribute to the cellular abnormalities observed in the developing CNS of tlx-deficient animals. To determine whether the early increase and later decrease in the size of the cortical wall are attributable to abnormalities in cell proliferation in the VZ and SVZ, timedpregnant dams received injections of a short pulse of BrdU to determine the proportion of cells in S phase during the labeling period (the LI) (Fig. 6). The cell cycle length naturally increases over time in wild-type animals from 10.2 hr at E12.5 to 18.4 hr at E16.5 (Miyama et al., 1997), primarily because of an increase in the length of G1 phase, whereas S phase remains relatively unchanged. As embryos age, the proportion of cells in S phase, and therefore the LI, decreases as the length of the cell cycle increases. Assuming the length of S phase is unaltered in mutant animals, the LI can be used as a rough indication of cell cycle length. To determine whether mutant animals exhibited a change in the LI over time that was significantly different from wild type, the labeling indices were compared in the VZ and SVZ at rostral, intermediate, and caudal levels in wild-type and mutant animals from E9.5 until E18.5 using a MANCOVA (see Materials and Methods). The change in the LI over time in tlx–/– and tlx+/+ animals was significantly different in caudal VZ PCs only (F(1,32) = 2.87; p = 0.05) (Table 3, Fig. 7A–D). These findings provide additional evidence that caudal PCs are more sensitive to loss of the Tlx protein than rostral or intermediate progenitors.
Figure 6.

Quantification of labeled and unlabeled cells. Sections through the dorsal cerebral wall at E14.5. Labeled (B) and unlabeled (A) sections illustrating the location of fluorescent BrdU-positive cells (A, red cells) after a 1 hr BrdU pulse. Sections are counterstained with DAPI (blue). Positive cells were labeled manually with a yellow dot, and negative cells are labeled with a pink dot.
Table 3.
The mean changes in the LI over time in wild-type and mutant animals
|
|
E9.5 VZ |
E12.5 VZ |
E14.5 VZ |
E16.5 VZ |
E18.5 VZ |
E16.5 SVZ |
E18.5 SVZ |
|---|---|---|---|---|---|---|---|
| Rostral | |||||||
| +/+ | 43.0 | 49.5 | 34.0 | 42.7 | 42.7 | 20.1 | 36.8 |
| SEM | 1.9 | 2.3 | 2.3 | 1.8 | 3.5 | 2.9 | 2.0 |
| -/- | 48.1 | 55.2 | 40.8 | 42.5 | 44.2 | 19.9 | 25.7 |
| SEM | 1.8 | 1.2 | 1.5 | 2.0 | 2.9 | 2.4 | 2.8 |
| p value | 0.98 | 0.001 | |||||
| Intermediate | |||||||
| +/+ | 43.2 | 39.2 | 49.0 | 39.2 | 20.8 | 31.1 | |
| SEM | 2.1 | 1.8 | 3.0 | 5.1 | 2.7 | 2.2 | |
| -/- | 47.1 | 44.1 | 42.2 | 40.3 | 17.9 | 26.0 | |
| SEM | 1.6 | 1.4 | 2.4 | 2.5 | 2.3 | 2.2 | |
| p value | 0.46 | 0.1 | |||||
| Caudal | |||||||
| +/+ | 52.8 | 42.8 | 38.1 | 44.6 | 46.8 | 18.2 | 30.5 |
| SEM | 1.3 | 1.5 | 1.5 | 2.2 | 3.1 | 2.0 | 1.4 |
| -/- | 55.5 | 49.3 | 45.2 | 42.3 | 38.2 | 15.9 | 24.1 |
| SEM | 1.2 | 1.2 | 1.9 | 2.3 | 2.3 | 1.8 | 1.8 |
| p value |
0.10 |
0.0015 |
0.0032 |
0.38862 |
0.0014 |
0.242 |
0.0043 |
There was a significant decrease in the LI of caudal PCs only. Two-sample t test values for the arsine square root transformed data are shown. The MANCOVA indicated that the change in the LI over time was significantly different between wild-type and mutant animals in the caudal regions only. Although the SVZ is seeded with fewer cells at E16.5, their cell cycle is not significantly different from normal. By E18.5, the LI in SVZ PCs is decreased.
Figure 7.

PCs cycle faster at early time points of neurogenesis and slower at later gestational time points in tlx-deficient animals. Comparisons of the change in the LI (percentage of BrdU incorporation; y-axis) over time (embryonic age; x-axis) in wild-type (black) versus mutant (gray) animals for rostral (A), intermediate (B), and caudal (C) levels. D, Regression analysis showing that the change in VZ PC proliferation over time in the caudal region of wild-type versus mutant animals is significantly different. The slope for the mutant is –1.84 and for the wild type is –0.08. In contrast, the SVZ (dashed lines) is significantly reduced at all rostrocaudal levels. p < 0.05; **p < 0.01; ***p < 0.001.
Comparing the labeling indices of caudal VZ PCs over time revealed that early and late VZ PCs differed in their response to loss of tlx. Early in neurogenesis, when the number of PCs in the VZ is similar between wild-type and mutant animals, the LI of tlx–/– VZ PCs is greater than in tlx+/+ animals (Table 3, Fig. 7). This is also apparent at E14.5, when the proportion of BrdU-labeled cells in tlx–/– VZ PCs is greater than wild type (∼120% of wild type) (Table 3). An increase in the LI will occur if the time spent in S phase (Ts) relative to the total cell cycle length (Tc) is increased or if Tc is shorter. To distinguish between these possibilities, we compared the pattern of BrdU staining in wild-type and mutant littermates at E12.5 and E14.5 after exposure to BrdU for increasing lengths of time (Fig. 8A–F). Furthermore, increasing numbers of labeled cells were observed in apical regions with increasing pulse times in both wild-type and mutant animals (Fig. 8C–F). At E12.5, dividing the VZ in half and comparing the percentage of BrdU-labeled cells in the apical and basal zones after a 1 hr pulse revealed that more BrdU-positive cells are found in the apical VZ of mutant animals caudally (tlx+/+, 16.51 ± 2.10; tlx–/–, 21.80 ± 1.95; p = 0.003). Visual inspection of BrdU labeling at E14.5 (Fig. 8E,F; star) also demonstrated that more BrdU-labeled cells are found in apical regions of the caudal VZ of mutant animals after a 2 hr pulse, suggesting that S phase is not longer but that cells are moving through the cell cycle faster. Many of these cells exhibited punctate staining, indicating that they left S phase during the labeling period.
Figure 8.
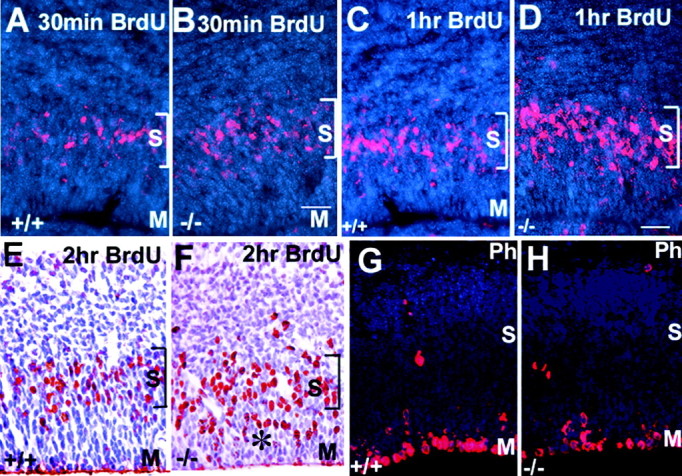
Cells move through the cell cycle faster in tlx–/– embryos. A–H, Coronal sections through the dorsolateral cortex of E14.5 tlx+/+ and tlx–/– embryos showing BrdU labeling in red and cellular histology (DAPI) in blue. A, B, A 30 min BrdU pulse shows that DNA synthesis is occurring in the synthetic zone only (bracketed; S). After a 1 hr (C, D) or 2 hr(E, F) pulse of BrdU, more cells are labeled in the apical half (asterisk) of the VZ in tlx–/– embryos indicating that they are moving toward the ventricular surface (M) faster are shown. The location of phosphohistone H3-positive cells is comparable in mutant (H) and control (G) littermates, indicating that interkinetic nuclear migration is normal. S, Location of S phase; M, location of M phase. Scale bar: A–H, 25 μm.
Alterations in interkinetic nuclear migration in the VZ could also contribute to the altered pattern of BrdU labeling observed in mutant animals. Phosphohistone H3 staining, which labels a fraction of cells in late G2-M phase (Zeitlin et al., 2001), was performed from E9.5 to E14.5. Phosphohistone H3 staining demonstrated that mitosis occurred solely at the lumenal surface in both wild-type and mutant animals, indicating that interkinetic nuclear migration is normal (E14.5) (Fig. 8G,H). Therefore, the presence of more BrdU-positive cells, their punctate staining pattern, and their location in the apical VZ of tlx–/– animals compared with tlx+/+ animals indicates that more cells have moved from S to G2 in the same labeling period. This finding is consistent with the hypothesis that the cell cycle is faster from E12.5 until E14.5 in caudal VZ PCs in tlx–/– animals compared with control littermates.
A faster cell cycle earlier is predicted to lead to either an increase in the number of cells exiting the cell cycle (Q fraction), an increase in the number of cells reentering the cell cycle (P fraction), or both, depending on the type of PC altered by loss of tlx. To determine whether the increases in the labeling indices observed in mutant animals until mid-neurogenesis lead to an increase in the number of cells exiting the cell cycle in mutant animals, we compared the number of cells exiting and reentering the cell cycle in a 24 hr period in rostral, intermediate, and caudal regions in wild-type and mutant animals. Pregnant mothers received injections of a single dose of BrdU at E13.5, and embryos were collected 24 hr later. Sections were double labeled with antibodies to BrdU and the neuronal marker Tuj1, and the number of labeled cells in each cortical region was quantified.
The LI of cells in mitotic (BrdU-positive cells/total cell population ratio) and postmitotic (BrdU/Tuj1 double-positive cells/total cell population ratio) regions was significantly increased in mutant animals compared with wild-type littermates at intermediate and caudal levels (mitotic: intermediate: tlx+/+, 44.0 ± 1.0%; tlx–/–, 54.0 ± 3.0%; p = 0.02; caudally: tlx+/+, 41.0 ± 2.0%; tlx–/–, 58.0 ± 3.0%; p = 0.00001; postmitotic: intermediate: tlx+/+, 44.0 ± 1.0%; tlx–/–, 52.0 ± 3.0%; p = 0.01; caudally: tlx+/+, 39.0 ± 2.0%; tlx–/–, 49.0 ± 1.0%; p = 0.007). This indicates that more cells are both reentering (P fraction) and exiting (Q fraction) the cell cycle in mutant animals and verifies the increase in proliferation observed with short-term BrdU pulses at E14.5 (Table 2). These results provide support for the hypothesis that the cell cycle is faster in mutant animals.
During neural development the Q fraction increases over time (from 0 to 1) as the P fraction decreases (Miyama et al., 1997; Takahashi and Osumi, 2002). At E14.5, the P/Q ratio is 0.5 in wild-type animals. In caudal regions of mutant animals at E14.5, the number of PCs is decreased, but the LI and the number of neurons is increased. To determine whether cells exiting the cell cycle do so at the expense of cells reentering the cell cycle, we calculated the P/Q ratio for a cohort of labeled cells in the E13.5–E14.5 period. At E14.5, rostral, intermediate, and caudal levels were compared. The P/Q fraction was similar in wild-type and mutant animals at all levels (Q fraction: rostral: tlx+/+, 0.623 ± 0.017; tlx–/–, 0.628 ± 0.023; p = 0.871; intermediate: tlx+/+, 0.549 ± 0.014; tlx–/–, 0.548 ± 0.032; p = 0.995; caudal: tlx+/+, 0.478 ± 0.022; tlx–/–, 0.48 ± 024; p = 0.937). These findings indicate that the same proportion of cells are exiting and reentering the cell cycle in mutant animals compared with wild type. The reduced number of PCs observed in mutant animals therefore is not attributable to a failure to expand the PC pool at this age.
Fewer PCs are cycling in late neurogenesis in tlx-deficient animals
At E16.5, the LI of PCs in the VZ in mutant animals is similar to that observed in wild-type embryos. Thereafter, the VZ LI continues to decrease in mutant animals to 67% of wild type in caudal regions (tlx+/+, 70.88 ± 2.47; tlx–/–, 47.81 ± 2.66; p = 1.6 × 10⁻⁸) at E18.5. These findings suggest that fewer cells are cycling or that they are cycling more slowly in tlx-deficient animals from mid-neurogenesis (Table 3; Figs. 7, 9).
Figure 9.

Summary of the changes in cellular dynamics in tlx-deficient animals as a percentage of wild-type animals in caudal regions. The percentage of change of mutant from wild-type values is shown. The gray bars represent the PC population, the white bars represent the postmitotic cell compartment, and the black line represents the changes in the LI (the average LI for the VZ and SVZ). *p < 0.05; **p < 0.01; ***p < 0.001.
At E16.5, the PC population consists of two distinct progenitor domains, the VZ and the SVZ. When analyzed separately, the SVZ and VZ show dramatic differences. The SVZ is reduced in cell number from its onset in tlx–/– animals (Figs. 2D, 3) at all levels, but the LI was similar in embryos of both genotypes at E16.5 (Table 3). This indicates that the SVZ is seeded with fewer cells initially but that their cell cycle is normal. However, by E18.5, the LI is drastically reduced at all rostrocaudal levels examined (Table 3), suggesting that similar to the VZ, either the cell cycle in mutant SVZ PCs is longer or that there are fewer dividing cells than in wild-type animals.
To distinguish between these possibilities, we ascertained the proportion of BrdU-labeled cells that exited the cell cycle and migrated to the IZ or CP in a 24 hr period. Pregnant mothers received injections of a single dose of BrdU at E16.5, and embryos were analyzed at E17.5. The number of BrdU-positive/Tuj1-positive cells in the IZ and CP was quantified and expressed as a percentage of the entire BrdU-labeled population. Significantly fewer labeled cells (17% less than wild type) were found outside the proliferative regions, on E17.5 (tlx+/+, 0.38 ± 0.012; tlx–/–, 0.31 ± 0.017; p = 0.0025). Furthermore, a dramatic decrease in the percentage of the late G2-M phase marker phosphohistone H3-positive cells was observed in tlx-deficient animals compared with wild-type littermates (caudal: VZ: tlx+/+, 15.7% vs tlx–/–, 11.2%; p = 0.03; SVZ: tlx+/+, 3.7% vs tlx–/–, 1.5; p = 0.002). The number of M phase cells was reduced by 30% in the VZ and by ∼60% in the SVZ of tlx-deficient animals, verifying that the SVZ is more severely altered in mutant animals. In the absence of an increase in cell death, these findings support the hypothesis that the cell cycle is longer in mutant animals after mid-neurogenesis.
Takahashi et al. (1995b) have previously shown that independent mechanisms regulate cell proliferation in the VZ and SVZ. Our findings support their observations and indicate that tlx regulates proliferation in both the VZ and SVZ. At the end of neurogenesis, PCs in both the VZ and SVZ exhibit a similar phenotype: a decrease in the number of cells and the rate of proliferation in the absence of tlx.
Figure 9 summarizes our observations regarding the changes in the cell population dynamics over time for caudal brain regions. From these static pictures, and by comparing the total cell number and labeling indices, our findings suggest that early in development, there is a more rapid cell cycle coupled with an enhanced cell cycle exit in caudal cortical PCs in tlx mutant animals (E9.5 until E14.5). After this time, the LI decreases as cellular output decreases, which is consistent with the hypothesis that the cell cycle lengthens in tlx-deficient animals. This suggests that the role of the tlx gene in PCs changes over time or that the tlx-deficient PCs themselves are responding to influences from the altered environment present in mutant animals. The lengthening of the cell cycle in caudal PCs of tlx–/– mice parallels and exceeds the normal increase in cell cycle time over gestation (Miyama et al., 1997), suggesting that tlx–/– cortical PCs are maturing earlier than tlx+/+ progenitors.
Superficial cortical laminas are prematurely specified
In the cerebral cortex, laminar cell fate determination and cell cycle progression are closely coordinated (Caviness et al., 2003). To determine whether an increase in the number of differentiating cells at early stages (E9.5–E14.5) alters the laminar fate of cells born during this period, we performed BrdU birthdating studies in wild-type and mutant littermates. Pregnant dams received injections of a single dose of BrdU at E13.5 and E14.5, and the laminar fate of BrdU-positive cells was examined on P30, after cortical lamination is complete. Two types of BrdU labeling were observed. Cells that were in their final mitosis the day of the injection exited the cell cycle and were densely labeled with BrdU. Cells that reentered the cell cycle, diluting the BrdU tag, exhibited lighter/punctate staining. For our studies, we focused on the densely labeled cells. In both wild-type and mutant animals, cells born on E13.5 were found in deep layers (layer V), whereas cells born on E14.5 were found more superficially (IV–III/II), indicating that the normal inside–out pattern of cortical lamination is not disrupted in mutant animals. Furthermore, examining the distributions of cells outside the VZ in the short-term BrdU and 24 hr labeling studies described previously suggests that the rate of migration of tlx-deficient cells is not different from wild type. Cells born on E13.5 in mutant animals were found in more superficial cortical layers (predominantly layers V–IV) when compared with controls (predominantly layer V) (Fig. 10A,B). In wild-type animals, cells born on E14.5 were predominantly localized in cortical layer IV, although BrdU-positive cells were also found in layers II/III (Fig. 10C,D). In contrast, in mutant animals, cells born on E14.5 were found throughout layers II/III and IV with a higher density of labeled cells in layers II/III (Fig. 10B). These findings support the hypothesis that a faster cell cycle early and premature neurogenesis leads to the premature formation of superficial layers.
Figure 10.

Superficial cortical layers are born prematurely. A–D, Coronal sections through the neocortex of P30 mice labeled with BrdU on E13.5 (A, B; red) and E14.5 (C, D; brown) and counterstained with DAPI (A, B). A, B, Asterisks indicate the position of the majority of cells born on E13.5 in wild-type animals (A) are located in deeper layers compared with mutant animals (B). Cells are located in more superficial regions in mutant animals in the retrosplenial cortex (white arrow). C, D, In the somatosensory cortex, the black arrows indicate the location of the majority of cells labeled on E14.5 in wild-type (C) versus mutant (D) animals. In wild-type animals, labeled cells are located primarily in layer IV, whereas in mutant embryos they are primarily found in layer II/III.
Discussion
To form a mature, functioning cerebral cortex, the sequential generation of neurons destined for specific layers must be precisely controlled. Absence of the forebrain-restricted transcription factor tlx leads to a reduction in the size and number of cells in superficial cortical layers in the adult (Land and Monaghan, 2003). In the present study, we provide evidence that tlx regulates proliferation and timing of neuronal differentiation in PCs in the embryo. Our studies lead to the hypothesis that tlx is required during embryonic development to regulate the timing of laminar fate specification.
In the dorsal telencephalon, PCs show temporal and regional differences in their response to loss of the Tlx protein. In early PCs (E9.5–E13.5), absence of the tlx gene product leads to precocious neuronal differentiation at all rostrocaudal levels and an enhanced rate of cell division that is most prominent in caudal regions. Rostral VZ PCs do not show changes in proliferation during development. Several lines of evidence support the idea that early tlx–/– PCs in caudal regions have a shorter cell cycle. First, in the same labeling period, more cells incorporate BrdU in the VZ. Second, the presence of BrdU-positive cells in more apical VZ regions in tlx–/– animals suggests that cells have moved from S phase into G2 and M phases more rapidly than in tlx+/+ animals in the same labeling period. Third, interkinetic nuclear migration is normal. Fourth, more cells exit and reenter the cell cycle in a 24 hr period in mutant animals compared with wild-type littermates. These studies also suggest that older tlx–/– PCs have a longer cell cycle. PCs in the caudal VZ and in the SVZ at all rostrocaudal levels exhibit a decreased rate of BrdU incorporation and had fewer mitotic cells. Furthermore, fewer labeled cells exit the cell cycle in a 24 hr period in mutant animals compared with wild-type littermates. These findings indicate that after mid-neurogenesis cells are cycling more slowly in mutant animals.
The decrease in PC number and rate of proliferation is most prominent in caudal regions. Given that there is a rostral to caudal gradient in tlx RNA expression, it would be predicted that the absence of the Tlx protein might have a greater impact on rostral PCs. Pax6 and Emx2 exhibit opposing rostral to caudal gradients of expression in the developing cortex, and loss of function leads to predictable shifts in cortical arealization (Bishop et al., 2002). One possible explanation for the observations in tlx–/– animals is that caudally expressed genes in the VZ are more sensitive to loss of Tlx. Another possibility is that in rostral regions, other factors controlling proliferation and differentiation may compensate for the loss of tlx. In light of the present observations, it would be interesting to examine markers that show graded expression in the developing cortex to determine whether area identity is altered. Interestingly, occipital regions show a slightly higher reduction in depth (22%) than frontal or parietal regions (20%) in adult animals (Land and Monaghan, 2003). The adult phenotype could be produced if the SVZ, which is reduced at all rostrocaudal levels in the absence of tlx, seeds the cortex to a greater extent than previously thought. Recent studies in the ventral telencephalon also demonstrate that tlx-deficient LGE PCs proliferate slower at mid-gestation (Stenman et al., 2003a). Reduced seeding of the SVZ by ventral PCs could also contribute the phenotype.
In light of the increased neuronal output in tlx-deficient animals during early neurogenesis when laminas I and VI–V are primarily specified, and in the absence of a global increase in cell death to compensate for the overproduction, it is surprising that the size of these laminas in adults is not altered in mutant animals (Roy et al., 2002). Two models of neuron layer specification can be envisioned. The first proposes that the cell cycle operates as an intrinsic timer and that distinct neurons are born after a defined number of divisions or when a specific duration of cycle is achieved. In the second model, extrinsic cues, such as the number of differentiated cells, feed back to regulate PC output. A combination of both of these theories most likely operates. Several studies have shown that cell cycle progression, neuronal output, and laminar specification are closely correlated (Takahashi et al., 1999; Caviness et al., 2003). Caviness et al. (2003) showed that by manipulating the levels of the cell cycle inhibitor P27, they could increase or decrease the proportion of differentiating cells (Q fraction) and scale the number of neurons in deep versus superficial cortical layers downward or upward, respectively. Decreasing Q fraction led to a reduction in the size of the cerebral wall and an increase in the size of superficial layers. Elevating Q fraction led to a reduction in the size of superficial layers without an obvious change in deep layers, a phenotype mimicked by the tlx deficiency. It is intriguing that the size of deep layers is unchanged by either manipulating the level of P27 or knocking out the tlx gene. In these three models, it is the superficial layers that respond by increasing or decreasing their cell number. This indicates that overproduction of neurons earlier does not necessarily translate into an over-commitment to a deep cortical layer fate. Together, these findings lead to the hypothesis that superficial layers are generated only after a defined number of neurons are committed to deep layers, suggesting that deep layers produce factors that feed back to progenitors to influence cell fate choice. Furthermore, we found that superficial cortical laminas are born prematurely in tlx-deficient animals. In light of the observation that the cell cycle prematurely lengthens in mutant PCs, these findings suggest that superficial cortical layers are generated once the cell cycle reaches a critical permissive length.
The primary cellular processes targeted by loss of tlx are difficult to resolve. Tlx could be required in early PCs to regulate proliferative divisions and therefore prevent neurogenesis under normal conditions. In mutant animals, precocious neurogenesis may lead to tlx–/– PCs dividing more rapidly to replenish the depleting PC pool. In support of this hypothesis, tlx has been shown to be required for the maintenance of an undifferentiated, multipotent state in adult stem cells (Shi et al., 2004). Adding tlx back to tlx-deficient adult PCs resulted in the restoration of the dividing stem cell state. This suggests a role in proliferation, at least in adults (Shi et al., 2004). It will be interesting to determine whether tlx-deficient PCs divide the same number of times as wild-type littermates before they differentiate during embryogenesis. Tlx could also act by regulating the types of divisions that PCs make. Early PCs expand by symmetric divisions establishing the surface area and number of radial units in the cortex (Rakic, 1988). Subsequently, there is a steady increase in the number of differentiative asymmetric divisions, establishing the number of neurons per radial unit and the depth of the cerebral cortex. Therefore, the length of the cell cycle and the duration of each phase of division are critical in controlling the size of the cerebral cortex (Rakic, 1995a,b; Takahashi et al., 1996; Caviness et al., 2003). Our findings indicate that at least a subset of PCs in tlx-deficient animals must go through fewer cell cycles than their wild-type littermates, perhaps by prematurely switching to differentiative divisions.
Other proteins have been shown to directly regulate proliferation/differentiation of PCs and the timing of neurogenesis (Caric et al., 1997; Warren et al., 1999; Fukuda et al., 2000). However, the molecular mechanisms regulating cell fate specification have yet to be identified. Recently, it has been demonstrated that the winged helix protein Foxg1 must be activated in cortical PCs to permit a deep layer fate and suppress an early cell fate, the Cajal-Retzius cell (Hanashima et al., 2004). Mutations in Foxg1 also lead to a reduction in the size of the cerebral hemispheres. In mice lacking the paired box homeobox-containing protein Pax6 (sey/sey animals), proliferation is increased early in neurogenesis, Cr-positive neurons differentiate prematurely, and, at later gestational time points, the cell cycle lengthens and the CP thins. A phenotype that is similar to tlx deficiency, Pax6 has an additional phenotype; later born neurons accumulate in the SVZ because of a non-cell autonomous defect in migration. Recent studies have shown that tlx and Pax6 work cooperatively to form the corticostriatal boundary (Stenman et al., 2003b). Early in development, then, Pax6 and tlx may target the same cell types, but at later gestational time points, these genes seem to operate independently.
Whether tlx functions in stem cells or lineage-restricted PCs during development has yet to be determined, but it is clear that tlx works in parallel with other pathways to control the decision to continue proliferating or to differentiate into a neuron. Our studies have shown that an early disruption in PC proliferation/differentiation has long-lasting consequences on the formation of later generated structures and that cell cycle lengthening is one mechanism leading to the determination of cell fate specification in the cerebral cortex.
Footnotes
This work was supported by National Institute of Mental Health Grant 5RO1MH060774-03, the March of Dimes, Basil O'Connor Grant S-FY98-756, and the Scottish Rite Schizophrenia Research Program. We thank Drs. Peter Land, Pat Levitt, David Lewis, and Laura Lillien as well as Cynthia Lance-Jones for helpful comments and criticisms of this manuscript. We thank Kirsten Mauro for excellent technical assistance and Nicholas Roy for creating the cell counting program. We are also grateful to Dr. Allan R. Sampson for help with statistical analyses.
Correspondence should be addressed to Dr. A. Paula Monaghan, W1455 West Biomedical Science Tower, 3500 Terrace Street, Pittsburgh, PA 15261. E-mail: monaghan@pitt.edu.
DOI:10.1523/JNEUROSCI.1148-04.2004
Copyright © 2004 Society for Neuroscience 0270-6474/04/248333-13$15.00/0
References
- Anderson T, Hedlund E, Carpenter E (2002) Differential Pax6 promoter activity and transcript expression during forebrain development. Mech Dev 114: 171–175. [DOI] [PubMed] [Google Scholar]
- Angevine J, Sidman R (1961) Autoradiographic study of cell migration during histogenesis of cerebral cortex in the mouse. Nature 192: 766–768. [DOI] [PubMed] [Google Scholar]
- Bayer S, Altman J (1991) Neocortical development. New York: Raven.
- Bishop KM, Rubenstein JL, O'Leary DD (2002) Distinct actions of Emx1, Emx2, and Pax6 in regulating the specification of areas in the developing neocortex. J Neurosci 22: 7627–7638. [DOI] [PMC free article] [PubMed] [Google Scholar]
- Cai L, Hayes N, Nowakowski R (1997a) Local homogeneity of cell cycle length in developing mouse cortex. J Neurosci 17: 2079–2087. [DOI] [PMC free article] [PubMed] [Google Scholar]
- Cai L, Hayes N, Nowakowski R (1997b) Synchrony of clonal cell proliferation and contiguity of clonally related cells: production of mosaicism in the ventricular zone of developing mouse neocortex. J Neurosci 17: 2088–2100. [DOI] [PMC free article] [PubMed] [Google Scholar]
- Caric D, Gooday D, Hill R, McConnell S, Price D (1997) Determination of the migratory capacity of embryonic cortical cells lacking the transcription factor Pax6. Development 124: 5087–5096. [DOI] [PubMed] [Google Scholar]
- Casarosa S, Fode C, Guillemot F (1999) Mash1 regulates neurogenesis in the ventral telencephalon. Development 126: 525–534. [DOI] [PubMed] [Google Scholar]
- Caviness Jr VS, Takahashi T (1995) Proliferative events in the cerebral ventricular zone. Brain Dev 17: 159–163. [DOI] [PubMed] [Google Scholar]
- Caviness Jr VS, Goto T, Tarui T, Takahashi T, Bhide PG, Nowakowski RS (2003) Cell output, cell cycle duration and neuronal specification: a model of integrated mechanisms of the neocortical proliferative process. Cereb Cortex 13: 592–598. [DOI] [PubMed] [Google Scholar]
- Chapouton P, Gartner A, Gotz M (1999) The role of Pax6 in restricting cell migration between developing cortex and basal ganglia. Development 126: 5569–5579. [DOI] [PubMed] [Google Scholar]
- Chenn A, Walsh CA (2002) Regulation of cerebral cortical size by control of cell cycle exit in neural precursors. Science 297: 365–369. [DOI] [PubMed] [Google Scholar]
- Chenn A, Walsh CA (2003) Increased neuronal production, enlarged forebrains and cytoarchitectural distortions in beta-catenin overexpressing transgenic mice. Cereb Cortex 13: 599–606. [DOI] [PubMed] [Google Scholar]
- Desai A, McConnell S (2000) Progressive restriction in fate potential by neural progenitors during cerebral cortical development. Development 127: 2863–2872. [DOI] [PubMed] [Google Scholar]
- Ferreira A, Caceres A (1992) Expression of the class III β-tubulin isotype in the developing neurons in culture. J Neurosci Res 32: 516–529. [DOI] [PubMed] [Google Scholar]
- Fukuda T, Kawano H, Osumi N, Eto K, Kawamura K (2000) Histogenesis of the cerebral cortex in rat fetuses with a mutation in the Pax-6 gene. Dev Brain Res 120: 65–75. [DOI] [PubMed] [Google Scholar]
- Hanashima C, Li SC, Shen L, Lai E, Fishell G (2004) Foxg1 suppresses early cortical cell fate. Science 303: 56–59. [DOI] [PubMed] [Google Scholar]
- Huber G, Matus A (1984) Differences in the cellular distributions of two microtubule-associated proteins, MAP1 and MAP2, in rat brain. J Neurosci 4: 151–160. [DOI] [PMC free article] [PubMed] [Google Scholar]
- Ishibashi M, Sasai Y, Nakanishi S, Kageyama R (1994) Persistent expression of helix-loop-helix factor HES-1 prevents mammalian neural differentiation in the central nervous system. EMBO J 13: 1799–1805. [DOI] [PMC free article] [PubMed] [Google Scholar]
- Ishibashi M, Ang S, Shiota K, Nakanishi S, Kageyama R, Guillemot F (1995) Targeted disruption of mammalian hairy and Enhancer of split homolog-1 (HES-1) leads to up-regulation of neural helix-loop-helix factors, premature neurogenesis, and severe neural tube defects. Genes Dev 9: 3136–3148. [DOI] [PubMed] [Google Scholar]
- Kornack D, Rakic P (1998) Changes in cell-cycle kinetics during the development and evolution of primate neocortex. Proc Natl Acad Sci USA 95: 1242–1246. [DOI] [PMC free article] [PubMed] [Google Scholar]
- Land PW, Monaghan AP (2003) Expression of the transcription factor, tailless, is required for formation of superficial cortical layers. Cereb Cortex 13: 921–931. [DOI] [PMC free article] [PubMed] [Google Scholar]
- Lee M, Tuttle J, Rebhun L, Cleveland D, Frankfurter A (1990) The expression and posttranslational modification of a neuron specific β-tubulin isotype during chick embryogenesis. Cell Motil Cytoskeleton 17: 118–132. [DOI] [PubMed] [Google Scholar]
- Littell R, Milliken G, Stroup W, Wolfsinger R (1996) SAS system for mixed models. Cary, NC: SAS Institute.
- Luskin MB, Pearlman AL, Sanes JR (1988) Cell lineage in the cerebral cortex of the mouse studied in vivo and in vitro with a recombinant retrovirus. Neuron 1: 635–647. [DOI] [PubMed] [Google Scholar]
- McConnell S (1995) Constructing the cerebral cortex: neurogenesis and fate determination. Neuron 15: 761–768. [DOI] [PubMed] [Google Scholar]
- McConnell S, Kaznowski C (1991) Cell cycle dependence of laminar determination in developing neocortex. Science 254: 282–285. [DOI] [PubMed] [Google Scholar]
- Miyama S, Takahashi T, Nowakowski R, Caviness VJ (1997) A gradient in the duration of the G1 phase in the murine neocortical proliferative epithelium. Cereb Cortex 7: 678–689. [DOI] [PubMed] [Google Scholar]
- Monaghan A, Grau E, Bock D, Schutz G (1995) The mouse homolog of the orphan nuclear receptor tailless is expressed in the developing forebrain. Development 121: 839–853. [DOI] [PubMed] [Google Scholar]
- Monaghan A, Bock D, Gass P, Schwager A, Wolfer D, Lipp H, Schutz G (1997) Defective limbic system in mice lacking the tailless gene. Nature 390: 357–362. [DOI] [PubMed] [Google Scholar]
- Noctor SC, Martinez-Cerdeno V, Ivic L, Kriegstein AR (2004) Cortical neurons arise in symmetric and asymmetric division zones and migrate through specific phases. Nat Neurosci 7: 136–144. [DOI] [PubMed] [Google Scholar]
- Ohtsuka T, Ishibashi M, Gradwohl G, Nakanishi S, Guillemot F, Kageyama R (1999) Hes1 and Hes5 as notch effectors in mammalian neuronal differentiation. EMBO J 18: 2196–2207. [DOI] [PMC free article] [PubMed] [Google Scholar]
- Ohtsuka T, Sakamoto M, Guillemot F, Kageyama R (2001) Roles of the basic helix-loop-helix genes Hes1 and Hes5 in expansion of neural stem cells of the developing brain. J Biol Chem 276: 30467–30474. [DOI] [PubMed] [Google Scholar]
- Ott T, Kaestner KH, Monaghan AP, Schutz G (1996) The mouse homolog of the region specific homeotic gene spalt of Drosophila is expressed in the developing nervous system and in mesoderm-derived structures. Mech Dev 56: 117–128. [DOI] [PubMed] [Google Scholar]
- Ott T, Parrish M, Bond K, Schwaeger-Nickolenko A, Monaghan A (2001) A new member of the spalt-like zinc finger protein family, Msal3, is expressed in the CNS and sites of epithelial/mesenchymal interaction. Mech Dev 101: 203–207. [DOI] [PubMed] [Google Scholar]
- Rakic P (1974) Neurons in rhesus monkey visual cortex: systematic relation between time and origin and eventual disposition. Science 183: 425–427. [DOI] [PubMed] [Google Scholar]
- Rakic P (1988) Specification of cerebral cortical areas. Science 241: 170–176. [DOI] [PubMed] [Google Scholar]
- Rakic P (1995a) Radial versus tangential migration of neuronal clones in the developing cerebral cortex. Proc Natl Acad Sci USA 92: 11323–11327. [DOI] [PMC free article] [PubMed] [Google Scholar]
- Rakic P (1995b) A small step for the cell, a giant leap for mankind: a hypothesis of neocortical expansion during evolution. Trends Neurosci 18: 383–388. [DOI] [PubMed] [Google Scholar]
- Roy K, Thiels E, Monaghan AP (2002) Loss of the tailless gene affects forebrain development and emotional behavior. Physiol Behav 77: 595–600. [DOI] [PMC free article] [PubMed] [Google Scholar]
- Shi Y, Chichung Lie D, Taupin P, Nakashima K, Ray J, Yu RT, Gage FH, Evans RM (2004) Expression and function of orphan nuclear receptor TLX in adult neural stem cells. Nature 427: 78–83. [DOI] [PubMed] [Google Scholar]
- Snedecor G, Cochran W (1980) Statistical methods, Ed 7. Ames, IA: Iowa UP.
- Stenman J, Toresson H, Campbell K (2003a) Identification of two distinct progenitor populations in the lateral ganglionic eminence: implications for striatal and olfactory bulb neurogenesis. J Neurosci 23: 167–174. [DOI] [PMC free article] [PubMed] [Google Scholar]
- Stenman J, Yu RT, Evans RM, Campbell K (2003b) Tlx and Pax6 co-operate genetically to establish the pallio-subpallial boundary in the embryonic mouse telencephalon. Development 130: 1113–1122. [DOI] [PubMed] [Google Scholar]
- Sun Y, Nadal-Vicens M, Misono S, Lin M, Zubiaga A, Hua X, Fan G, Greenberg ME (2001) Neurogenin promotes neurogenesis and inhibits glial differentiation by independent mechanisms. Cell 104: 365–376. [DOI] [PubMed] [Google Scholar]
- Super H, Uylings HB (2001) The early differentiation of the neocortex: a hypothesis on neocortical evolution. Cereb Cortex 11: 1101–1109. [DOI] [PubMed] [Google Scholar]
- Takahashi M, Osumi N (2002) Pax6 regulates specification of ventral neurone subtypes in the hindbrain by establishing progenitor domains. Development 129: 1327–1338. [DOI] [PubMed] [Google Scholar]
- Takahashi T, Nowakowski RS, Caviness Jr VS (1993) Cell cycle parameters and patterns of nuclear movement in the neocortical proliferative zone of the fetal mouse. J Neurosci 13: 820–833. [DOI] [PMC free article] [PubMed] [Google Scholar]
- Takahashi T, Nowakowski R, Caviness VJ (1994) Mode of cell proliferation in the developing mouse neocortex. Proc Natl Acad Sci USA 91: 375–379. [DOI] [PMC free article] [PubMed] [Google Scholar]
- Takahashi T, Nowakowski R, Caviness VJ (1995a) The cell cycle of the pseudostratified ventricular epithelium of the embryonic murine cerebral wall. J Neurosci 15: 6046–6057. [DOI] [PMC free article] [PubMed] [Google Scholar]
- Takahashi T, Nowakowski R, Caviness VJ (1995b) Early ontogeny of the secondary proliferative population of the embryonic murine cerebral wall. J Neurosci 15: 6058–6068. [DOI] [PMC free article] [PubMed] [Google Scholar]
- Takahashi T, Nowakowski R, Caviness VJ (1996) The leaving or Q fraction of the murine cerebral proliferative epithelium: a general model of neocortical neurogenesis. J Neurosci 16: 6183–6195. [DOI] [PMC free article] [PubMed] [Google Scholar]
- Takahashi T, Goto T, Miyama S, Nowakowski R, Caviness VJ (1999) Sequence of neuron origin and neocortical laminar fate: relation to cell cycle of origin in the developing murine cerebral wall. J Neurosci 19: 10357–10371. [DOI] [PMC free article] [PubMed] [Google Scholar]
- Tarabykin V, Stoykova A, Usman N, Gruss P (2001) Cortical upper layer neurons derive from the subventricular zone as indicated by Svet1 gene expression. Development 128: 1983–1993. [DOI] [PubMed] [Google Scholar]
- Walsh C, Cepko CL (1988) Clonally related cortical cells show several migration patterns. Science 241: 1342–1345. [DOI] [PubMed] [Google Scholar]
- Warren N, Caric D, Pratt T, Clausen J, Asavaritikrai P, Mason J, Hill R, Price D (1999) The transcription factor, Pax6, is required for cell proliferation and differentiation in the developing cerebral cortex. Cereb Cortex 9: 627–635. [DOI] [PubMed] [Google Scholar]
- Wilkinson DG (1995) RNA detection using non-radioactive in situ hybridization. Curr Opin Biotechnol 6: 20–23. [DOI] [PubMed] [Google Scholar]
- Zeitlin S, Barber C, Allis C, Sullivan K (2001) Differential regulation of CENP-A and histone H3 phosphorylation in G2/M. J Cell Sci 114: 631–661. [DOI] [PubMed] [Google Scholar]